Review

Evaluations on Ceramic Fracture Toughness Measurement by Edge Chipping

1
Faculty of Engineering, Huanghe Science and Technology University, Zhengzhou 450003, China
2
School of Mechanical and Electrical Engineering, Henan University of Technology, Zhengzhou 450001, China
3
College of Mechanical Engineering, Zhejiang University of Technology, Hangzhou 310023, China
*
Author to whom correspondence should be addressed.
Coatings 2022, 12(8), 1146; https://doi.org/10.3390/coatings12081146
Submission received: 8 July 2022 / Revised: 4 August 2022 / Accepted: 6 August 2022 / Published: 9 August 2022
(This article belongs to the Section Ceramic Coatings and Engineering Technology)

Abstract

:
Advanced ceramics, such as alumina and zirconia, are widely used in modern industries, due to their superior properties, such as high hardness and strength. Fracture toughness is a significant property that describes the capability of materials to resist crack instability and expansion to failure, and also helps when calculating the allowable working stress, and crack size, of the component. This paper comprehensively lists the current toughness-testing methods. With comparative investigations of various methods, edge chipping is found to be the simplest way of measuring the ceramic fracture-toughness, in terms of the dominant median crack, chip geometrical similarity, and force-distance relations, giving consideration to its potential application in industry. Moreover, to avoid the data variance from crack-length measurement in edge chipping, it is further proposed that the energy analyses can be used to improve the way in which the toughness expression is formulated.

1. Introduction

Advanced ceramics are promising materials for engineering applications, due to their superior hardness, high strength, high temperature and super erosion resistance, etc. [1]. However, their high brittleness induces a relatively low fracture toughness, restricting their industrial applications. Fracture toughness (Kc), described as the fracture resistance of materials [2], is of key importance in designing ceramic structures and evaluating their reliabilities [3]. Hence, the ability to accurately assess the fracture toughness of ceramics becomes a necessity.
The commonly used ceramic fracture-toughness testing methods can be classified into three main streams: the pre-notched beam, pre-cracked beam and indentation. The dominant pre-notched beam methods, including chevron notched beam (CNB) [4,5,6], single-edge notched beam (SENB) [7], and single edge V-notched beam (SEVNB) [8,9], are convenient ways in which to prepare the specimen by simply cutting a straight notch, as shown in Figure 1a–c. During loading, the pre-set crack initiates from the stress intensity point, at the notch end, and then propagates to a certain length. The preferable utilization of the CNB method is determined by the high cost of the precise fixture, the proper fabrication of the notches, and their time-consuming cutting process [10]. The SENB method requires the specimen to be pre-notched with a well-prepared sharp notch, although it is widely utilized in measuring fracture toughness [11]. The SEVNB method requires the sample to be pre-notched with a v-shaped notch, which is often fabricated using a razor blade sprinkled with diamond paste, although the special equipment is not necessary [12]. However, fabricating an ultra-sharp V-notch is time consuming, and it is infeasible to create two identical radii on both sides of the V-notch tip [13,14]. The pre-cracked beam method is the single-edge pre-cracked beam (SEPB) [15,16,17]. An initial crack is prepared on the loaded surface of the specimen and, with loading, the crack propagate to a certain length. The similarity between the pre-fabricated and the natural-formed cracks leads to high accuracy in the SEPB method. However, accurately pre-fabricating a certain crack length is an inconvenience in SEPB applications. The SEPB method overcomes the drawback of SENB, but reliable introduction of a pre-crack into the ceramic sample is difficult and the crack depth is uncontrollable [11,14].
Indentation prevails in fracture measurements, in terms of its convenience, i.e., Vickers indentation [18]. During loading, the indenter penetrates the ceramic surface to form an impression, until cracks appear. Toughness can be calculated from dimensions of impression and cracks, as shown in Figure 1d. Evans and Charles [19] built up an empirical relationship between the crack length and impression size to formulate the fracture toughness, with a further simplified formula by Marshall and Evans [20]. Then, the residual-stress damage zone was investigated, resulting in the famous expanding-cavity model [21]. Based on the expanding-cavity model, Marshall [22] derived a Vicker’s indentation model, leading to the fracture-toughness calculations. However, the accuracy of the toughness calculation is still in doubt. Quinn [23] pointed out that the Vicker’s indentation crack-length method has large error variance and a universal formulation could not be derived in terms of test results, because of their uncertainties, such as: the different materials’ deformation; different crack-length measurements; various indentation-crack shapes; susceptibility of residual stress underneath the material surface; and the dependency between indentation force and calculated formula [24]. Ma [25] further stated that the defects were majorly induced by the overestimation of residual impression in such models, which relates to the calculation of the stress intensity factor (KI). Hence, an accurate and universal method for determining fracture toughness is still not available. Moreover, the random data scattering of various methods results in the non-uniformity of common toughness-testing methods [26].
In recent years, edge-chipping measurement of ceramics has been widely investigated, using an indenter to penetrate the material surface near the free edge until a chip falls out [27,28,29]. Due to its simplicity and practicability [29,30], edge chipping is regarded as a promising method for measuring ceramic fracture toughness [31,32]. Hence, in this research, we attempt to discuss the recent research findings on the edge-chipping based fracture-toughness measurement of ceramics, compare the results from edge chipping and other testing methods, and undertake further exploration into toughness expression.

2. Methodologies

The basic principle of edge chipping reveals the chip formation, induced by a series of radial/median cracks, during indentation [30,33]. During chipping, the crack initiates, rapidly propagates and deviates to the free surface, after the external load reaches a certain point, with a well-formed chip peeled from the specimen. A schematic view of edge chipping is shown in Figure 2a. h is the distance between the indenting point and the free surface. F denotes the external force applied to the indenter. L and W represent the length and width of the conchoidal chip, respectively. d is the penetration depth, related to the increased force F , as shown in Figure 2b. The crack initiates and propagates, with the increment of F . When F reaches a peak value, a catastrophic fracture happens, with a chip formed, ultimately. Due to the ease of operation, therefore, an edge-chipping test can be regarded as a convenient way of exploring the material mechanism. Due to the directness, research is majorly concentrated on the acquisition of crack-evolution-, and force-distance data.

3. Results and Discussion

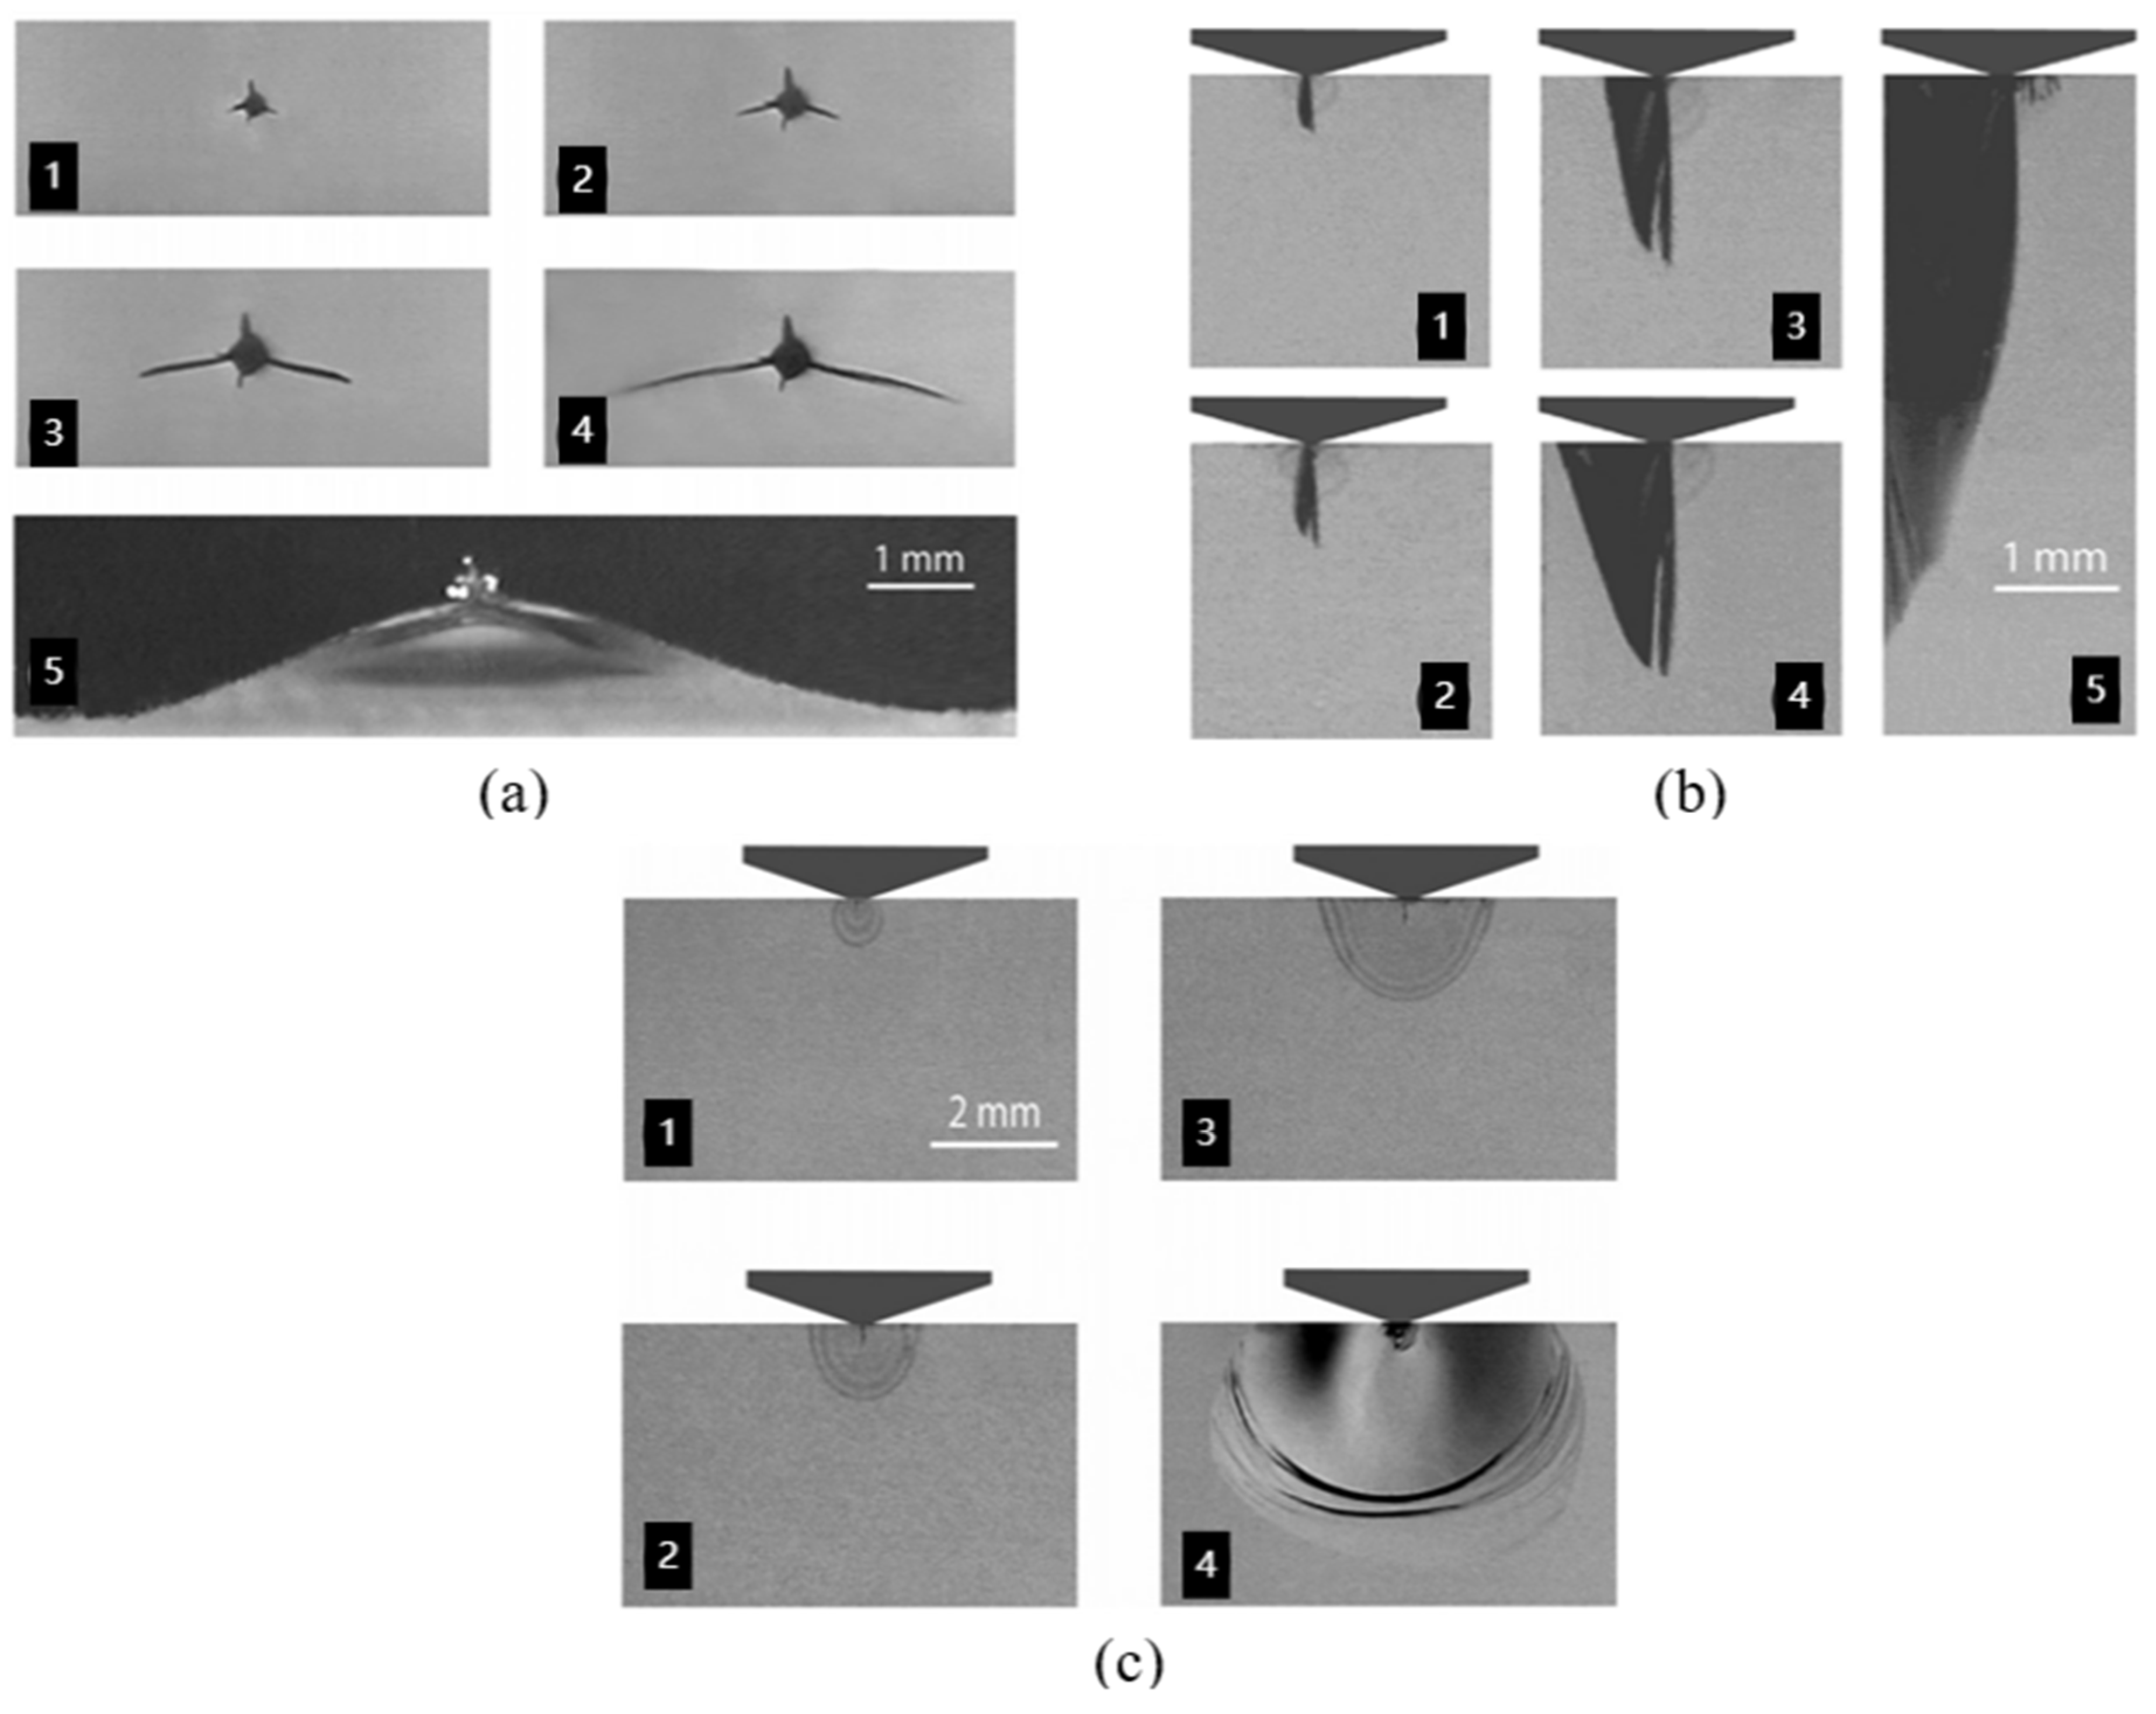
3.1. Crack Mechanism and Chip Morphology

In terms of the similarity between edge chipping and indentation [30], exploring the chipping mechanism with common indenters, such as Vicker’s and Rockwell, highlights several investigations: Morrell [34] built up a two-dimensional analytical model, to investigate the edge fracture using a Rockwell indenter. Results showed that the major crack induced by the maximum hoop stress, around the indentation trace, occurs at two symmetrical points near the free surface and linearly extends to the free side on the top surface. Chai and Lawn [30] used a Vicker’s indenter to conduct edge-chipping tests on soda-lime glass and ceramics. They pointed out that cracks initiate along the two vertices of the pyramid and propagate until failure, with a chip formed, ultimately, as shown in Figure 3a,b. The half-penny shaped median crack is the predominant pattern throughout the whole chipping process, as shown in Figure 3c, and before the crack becomes unstable, the crack approximately extends in a plane, involving the force axis. Results in other tests on glass [31,32,35,36,37,38] further confirm such phenomena. The above findings demonstrate that the pointed indenter-induced, half-penny shaped, median crack dominates the chipping process. The shaded volume in Figure 1a shows a conchoidal-shaped chip, formed after failure. The chipping method used to fabricate stone tools originated from the Stone Age [39,40,41], and later on, Almond [42] first discovered the constitutive linear relationships between L-h and W-h, paving the way for successive applications of chip geometrical similarity in glass and ceramics investigations [30,43,44,45,46]. The chip geometrical similarity may build up a connection between the indentation force and material’s crack morphology, which facilitates the measurement of material fracture toughness.

3.2. Peak Chipping Force

The external force induces the mechanical behaviors of materials, corresponding to the crack morphology, during chipping. Therefore, the indenting force can be utilized to investigate the internal crack mechanism in terms of the crack features. The straightforward relationship between peak chipping force and indenting distance has been set up by applying the cantilever beam model with a pre-crack at the end point of the indenting distance [39,44,45]. Cotterell [39] built up a force-distance relation using a transited point load and bending moment, considering modes I and II stress intensity factors. He also pointed out that the chipping force mainly depends on the stiffness of the material. Thouless [44] revealed that crack initiation and evolution are mainly caused by the predicted chipping force from the crack location, crack propagation, and onset of chipping, by conducting experiments on glass and PMMA. Chiu [45], numerically, built force models considering the nonlinear effect generated from a moment during the chip bending, which provided guidance to the theoretical investigation of edge-chipping problems. However, prescribing cracks from above models proved defective, as the stress field underneath the indenter (without a prescribed crack) is dramatically different from the one that cracks. Therefore, further experiments were strictly conducted under real edge chipping conditions, applying a continuous point force on the intact material surface, near a free edge, until a chip formed.
Danzer [47] and Gogotsi [48,49,50,51,52] demonstrated the material independence of chip geometrical similarity by conducting a series of edge-chipping experiments on various kinds of brittle solids, such as ceramics, glass, flint, and quasi-brittle metals. However, they also stated that the chipping force possesses a strong material dependency, indicating a constant quotient between peak chipping force ( F p ) and indenting distance ( h )—which is defined as the edge toughness (ET) of the material—to evaluate the resistance of an edge to damage. Later, Gogotsi [32,53,54,55] found that ET is linearly correlated to the fracture toughness K c , an important material property for evaluating fracture resistance. Subsequently, from Quinn’s tests on ceramics [56], the F p h relation was found to be non-linear, with an average exponent of 1.3 fitting all experimental data and curves passing the original point. Hence, in order to explore the inherent correlation between: peak force; indenting distance; fracture toughness; and even edge toughness; analytical investigation on fine-grained brittle solids becomes a necessity.

3.3. Analytical Derivations of Fracture Toughness in Edge Chipping

As discussed above, the internal chipping features reflect the dominance of median crack and force-distance relations. Thus, in fracture mechanics [57], the mode I stress intensity factor is equivalent to fracture toughness K c at crack equilibrium. Based on the Griffith energy-balance principle [58], Atkinson [59] and Swain [60,61] built up the relationship between crack size and force, in indentation of a brittle solid. The derivation was based on the calculation of the total external mechanical energy and fracture surface energy, considering the characteristic crack dimension c , (as shown in Figure 4, where d c represents the value change in crack length c ), and the strain energy density. This can be represented by the equation:
F 2 / c 3 = c o n s t . ( γ ,   E )
where γ is the fracture surface energy of the material and E is Young’s modulus.
Lawn [62] utilized the dimensional analysis to rewrite Equation (1) in full, giving consideration to K c , given that the crack is at stable propagation with the increment of F :
K c = χ F / c 1.5
where χ is a dimensionless constant relevant to the indenter geometry. In terms of Lawn’s research of the configuration of median crack under sharp indentation on soda-lime glass, and ceramics (e.g., Rockwell, Vicker’s and Knoop indentations) [62], Chai and Lawn [30] utilized a crosshead Instron testing machine (Instron 4501, Instron Corp., Canton, MA, USA) to conduct experiments on soda-lime glass (transparent model), alumina (InCeram, Vita Zahnfabrik, Bad Sackingen, Germany), porcelain (Vita Mark II, Vita Zahnfabrik, Bad Sackingen, Germany) and Y-TZP zirconia (Lava Frame, 3M ESPE, Morrow, GA, USA), to demonstrate the validity of Equation (2). Specifically, the soda-lime glass, with a minimum dimension of 15 mm, was applied to observe the crack evolution, while the other three fine-grained ceramics, with a minimum dimension of 5 mm, were used for validation. Based on the crack-length values measured in the soda-lime glass, they further extended the relationship between the peak chipping force F p and crack dimension c into F p and indenting distance h , by normalizing c 1.5 with h 1.5 and introducing a dimensionless function f , which was used to describe the crack evolutions.
F p = β K c h 1.5
where β = 1 χ ( c p h ) 1.5 f ( c p h ) is a dimensionless constant, independent of material, and c p is the critical crack length at the peak point. The force-distance relation, powered by 1.5, then matched the dimensional analysis of K c . In order to figure out β , they plotted a series of data pairs for F p / h 1.5 and β K c , measuring the crack lengths in relation to different h s, to empirically fit the trend. It was found that the crack started to be unstable when c p / h 2.0 . This point is defined as the critical point, where peak chipping force and critical crack length arise [30]. Furthermore, with the pre-obtained toughness for the soda-lime glass, a constant value of β = 9.3 can be achieved, which can be used to predict the fracture toughness, with the tested peak force and indenting distance, through Equation (3). Table 1 shows good agreement, in the comparative toughness values in Chai and Lawn’s tests [30], between Vicker’s indentation and edge chipping:
Petit [31] further conducted a series of toughness experiments, by SEVNB, static and sliding-friction edge chipping, on two different aluminas (alumina A—99.9% purity and alumina B—98% purity), two different yttria-stabilized zirconias (zirconia A and B) and one silicon carbide, to confirm the efficiency of Chai’s toughness prediction formulation. A universal testing machine (Z-100 Universal testing machine—Zwick, Germany) was utilized to test the toughness, using SEVNB method [63], with the specimen dimension of 4 mm × 3 mm × 45 mm; the static edge chipping tests were conducted on specimens with the dimension of 30 mm × 15 mm × 4 mm, with a purpose-built device built into a universal testing machine: a holder for clamping the specimen and an indenter fixed on the crosshead of the machine. Sliding chipping tests were performed, using a REVETEST scratch tester (CSM Instruments—Switzerland), on testing samples with the dimension of 30 mm × 15 mm × 4 mm. With comparisons between the toughness values [31] from traditional SEVNB measurements and edge chipping, as shown in Table 2, Equation (3) was found to be efficient, even when interfacial friction effects were considered, although β value was fitted to be 5.4, which is different from Chai’s 9.3. The reason why β varies might be due to the difference of the indenter shape.
Chai and Lawn’s derivation provides a simple way of measuring the fracture toughness, depending on the fitted coefficient β [30]. As a minimum, Equation (3) possesses dominance over a mechanics-based chipping model, by also considering the free-edge effect, which is thought to be related to the power difference in the force–distance relations. However, Chai’s analytical model was based, predominantly, on the observations and measurements of cracks happening in the soda-lime glass, which is transparent and non-fine-grained. Thus, they may lack the consideration of texture effects [64]. Moreover, after a series of edge chipping tests, Quinn [65,66,67] demonstrated that the power relation, between force and indenting distance, varies in a range from 1 to 2, which can be formulated as:
F = a 1 h + a 2 h 2
where a 1 and a 2 are two constants. Equation (4) provides a universal format, with the consideration of comprehensive testing results on force-distance power relations. However, such analyses were based on the empirical fitting results, which may lack theoretical consolidations. Furthermore, the texture variances and the experimental conditions may result in the fluctuations of the fitting results [64]. In summary, it is worth taking a further look at the derivations, especially when applying these to multiphase mineral composites with different textures.

3.4. Energy Considerations

The tested toughness values vary largely, due to either the calculations based on crack lengths, or empirical curve fittings. Empirical fitting results mostly rely on the texture variance of fine-grained brittle materials, and lack analytical guidance. Moreover, the mechanics-based toughness derivations regard the accurate crack length measurements as a priority. This may be the reason why soda-lime glass was majorly facilitated as the target material with which to achieve the universal parameter β . However, the total energy consumption during chipping is actually induced by the indenter penetration. When the indenter penetrates the material to a certain depth, a major crack starts to initiate, and propagates until failure, as shown in Figure 1b. Therefore, part of the total external work contributes to material plastic deformation, or crushing, for the fine-grained brittle solids [66,67,68]. Hence, another part of the total external work is consumed to form the fracture surfaces.
Therefore, based on indentation [18], the penetration force F in relation to the penetration depth d can be written as:
F = λ d 2
where λ is a coefficient related to indentation hardness.Thus, the total external work can be integrated as:
W t = λ d 2
From Irwin’s fracture analyses [57], the energy release rate G demonstrates the energy released per unit area of the fracture surface.Thus, the fracture energy can be derived as:
E f = G A f
where E f represents the fracture energy and A f is the total fracture surface. Moreover, under plain strain condition, the energy release rate G possesses a relation with the stress intensity factor K I , which can be regarded as the toughness K c when the crack is at equilibrium [69]. Consequently, the exact fracture surface-area, and the accurate percentage between fracture surface-energy and total external work, are two critical parameters used to build up inherent energy relations, substituting the dependency of crack-length measurement and other crack-relevant parameters.

4. Conclusions

In this research, owing to its simplicity and practicability, edge chipping becomes an innovative method of toughness testing and possesses potential advantages for application in ceramic industries. Thus, conclusions can be made, as follows:
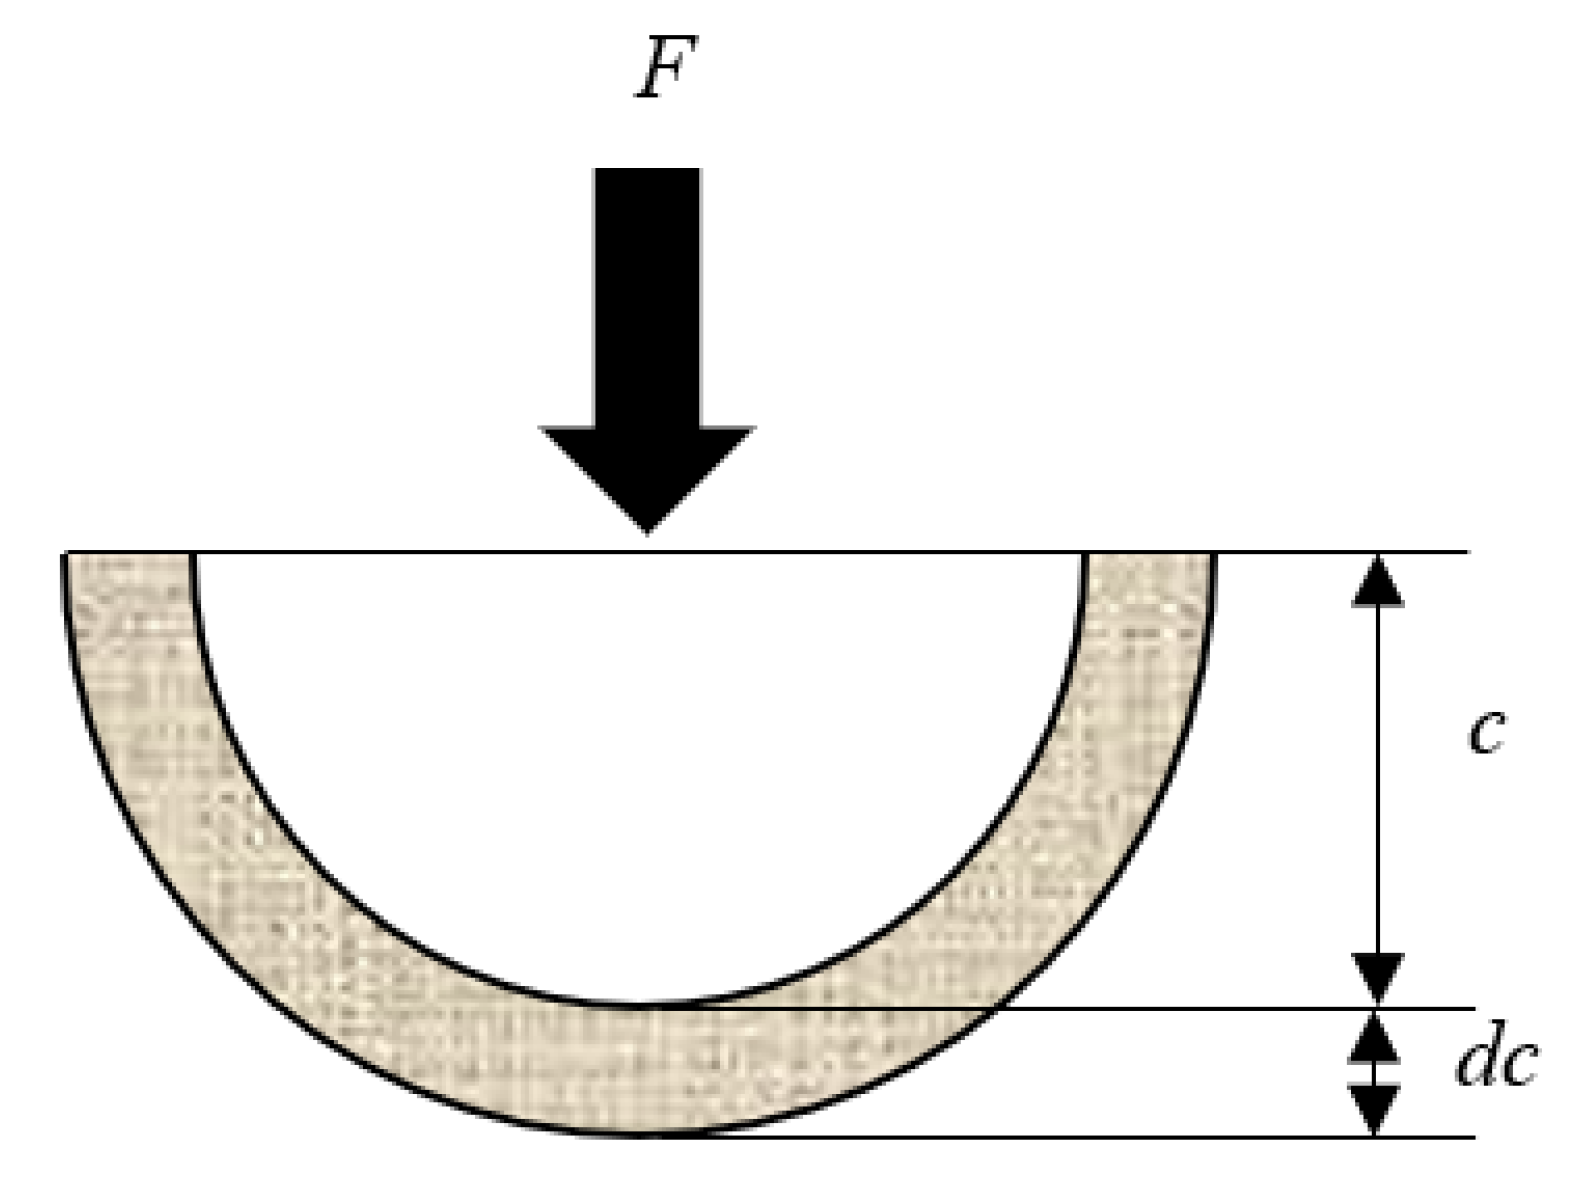
  • The half-penny shaped median crack is well initiated and propagated before it becomes unstable. Specifically, the dominant mode I stress intensity factor can be regarded as the fracture toughness Kc during edge chipping, when the crack is at equilibrium. So, before the crack becomes unstable, the derivations of indentation can be utilized to formulate the toughness expression.
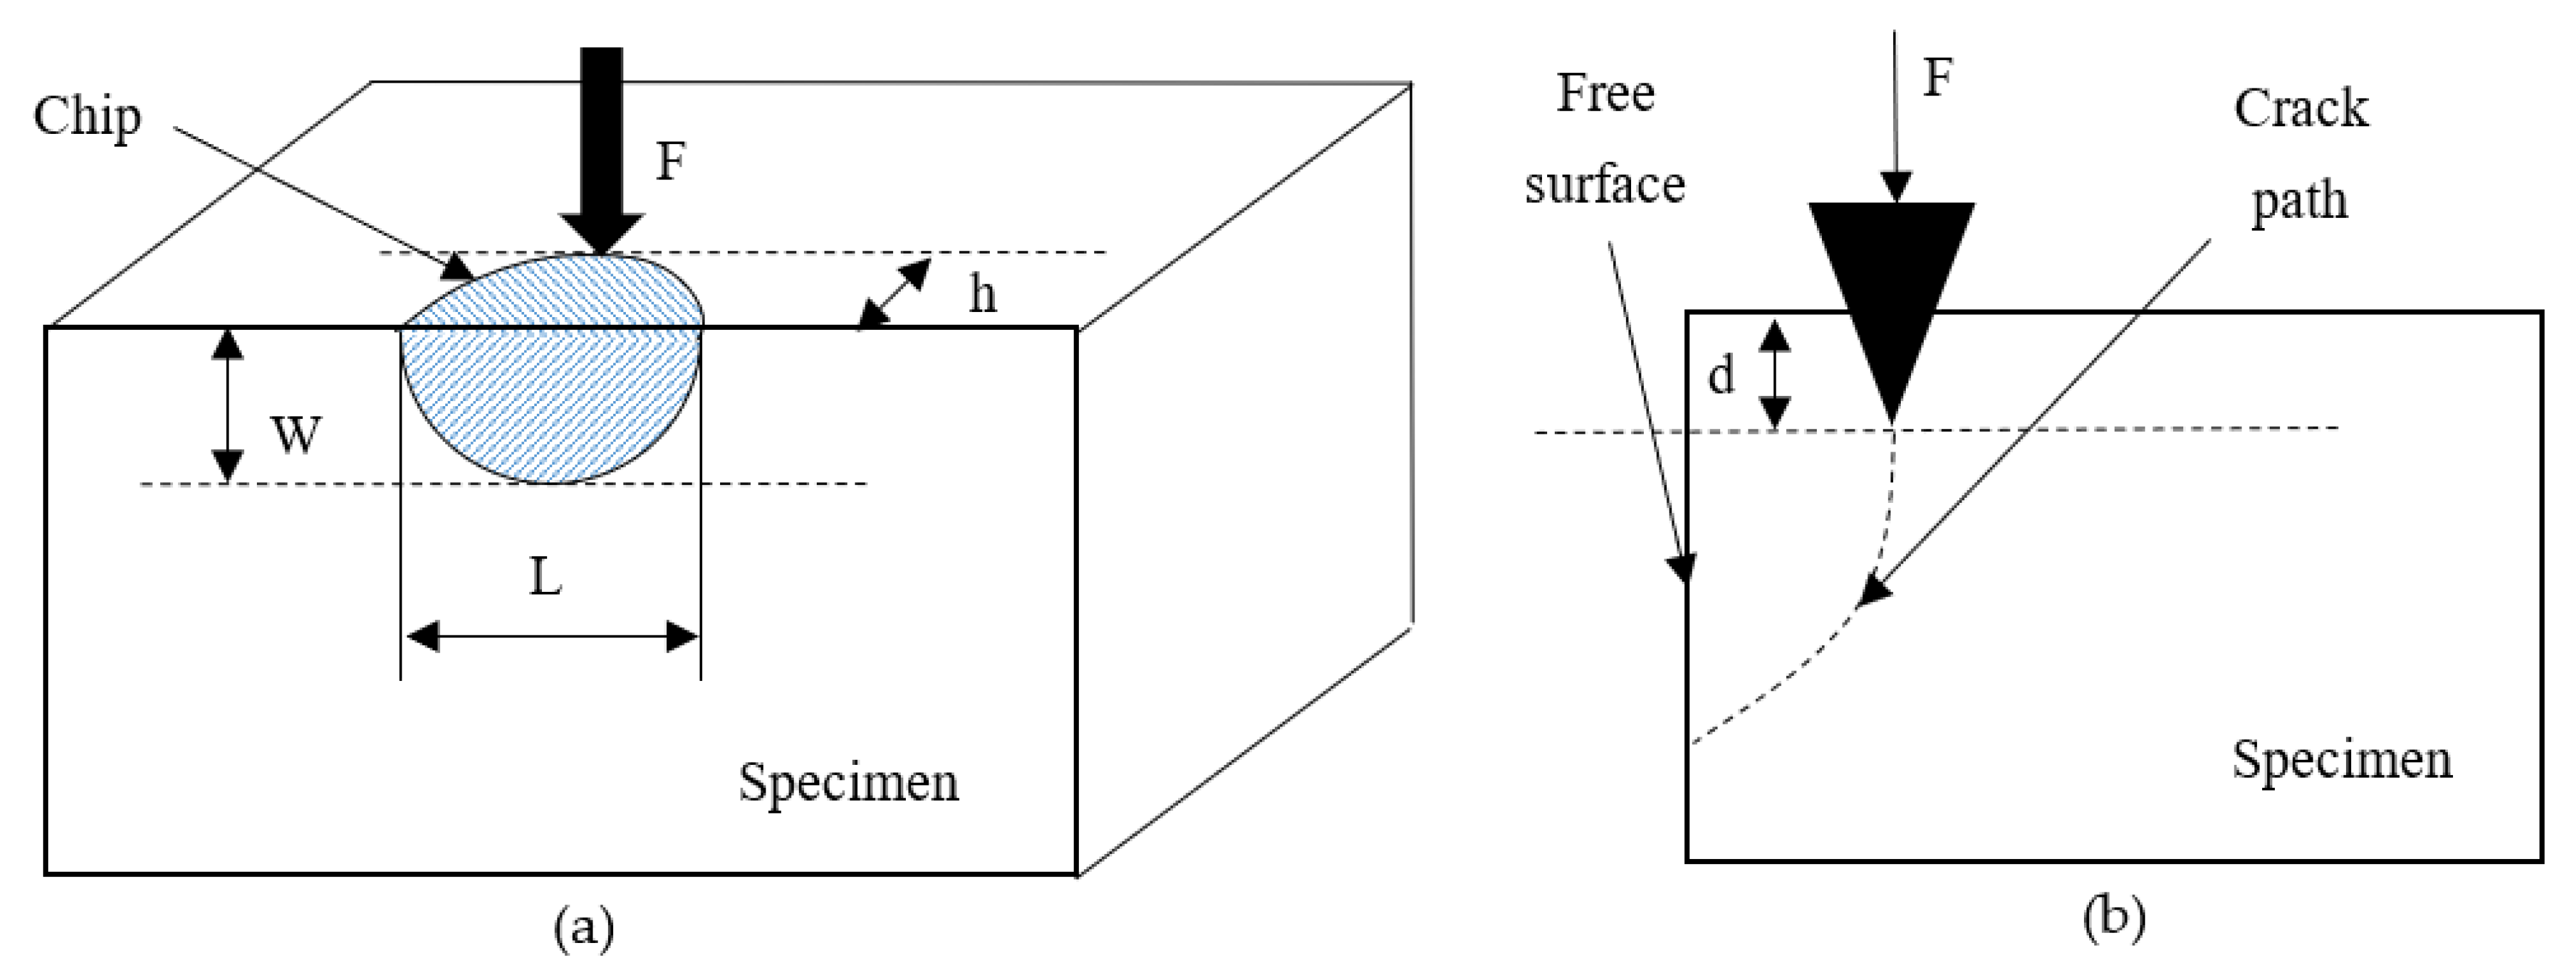
  • The relation between peak force and indenting distance provides a quantitative way of calculating the toughness value, if a dimensionless parameter is pre-obtained. It demonstrates the convenience of facilitating the edge-chipping method to measure the toughness, compared with traditional methods.
  • The reason why scattered values arise from the same testing method may be due to the variance and non-uniformity of texture in different batches of the same type of ceramics. Therefore, in terms of Irwin’s fracture-energy analyses [57], calculations on fracture and total energy consumptions, during chipping, may negate the requirement for measurement of the crack and computations of the dimensionless factors.
Future research may focus on the investigations in the fracture and total energy consumption during penetration, by using SEM (Scanning Electron Microscopy) to achieve the exact fracture surface areas. Moreover, machine learning can be further applied to facilitate the collected experimental data, in order to give more accurate predictions.

Author Contributions

Conceptualization, Q.Y. and Y.C.; methodology, Q.Y.; formal analysis, Q.Y. and H.Q.; investigation, Z.W. and Y.C.; writing—original draft preparation, Q.Y.; writing—review and editing, H.Q.; funding acquisition, Q.Y. and Y.C. All authors have read and agreed to the published version of the manuscript.

Funding

This research was funded by the 9th Group of Key Discipline Projects in Henan Province-Mechanical design, Manufacturing and Mechatronics.

Institutional Review Board Statement

Not applicable.

Informed Consent Statement

Not applicable.

Data Availability Statement

Not applicable.

Conflicts of Interest

The authors declare no conflict of interest.

References

  1. Schlacher, J.; Csanádi, T.; Vojtko, M.; Papšík, R.; Bermejo, R. Micro-scale fracture toughness of textured alumina ceramics. J. Eur. Ceram. Soc. 2022, in press. [CrossRef]
  2. Lawn, B.R.; Wilshaw, T.R. Fracture of Brittle Solids; Cambridge University Press: Cambridge, UK, 1975. [Google Scholar]
  3. Evans, A.G. Fracture Mechanics Determinations, in Concepts, Flaws, and Fractography; Bradt, R.C., Hasselman, D.P.H., Lange, F.F., Eds.; Springer: Boston, MA, USA, 1974; pp. 17–48. [Google Scholar]
  4. Barker, L.M. A simplified method for measuring plane strain fracture toughness. Eng. Fract. Mech. 1977, 9, 361–369. [Google Scholar] [CrossRef]
  5. Munz, D.; Bubsey, R.T.; Srawley, J.E. Compliance and stress intensity coefficients for short bar specimens with chevron notches. Int. J. Fract. 1980, 16, 359–374. [Google Scholar] [CrossRef]
  6. Lubauer, J.; Belli, R.; Lorey, T.; Max, S.; Lohbauer, U.; Zorzin, J.I. A split-Chevron-Notched-Beam sandwich specimen for fracture toughness testing of bonded interfaces. J. Mech. Behav. Biomed. Mater. 2022, 131, 105236. [Google Scholar] [CrossRef]
  7. Roberts, R.J.; Rowe, R.C.; York, P. The measurement of the critical stress intensity factor (KIC) of pharmaceutical powders using three point single edge notched beam (SENB) testing. Int. J. Pharm. 1993, 91, 173–182. [Google Scholar] [CrossRef]
  8. Awaji, H.; Sakaida, Y. V-Notch Technique for Single-Edge Notched Beam and Chevron Notch Methods. J. Am. Ceram. Soc. 1990, 73, 3522–3523. [Google Scholar] [CrossRef]
  9. Gupta, R.K.; Mahato, A.; Bhattacharya, A. Damage analysis of carbon fiber reinforced aluminum laminate under short beam and single edge notch beam bend test. Int. J. Mech. Sci. 2021, 198, 106393. [Google Scholar] [CrossRef]
  10. Carlton, H.D.; Elmer, J.W.; Freeman, D.C.; Schaeffer, R.D.; Derkach, O.; Gallegos, G.F. Laser notching ceramics for reliable fracture toughness testing. J. Eur. Ceram. Soc. 2016, 36, 227–234. [Google Scholar] [CrossRef] [Green Version]
  11. Bar-On, I.; Beals, J.T.; Leatherman, G.L.; Murray, C.M. Fracture Toughness of Ceramic Precracked Bend Bars. J. Am. Ceram. Soc. 1990, 73, 2519–2522. [Google Scholar] [CrossRef]
  12. Prmas, R.J.; Gstrein, R. Esis TC 6 Round Robin on Fracture Toughness. Fatigue Fract. Eng. Mater. Struct. 1997, 20, 513–532. [Google Scholar] [CrossRef]
  13. Fischer, H.; Waindich, A.; Telle, R. Influence of preparation of ceramic SEVNB specimens on fracture toughness testing results. Dent. Mater. 2008, 24, 618–622. [Google Scholar] [CrossRef] [PubMed]
  14. Nishida, T.; Hanaki, Y.; Pezzotti, G. Effect of Notch-Root Radius on the Fracture Toughness of a Fine-Grained Alumina. J. Am. Ceram. Soc. 1994, 77, 606–608. [Google Scholar] [CrossRef]
  15. Nose, T.; Fujii, T. Evaluation of Fracture Toughness for Ceramic Materials by a Single-Edge-Precracked-Beam Method. J. Am. Ceram. Soc. 2010, 71, 328–333. [Google Scholar] [CrossRef]
  16. Quinn, G.D.; Swab, J.J.; Motyka, M.J. Fracture Toughness of a Toughened Silicon Nitride by ASTM C 1421. J. Am. Ceram. Soc. 2010, 86, 1043–1045. [Google Scholar] [CrossRef]
  17. Qin, Z.; Tian, Y.; Li, G.; Liu, L. Study on bending behaviors of severely pre-cracked RC beams strengthened by BFRP sheets and steel plates. Constr. Build. Mater. 2019, 219, 131–143. [Google Scholar] [CrossRef]
  18. Lawn, B.; Wilshaw, R. Indentation fracture: Principles and applications. J. Mater. Sci. 1975, 10, 1049–1081. [Google Scholar] [CrossRef]
  19. Evans, A.G.; Charles, E.A. Fracture Toughness Determinations by Indentation. J. Am. Ceram. Soc. 1976, 59, 371–372. [Google Scholar] [CrossRef]
  20. Marshall, D.B.; Evans, A.G. Reply to “Comment on ‘Elastic/Plastic Indentation Damage in Ceramics: The Median/Radial Crack System’”. J. Am. Ceram. Soc. 1981, 64, C-182–C-183. [Google Scholar] [CrossRef]
  21. Anstis, G.; Chantikul, P.; Lawn, B.; Marshall, D. A Critical Evaluation of Indentation Techniques for Measuring Fracture Toughness: I, Direct Crack Measurements. J. Am. Ceram. Soc. 1981, 64, 533–538. [Google Scholar] [CrossRef]
  22. Marshall, D.B.; Lawn, B.R.; Evans, A.G. Elastic/Plastic Indentation Damage in Ceramics: The Lateral Crack System. J. Am. Ceram. Soc. 1982, 65, 561–566. [Google Scholar] [CrossRef]
  23. Quinn, G.D. Fracture Toughness of Ceramics by the Vickers Indentation Crack Length Method: A Critical Review, in Mechanical Properties and Performance of Engineering Ceramics II. Ceram. Eng. Sci. Proc. 2006, 27, 45–62. [Google Scholar]
  24. Quinn, G.D.; Bradt, R.C. On the Vickers Indentation Fracture Toughness Test. J. Am. Ceram. Soc. 2007, 90, 673–680. [Google Scholar] [CrossRef]
  25. Ma, D.J.; Sun, L.; Wang, L.Z.; Wang, J.L. A New Formula for Evaluating Indentation Toughness in Ceramics. Exp. Mech. 2018, 58, 177–182. [Google Scholar] [CrossRef]
  26. Lemaitre, P.; Piller, R. Comparison of the fracture toughness of alumina measured by three different methods. J. Mater. Sci. Lett. 1988, 7, 772–774. [Google Scholar] [CrossRef]
  27. McCormick, N.J. Edge flaking as a measure of materials performance. Met. Mater. 1992, 47, 83. [Google Scholar]
  28. Gogotsi, G.A.; Batanova, O.A.; Matvienko, Y.G. General regularities of edge chipping tests for ceramics in the case of conical indenters with different rounding tip. Mech. Mater. 2019, 132, 86–92. [Google Scholar] [CrossRef]
  29. Gogotsi, G.A. Criteria of ceramics fracture (edge chipping and fracture toughness tests). Ceram. Int. 2013, 39, 3293–3300. [Google Scholar] [CrossRef]
  30. Chai, H.; Lawn, B.R. A universal relation for edge chipping from sharp contacts in brittle materials: A simple means of toughness evaluation. Acta Mater. 2007, 55, 2555–2561. [Google Scholar] [CrossRef]
  31. Petit, F.; Vandeneede, V.; Cambier, F. Ceramic toughness assessment through edge chipping measurements—Influence of interfacial friction. J. Eur. Ceram. Soc. 2009, 29, 2135–2141. [Google Scholar] [CrossRef]
  32. Gogotsi, G.A. Classification of ceramics and glass (edge chipping and fracture toughness). Ceram. Int. 2014, 40, 5591–5596. [Google Scholar] [CrossRef]
  33. Miyazaki, H.; Yoshizawa, Y. Novel measurement technique of crack length for indentation fracture (IF) method using high contrast image of crack tips through thin film coating. J. Eur. Ceram. Soc. 2015, 35, 2943–2948. [Google Scholar] [CrossRef]
  34. Morrell, R.; Gant, A.J. Edge chipping of hard materials. Int. J. Refract. Met. Hard Mater. 2001, 19, 293–301. [Google Scholar] [CrossRef]
  35. Cao, Y. Failure analysis of exit edges in ceramic machining using finite element analysis. Eng. Fail. Anal. 2001, 8, 325–338. [Google Scholar] [CrossRef]
  36. Xu, C.; Ai, X.; Huang, C. Fabrication and performance of an advanced ceramic tool material. Wear 2001, 249, 503–508. [Google Scholar] [CrossRef]
  37. Singh, V.; Saraswat, P.; Joshi, D. Experimental investigation of edge chipping defects in rotary ultrasonic machining of float glass. Mater. Today Proc. 2021, 44, 4462–4466. [Google Scholar] [CrossRef]
  38. Mohajerani, A.; Spelt, J.K. Edge chipping of borosilicate glass by blunt indentation. Mech. Mater. 2010, 42, 1064–1080. [Google Scholar] [CrossRef]
  39. Cotterell, B.; Kamminga, J.; Dickson, F.P. The Essential Mechanics of Conchoidal Flaking. Int. J. Fract. 1985, 29, 205–221. [Google Scholar] [CrossRef]
  40. Liu, H.; Kou, S.; Lindqvist, P.-A.; Tang, C. Numerical simulation of the rock fragmentation process induced by indenters. Int. J. Rock Mech. Min. Sci. 2002, 39, 491–505. [Google Scholar] [CrossRef]
  41. Liu, H.; Luleå, S. Numerical Modelling of the Rock Fragmentation Process by Mechanical Tools; Luleå University of Technology: Luleå, Sweden, 2004. [Google Scholar]
  42. Almond, E.A.; Mccormick, N.J. Constant-Geometry Edge-Flaking of Brittle Materials. Nature 1986, 321, 53–55. [Google Scholar] [CrossRef]
  43. McCormick, N. Edge flaking of brittle materials. In Proceedings of the Advanced Engineering with Ceramics London, London, UK, 14–15 December 1989; pp. 307–318. [Google Scholar]
  44. Thouless, M.; Evans, A.; Ashby, M.; Hutchinson, J. The edge cracking and spalling of brittle plates. Acta Metall. 1987, 35, 1333–1341. [Google Scholar] [CrossRef]
  45. Chiu, W.; Thouless, M.D.; Endres, W. An analysis of chipping in brittle materials. Int. J. Fract. 1998, 90, 287–298. [Google Scholar] [CrossRef]
  46. Wei, S.; Liu, Y.; Liu, X.; Zhao, H. Investigation on edge chipping evaluation of Si3N4 ceramics milling surface. Measurement 2019, 133, 241–250. [Google Scholar] [CrossRef]
  47. Danzer, R.; Paar, R. Edge strength of brittle materials. Fortschr. Dsch Keram Gese 1994, 10, 77–84. [Google Scholar]
  48. Gogotsi, G.; Galenko, V.; Mudrik, S.; Ozersky, B.; Khvorostyany, V.; Khristevich, T. Fracture resistance estimation of elastic ceramics in edge flaking: EF baseline. J. Eur. Ceram. Soc. 2010, 30, 1223–1228. [Google Scholar] [CrossRef]
  49. Gogotsi, G.; Mudrik, S. Fracture resistance of technical and optical glasses: Edge flaking of specimens. Strength Mater. 2010, 42, 280–286. [Google Scholar] [CrossRef]
  50. Gogotsi, G.A. Fracture behaviour of Mg-PSZ ceramics: Comparative estimates. Ceram. Int. 2009, 35, 2735–2740. [Google Scholar] [CrossRef]
  51. Gogotsi, G.A. Mechanical behaviour of a silicon nitride particulate ceramic composite. Ceram. Int. 2009, 35, 1109–1114. [Google Scholar] [CrossRef]
  52. Gogotsi, G.A.; Mudrik, S.P. Fracture barrier estimation by the edge fracture test method. Ceram. Int. 2009, 35, 1871–1875. [Google Scholar] [CrossRef]
  53. Gogotsi, G.; Mudrik, S.; Galenko, V. Evaluation of fracture resistance of ceramics: Edge fracture tests. Ceram. Int. 2007, 33, 315–320. [Google Scholar] [CrossRef]
  54. Gogotsi, G.A.; Lomonova, E.E.; Pejchev, V.G. Strength and fracture toughness of zirconia crystals. J. Eur. Ceram. Soc. 1993, 11, 123–132. [Google Scholar] [CrossRef]
  55. Gogotsi, G.A.; Ostrovoy, D.Y. Mechanical behaviour of partially stabilized zirconia crystals with terbia and ceria additives. J. Eur. Ceram. Soc. 1995, 15, 1177–1184. [Google Scholar] [CrossRef]
  56. Quinn, J.; Su, L.; Flanders, L.; Lloyd, I. “Edge Toughness” and Material Properties Related to the Machining of Dental Ceramics. Mach. Sci. Technol. 2000, 4, 291–304. [Google Scholar] [CrossRef]
  57. Lawn, B. Fracture of Brittle Solids, 2nd ed.; Cambridge Solid State Science Series; Cambridge University Press: Cambridge, UK, 1993. [Google Scholar]
  58. Griffith, A.A. The phenomenon of rupture and flow in solids. Trans. R. Soc. Lond. 1920, 221, 163. [Google Scholar]
  59. Atkinson, B.K.; Avdis, V. Fracture-Mechanics Parameters of Some Rock-Forming Minerals Determined Using an Indentation Technique. Int. J. Rock Mech. Min. Sci. 1980, 17, 383–386. [Google Scholar] [CrossRef]
  60. Swain, M.; Atkinson, B. Fracture surface energy of olivine. Pure Appl. Geophys. 1978, 116, 866–872. [Google Scholar] [CrossRef]
  61. Swain, M.; Lawn, B. Indentation Fracture in Brittle Rocks and Glasses; Elsevier: Amsterdam, The Netherlands, 1976. [Google Scholar]
  62. Lawn, B.R.; Fuller, E. Equilibrium penny-like cracks in indentation fracture. J. Mater. Sci. 1975, 10, 2016–2024. [Google Scholar] [CrossRef]
  63. Damani, R.; Gstrein, R.; Danzer, R. Critical notch-root radius effect in SENB-S fracture toughness testing. J. Eur. Ceram. Soc. 1996, 16, 695–702. [Google Scholar] [CrossRef]
  64. Liu, L.; Zhang, Y. Effect of initial particle size on grain microstructure of textured ferroelectric ceramics: A phase-field method and brush technique. J. Eur. Ceram. Soc. 2022, 42, 5675–5683. [Google Scholar] [CrossRef]
  65. Quinn, G.D. On edge chipping testing and some personal perspectives on the state of the art of mechanical testing. Dent. Mater. 2015, 31, 26–36. [Google Scholar] [CrossRef] [Green Version]
  66. Quinn, G.D.; Giuseppetti, A.A.; Hoffman, K.H. Chipping fracture resistance of dental CAD/CAM restorative materials: Part I—Procedures and results. Dent. Mater. 2014, 30, e99–e111. [Google Scholar] [CrossRef] [Green Version]
  67. Quinn, G.D.; Giuseppetti, A.A.; Hoffman, K.H. Chipping fracture resistance of dental CAD/CAM restorative materials: Part 2. Phenomenological model and the effect of indenter type. Dent. Mater. 2014, 30, e112–e123. [Google Scholar] [CrossRef] [PubMed] [Green Version]
  68. Tang, X.J.; Zhang, B.G.; Tian, X.L.; Zhou, Z.Y.; Ge, H. Energy Characteristics Analysis of Engineering Ceramics during the Process of Edge Chipping Based on AE. Mater. Sci. Forum 2013, 770, 170–174. [Google Scholar] [CrossRef]
  69. Dowding, C.H. Fractures, Fracture Structuresfractures, Fracture Structures, in General Geology; Springer: Boston, MA, USA, 1988; pp. 212–217. [Google Scholar]
Figure 1. (a) Schematic view of CNB; (b) Schematic view of SENB; (c) Schematic view of SEVNB; (d) Schematic view of Vicker’s indentation.
Coatings 12 01146 g001
Figure 2. (a) Schematic view of edge chipping; (b) Side view of edge chipping process.
Coatings 12 01146 g002
Figure 3. Crack morphology of chipping glass. Reprinted with permission from ref. [30]. Copyright 2007 Elsevier. (a) Top view of crack; (b) Side view of crack; (c) Front view of crack.
Coatings 12 01146 g003
Figure 4. Crack extension with point force under sharp indentation.
Coatings 12 01146 g004
Table 1. Comparisons between indentation toughness values and mean chipping toughness values.
MaterialsKc Measured by Indentation (MPa m1/2)Mean Kc Measured by Chipping (MPa m1/2)
Soda-lime glass0.60.6
Porcelain0.91.0
Alumina2.51.8
Y-TZP3.73.6
Table 2. Comparisons between SEVNB toughness values and mean chipping toughness values.
MaterialsKc Measured by SEVNB (MPa m1/2)Mean Kc Measured by Chipping (MPa m1/2)
Zirconia A7.19.2
Zirconia B12.011.8
Alumina A (99.9% purity)4.14.7
Alumina B (98% purity)3.53.1
SiC3.24.9
Publisher’s Note: MDPI stays neutral with regard to jurisdictional claims in published maps and institutional affiliations.

