Abstract
High-temperature operation service conditions can be used to evaluate the durability of Atmospheric Plasma-Sprayed Thermal Barrier Coating systems (APS-TBCs). To evaluate the durability of TBCs within their life span, two different thermal cycling testing results, i.e., isothermal furnace cycling and burner rig cycling tests, are utilized to numerically investigate possible crack driving forces that might lead to the failure of TBCs. Although there are many studies on failure and life prediction, there is still a lack of quantitative evaluation and comparison on the crack driving forces under these two different thermal cycling schemes. In this paper, by using modified analytical models, strain energy release rates (ERRs) are estimated and compared between these two testing approaches using experimental data. A new residual stress model was developed to study the position where the maximum residual stress occurs due to coefficient of thermal expansion (CTE) mismatch at different thermally grown oxide (TGO) thicknesses. The main crack driving forces are identified for two types of thermal cycling. A possible cracking route is found based on the calculated equivalent ERRs with respect to distance from the interface between the topcoat (TC)/TGO layers. The relationship between crack driving force of isothermal furnace and burner cycling tests is also elaborated.
1. Introduction
The durability of Thermal Barrier Coating systems (TBCs) plays an essential role in determining the reliability of hot section components of gas turbine engines, thus, directly affecting their applicability under different harsh service conditions [1,2,3,4,5,6,7]. However, it is a challenge to evaluate the durability of TBCs during regular service life since a high cost is required to track and identify the failure mechanisms of a TBC. To date, experiments at selected high temperatures have been designed to investigate possible cracking driving forces that could lead to the propagation of microcracks and spallation of the topcoat (TC) [8,9,10,11,12,13,14,15]. Among various tests, the thermal cycling test is able to provide useful information that can measure the durability of TBCs. It is known that thermally grown oxide (TGO) is formed during the high-temperature dwell period due to progressive oxidation of the metallic bond coat (BC), facilitating crack propagation along the TC/TGO interface or penetrating the TGO scale at the final stage of the TBC’s lifetime. A large residual stress is induced as a consequence of coefficient of thermal expansion (CTE) mismatch between different layers during the cooling period, where the out-of-plane tensile stress is developed at undulations, nucleating cracks close to the interface. The abovementioned TGO growth as well as CTE mismatch between layers play a key role in determining the failure mechanism of TBCs under isothermal furnace cycling test (FCT), where the temperature is uniformly distributed throughout the entire TBC specimen [16,17,18,19,20,21].
Other thermal cycling experiments contain a rapid temperature variation and short duration of high-temperature dwell period in an integrated thermal cycle. The former introduces a massive thermal shock during heating and cooling periods [22,23,24,25], while the latter leads to a large temperature difference between coating layers, i.e., thermal gradient formed due to high heating applied to the surface of the TC and back-side cooling from the bond coat (BC)—substrate interface [26,27,28,29]. This thermal cycling experiment, also called a burner cycling test, is used to simulate the process of subsonic engine takeoff and shutdown in real service conditions [8,30,31,32]. To date, research has been conducted to investigate possible failure mechanisms and factors influencing the durability of TBCs via these two types of thermal cycling experiments [26,33,34,35]. Efforts were also made to understand the crack driving forces behind each thermal cycling experiment using semi-empirical analytical methods. However, there is a lack of studies quantitatively evaluating the energy release rates (ERRs) and a comparison between these two types of ERRs using analytical models. The experimental work conducted by Li et al. [8] provides a correlation between life data of Atmospheric Plasma-Sprayed Thermal Barrier Coating system (APS-TBCs) with different pre-oxide thicknesses, tested in both burner cycling and isothermal furnace. The author discussed the relationship between critical TGO thickness and crack routes.
The experimental data in [8] facilitates the current research work, where the crack driving forces for APS-TBCs are quantified in terms of energy release rates (ERRs), calculated through modified analytical models. The experimental data from isothermal furnace cycling tests or burner cycling tests from the literature [8] were used to calculate parameters of analytical models, where the concept of equivalent time was developed to evaluate the effect of preheat treatment on the process-dependent model parameters in thermal cycling calculations. A new method is proposed to identify the position of the maximum CTE stress developed during cooling, as a function of different TGO thicknesses. The ERR was calculated vs. the pre-oxide thickness and the impact of individual ERR on life cycle was evaluated. The difference between ERRs calculated for different thermal cycling tests are discussed. Possible cracking routes are investigated, making use of the position-dependent ERRs for different thermal cycling conditions. The differences between crack driving forces under the two different thermal cycling tests are discussed.
The technical details in Section 3 to Section 4, such as the derivation of equations, the model parameters fitting to the experimental data, explanation of parameters and their origin and implication, are provided in the Supplementary Materials.
2. Parameters Describing Thermal History, Life Data and Interfacial Geometry of APS-TBCs
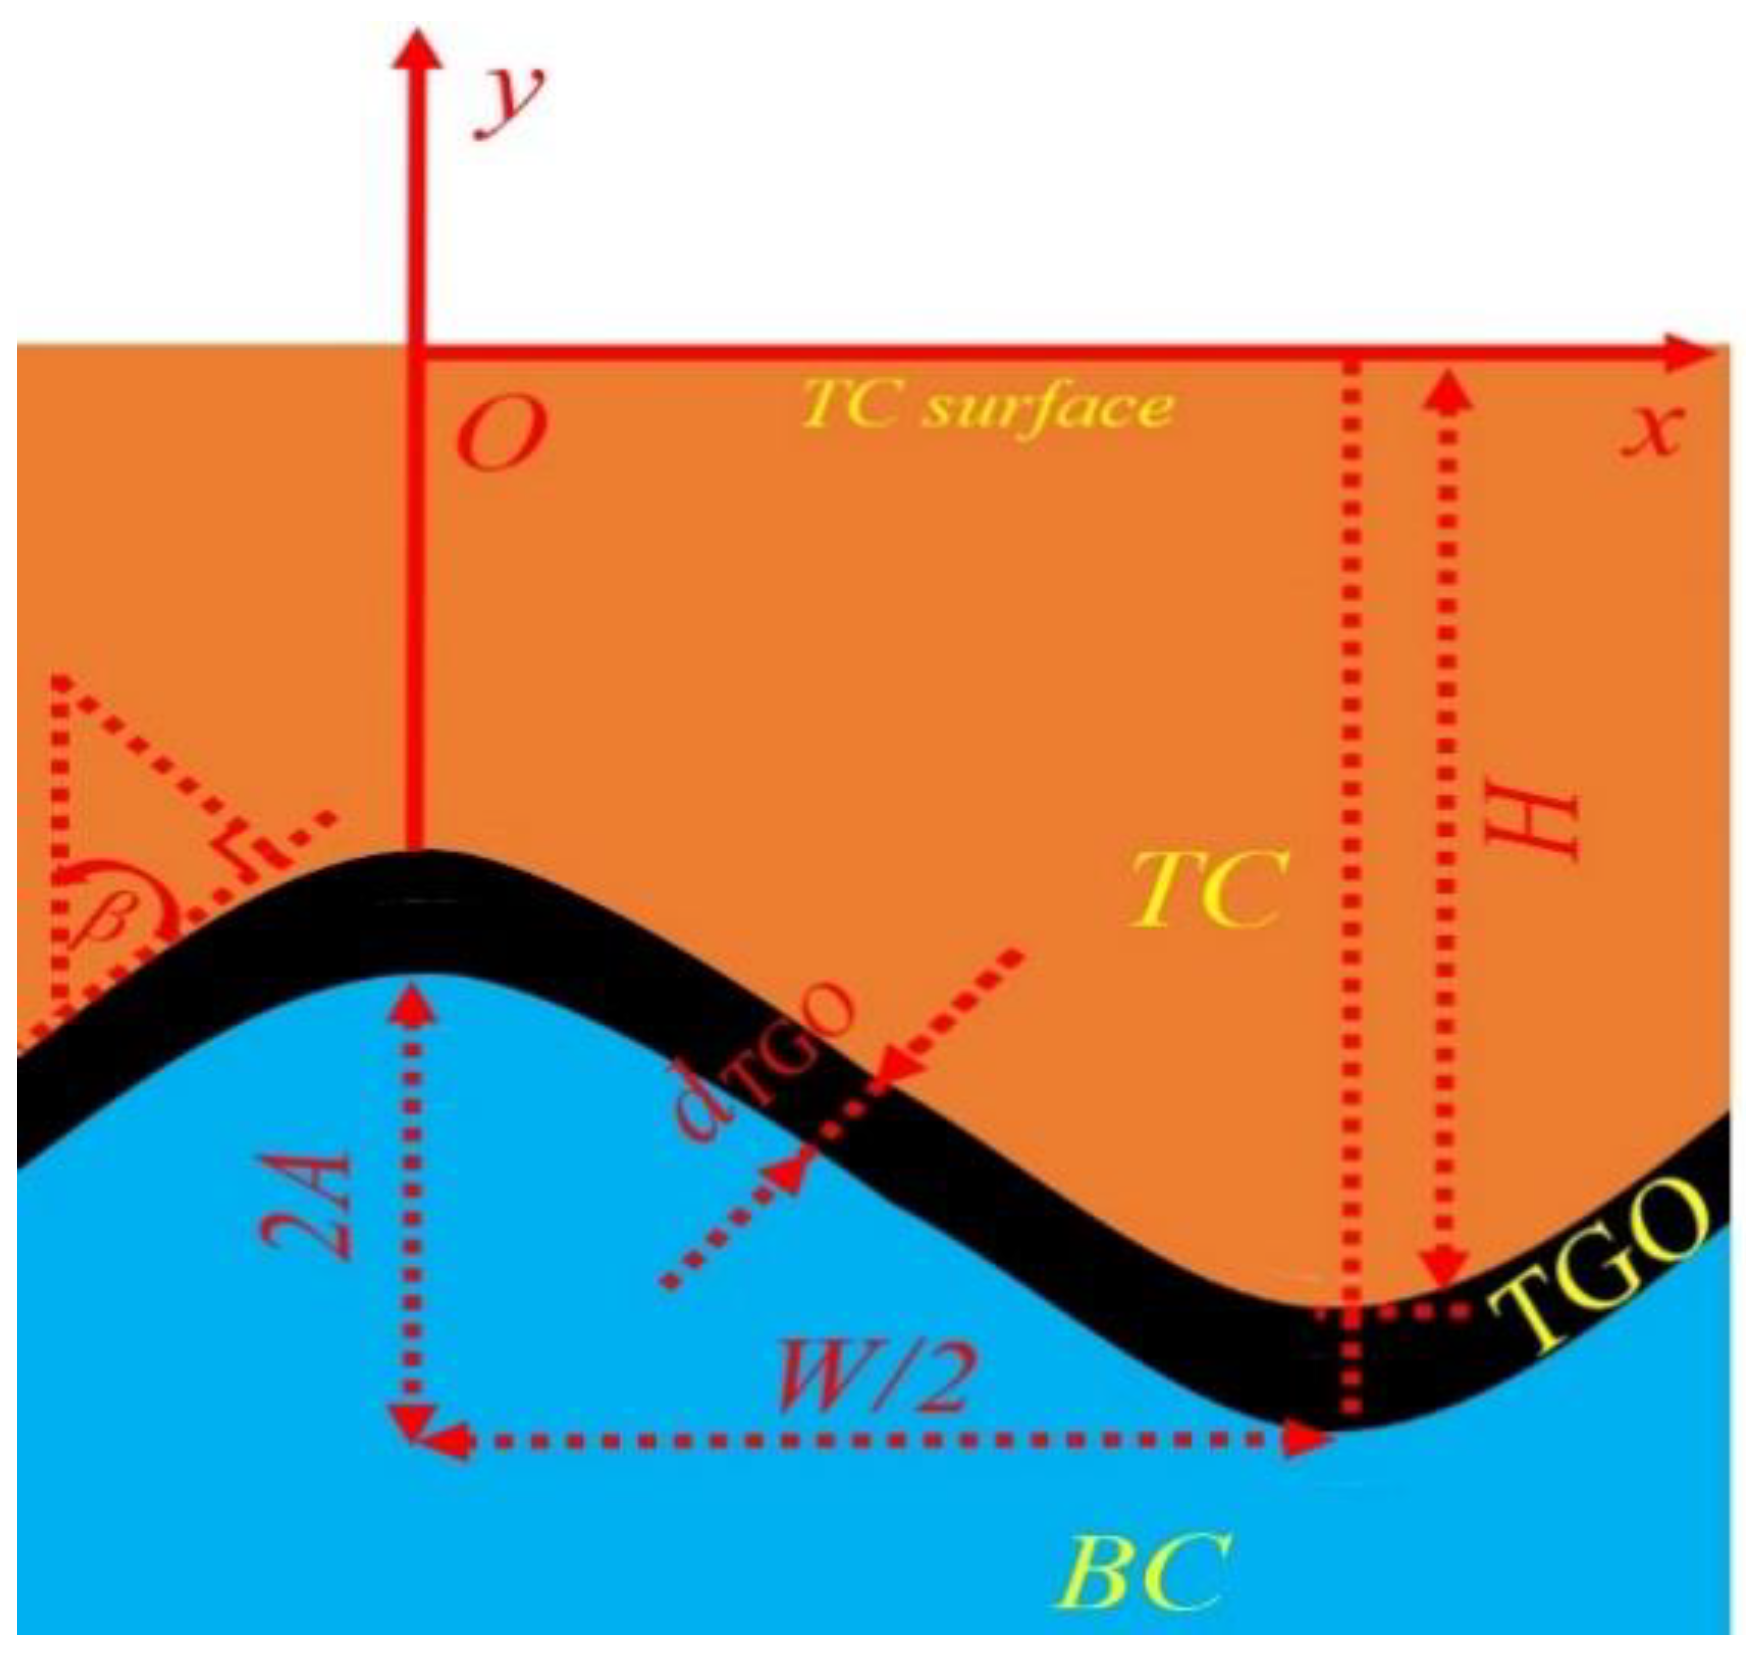
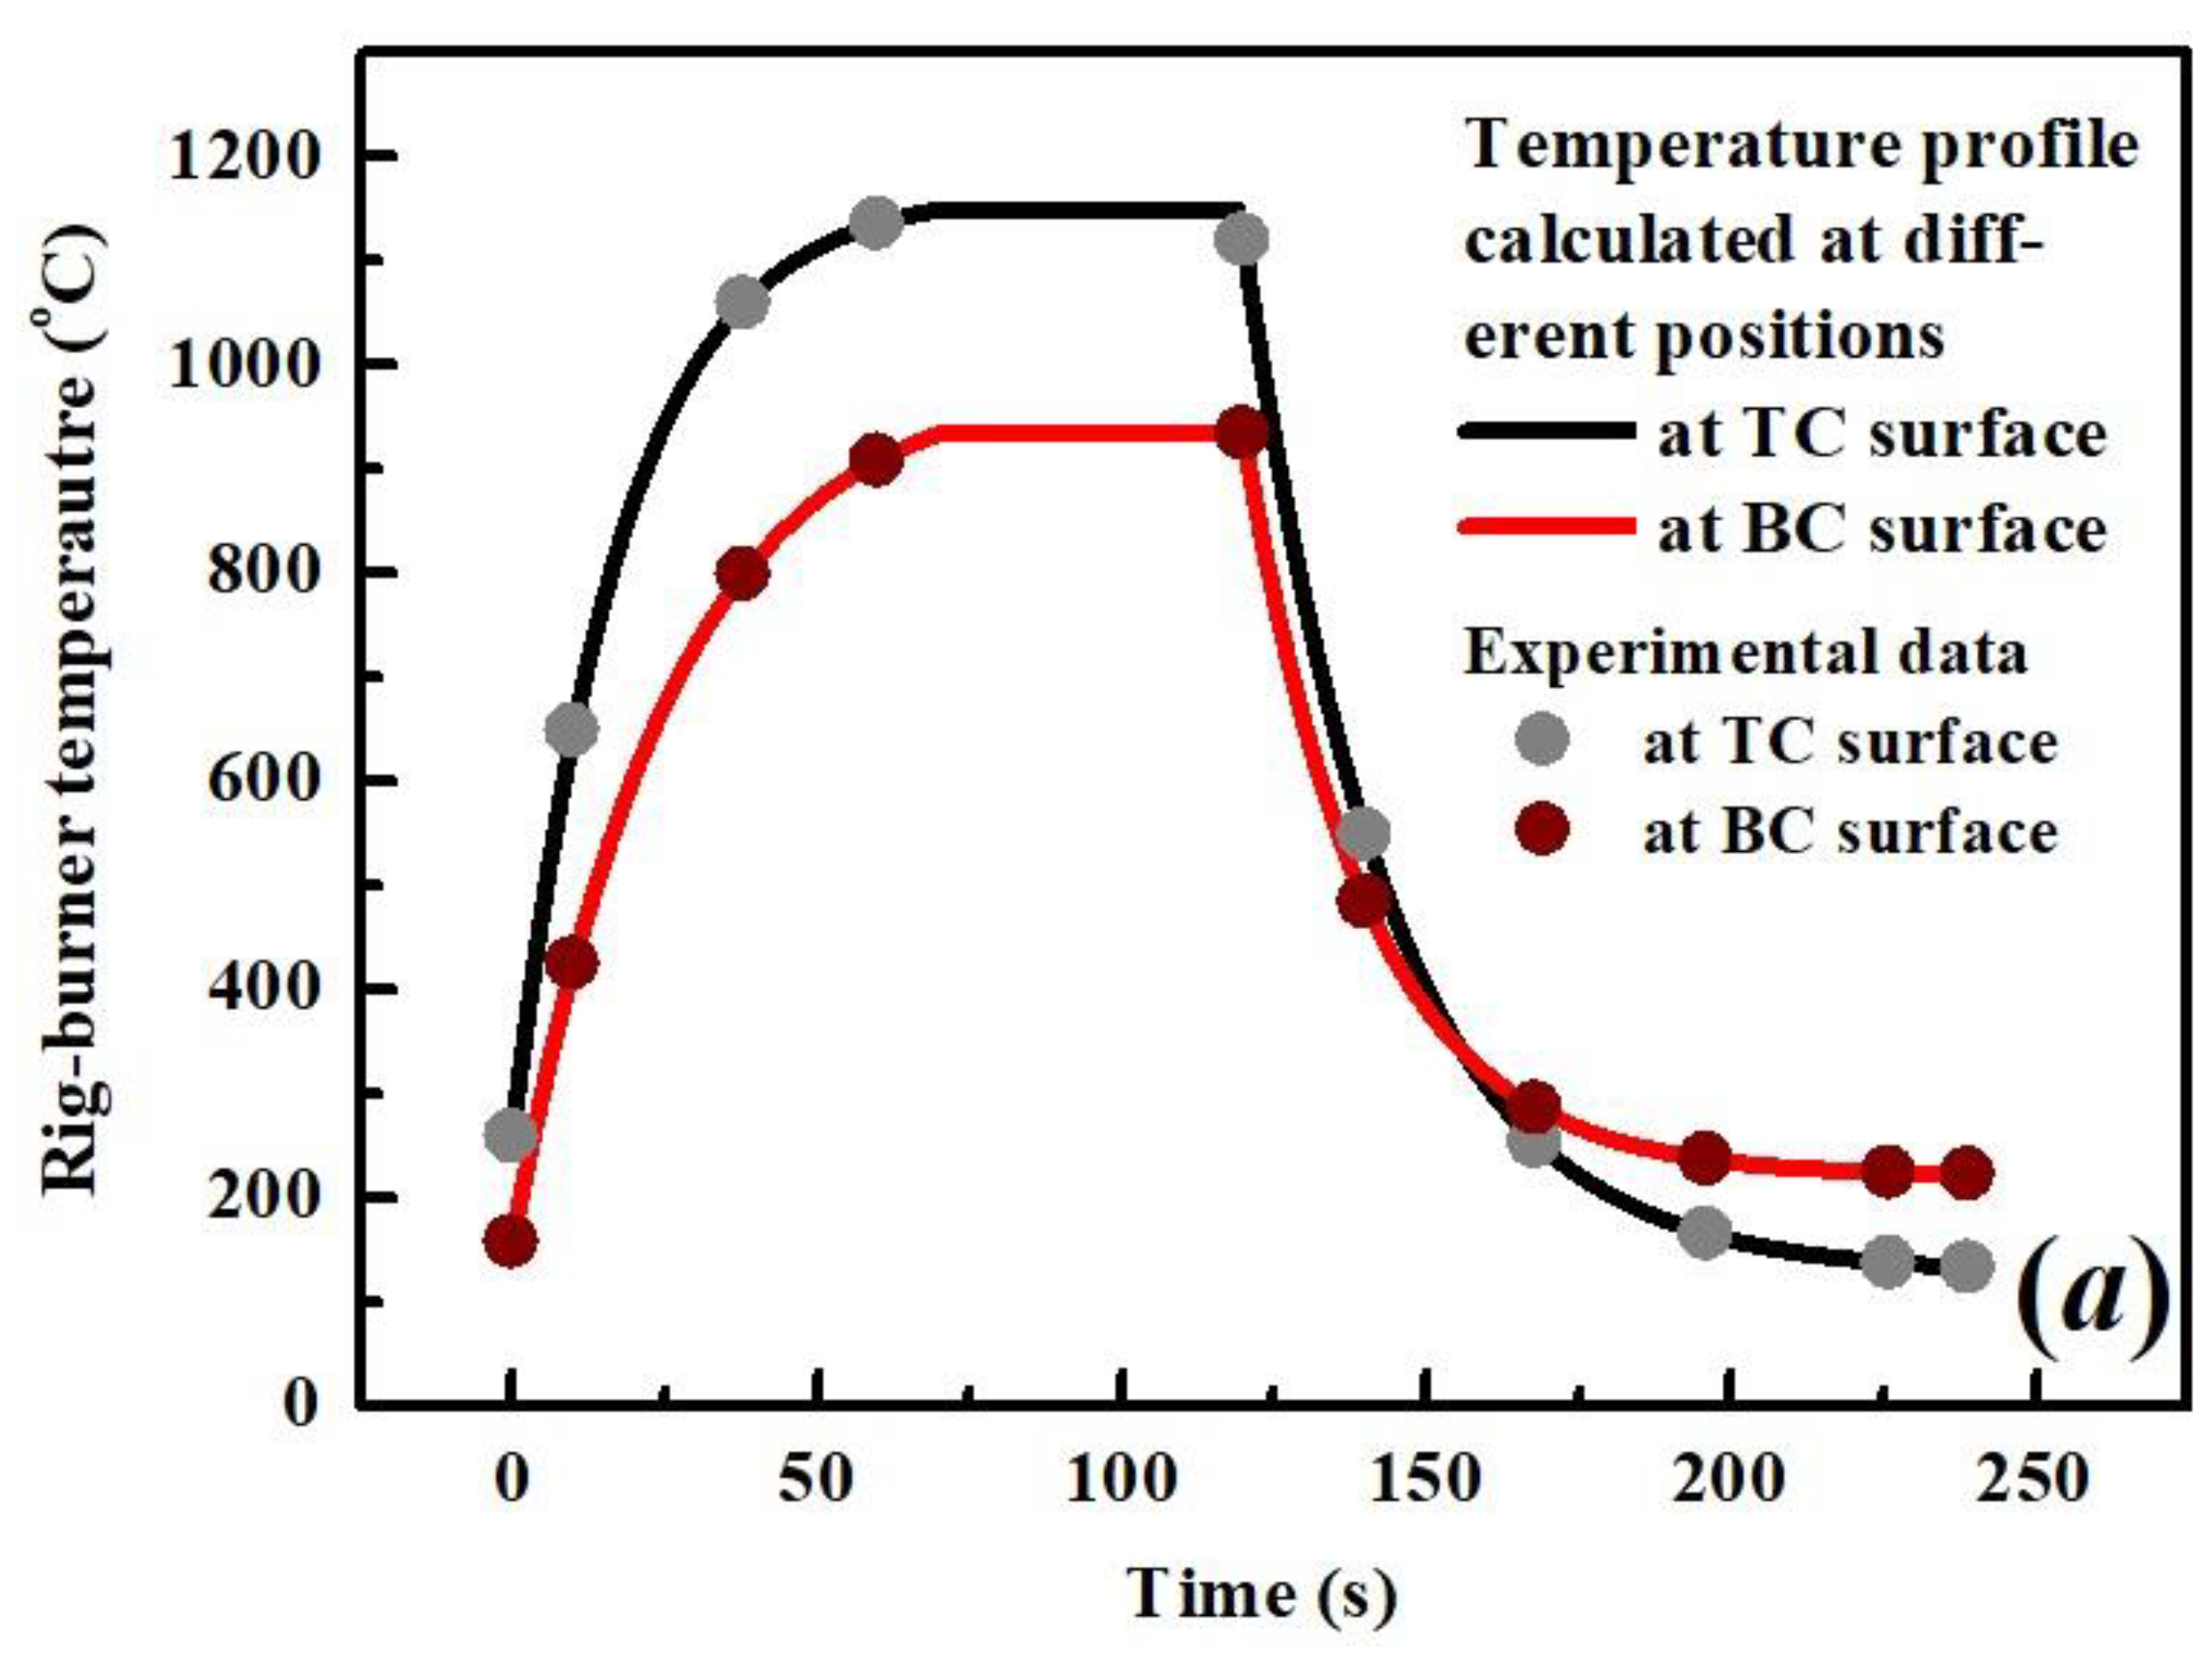
In Ref. [8], all APS-TBC specimens undergoing thermal cycling testing experience 4 h of pre-treatment at 1000 °C, followed by another 4 h pre-treatment at 1080 °C under an Argon atmosphere. Further heat treatment includes 20, 50, 105, 225, 300 and 350 h isothermal heating at 1080 °C designed to produce the different group sets of APS-TBC specimens, with various pre-oxide layer thicknesses. Two different thermal cycling experiments were conducted to obtain APS-TBCs with various life cycles [8]. The temperature profile for the burner cycling test contains 70 s of a temperature increase to peak temperature and 50 s of dwell time at 1150 °C measured at the surface of the TC, followed by 120 s for the entire TBC to cool down. Compressed air is applied simultaneously to the backside of the substrate, maintaining the temperature at 935 °C during the high-temperature dwell period. Thus, a thermal gradient, as defined above, is present throughout the thickness of TBCs. Considering that (i) the temperature difference between the TC surface and the TGO/BC interface is much larger than that between the substrate and BC, and (ii) the thermal conductivity of the metallic substrate and BC is much higher than ceramic TC, the substrate and BC are approximated as an isothermal body with no thermal gradient across these two coating layers. The temperature profile for a given depth within the TC can be profiled [36]. Considering the entire TC layer is affected by the sintering effect, the temperature at a given position y in Figure 1 can be expressed as [36]
where H is the total thickness of the TC layer and and are temperatures at the surface of the TC and backside of the BC. The temperature within the TC is plotted in Figure 2 by choosing y/H = −0.2, −0.4, −0.6 and −0.8 respectively. It is evident that the temperature keeps falling in calculated positions close to the BC surface.
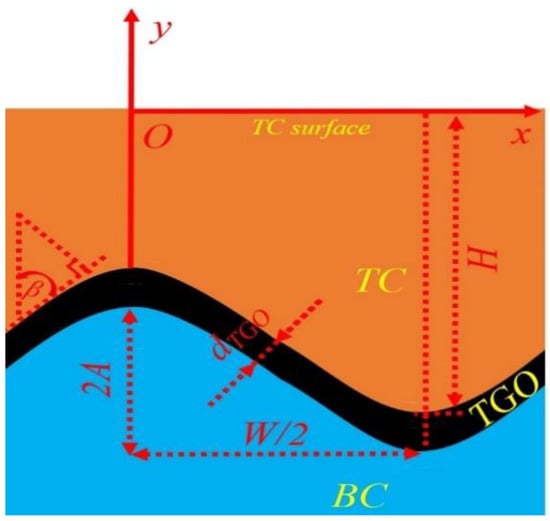
Figure 1.
A schematic diagram of APS-TBC layers and geometry parameters used in cracking driving force analysis.

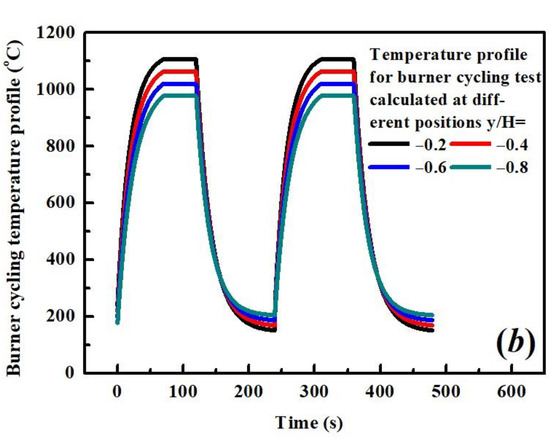
Figure 2.
Temperature profile calculated using Equation (1) for burner cycling test. (a) The solid curves are calculated temperatures at TC/BC surface and the dot points are measured temperature from test data [8]. (b) Solid lines are the calculated temperature curves across TC including thermal gradient effect.
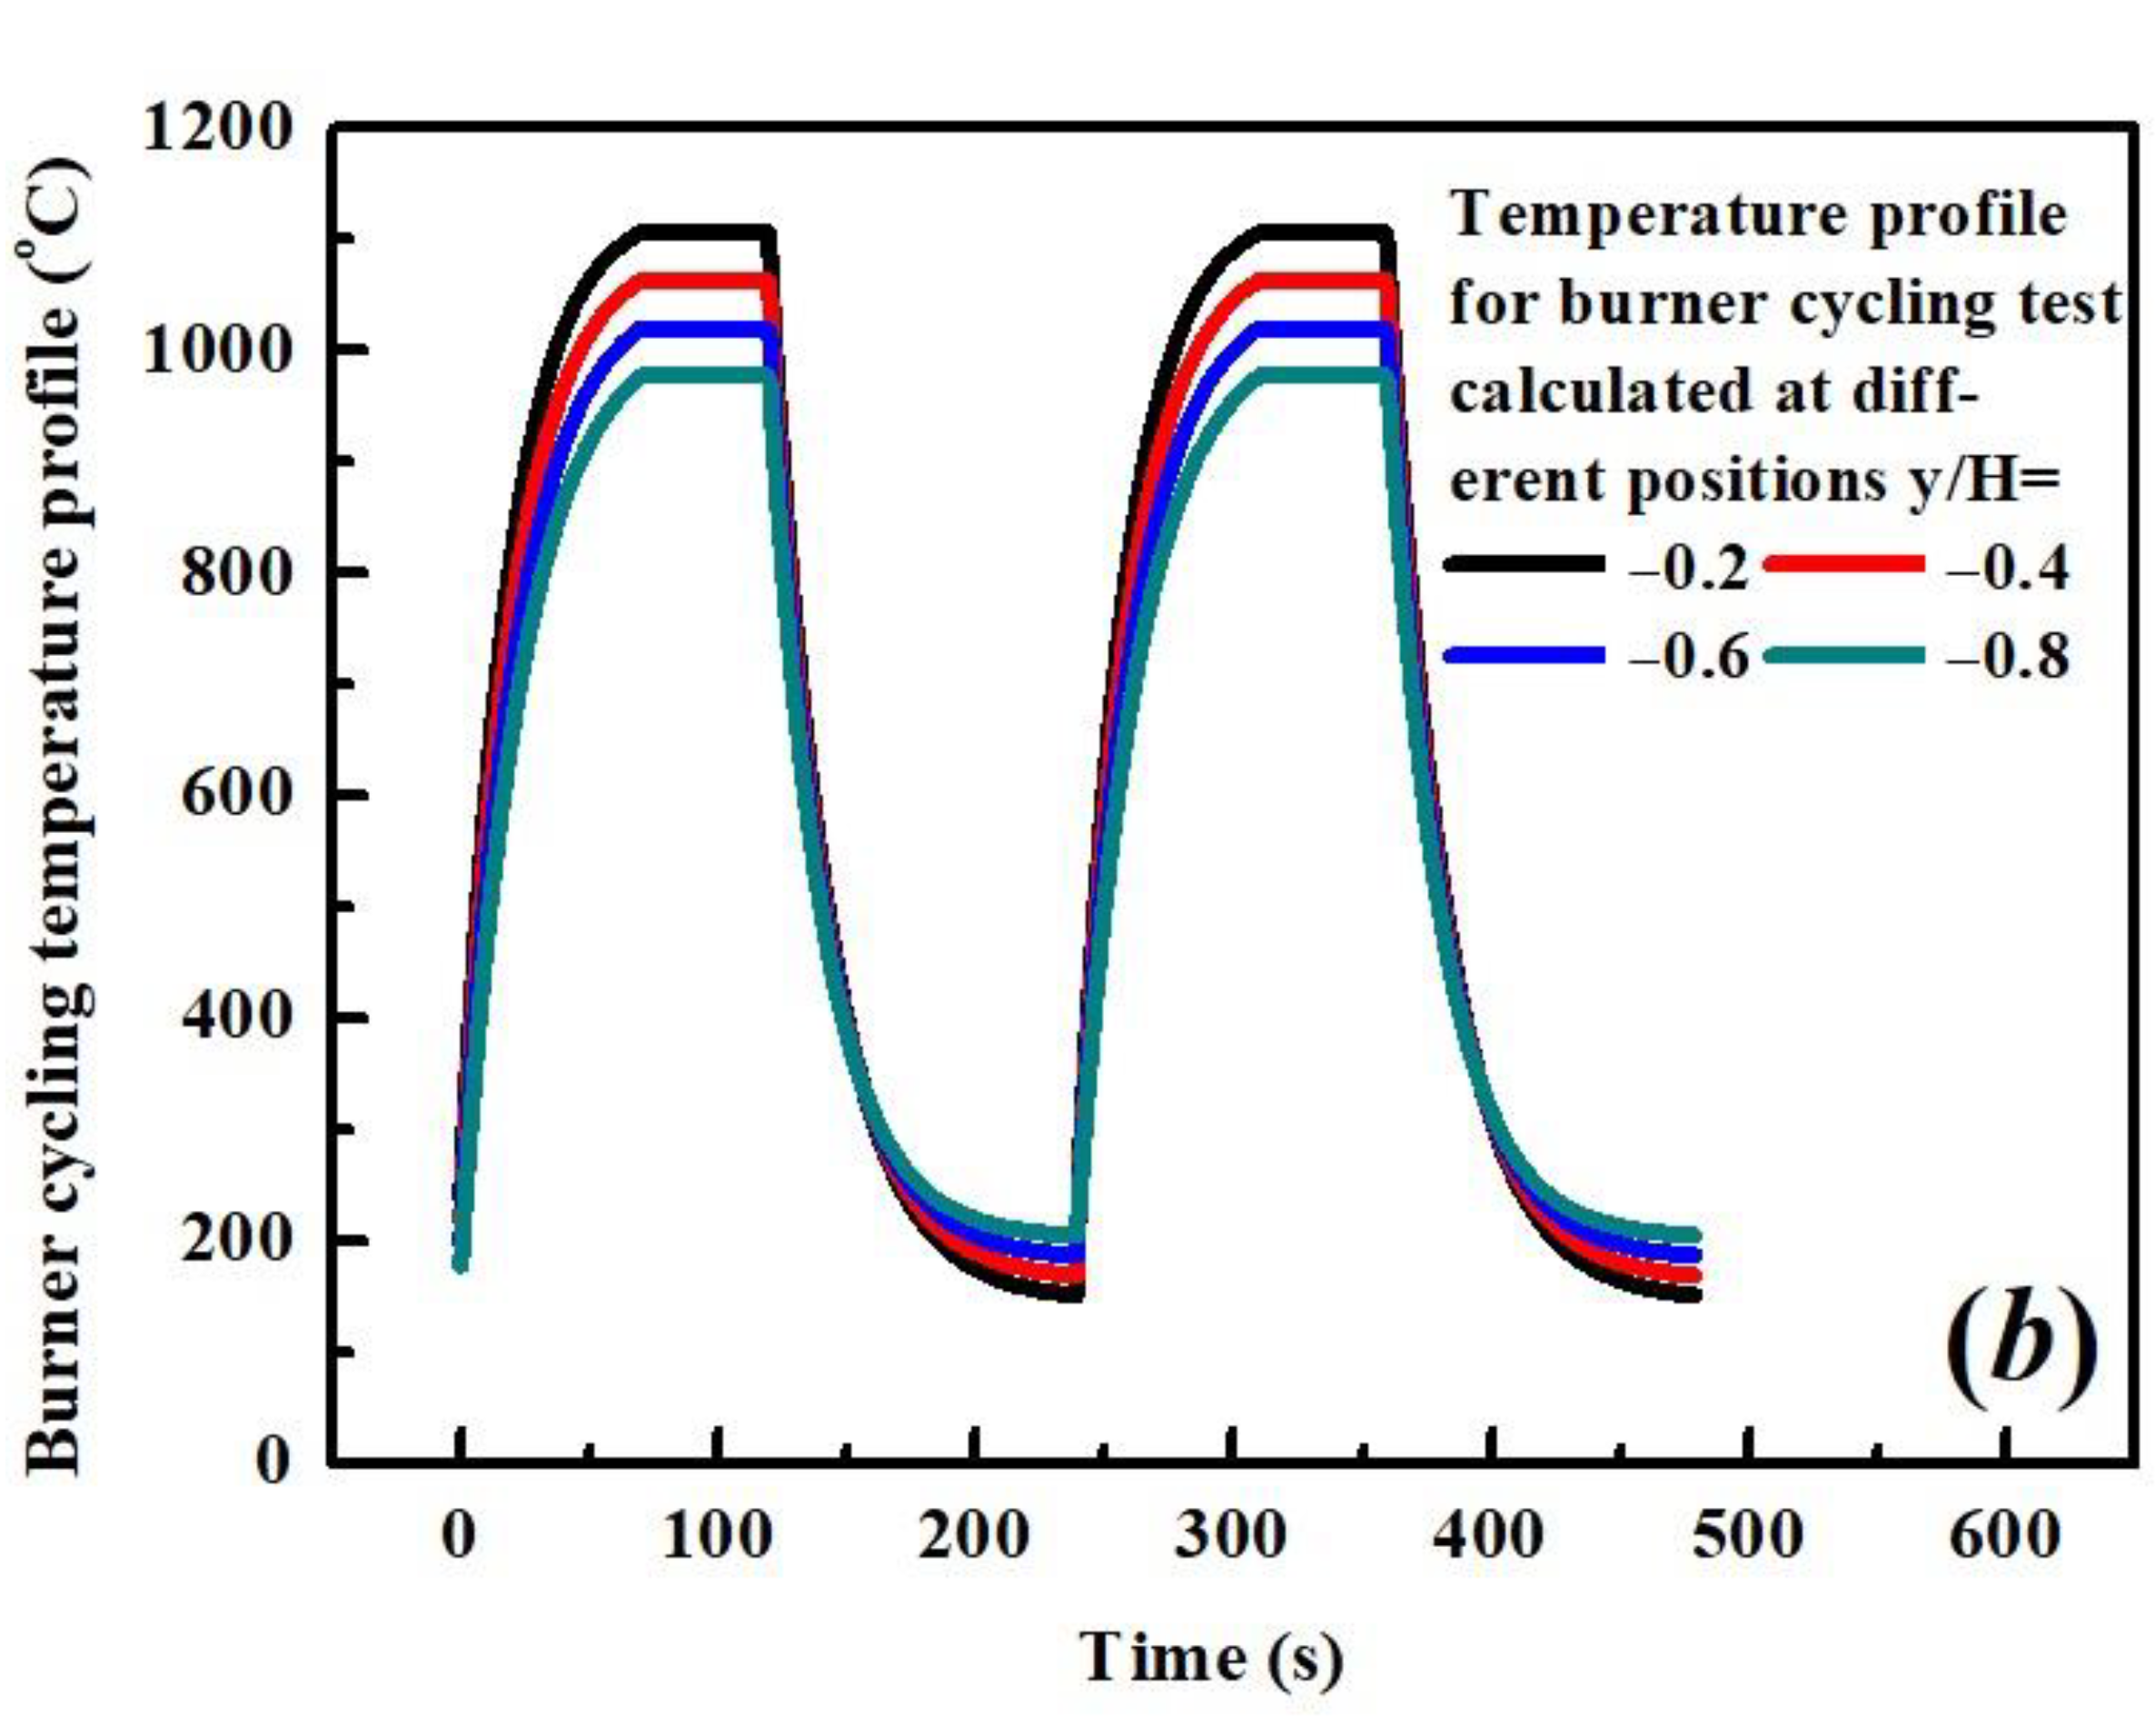
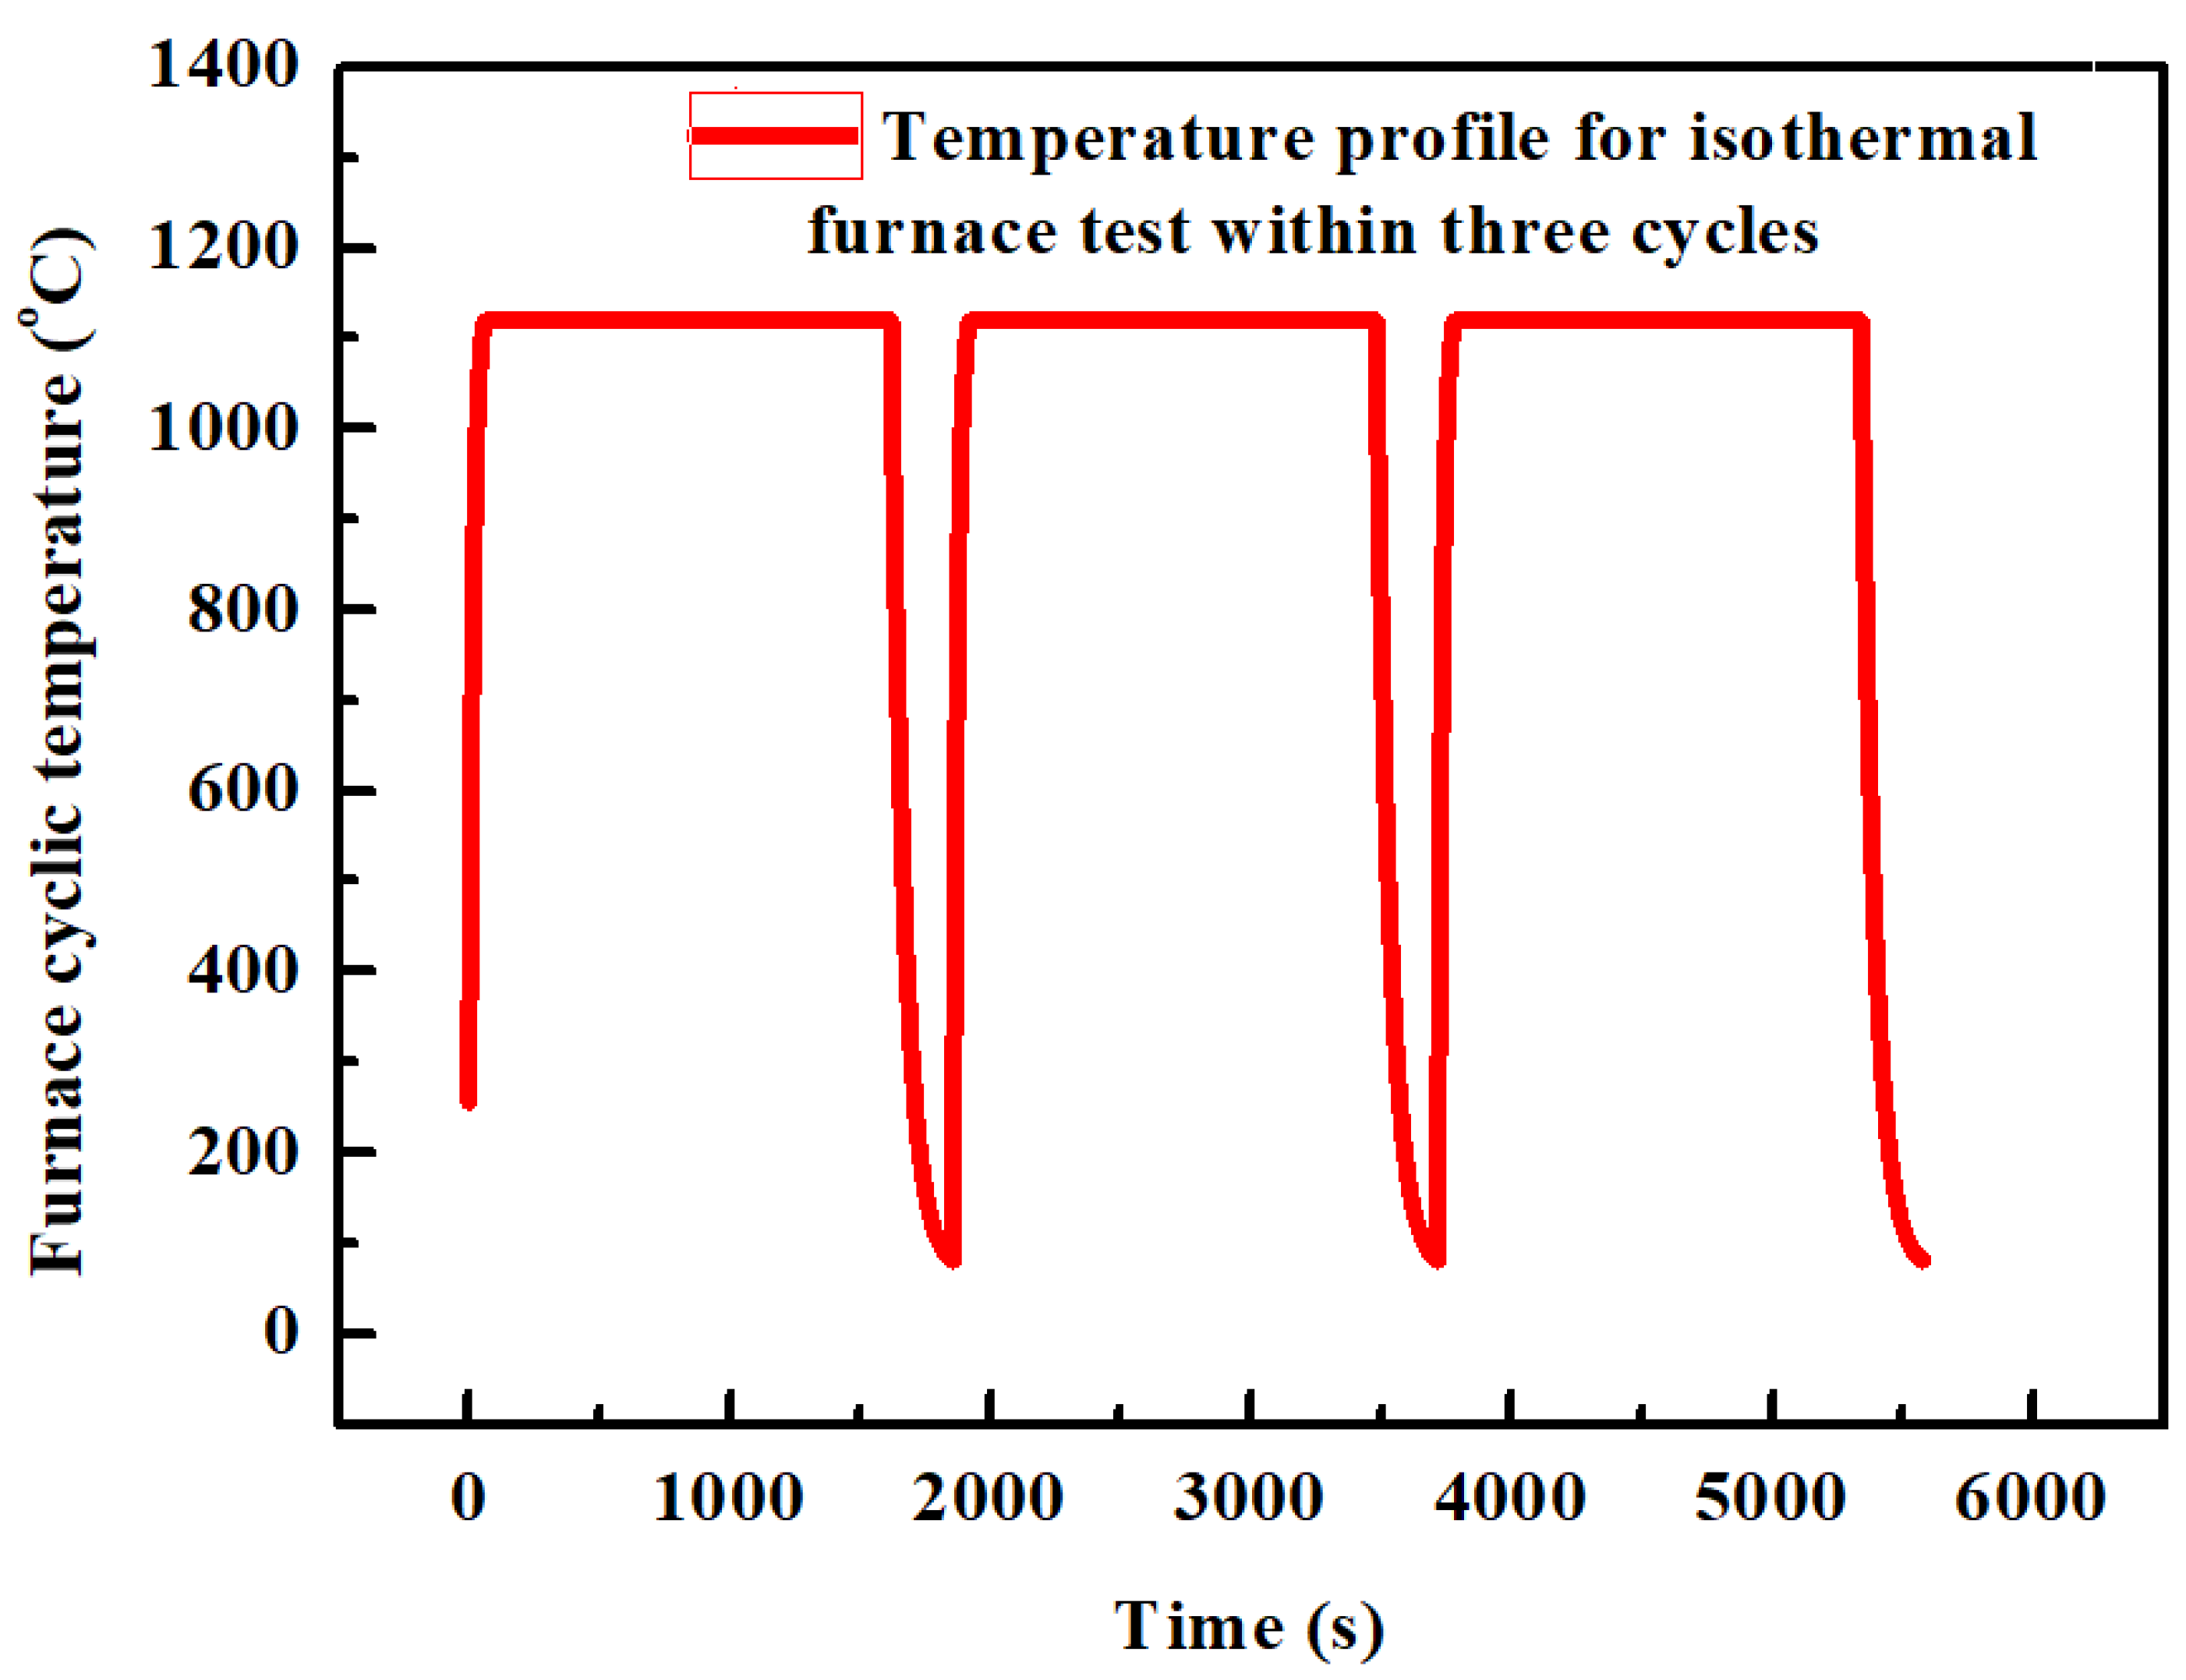
The temperature profile for isothermal furnace cycling test contains a rapid increase in temperature up to 1120 °C, assuming the time taken as 1 min [8], holding for 26 min, followed by 4 min of uniform cooling to 80 °C [8]. Accordingly, the temperature profile is plotted in Figure 3.
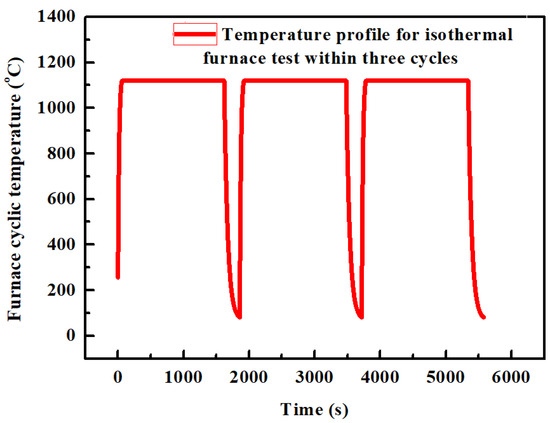
Figure 3.
Temperature profile under isothermal furnace cycling test.
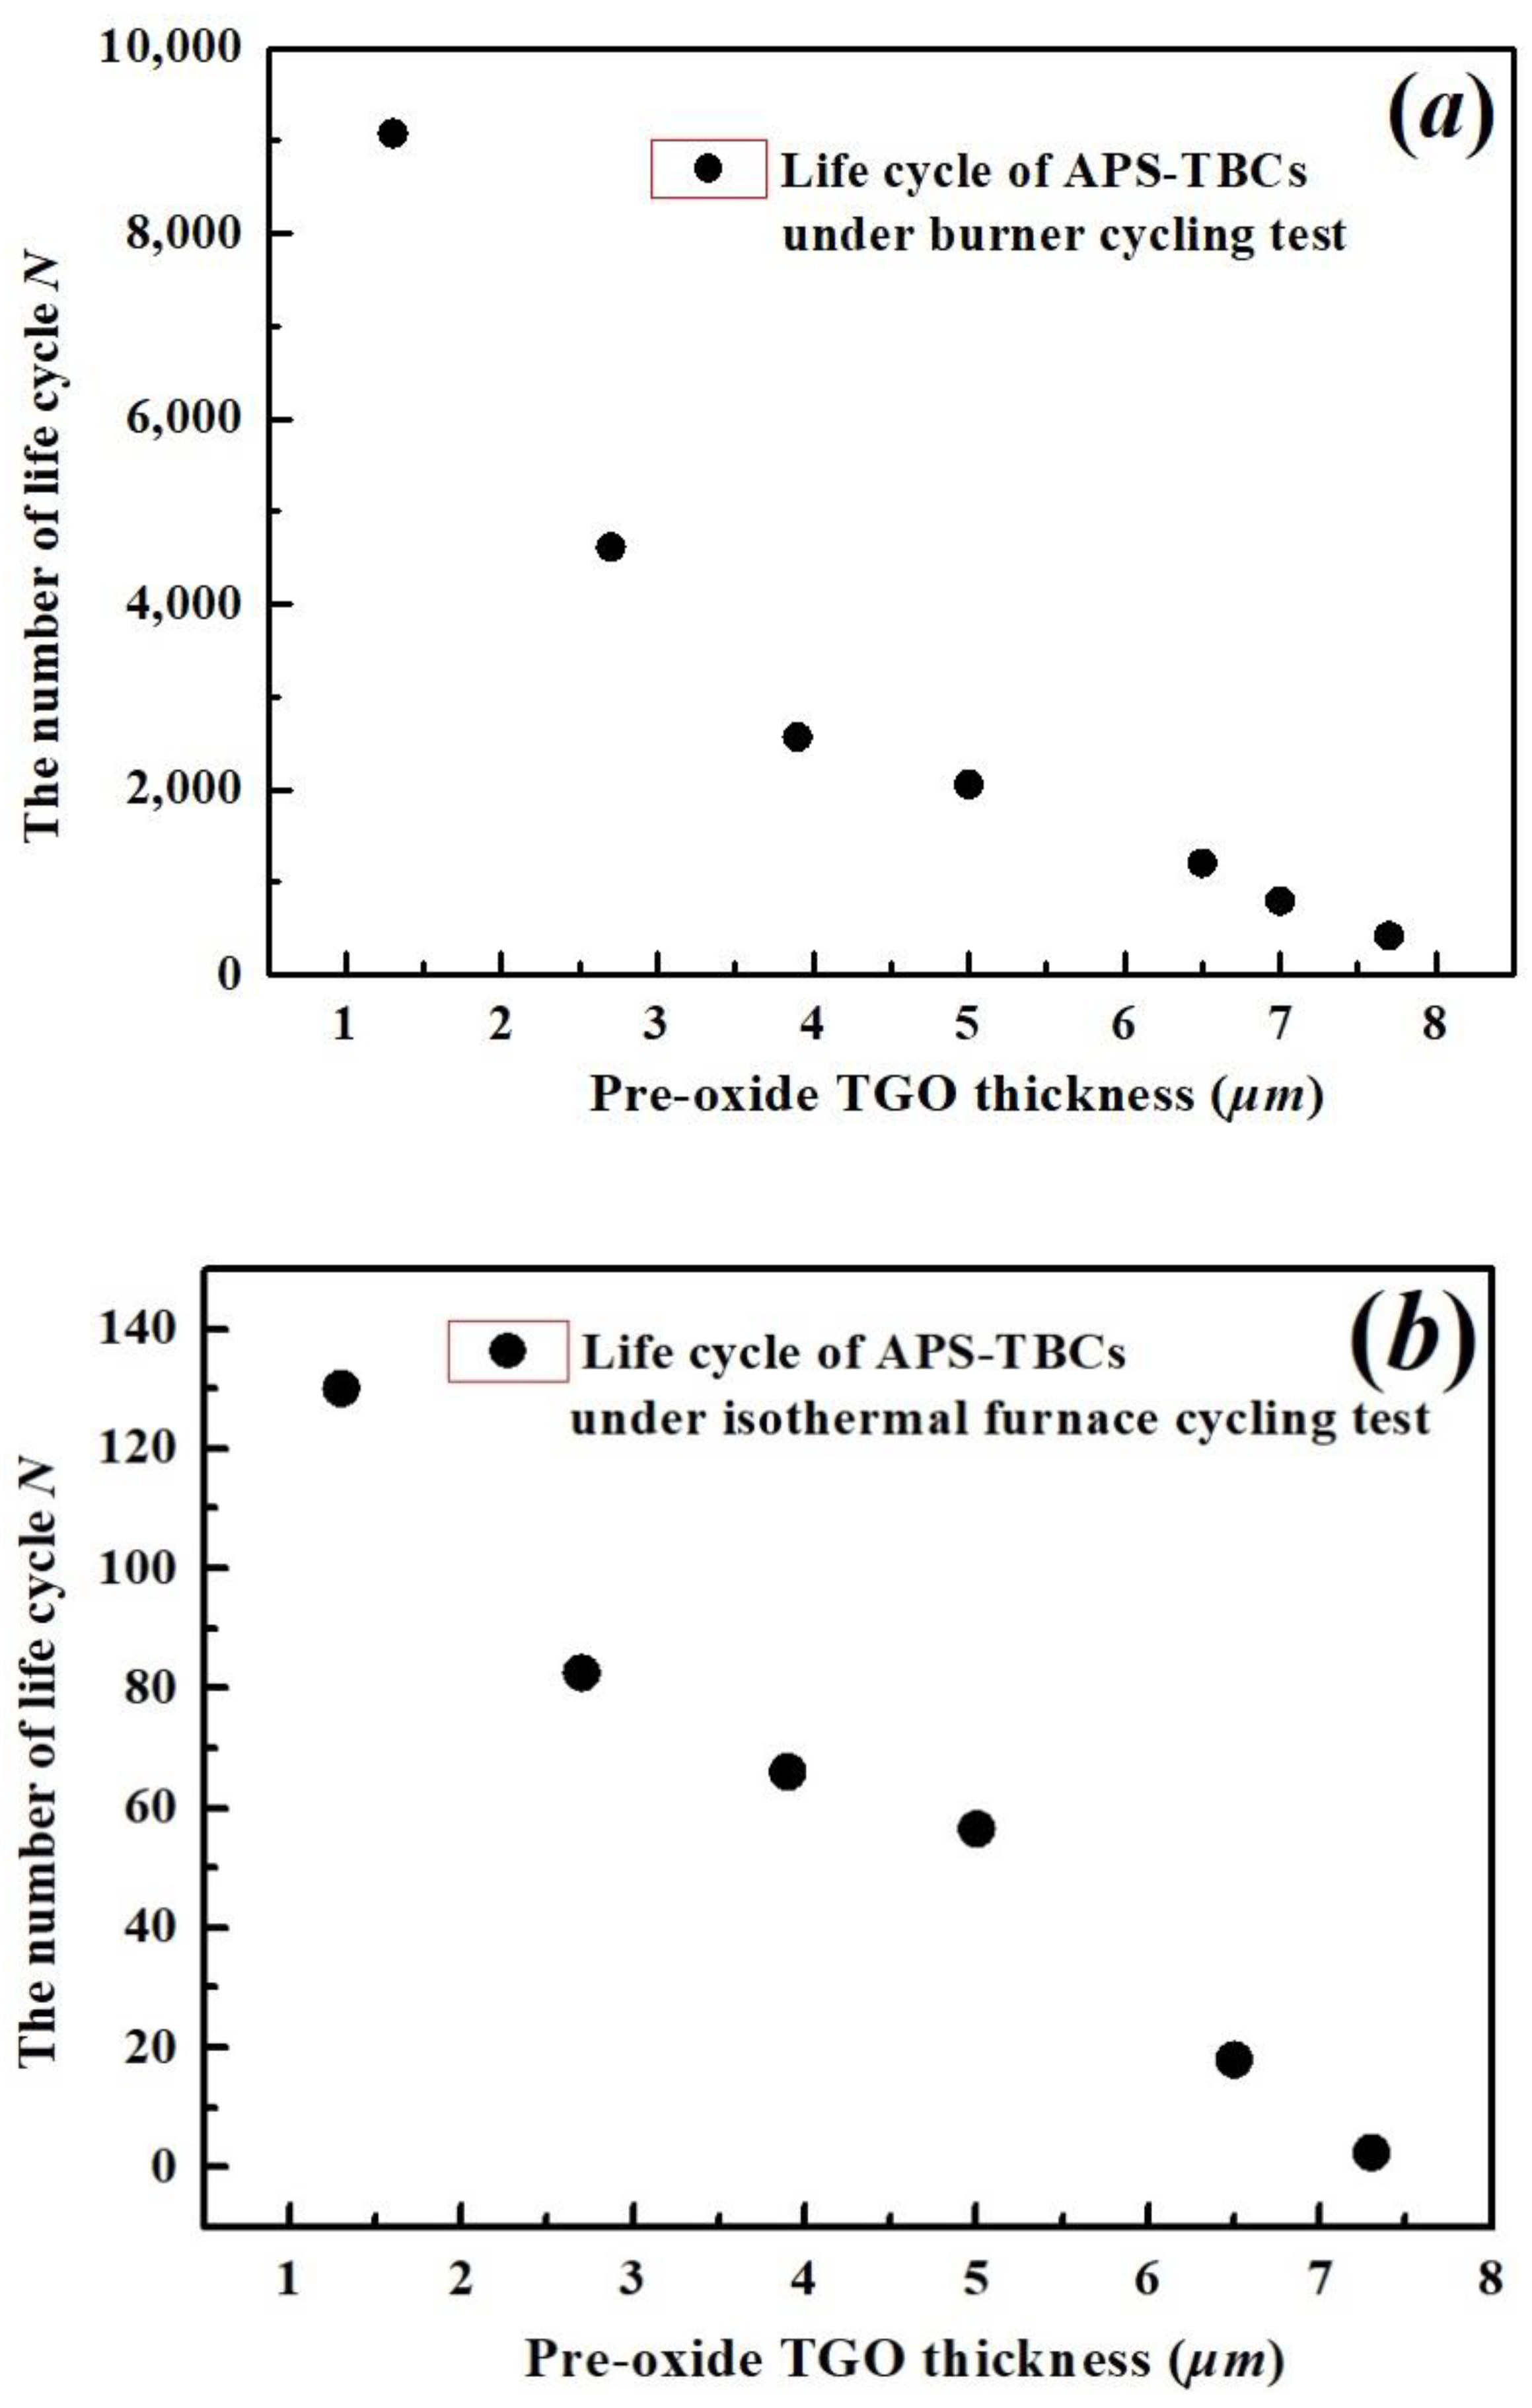
The life data based on different types of thermal cycling experiments are collected from [8] as a function of thickness of the pre-oxide layer and plotted in Figure 4.
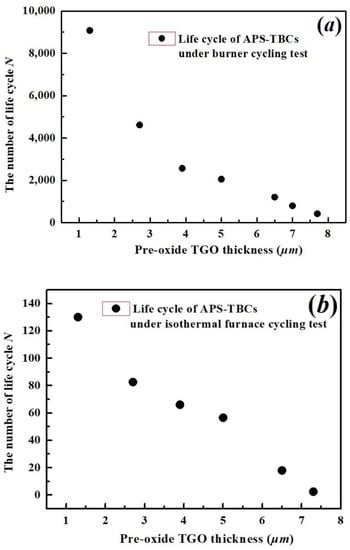
Figure 4.
Testing life cycle data of APS-TBCs under (a) burner cycling test; (b) isothermal furnace cycling test with respect to different pre-oxide TGO thicknesses [8].
The scope of the current study focuses on the ERR calculated close to the TC/TGO interface within the TC. Therefore, geometrical parameters describing TC and its interfacial morphology based on APS-TBCs are used in the following analytical models. The thickness H of the TC is 250 μm. Using the cosine function to describe the interfacial roughness, the average amplitude A and wavelength W are chosen as 30 μm and 80 μm, respectively [15]. Thus, with the 2D coordinate system shown in Figure 1, the roughness curve undulation can be described as
In addition, the β angle between the tangent to the roughness curve and the y axis is used to evaluate the effect of roughness level on the CTE ERR, where the angle is given by
All parameters evaluating the material properties during pre-heat treatment and following thermal cycling experiments are described in the supporting documents. A nomenclature is given below for all parameters used in the present study.
3. Analytical Models for Evaluating Energy Release Rate under Different Thermal Cyclic Experiments
It is possible to quantitatively evaluate the ERR using analytical formulae based on either isothermal furnace cycling testing data or burner cycling testing results in the presence of a thermal gradient. The effect of thermal gradient and thermal shock on durability of TBCs is reflected by the generation of extra crack driving forces, leading to crack nucleation and propagation within TC. Crack driving forces for the thermal cycling condition are also affected, i.e., the ERRs for CTE mismatch and TGO growth are different based on either isothermal cycling conditions or thermal gradient conditions. Using the burner cycling test data upon the presence of a thermal gradient, a new analytical expression is proposed to calculate the thermal residual stress generated as a consequence of CTE mismatch between layers upon cooling process. The analytical models used to evaluate the ERR generated due to (i) CTE mismatch, (ii) TGO growth for both isothermal and burner cycling experiments, (iii) thermal gradient and (iv) thermal shock for burner cycling tests are described below.
3.1. Analytical Models for TC ERR Generated Due to CTE Mismatch
3.1.1. Out-of-Plane Residual Stress due to CTE Mismatch upon Cooling vs. Calculated Positions
Neglecting the effect of the TGO layer and considering the bi-layer system, it is assumed that the temperature distribution is independent of calculated positions within TBCs for isothermal furnace cycling tests. That is, the temperature close to the TC/BC interface is assumed to be identical to that at any position within the TC, . The in-plane residual strain developed at the interface between the TC/BC due to CTE mismatch upon cooling is described by
where is the CTE strain, and are temperature-dependent coefficients of thermal expansion for BC and TC, respectively. is the temperature difference between the BC peak temperature at high-temperature dwell time and the BC temperature at a given time upon cooling . Equation (4) also applies to calculating the CTE strain close to the TC/BC interface within the TC when a thermal gradient exists, since . However, it is a challenge to estimate CTE strain generated at an arbitrary position (y = y0) within the TC since the temperature at a distance y0 away from the interface is different from that calculated at the interface (approximated by ). Therefore, a new equation is developed by revising the analytical expression in [19] to calculate the out-of-plane residual stress generated at a given position y = y0 within the TC due to CTE mismatch for a tri-layer system with a thermal gradient. The equation is given by
where is a fitting parameter. is the TC temperature difference at a given position y = y0 between the peak temperature at high-temperature holding time and the temperature at a given time upon cooling . is the coefficient of thermal expansion at a given time and position upon cooling. and are coefficients of thermal expansion for TGO and BC. The combination of geometrical parameters (A/W)(A/g(y)) suggests the effect of interfacial roughness on the amplitude of stress level.
The CTE stress is considered too large to be accommodated by pure elastic strain. Except for cracking of the TC, the rest of the elastic energy is released by inelastic deformation of the TC, which is introduced by yielding behavior that dominates at low temperatures. Considering the Von Mises yield criterion, the following equations for stress can be used once the calculated Von Mises stress is larger than the yielding strength given by
Here, is Von Mises stress, delta Kronecker and is hydrostatic pressure.
3.1.2. Position Identification of Maximum CTE Stress vs. TGO Thickness Based on Interfacial Roughness Model
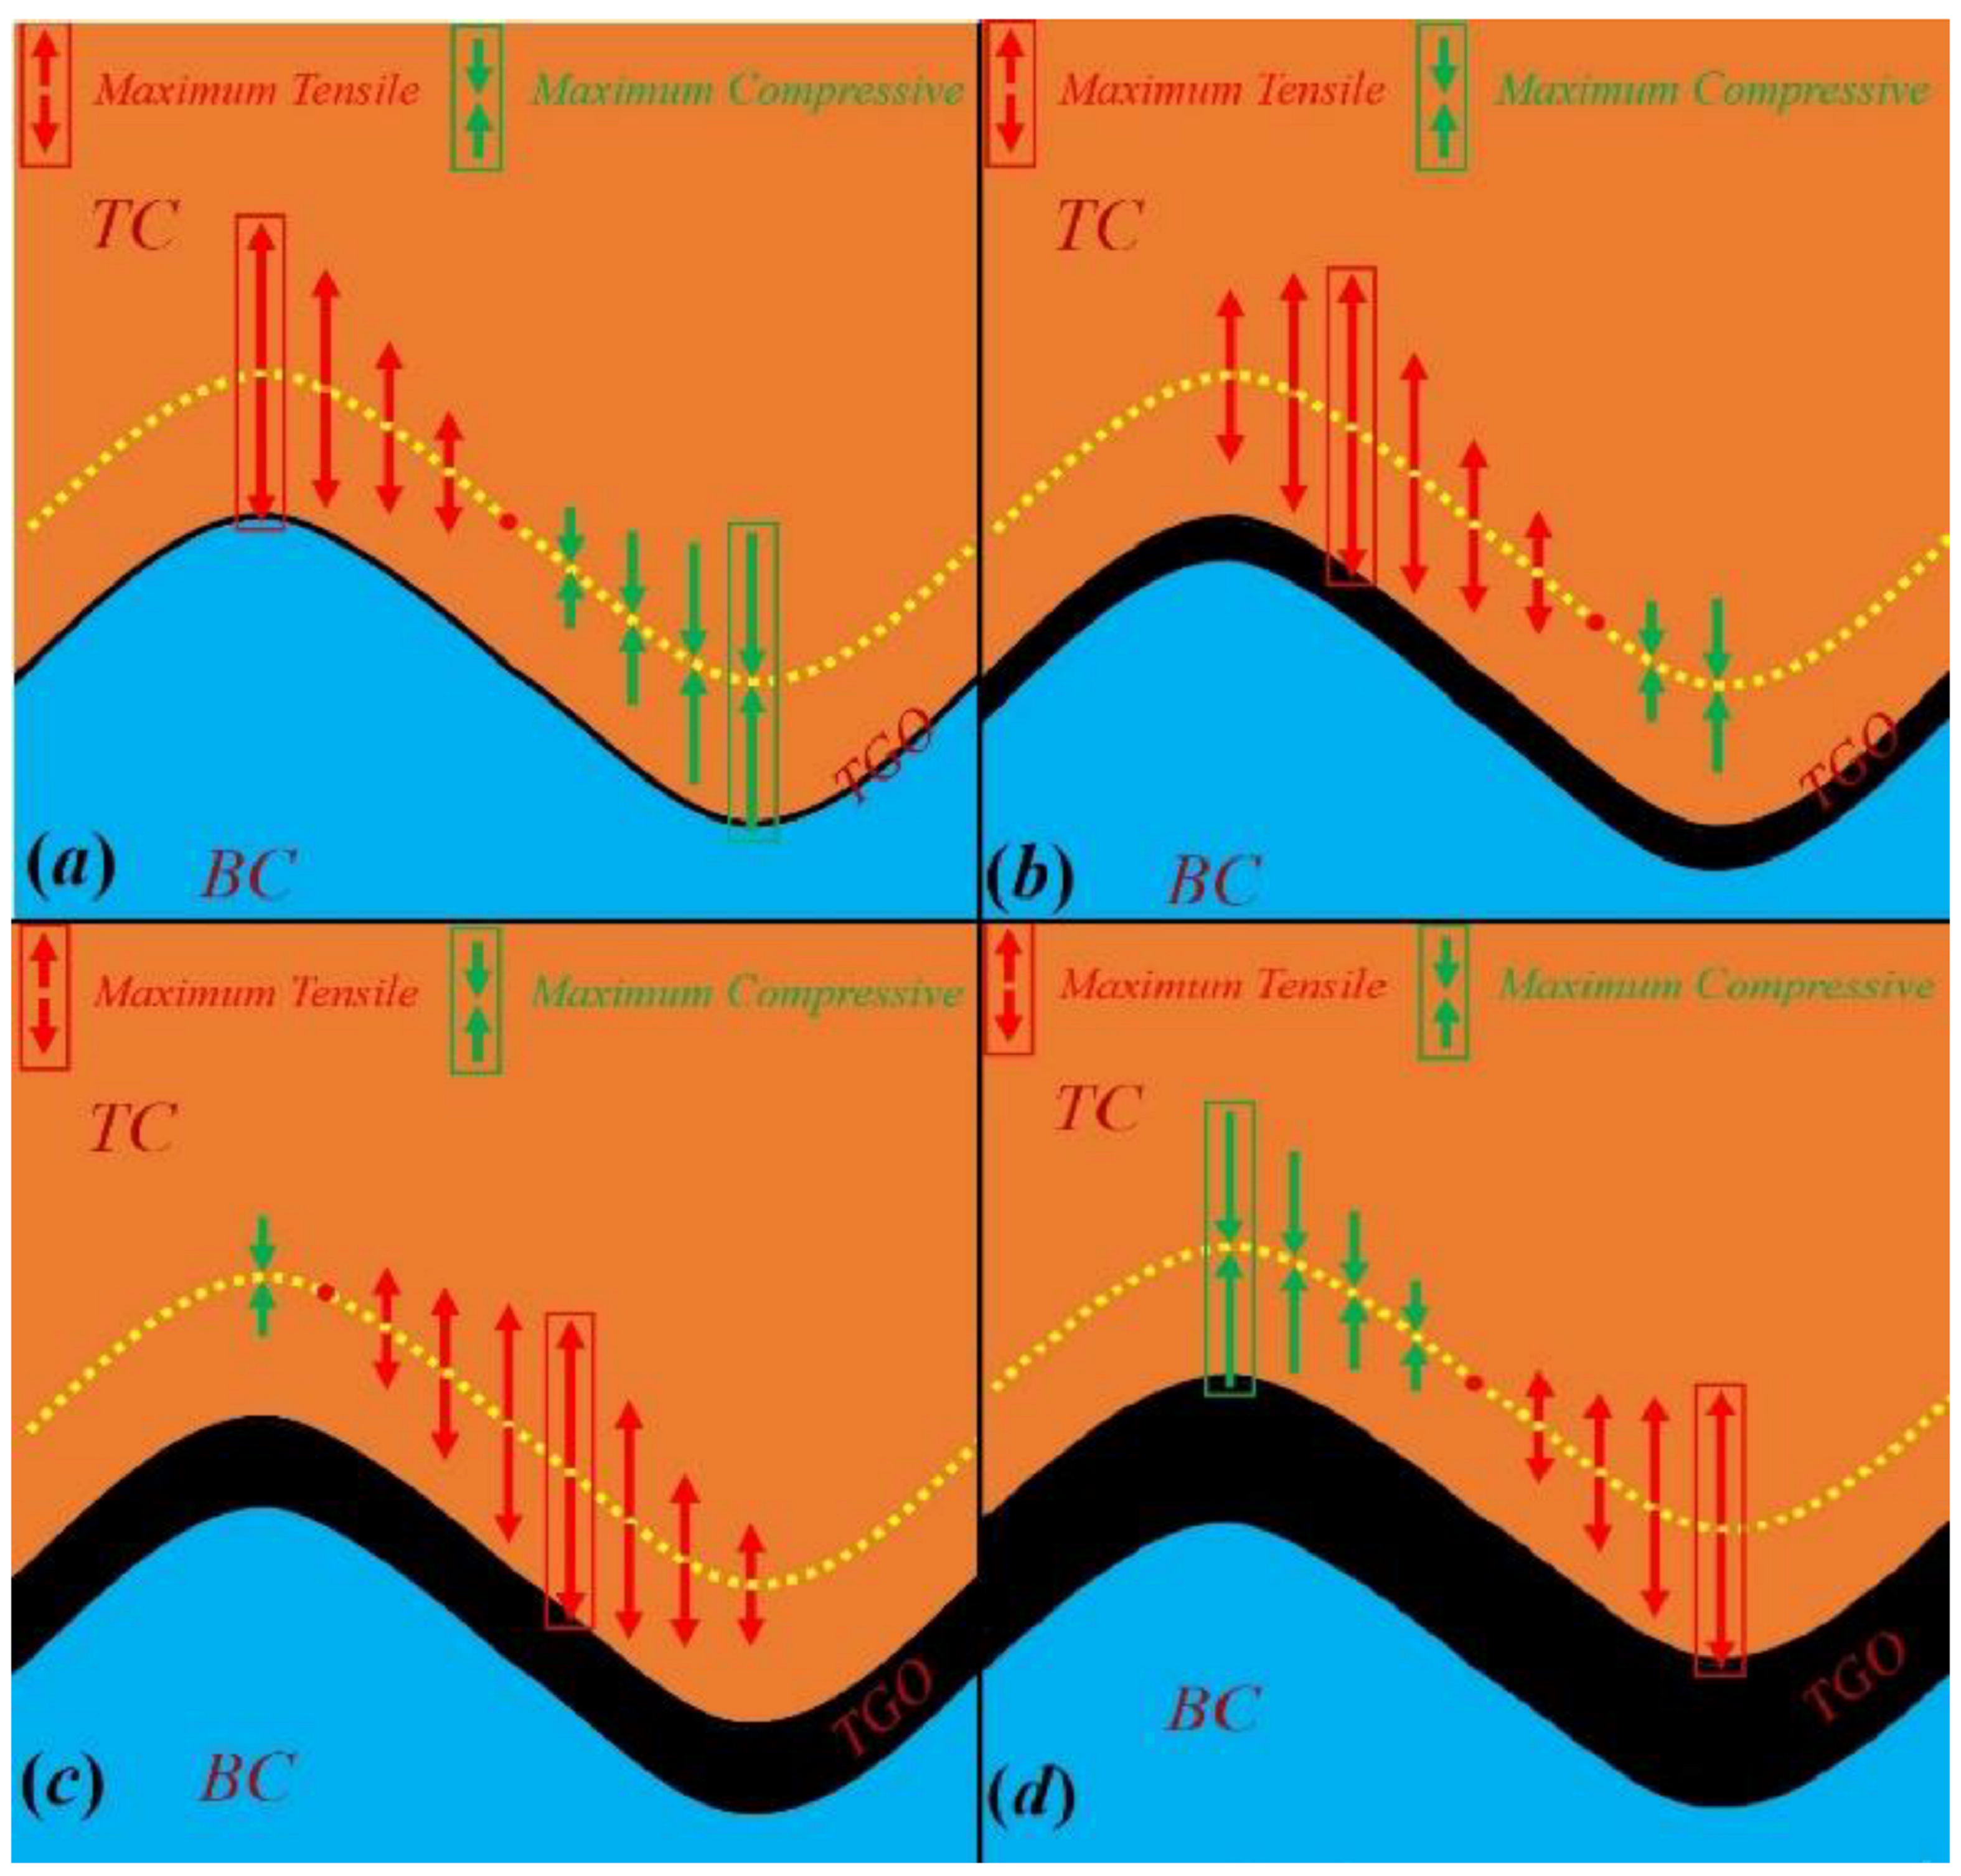
Typically, the failure mechanism of APS-TBCs reveals that delamination cracks are initiated at the BC where the out-of-plane tensile stress develops when the TGO is negligible. The out-of-plane residual stress state at a valley of the TC changes from compression to tension, which leads to horizontal crack nucleation. The delamination crack penetrates the thin TGO layer and results in spallation of the TC. Nevertheless, some FE studies have demonstrated the possibility of TC spallation due to the maximum tensile zone developed within the TC layer, i.e., the tensile zone was found at a peak of the TC at early stages of thermal cycles [37,38] and wings of interfacial roughness [38,39] as the TGO thickens. These FE studies introduced the pre-existing cracks in their modeling process and the stress inversion was also observed at the valley of the TC as TGO thickens. In addition, the shifting of crack routes was observed when TGO thickness reaches a critical value for both isothermal furnace cycling and burner cycling tests in the presence of thermal gradient [8]. That is, crack nucleation was initiated from defects of the interface between the lamellar structure (far away from the interface between TC/TGO) and propagated horizontally as TGO is thin. Meanwhile, the crack was found to propagate close to the interface when the TGO thickens. The crack identified close to the interface between TC/TGO layer is located at a valley of TC and triggers the spallation of TC, indicating that the maximum out-of-plane stress should be at the same position. Based on the discussion above, a model describing the location of the maximum out-of-plane tensile zone vs. TGO thickness can be proposed, Figure 5.
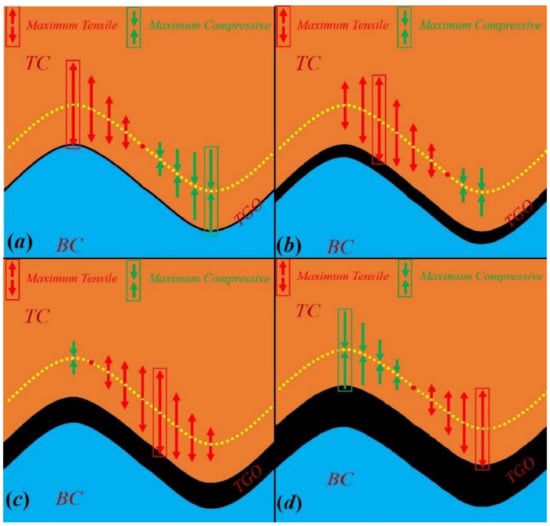
Figure 5.
The variation in the maximum tensile zone vs. TGO thickness. The positions of the maximum out-of-plane tensile stress are identified (a) at the peak of TC at early stage of thermal cycles; (b) at flank close to the peak of TC as the TGO thickens; (c) at flank close to the valley of TC at post-failure stage of life cycles; and (d) at valley of TC when TBCs fail due to formation of delamination cracks along the interface.
The location of the maximum out-of-plane tensile stress shifts downward from the peak of the TC to its valley along the interfacial as the TGO thickens. The x-coordinate indicating the position dependency for the out-of-plane stress can be derived from
where is the maximum TGO thickness where the position of maximum stress shifts to the valley of the TC. According to [8], the life cycle was estimated to be 0 cycles once TGO thickness reaches 8–9 μm. Therefore, it is reasonable to assume that = 8.5 μm, which corresponds to the TGO thickness when stress inversion at the bottom of the TC is complete.
With the proposed Equations (6) and (7), it is viable to evaluate the out-of-plane CTE stress at a given (x, y) coordinate for the current 2D APS-TBC from
3.1.3. Energy Release Rate of TC Cracking due to CTE Mismatch vs. Interfacial Roughness Profile
The stress intensity factors for both mode I and mode II degradation were given in [40] describing the crack driving forces where crack orientation was at an angle to the tensile out-of-plane stress. As illustrated in Figure 5, given the interface and angle β(x) between the out-of-plane residual stress and direction of crack propagation, the crack length b and out-of-plane stress, the ERR for crack triggered by CTE stress on roughness interface is described by
Assuming that the crack is initiated at position , where the maximum ERR is generated, it is critical to calculate the coordinate by setting the first derivative of Equation (9) equal to 0. Considering all x-dependent parameters in Equation (9) and integrating the value of A, W and yields
where
Solving Equation (10) obtains
where k is an integer. For the present coordinate system, is always negative. k equals 0 with varying from −6.11 μm to −40 μm as the TGO thickens from 1.3 μm to 8.5 μm. Thus, the ERR for the crack driving force generated by CTE mismatch within the TC can be estimated by integrating Equation (12) into Equation (9).
Equation (9) can be used to calculate the crack driving force at a given position for either isothermal furnace cycling conditions or burner cycling conditions. For the isothermal case, Equation (5) is simplified given , where , , and are independent of the calculated depth y. The difference between the calculated ERR for isothermal and burner cycling tests and those in the presence of thermal gradient will be discussed in Section 4.
3.2. Analytical Models for TGO ERR Generated Due to TGO Growth
As described in Section 2, all specimens in Ref. [8] experience isothermal preheating treatment at elevated temperature, with various durations, to produce pre-oxide TGO scales with different thicknesses. These specimens are then utilized to undergo either isothermal furnace cycling testing or burner cycling testing. Similar to the form of analytical expression for the crack driving force due to CTE mismatch, the ERR for cracks triggered by TGO growth stress is described as [15]
As mentioned in Section 2, there exists a large difference between TGO growth behavior under the two types of thermal cycling tests for the current study. The growth of the TGO layer under burner cycling testing is limited due to moderate temperatures at the BC surface and inadequate elevated exposure time. For the isothermal cycling test, the growth of the TGO layer is more evident for the group of specimens that have a thinner pre-oxide TGO layer. The difference resulting in TGO ERR from two thermal cycling tests will be discussed in Section 4.
3.3. Analytical Models for TC ERR Generated Due to Thermal Gradient
The introduction of back-side cooling during the high-temperature dwell period and rapid heating/cooling leads to a large thermal gradient under the burner cycling test. This temperature difference within the TC between the surface and position close to the TC/TGO interface is a critical crack driving force, where the crack might form in a different way. That is, the isolated crack forms and propagates parallel to the interface. In the other case, the crack is connected to the free edges of the TC [41], Figure 6.
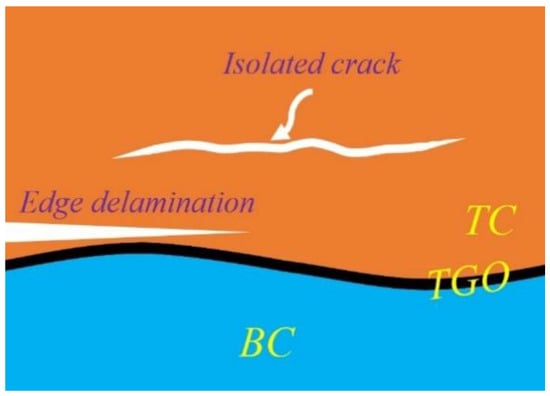
Figure 6.
Schematic illustration of three potential delamination modes of TBC in the presence of a thermal gradient [41].
The methods used to calculate the ERR depend on the thermal gradient developed either during high-temperature dwell period or rapid cooling. Two different analytical methods are demonstrated in the following sections.
3.3.1. The ERR Generated Due to Thermal Gradient Developed at High-Temperature Dwell Period
The analytical solutions to calculate the crack driving force due to the high heat flux developed for isothermal high temperatures can be found in [41]. As shown in Figure 6, two possible crack routes are given and corresponding ERRs are proposed.
For an isolated interface crack developed within the TC parallel to the interface, a thermal gradient is assumed between the upper and lower faces, considering the crack as insulated where this temperature difference facilitates crack propagation, Figure 6.
The corresponding ERR and mode mixture for isolated interface crack developed under isothermal heat flux environment are described by [41]
and are the stress intensity factors for mode I and mode II.
For the crack connecting to the free edge of the TC, there are two factors that need to be considered, including (i) the effect of thermal gradient that induces the bending moment into TBCs and (ii) heating TBCs above induces CTE misfit between TC and BC during high-temperature dwell period, which further results in residual compression within the TC. The corresponding steady-state ERR for edge delamination crack developed under isothermal heat flux is described by
where and describe stresses due to CTE mismatch and thermal gradient, respectively.
3.3.2. ERR Generated Due to Thermal Gradient Developed upon Cooling
Analytical solutions have been proposed to calculate the crack driving force due to thermal gradient generated from rapid temperature change upon cooling [36]. Depending on the position where the crack was identified, the mixed mode ERR and mode mixture are determined when the crack is close to the interface ( Figure 6) as [36],
For a crack located above the interface ( in Figure 6), the mode I stress intensity factor and ERR are described by
The crack driving force is determined using different equations for a crack nucleated at the interface or above the interface .
3.4. Analytical Models for TC ERR Generated Due to Thermal Shock
Due to the rapid heating/cooling process under the burner cycling test, the effect of thermal shock on the nucleation of a delamination crack should be considered and included in the total ERR. The cracking driving force for thermal shock with the existence of thermal gradient was evaluated by Fleck et al. [22]. The mode I and mode II stress intensity factors , are used to calculate the mixed mode ERR and mode mixture for thermal shock developed under burner cycling test, described by
4. Results and Discussion
The abovementioned energy release rates suggest that the crack might nucleate at a different stage within the thermal cycle, i.e., the crack driving force generated due to CTE mismatch plays a role only in cooling. Although the growth of the TGO layer occurs mostly during the high-temperature dwell period, the TGO ERR was generated during the preheat treatment, where the pre-oxide TGO layer is formed. The effect of thermal gradient and thermal shock on the durability of APS-TBCs might only be estimated under burner cycling test. In order to evaluate the effect of specific ERR (i.e., generated within a specific duration in the thermal cycling test) on the lifetime, a normalization process is introduced where the equivalent ERR is evaluated through
where indicates the layer where the crack driving force is calculated, indicates the type of ERR that is responsible for the corresponding crack nucleation and propagation, is the stage of thermal cycle (heating/holding/cooling) and is the total time for specific stage within a thermal cycle. For example, if the holding and cooling period for a burner cycling test are 50 s and 120 s, then 50 and 120, respectively. stands for the ERR generated within layer at each second of . and are the number of thermal cycles and life cycles, respectively. The numerator of Equation (22) is the sum of specific ERR generated for the entire lifetime, where the denominator is lifetime as a function of pre-oxide TGO thickness. Equation (22) is capable of evaluating the equivalent ERR with respect to pre-oxide TGO thickness.
Another criterion used in the current study estimates the average ERR as a function of the number of thermal cycles, as indicated by
The numerator in Equation (23) is the sum of specific ERR generated within one cycle. Equation (23) enables the evaluation of the average ERR generated within a specific duration as a function of thermal cycle. The following discussion will address the different type of ERRs.
4.1. Calculated TC-Equivalent Energy Release Rate Generated Due to CTE Mismatch
As described in the preceding section, the ERR due to CTE mismatch only develops upon cooling during thermal cycles. Therefore, the equivalent ERR due to CTE mismatch can be written as
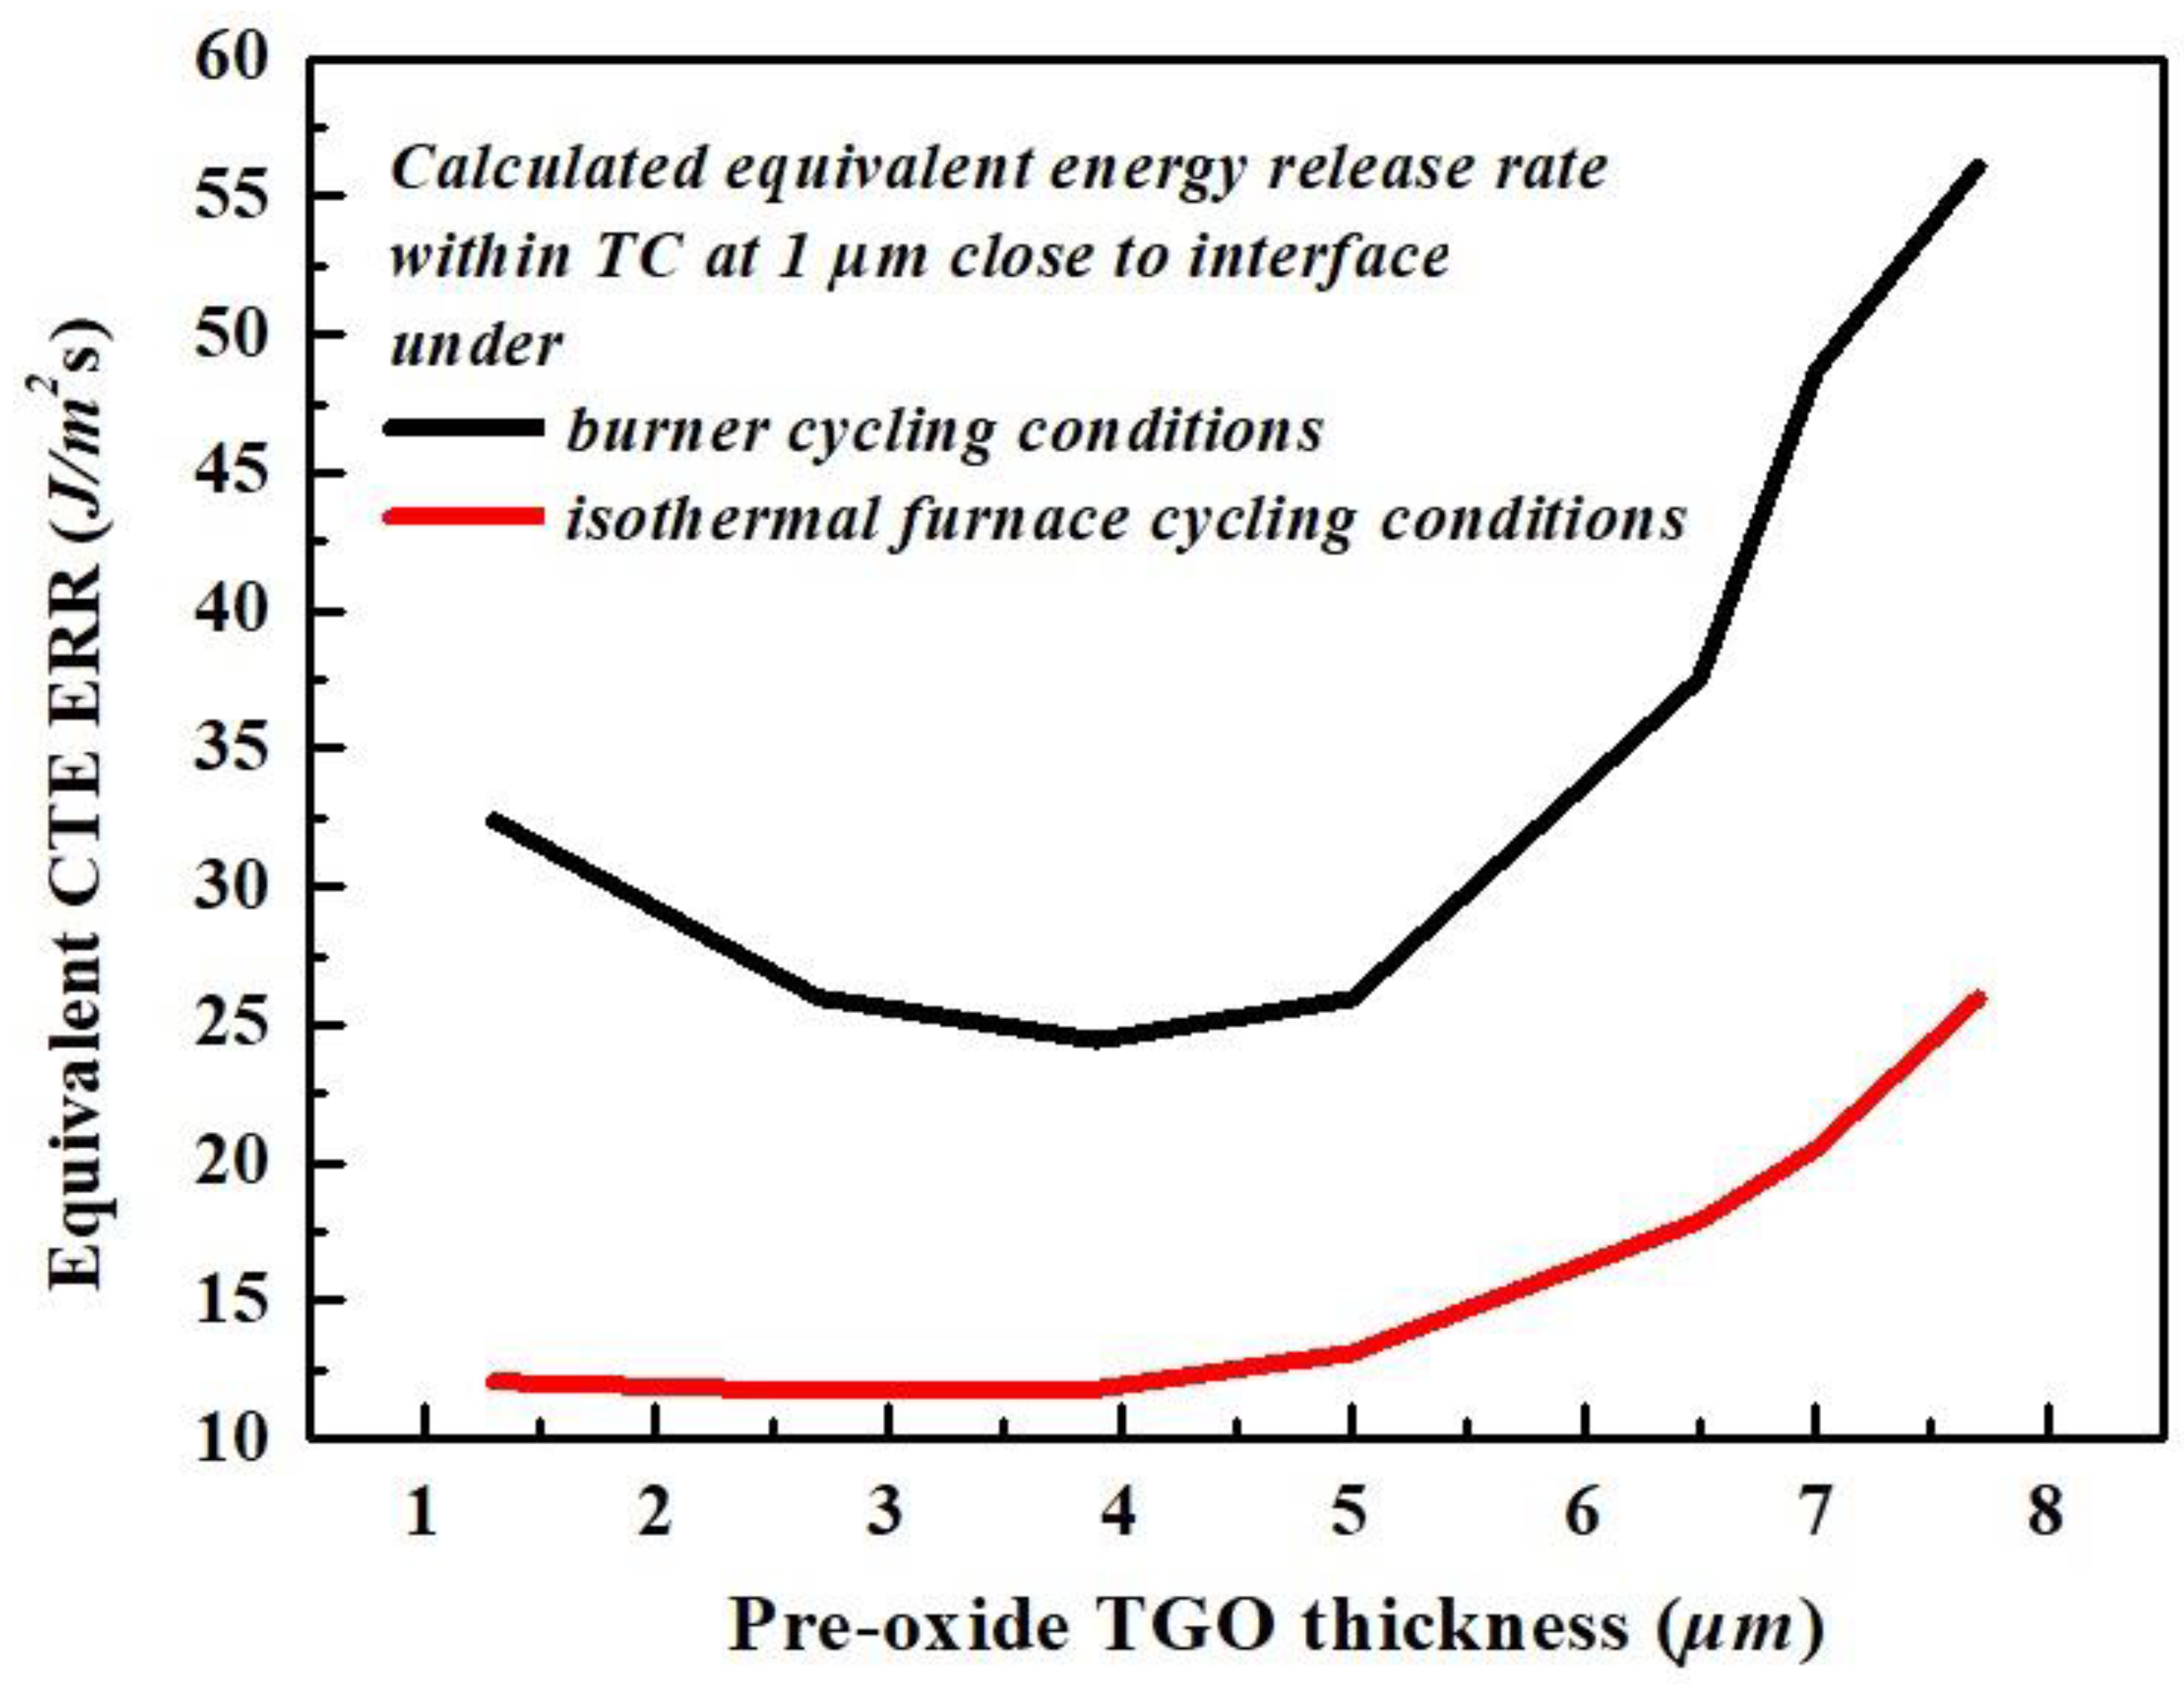
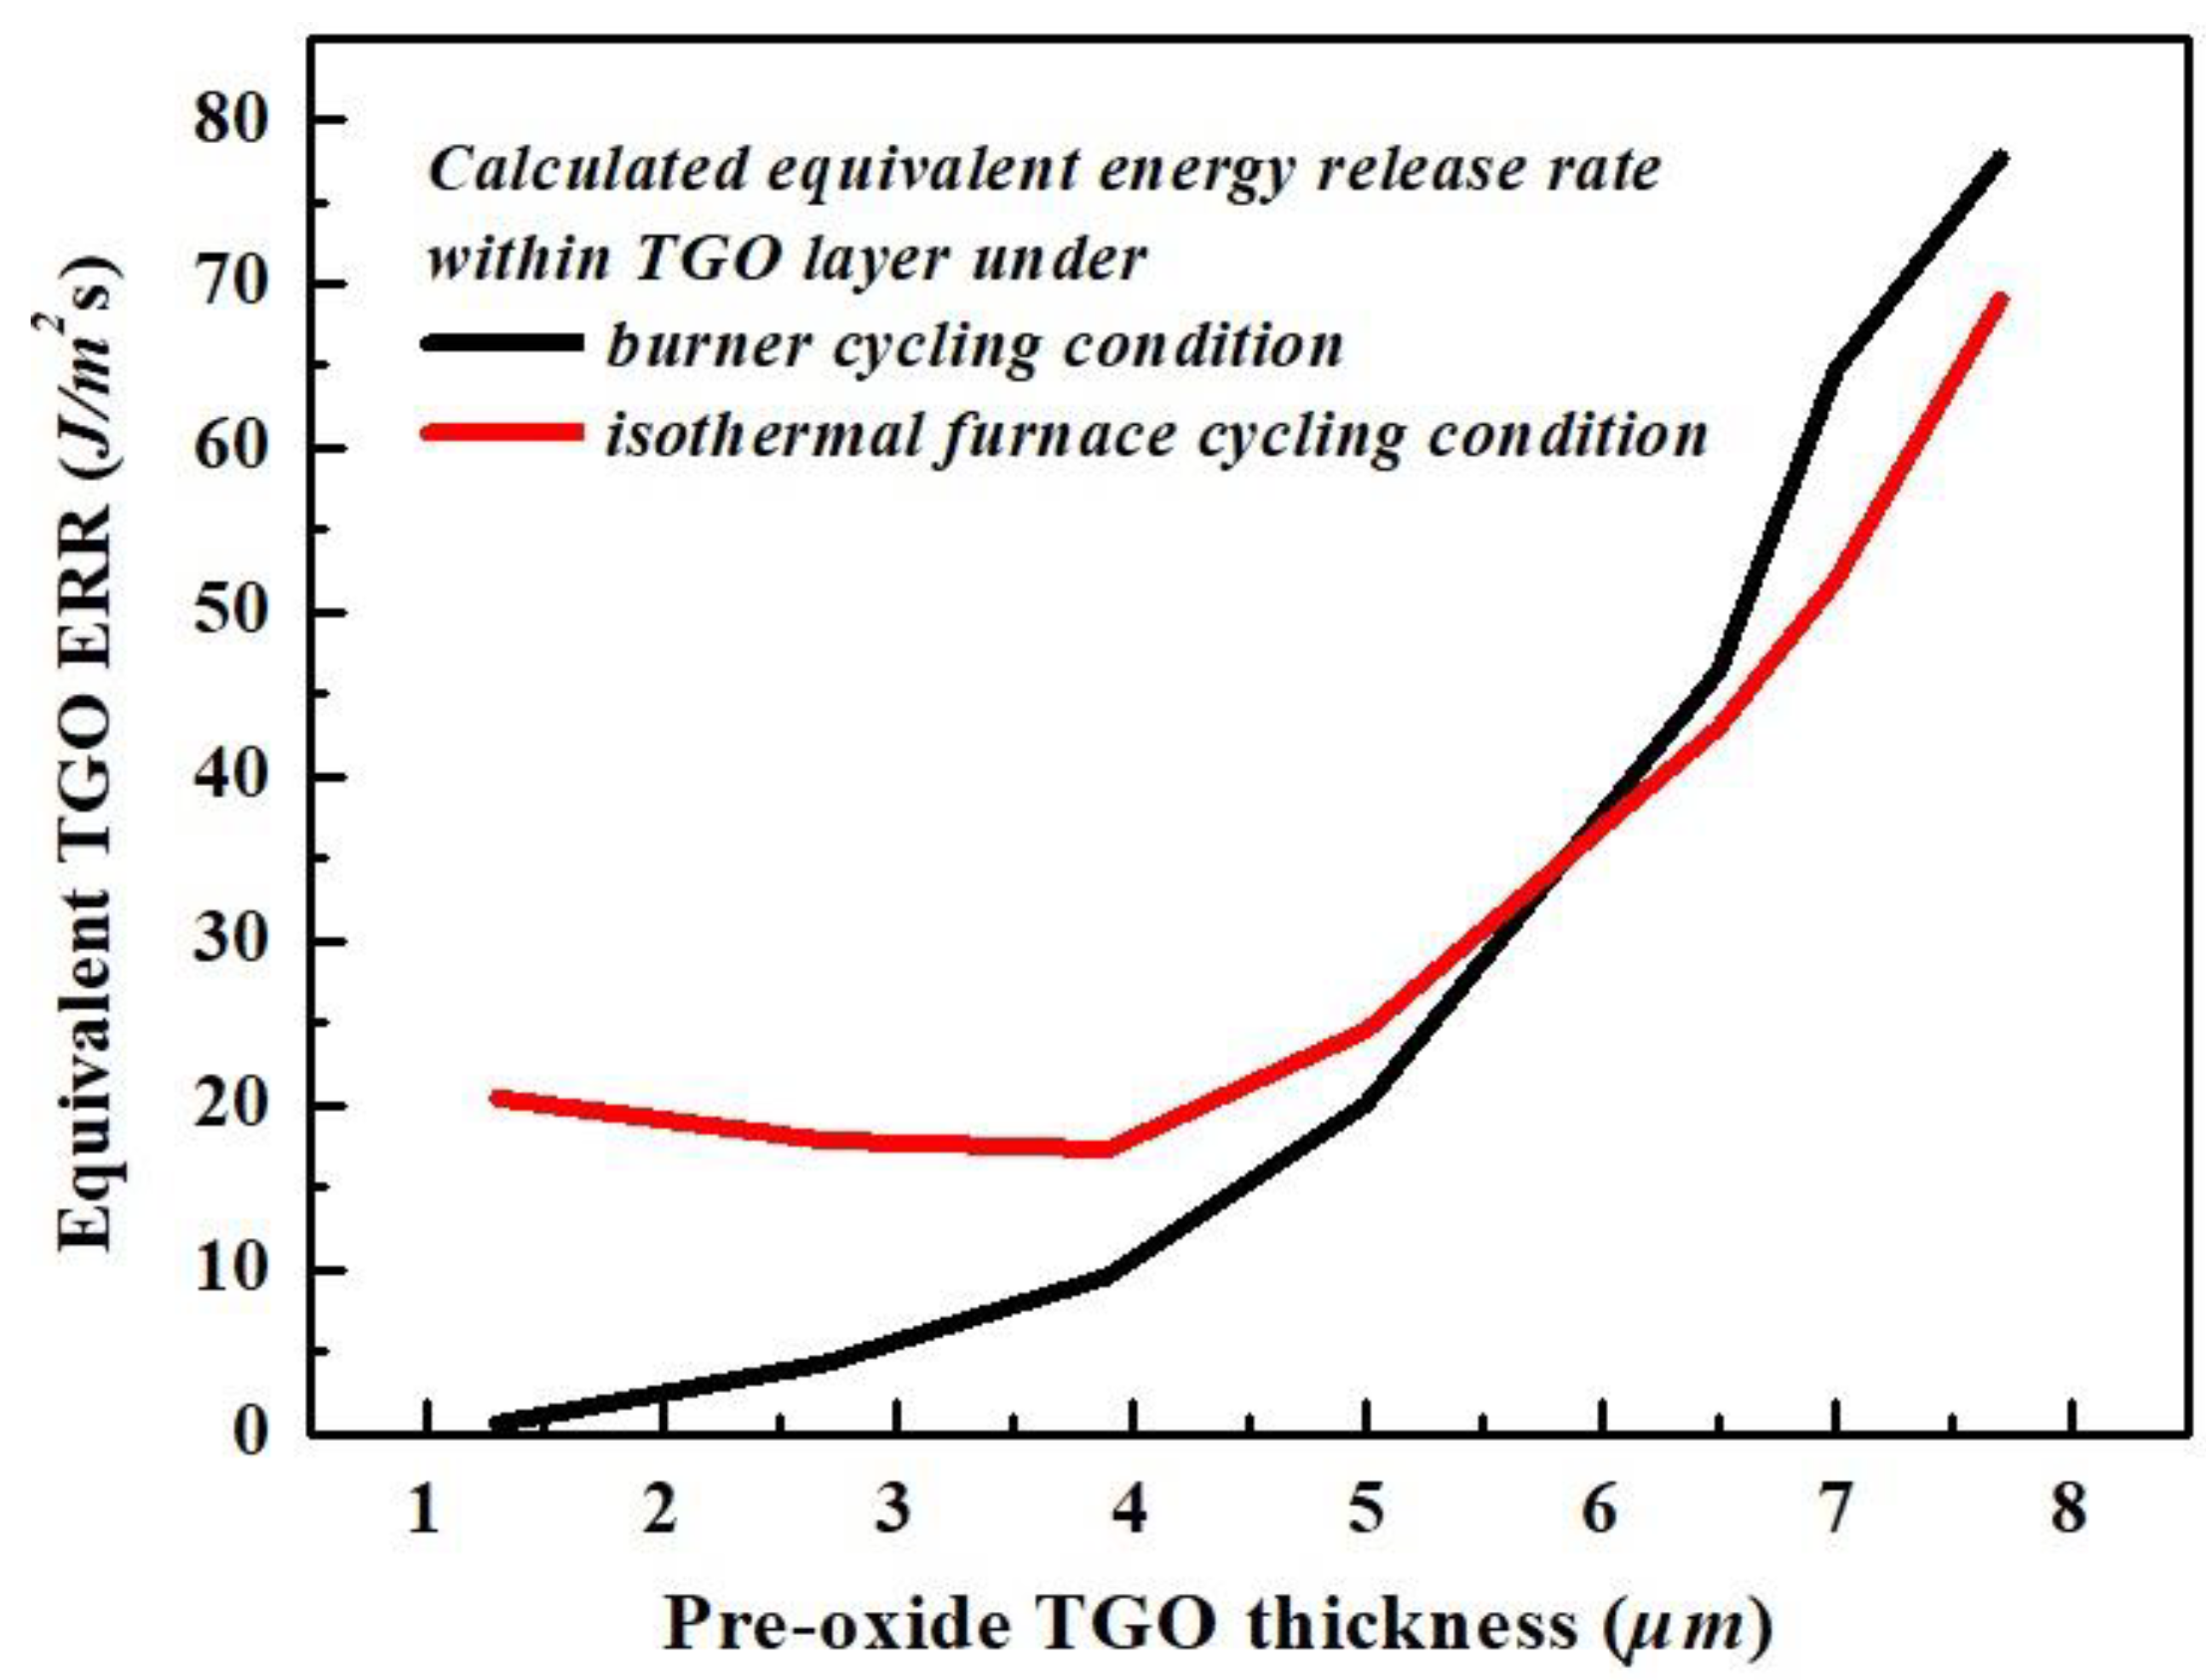
The equivalent ERRs are calculated 1 μm away from the interface within the TC and are shown in Figure 7 for the isothermal furnace cycling test and burner cycling test.
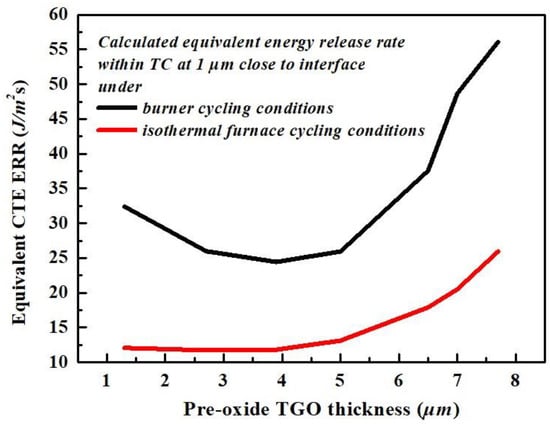
Figure 7.
The calculated equivalent CTE ERR vs. the pre-oxide TGO thickness under isothermal furnace cycling condition and burner cycling condition.
Each thermal cycle in the burner cycling test contains 120 s cooling time, which yields 120 of calculated . The calculated evaluates the effect of the sum of CTE ERR generated upon cooling for all thermal cycles on the scale of lifetime. With the calculated ERR based on a flat interface , multiplying the angle parameter sin2β, there is inevitably a decrease in CTE when the effect of geometry of roughness surface is included (wings of imperfection). On the other hand, if the value of the mix mode fracture toughness of TC is assumed to be independent of position within the TC, the decreasing CTE ERRs, estimated as pre-oxide TGO thickness, vary from 1.3 μm to 3.9 μm, shown in Figure 7, indicating that there might be less CTE ERRs generated as the maximum out-of-plane tensile stress is identified at wings of imperfections. The cracking process might be inhibited or slowed at wings of imperfections due to the engineering-designed interfacial roughness characteristics, frequently mentioned as the effect of “mechanical interlocking” between layers [42,43,44,45,46,47]. However, interfacial roughness with excessive amplitude would induce extra tensile stress at the peak of the TC according to the FE analysis [48]. This, in turn, facilitates crack initiation at the early stages of life cycle. Therefore, the balance between the effect of cracking inhibition and the effect of stress concentration (both due to TC roughness) is critical for controlling cracking behavior and, hence, the durability of APS-TBCs.
Each thermal cycle in the isothermal furnace cycling test contains 480 s cooling time, which yields 480 of calculated . Two conclusions can be produced by comparing the calculated equivalent ERR from burner cycling test to the isothermal furnace cycling test .
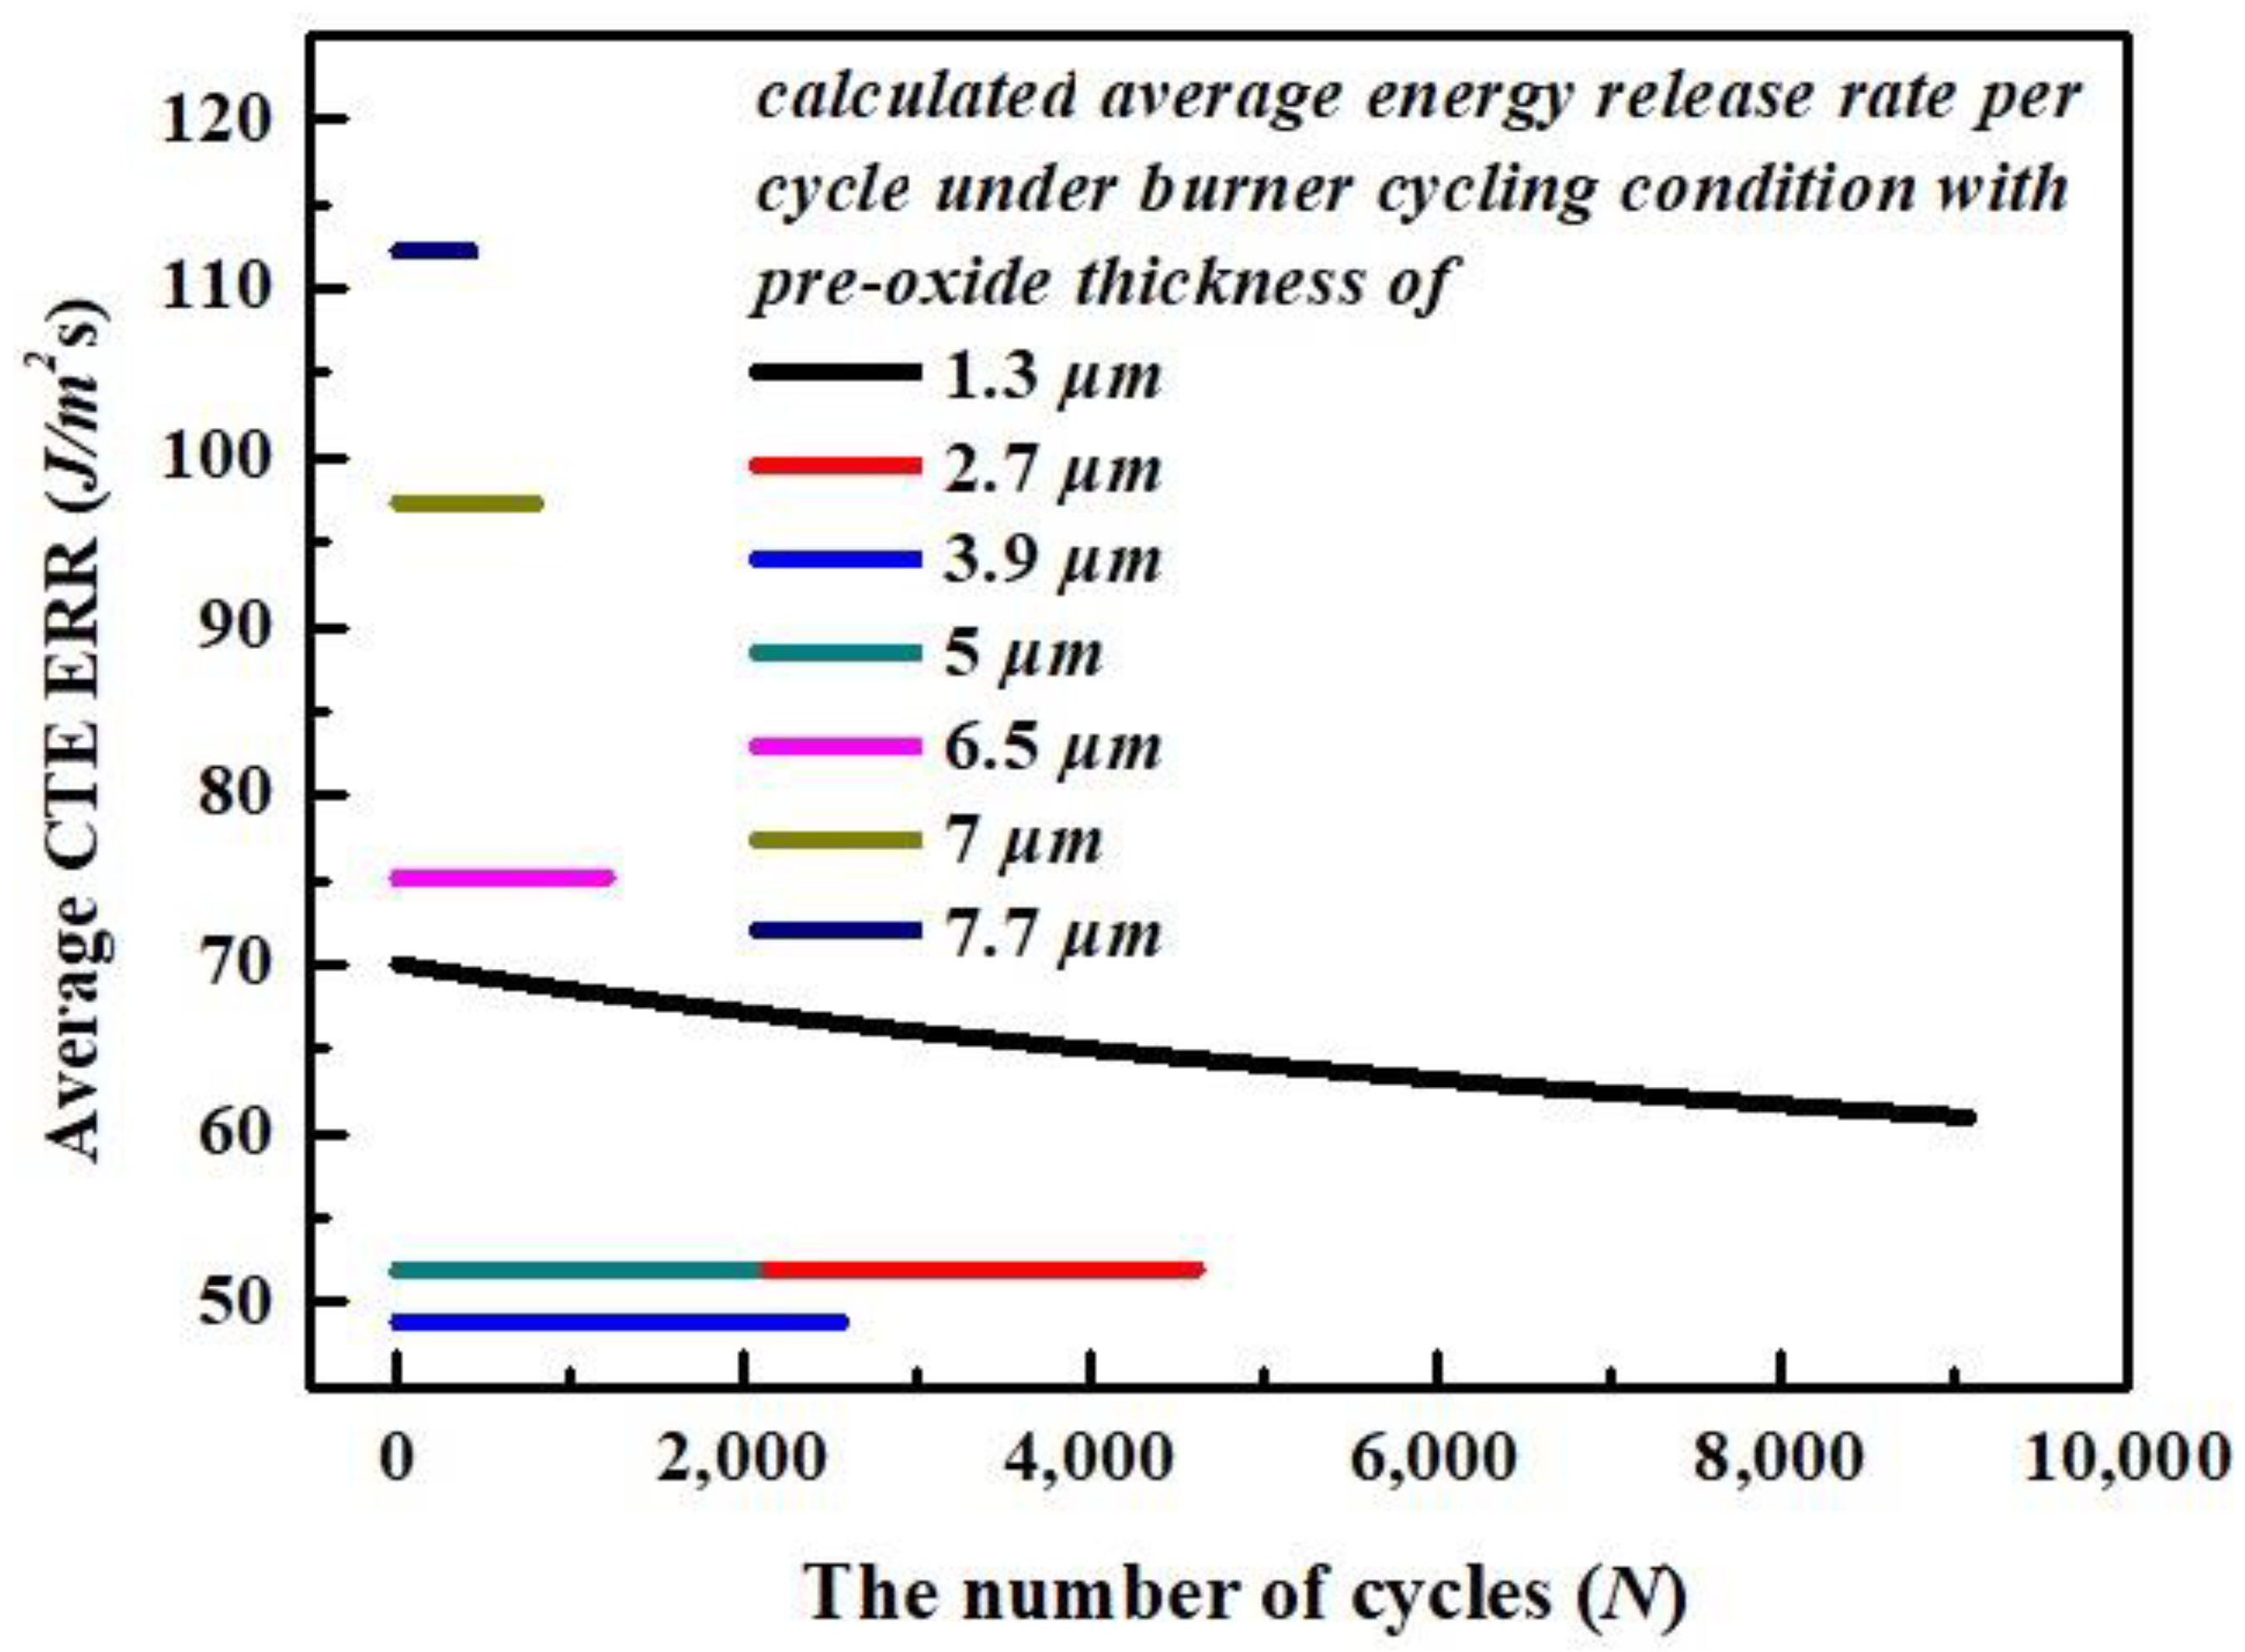
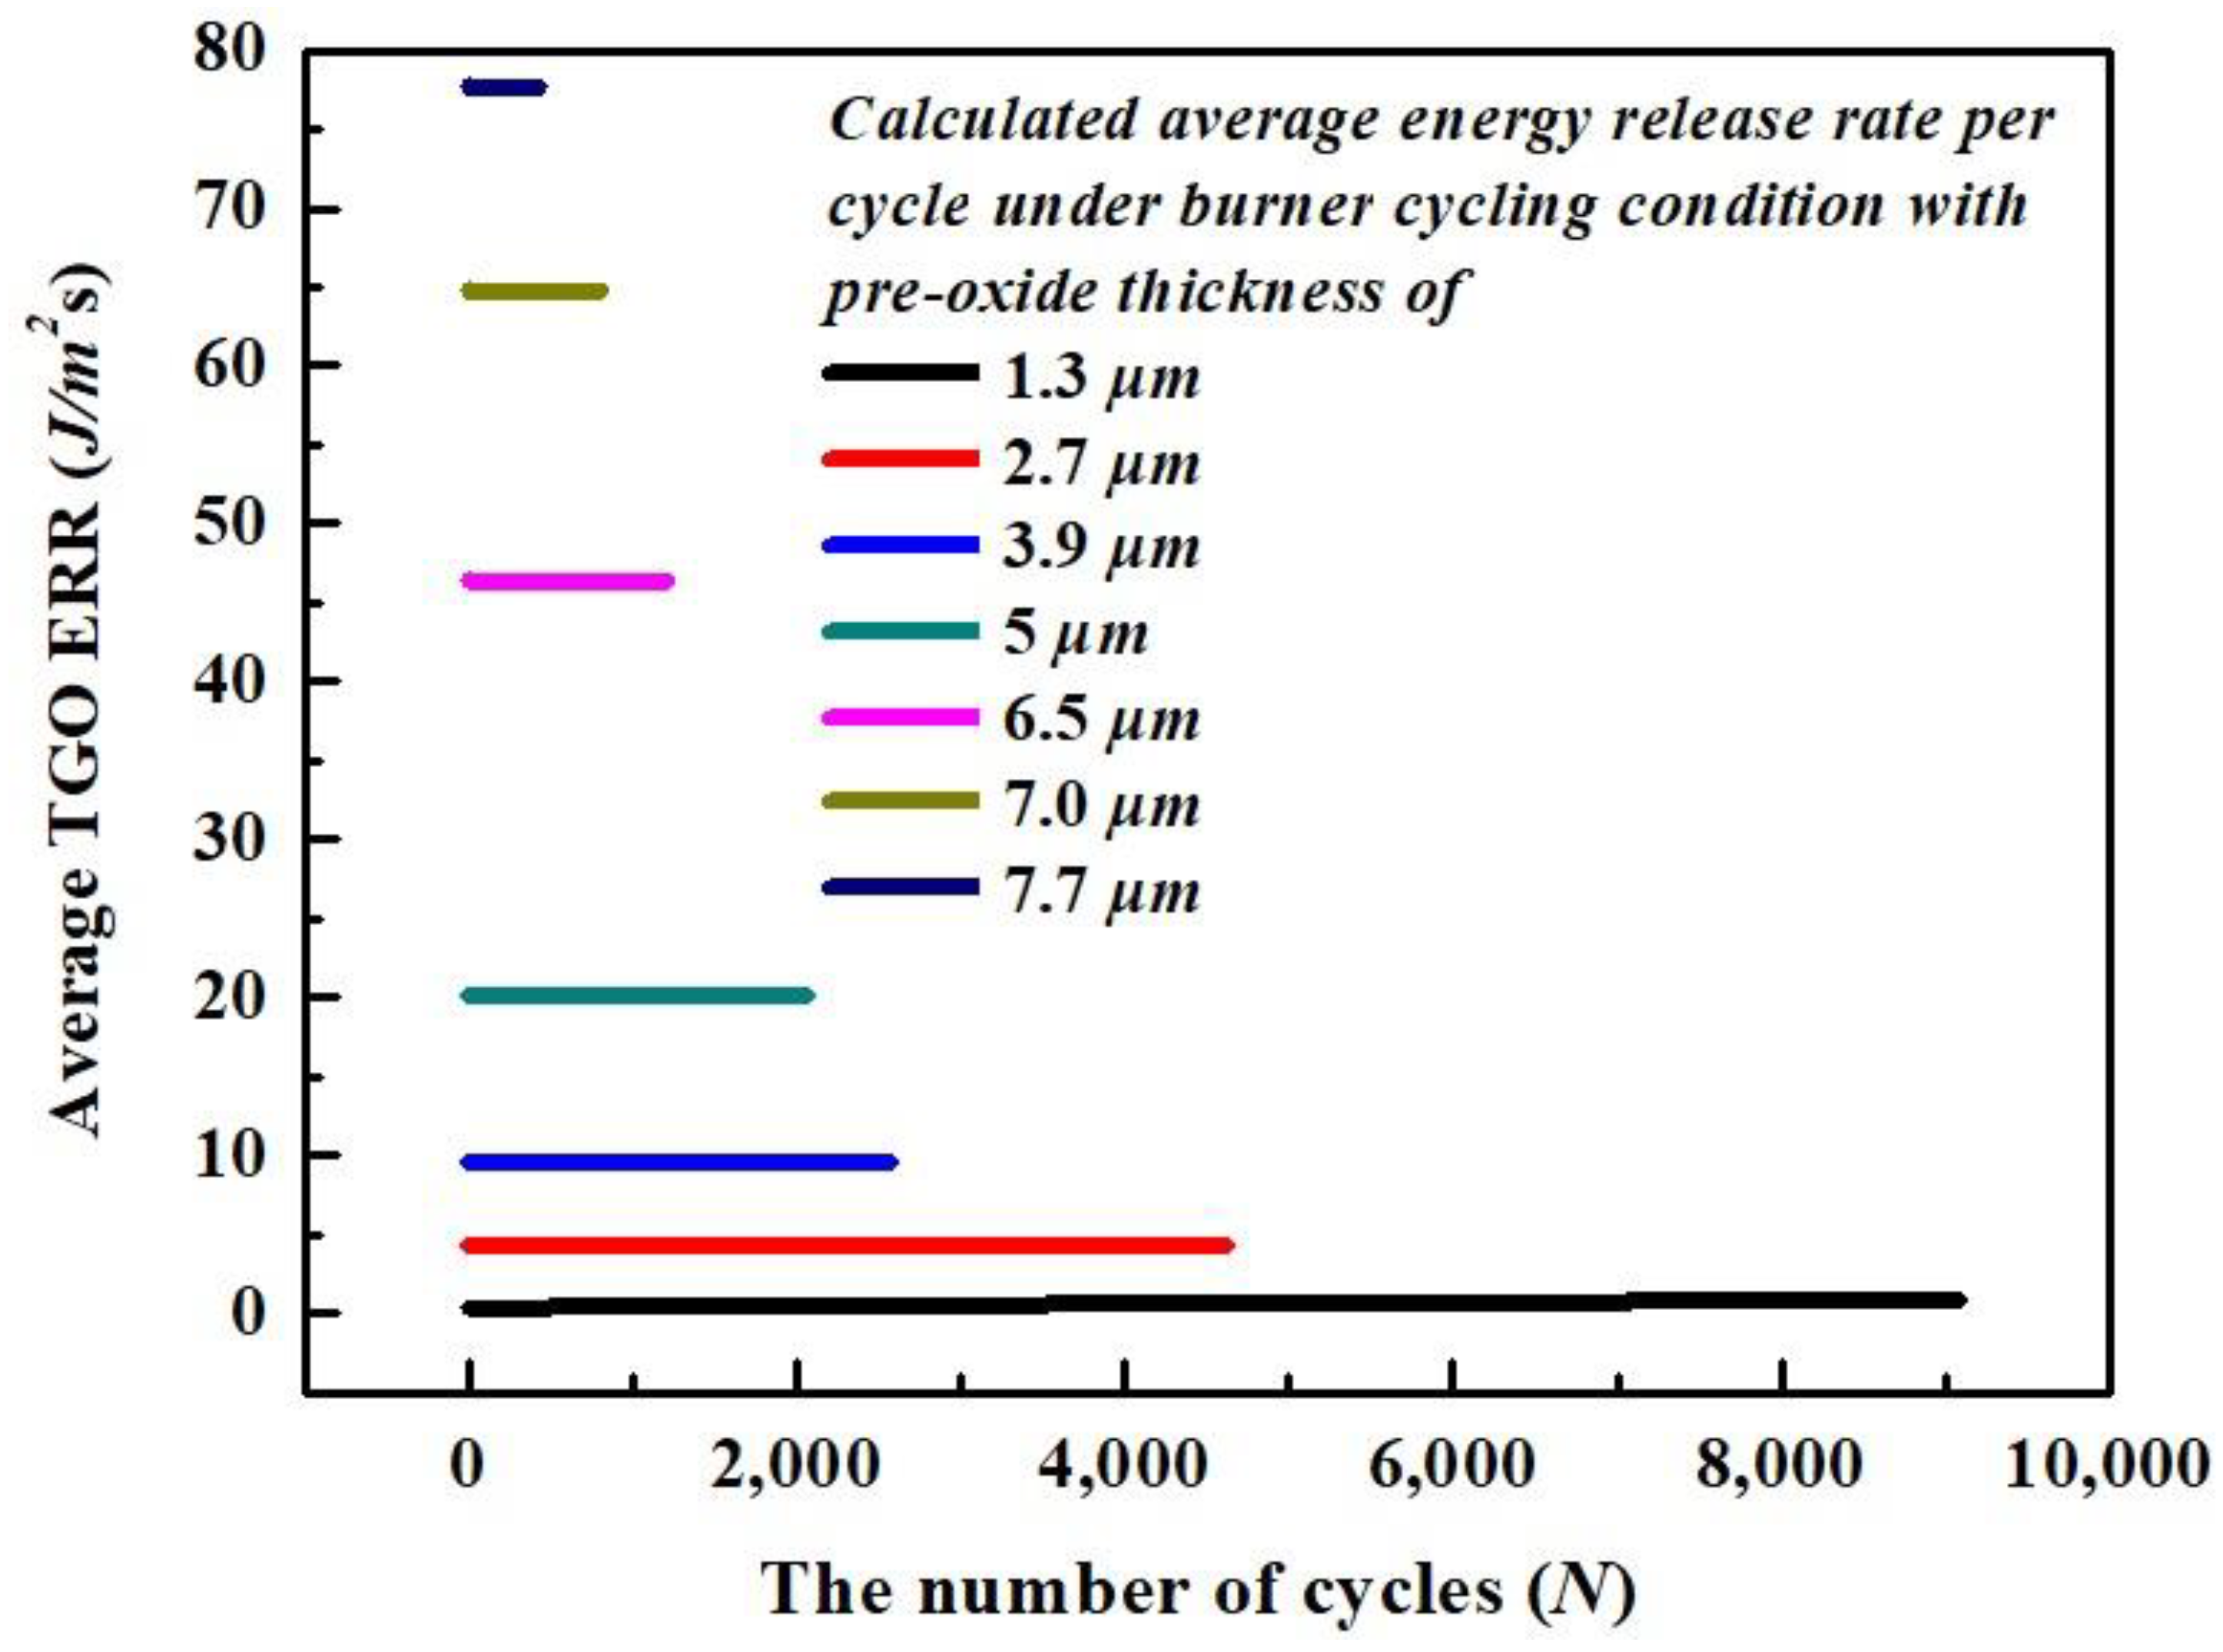
Compared to the CTE ERR , generated under burner cycling test with thermal gradient, there is less of a decrease for CTE ERR generated under isothermal furnace cycling test for group sets of TBCs with pre-oxide TGO thicknesses smaller than 5 μm. This can be explained by the difference in experimental conditions that affects variation in the model parameters vs. number of cycles, e.g., the sintering process-dependent elastic modulus , as well as the TGO thickness-dependent position of maximum CTE stress (). For burner cycling conditions with existing thermal gradients and relatively short high-temperature hold times, there is limited sintering and TGO growth within the cycling experiments. This makes the position () and magnitude of maximum CTE stress independent of the number of thermal cycles, Equation (8). In addition, the average CTE ERR , calculated using Equations (9) and (23), is dominated by positions where the maximum CTE ERR is identified, . This, in turn, is determined by pre-oxide TGO thickness , Equation (12). However, the calculated is not affected much by the number of thermal cycles, Figure 8. Consequently, the equivalent CTE ERR for burner cycling test also demonstrates the pre-oxide thickness-dependent behavior, as can be seen in the black curve in Figure 7.

Figure 8.
The calculated average CTE ERR vs. number of cycles with respect to different pre-oxide thicknesses under burner cycling conditions.
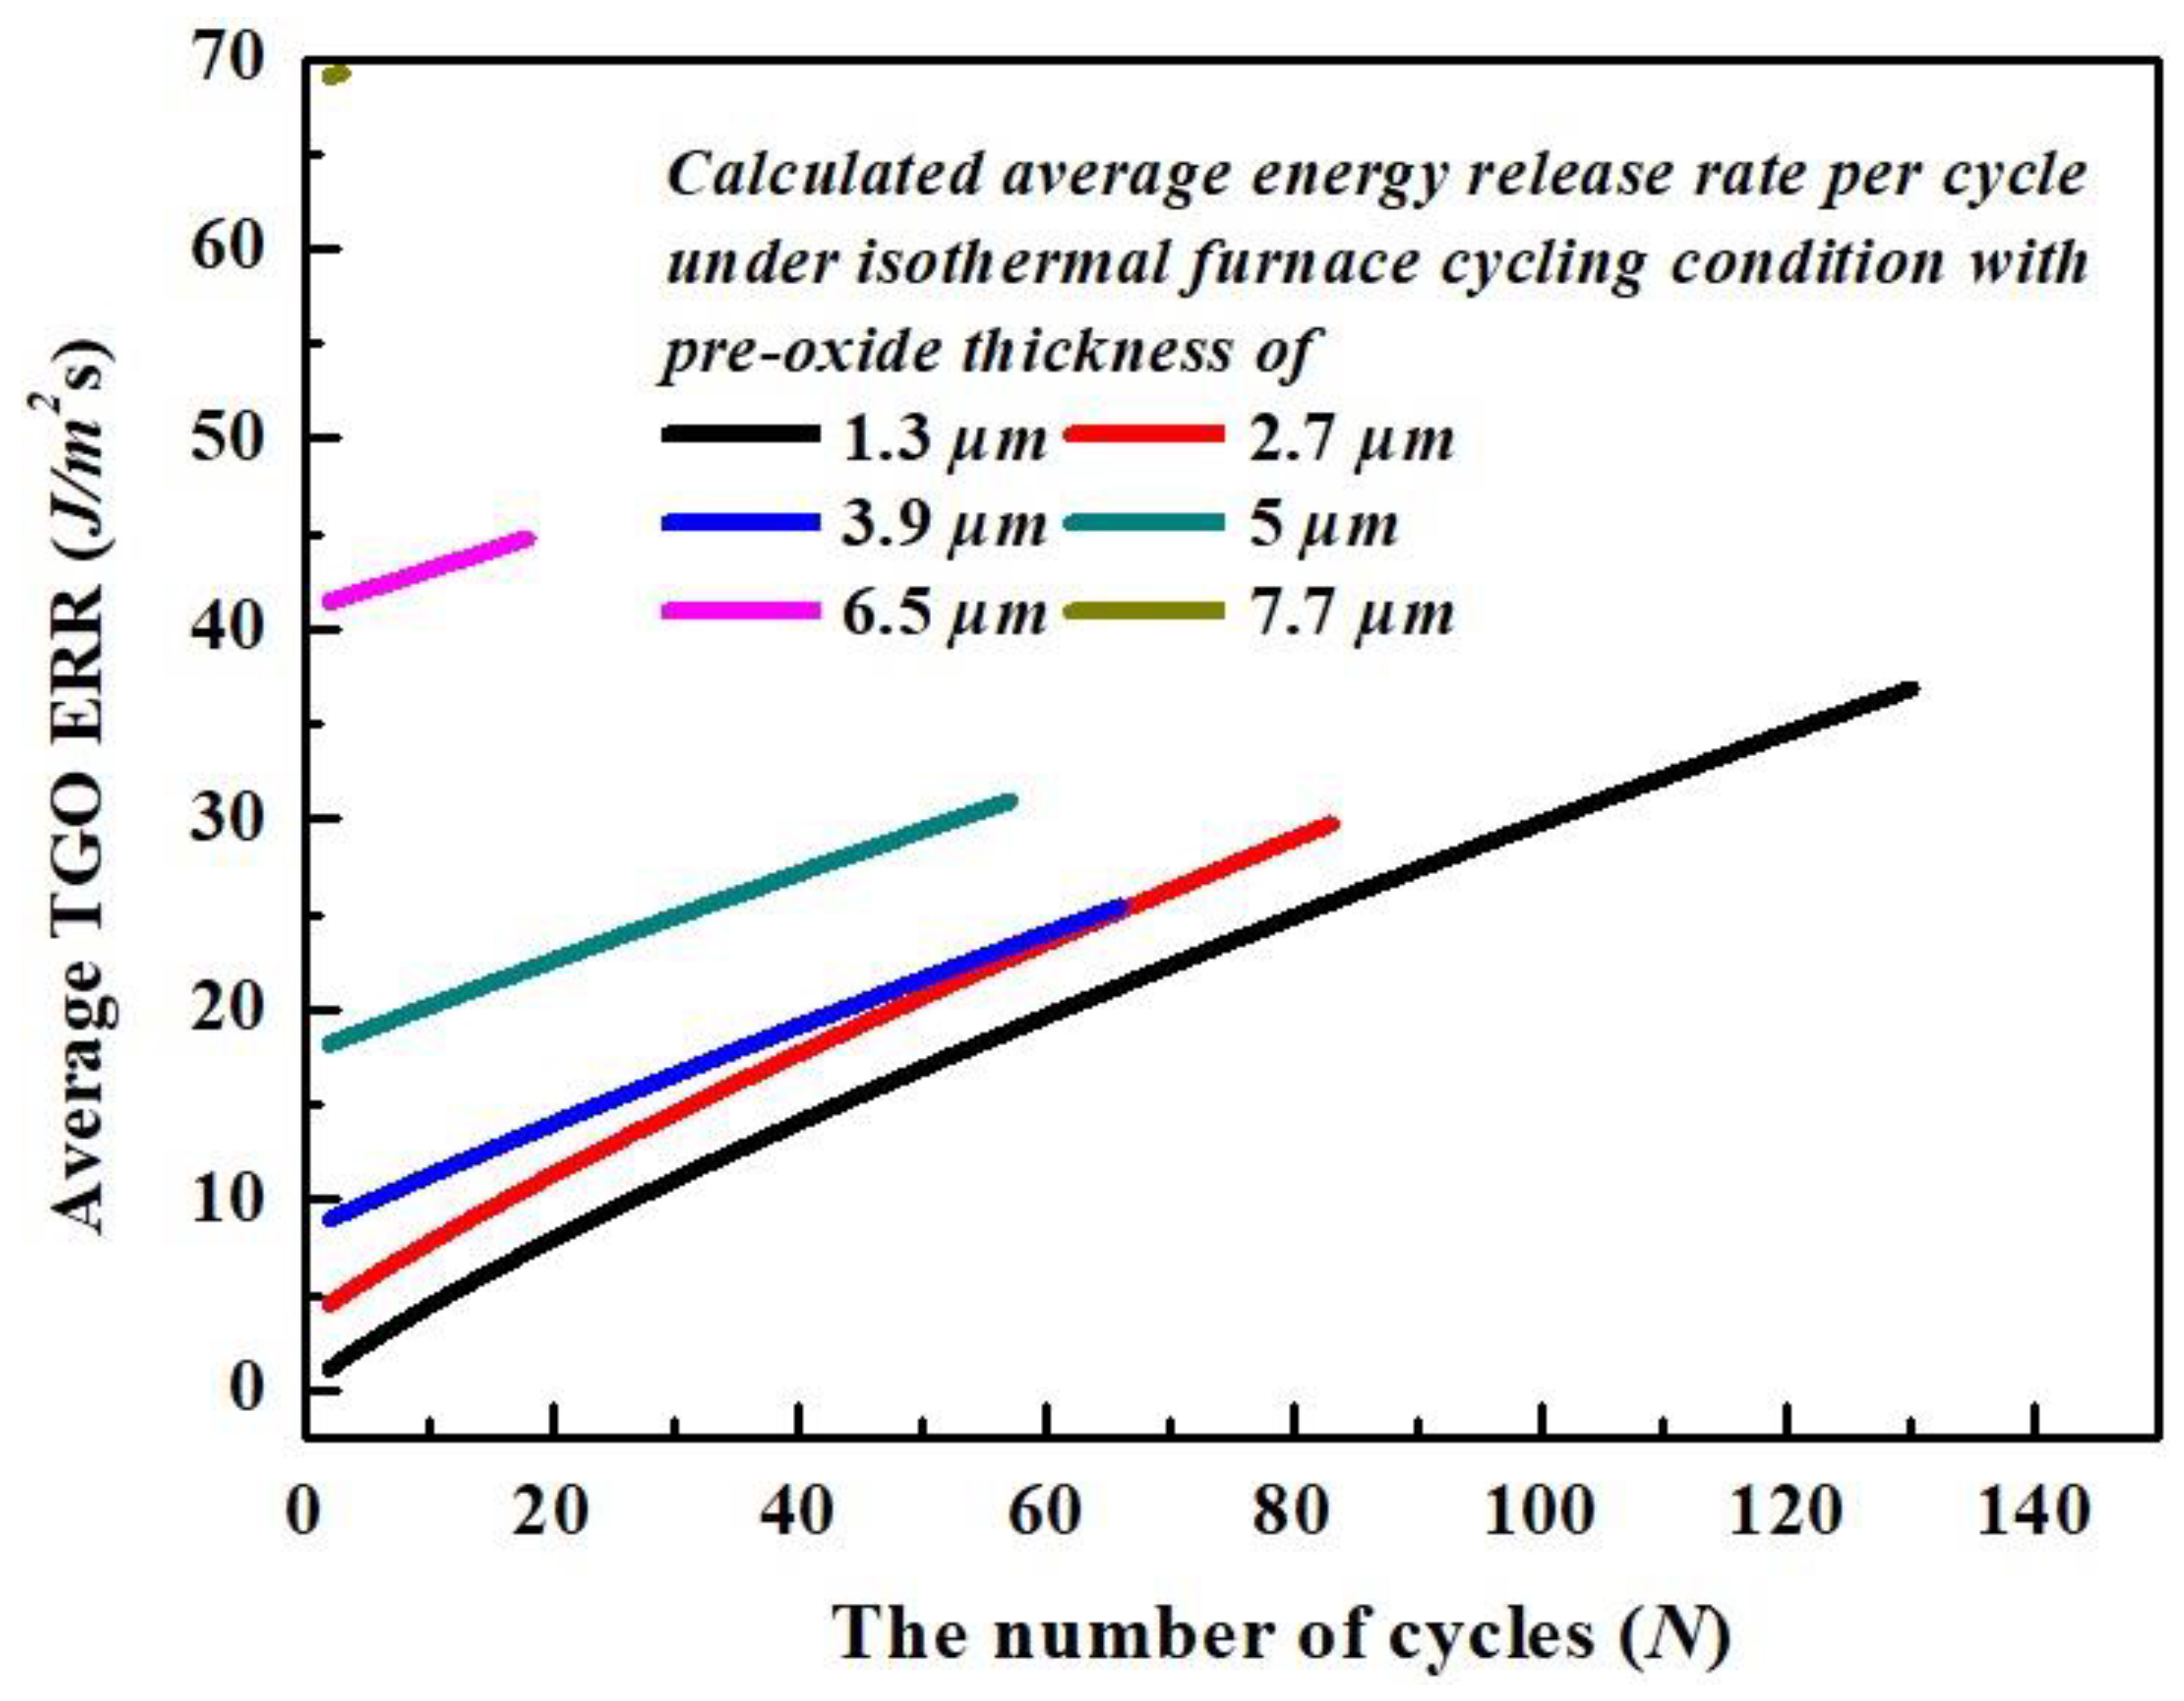
However, for the isothermal furnace cycling test, the relatively higher temperature and longer dwell period makes sintering behavior more effective within the TC and facilitates growth of the TGO layer under high-temperature holding time, specifically for the group of TBCs with shorter preheat treatment (TBCs with pre-oxide thickness smaller than 5 μm). This makes the position and magnitude of the maximum CTE stress vary as a function of thermal cycle for each group of TBCs with its own pre-oxide thickness. In other words, the TBCs under isothermal furnace cycling tests with pre-oxide thickness smaller than 5 μm all experience a shifting in position of maximum CTE stress from somewhere at the ridge of the TC to somewhere close to valley of TC. This is reflected by the cyclic-dependent average CTE ERR , illustrated in Figure 9. The increase in CTE ERR at a later stage of life cycle makes the equivalent CTE ERR less affected by the geometrical factors that decrease the CTE ERR with intermediate TGO thickness for the group of TBCs with pre-oxide thickness smaller than 5 μm (see the red curve in Figure 7).
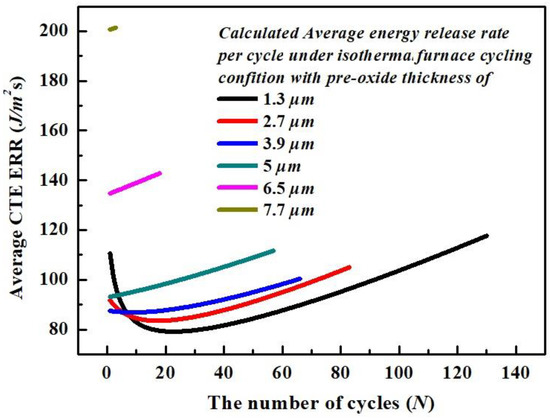
Figure 9.
The calculated average CTE ERR vs. the number of cycles with respect to different pre-oxide thickness under isothermal furnace cycling conditions.
For the calculated equivalent CTE ERR, Figure 7, a similar significant increase in both curves can be observed with respect to pre-oxide thickness in the range of 5–7.7 μm. This shows that as long as the TGO reaches the critical thickness (regardless of TGO growth from either pre-heat treatment or under isothermal cycling test), there is similarity for the cracking mode between the two different cycling experiments. This agrees with the conclusion in [8] that the cracking routes shift from positions far away from the interface (where cracks nucleate at lamellae interface and propagate horizontally), to positions close to the interface between the TC/TGO layer followed by rapid crack propagation.
4.2. Calculated TGO Equivalent Energy Release Rate Generated Due to TGO Growth
The equivalent ERR due to TGO growth is described by
The equivalent ERRs are calculated within the TGO layer and shown in Figure 10 vs. the pre-oxide thickness under both isothermal furnace cycling and burner cycling test.

Figure 10.
The equivalent TGO ERR as a function of pre-oxide TGO thickness for isothermal furnace cycling test and burner cycling conditions.
In addition to the fact that both curves increase as the pre-oxide layer thickens, there are three conclusions obtained by comparing the calculated equivalent TGO ERR from the burner cycling test to the isothermal furnace cycling test .
For both burner cycling test and isothermal furnace test, the TGO ERRs are already generated during preheat treatment time, where the pre-oxide TGO layer formed before the thermal cycling test started. This is especially true for the group set of TBCs, which has 350 h preheat treatment with 7.7 μm pre-oxide thickness. It is expected that there exists a large TGO ERR, which facilitates the propagation of delamination cracks at the interface between the TC/TGO. It also further explains the relatively short life cycle for such groups of TBCs. Upon heating and cooling under thermal cycling conditions, there is a limited TGO growth. Nevertheless, the variation in temperature-dependent TGO elastic modulus might still lead to fluctuation in TGO ERR within a thermal cycle. As mentioned in Section 2, for the burner cycling test with thermal gradient, due to the low temperature at the BC surface and the relative short high-temperature holding time, there is limited TGO growth measured for the groups at the end of cycling experiments [8] (except for the TBCs with pre-oxide thickness of 1.3 μm). However, the accumulated TGO stress generated due to progressive oxidation of BC during preheat treatment is introduced for TBCs under further burner cycling tests. Nevertheless, the elastic modulus of TGO and TGO thickness is independent of the number of cycles. Therefore, similar to the average CTE ERR calculated under the burner cycling test, the average TGO ERR calculated using Equations (13) and (23) is dominated by pre-oxide TGO thickness and is not affected much by the number of thermal cycles, Figure 11. Hence, the equivalent TGO ERR for burner cycling test basically describes the TGO ERR under isothermal preheat treatment.
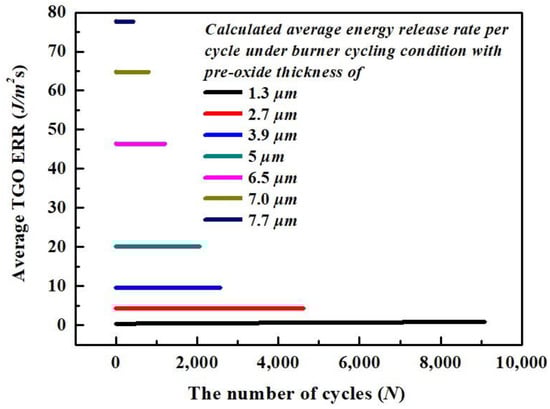
Figure 11.
The calculated average TGO ERR vs. the number of cycles with respect to different pre-oxide thickness under burner cycling conditions.
It becomes difficult to understand the general trend for the calculated equivalent TGO ERR under isothermal furnace cycling test as its initial decrease and later increase are similar to the equivalent CTE ERR under burner cycling test. As is significantly affected by geometrical parameters, the initial decrease and the later increase, shown in the red curve in Figure 10, is affected by TGO growth under isothermal furnace cycling test, based on different groups with various pre-oxide thicknesses. According to the calculated TGO thickness under isothermal furnace cycling conditions (Supplementary Materials), the relatively thin pre-oxide layer (1.3 μm) is not capable of playing a role in the “protective layer” for further BC oxidation under high-temperature dwell period under isothermal furnace cycling test. For a longer life span (130 cycles), the relatively thicker TGO layer (6.21 μm) is formed at the end of the lifetime, which leads to a continuous increase in average TGO ERR vs. the number of cycles, black curve in Figure 12. This provides a higher equivalent TGO ERR at a smaller pre-oxide thickness.
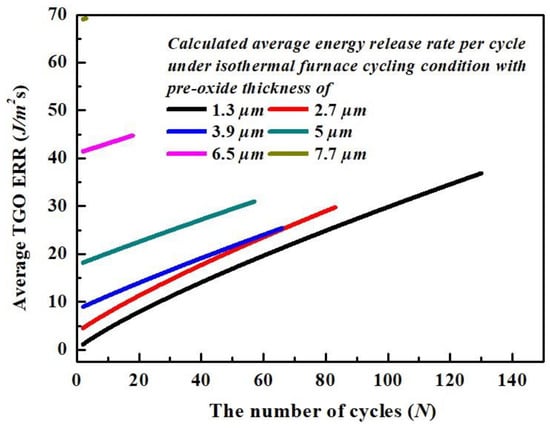
Figure 12.
The calculated average TGO ERR vs. the number of cycles with respect to different pre-oxide thicknesses for isothermal furnace cycling condition.
With a further increase in pre-oxide thickness, the thicker pre-oxide layer starts to play a role in inhibiting the progressive oxidation of BC, which lowers the TGO growth rate for the further BC oxidation during the high-temperature dwell period. With the shorter life span corresponding to the thicker pre-oxide layer, the later oxidation further limits the growth of the TGO layer under isothermal furnace cycling conditions (final TGO thicknesses are 5.78 μm and 5.49 μm for TBCs with pre-oxide thickness of and 3.9 μm, respectively). This results in lower average TGO ERR vs. the number of cycles, as can be seen from the red and blue curves in Figure 12, as well as lower equivalent TGO ERR for and 3.9 μm (Figure 10).
For the group set of TBCs where pre-oxides are thicker than 5 μm, although there is little TGO growth under thermal cycling conditions, the average TGO ERR is still higher compared to the group sets with pre-oxide layer thinner than 5 μm. This can be explained in terms of the higher initial pre-oxide thickness, which provides enough TGO ERR and lasts throughout the entire thermal cycling life cycle, as can be seen by the dark cyan, magenta and dark yellow curves in Figure 12. This gives higher equivalent TGO ERR for , 6.6 μm and 7.7 μm in Figure 10.
There exists an intersection between two equivalent TGO ERR curves as a function of pre-oxide thickness, Figure 10. For the same pre-oxide thickness, the effect of temperature profile in the two different thermal conditions on the calculated equivalent TGO ERR is reflected by: (i) the difference in further growth of TGO layers determined by high-temperature holding time (26 min for isothermal and 50 s for burner) and temperature at the BC surface (1120 °C for isothermal and 935 °C for burner); (ii) the difference in elastic modulus of the TGO layer. (i) leads to higher equivalent TGO ERR under isothermal furnace cycling test, whereas (ii) leads to the higher equivalent TGO ERR under burner cycling test. It is evident that the intersection of the two curves in Figure 10 is located at the position corresponding to pre-oxide thickness, around 5.5–6 μm. The calculated equivalent TGO ERR for isothermal furnace cycling tests is higher than for burner cycling test, as pre-oxide thickness is thinner than 5.5 μm. This indicates that the effect of the rapid growth of TGO under isothermal furnace cycling conditions (i) suppresses the effect of the lower elastic modulus under higher temperature (ii). This leads to as pre-oxide thickness is smaller than 5.5 μm. On the other hand, the TGO growth under isothermal furnace cycling conditions is limited since the pre-oxide thickness is thicker than 5.5 μm. Here, the effect of higher elastic modulus under thermal gradient condition (ii) suppresses the effect of growth of TGO layer (i), which leads to as pre-oxide thickness is higher than 5.5 μm.
4.3. The Calculated TC Equivalent Energy Release Rate Generated Due to Thermal Gradient for Burner Cycling Test
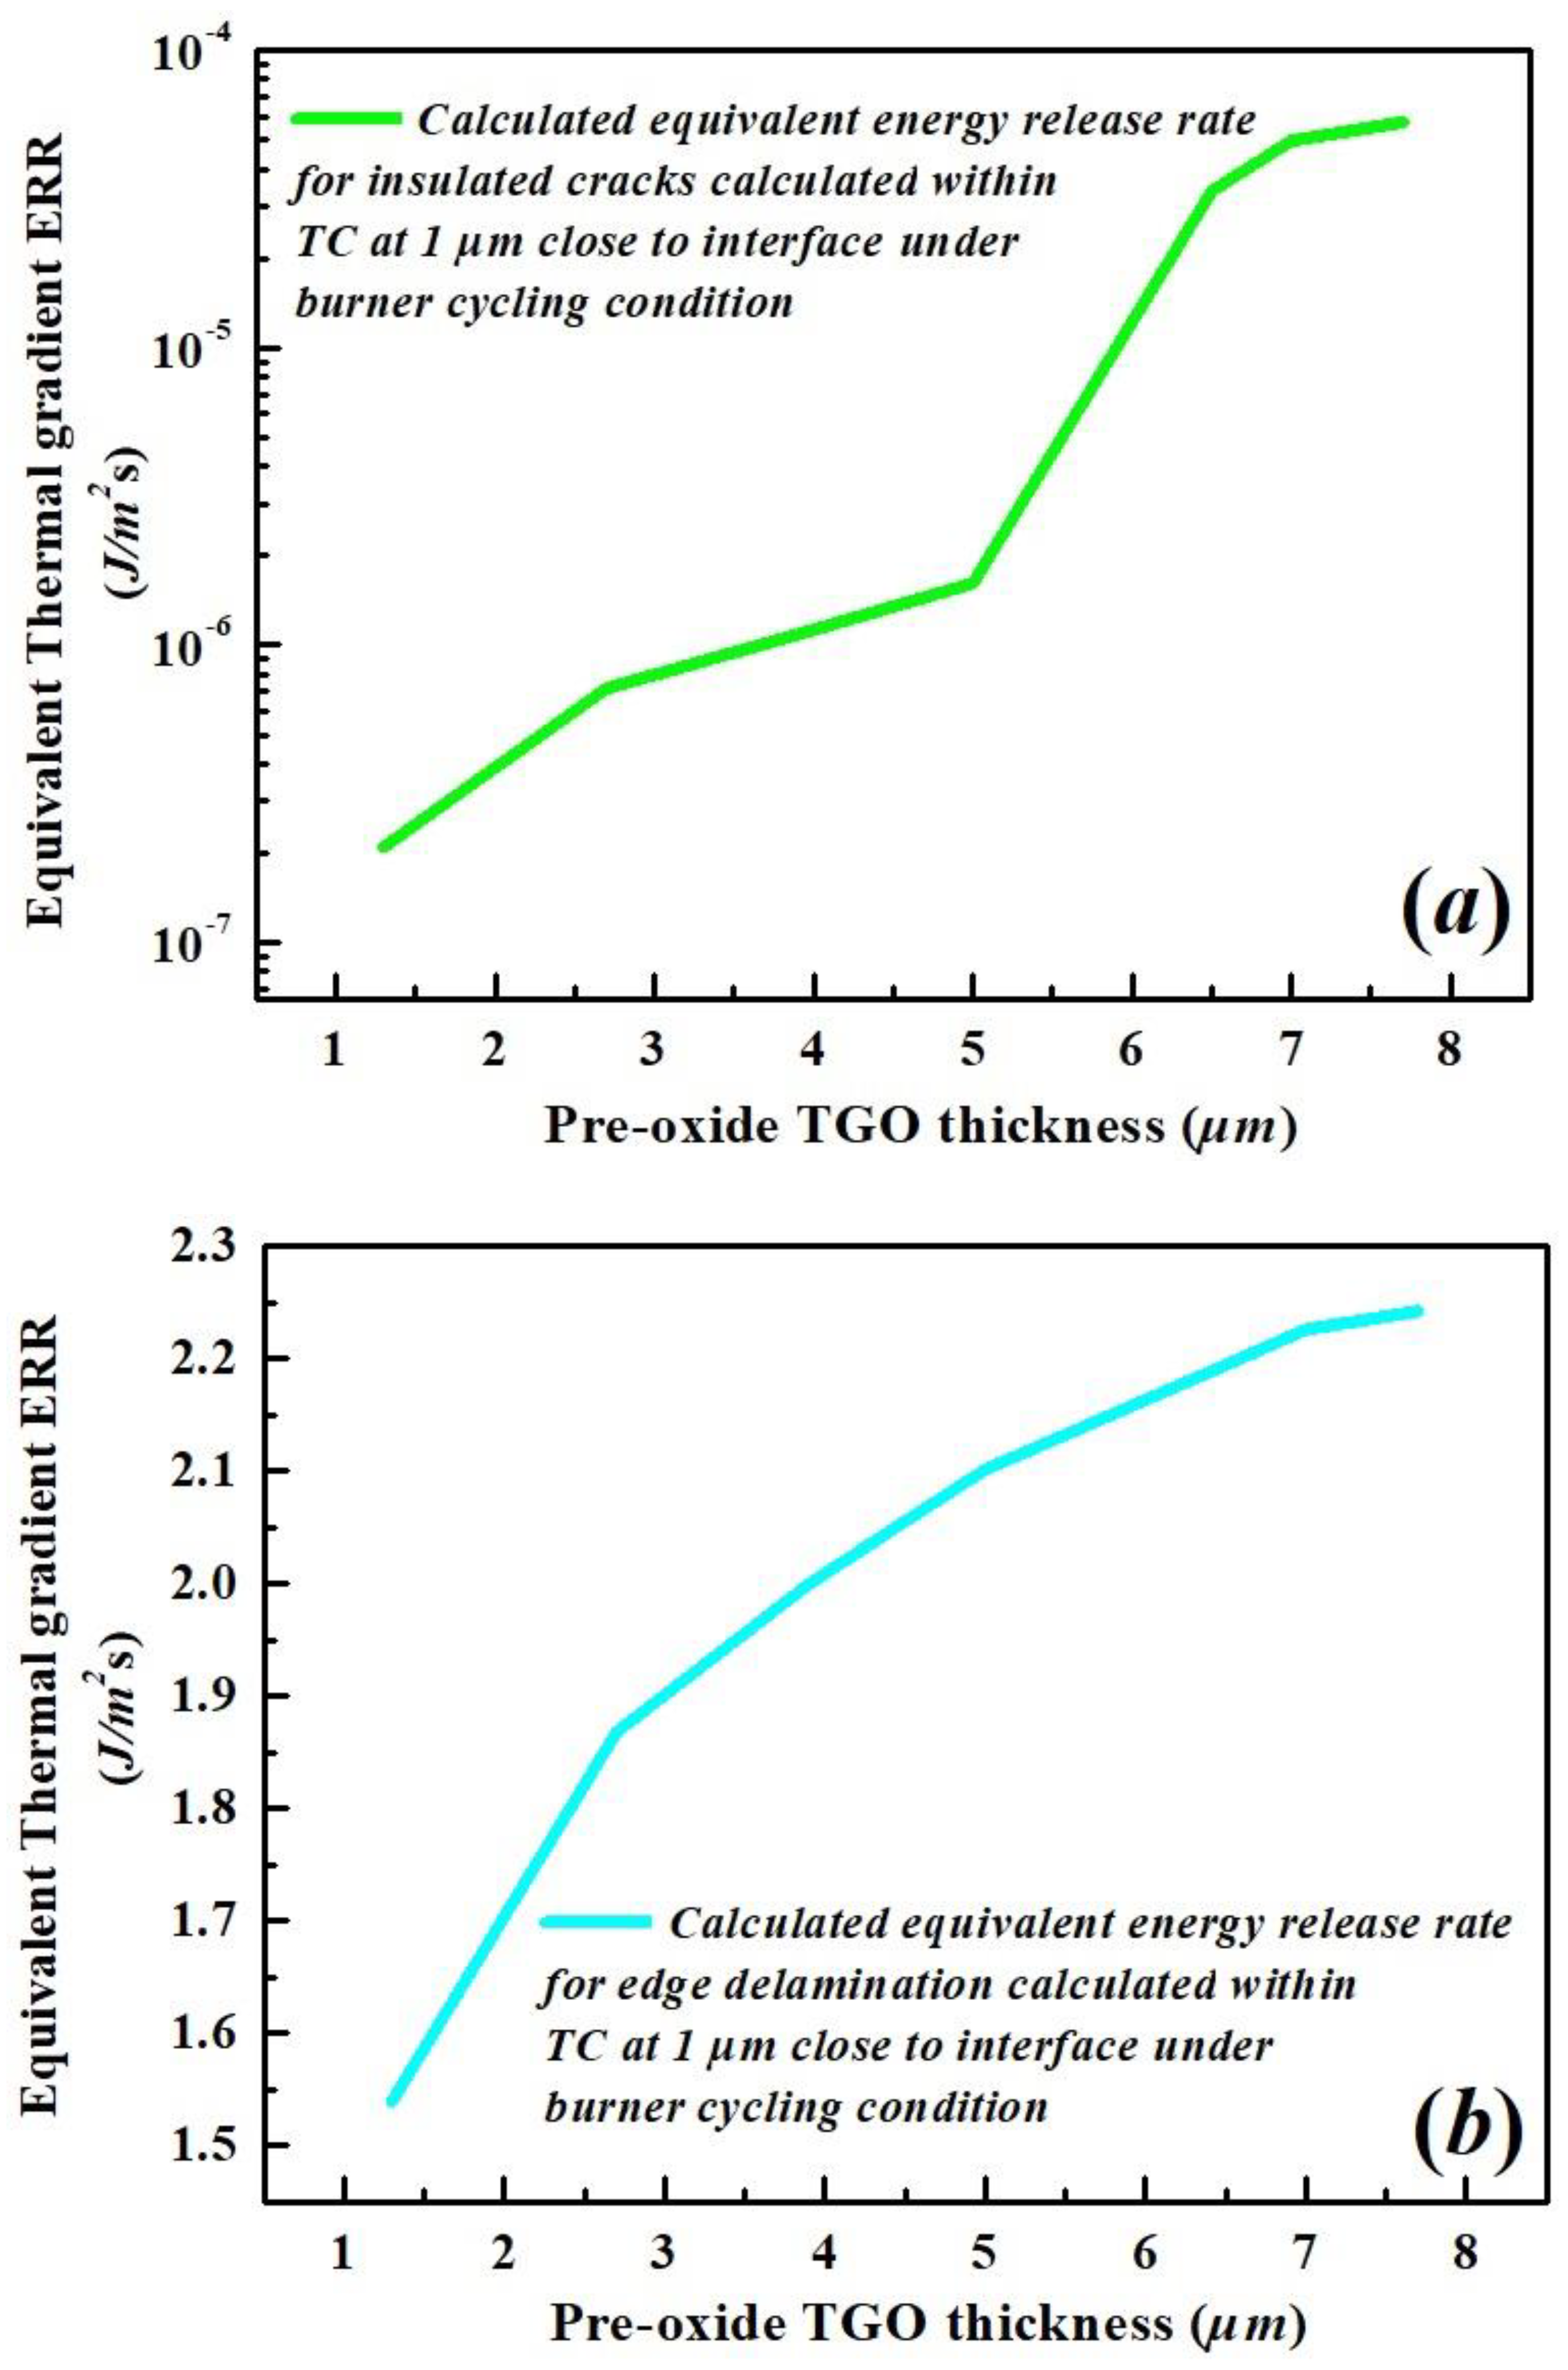
A thermal gradient is introduced by applying compressed air to the back side of the BC during high-temperature holding time for APS-TBCs under burner cycling testing. The temperature difference at various depths within the TC is also present upon cooling due to the rapid temperature drop on the surface of the TC. The crack driving forces due to the thermal gradient are calculated using equations described in Section 3.3, where equivalent ERR is calculated and demonstrated in Figure 13 for insulated cracks and edge delamination during high-temperature holding time.
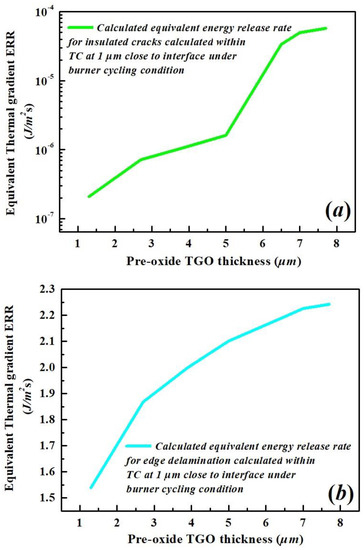
Figure 13.
The equivalent thermal gradient ERR vs. the pre-oxide TGO thickness under burner cycling condition assuming (a) insulated cracks and (b) edge delamination crcaks within TC.
It is evident that both calculated thermal gradient ERRs increase as the pre-oxide thickness becomes thicker, where the calculated is a few orders of magnitude lower than that of . This indicates that it is unlikely for alone to provide enough energy to nucleate the delamination cracks within the TC layer. This is consistent with the description by Hutchinson and Evans [41]. The situation changes when the delamination is connected to a free edge. Here, the equivalent thermal gradient ERR generated during high-temperature holding time is calculated by combining and together, where the magnitude of equivalent ERR is approximated by .
Given the existence of thermal gradient throughout the thickness of the TC layer, the time-dependent material parameters, such as TC elastic modulus and TGO growth thickness , are nearly constant vs. the number of cycles when estimated 1 μm away from the bottom of the TC. This shows that the growth of the crack length b during isothermal conditions (discussed in Section 2) might be the only factor that leads to the variation in the coefficients (equation) and (equation) as a function of pre-oxide thickness, which further affects the thermal gradient ERR. Nevertheless, for pre-oxide thickness smaller than 5 μm, the variation in crack length is a function of TGO thickness where there is basically no TGO growth under burner cycling test. This indicates that is constant throughout the life span for TBCs with pre-oxide thickness smaller than 5.5 μm. For pre-oxide thickness larger than 5.5 μm, the length of the isothermal crack grows dramatically as a function of time. However, the and are approximated as constant () to a relatively large ratio [41]. Therefore, we have shown that all parameters used for estimating thermal gradient ERR in Equations (14) and (15) are independent of time, which results in and (via Equation (23)) being constant throughout the life cycle with respect to their pre-oxide thickness.
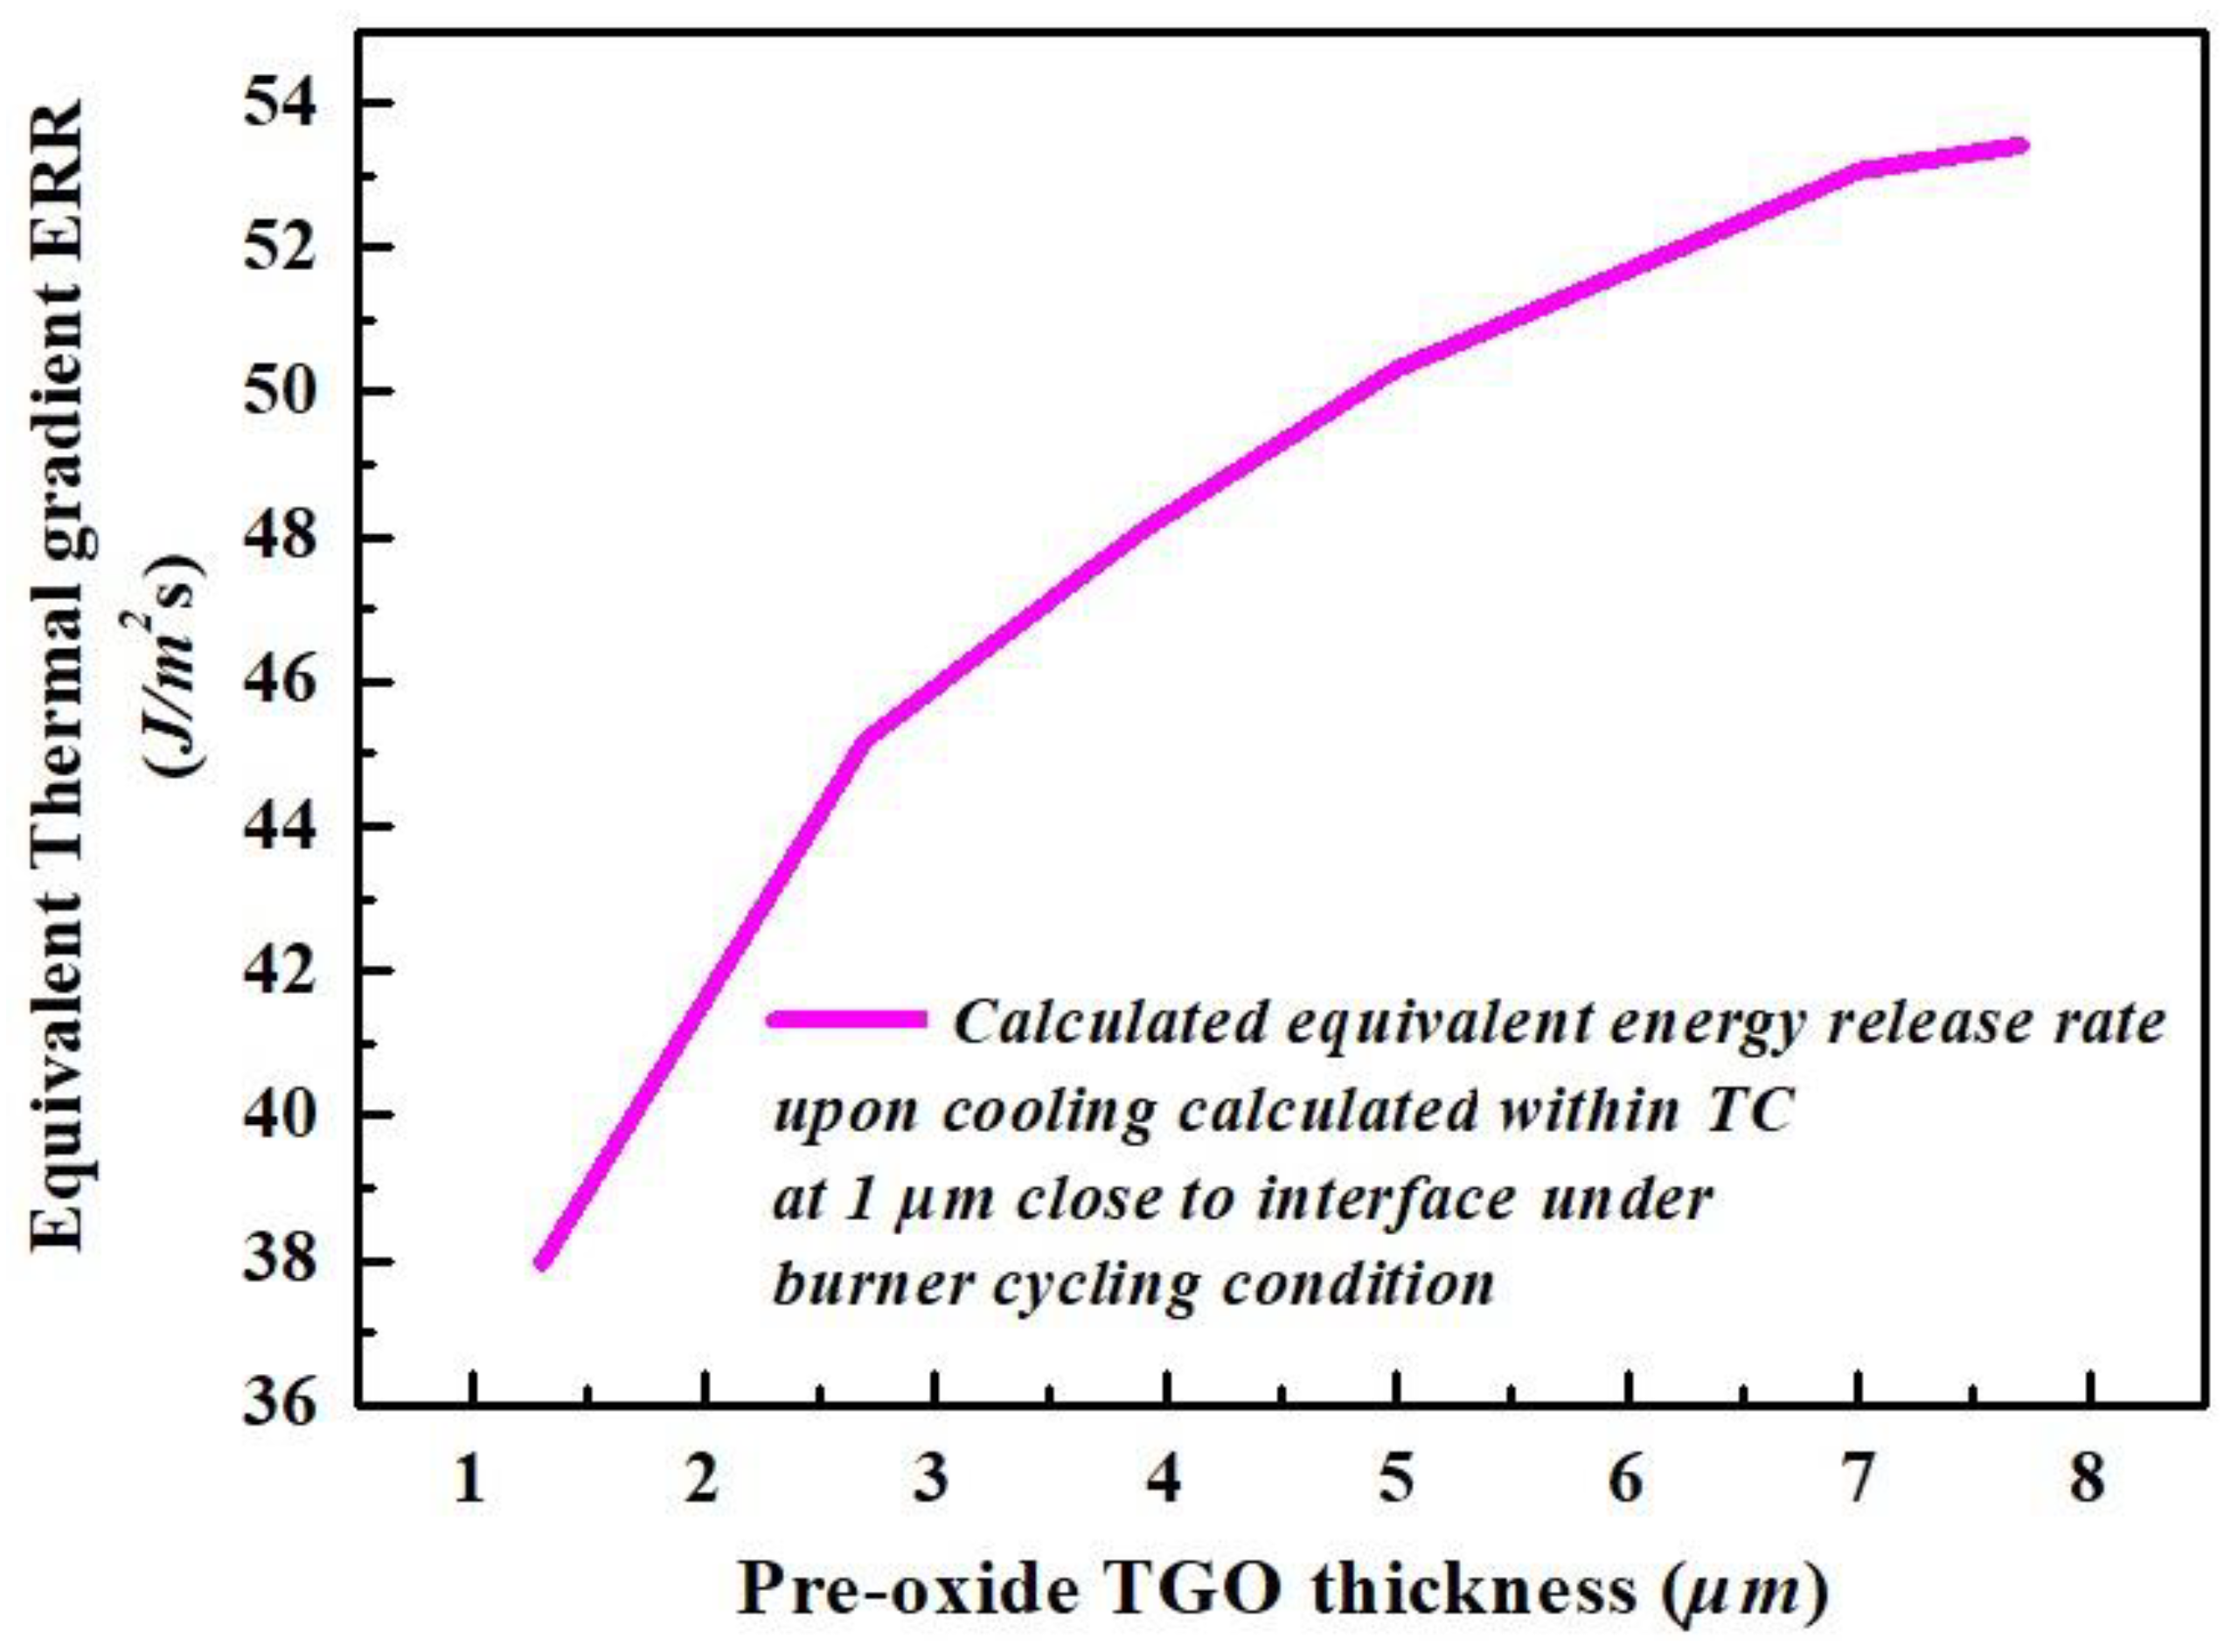
The equivalent thermal gradient ERR developed upon cooling is calculated by Equation (28), illustrated in Figure 14.

Figure 14.
The calculated equivalent thermal gradient ERR developed upon cooling vs. the pre-oxide TGO thickness under burner cycling condition.
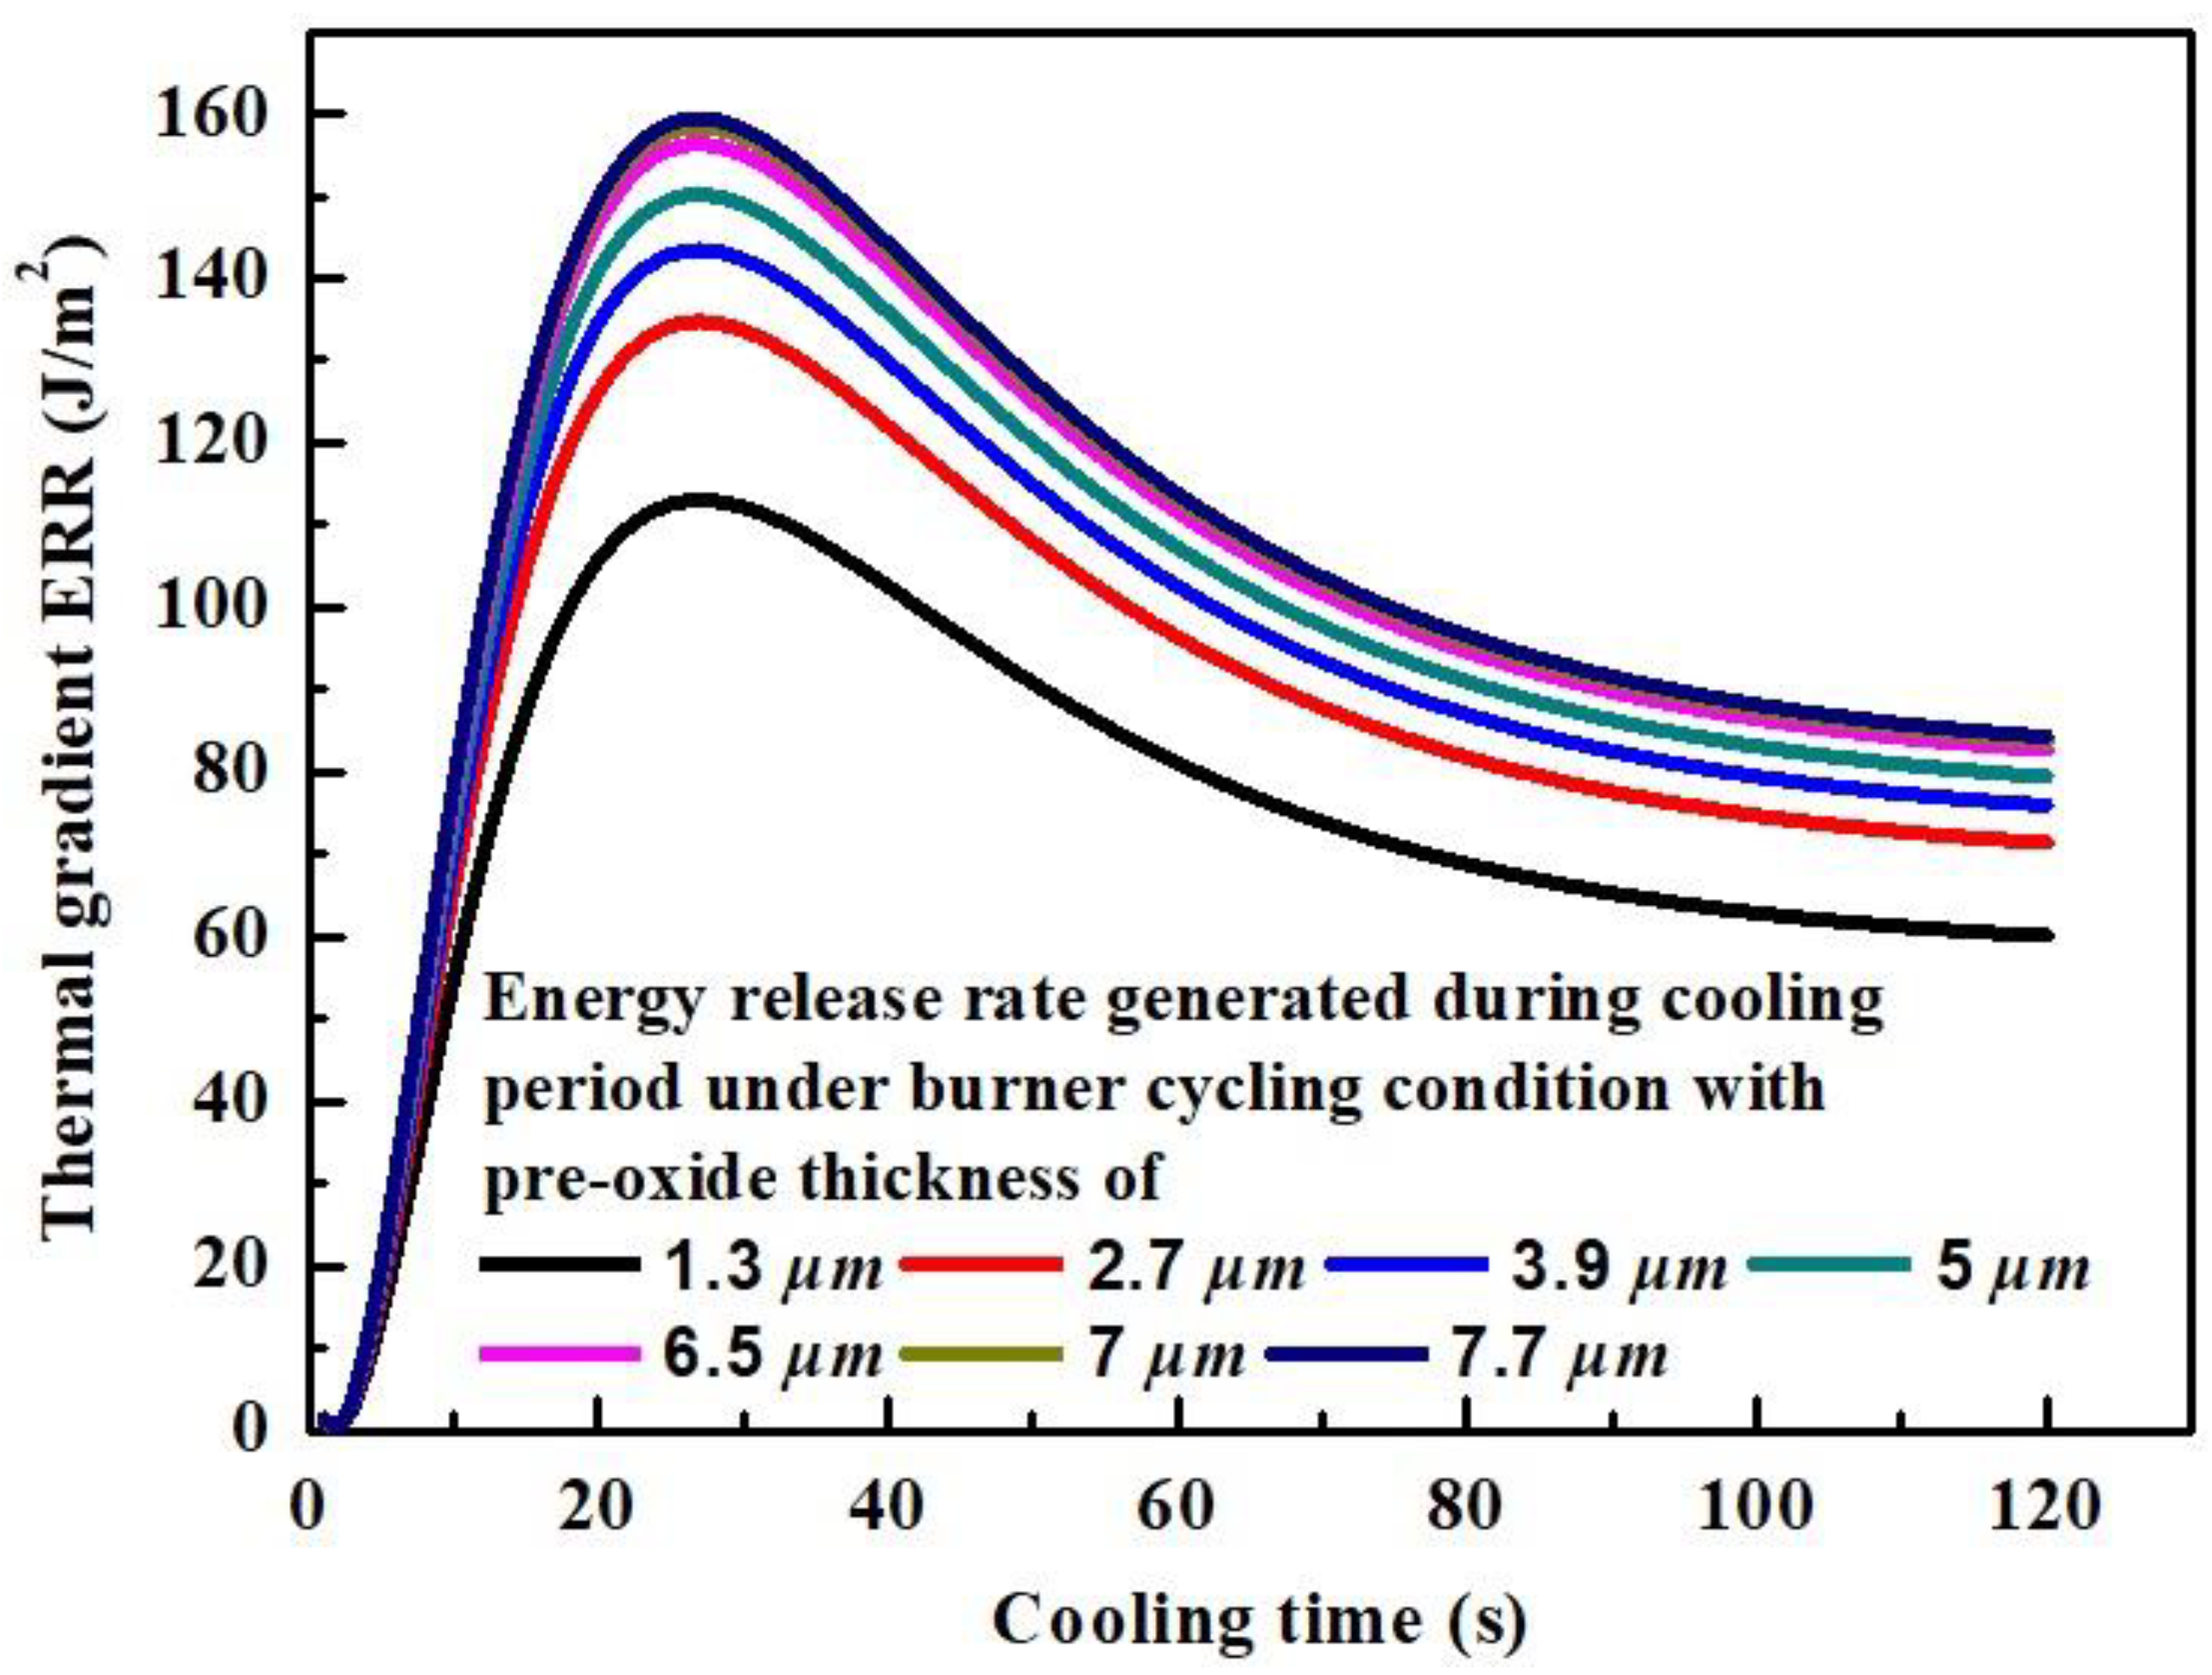
The equivalent thermal gradient ERR increases as a function of pre-oxide thickness. Comparing to the generated during high-temperature holding time, the generated upon cooling is more likely to be responsible for crack nucleation under thermal gradient conditions due to its large magnitude. In addition, the thermal gradient ERR upon cooling is illustrated as a function of time with respect to different pre-oxide thicknesses, Figure 15.

Figure 15.
The calculated thermal gradient ERR developed upon cooling vs. the time at different pre-oxide TGO thickness.
A higher thermal gradient ERR is expected as pre-oxide thickness increases. This might be explained by the higher elastic modulus of the TC , corresponding to the longer sintering process obtained by preheat treatment. The maximum thermal gradient ERR is calculated at the middle stage upon cooling, followed by a drop in ERR to the end of the cycle. This is consistent with the results obtained by Evans [36]. The fluctuating curve in Figure 15 is affected by multiple factors, including the stress generated due to the CTE mismatch between TC and BC, as well as the CTE stress generated due to thermal gradient, where a temperature difference is expected at different depths within the TC.
With the calculated results described above, it is practicable to define an equivalent total ERR due to the thermal gradient generated at different stages under burner cycling test, Equation (29). The calculated total equivalent ERR is shown in Figure 16.
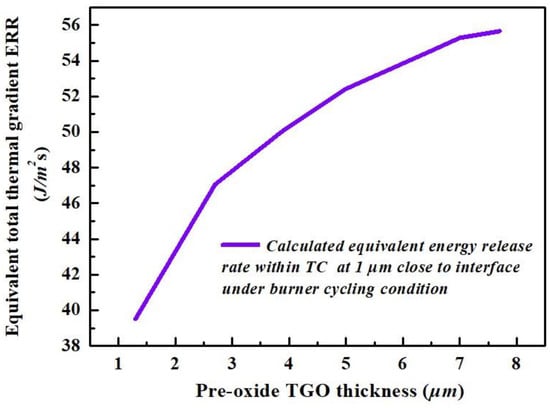
Figure 16.
The calculated equivalent total thermal gradient ERR vs. the pre-oxide TGO thickness under burner cycling condition.
4.4. The Calculated TC Equivalent Energy Release Rate Generated Due to Thermal Shock for Burner Cycling Test
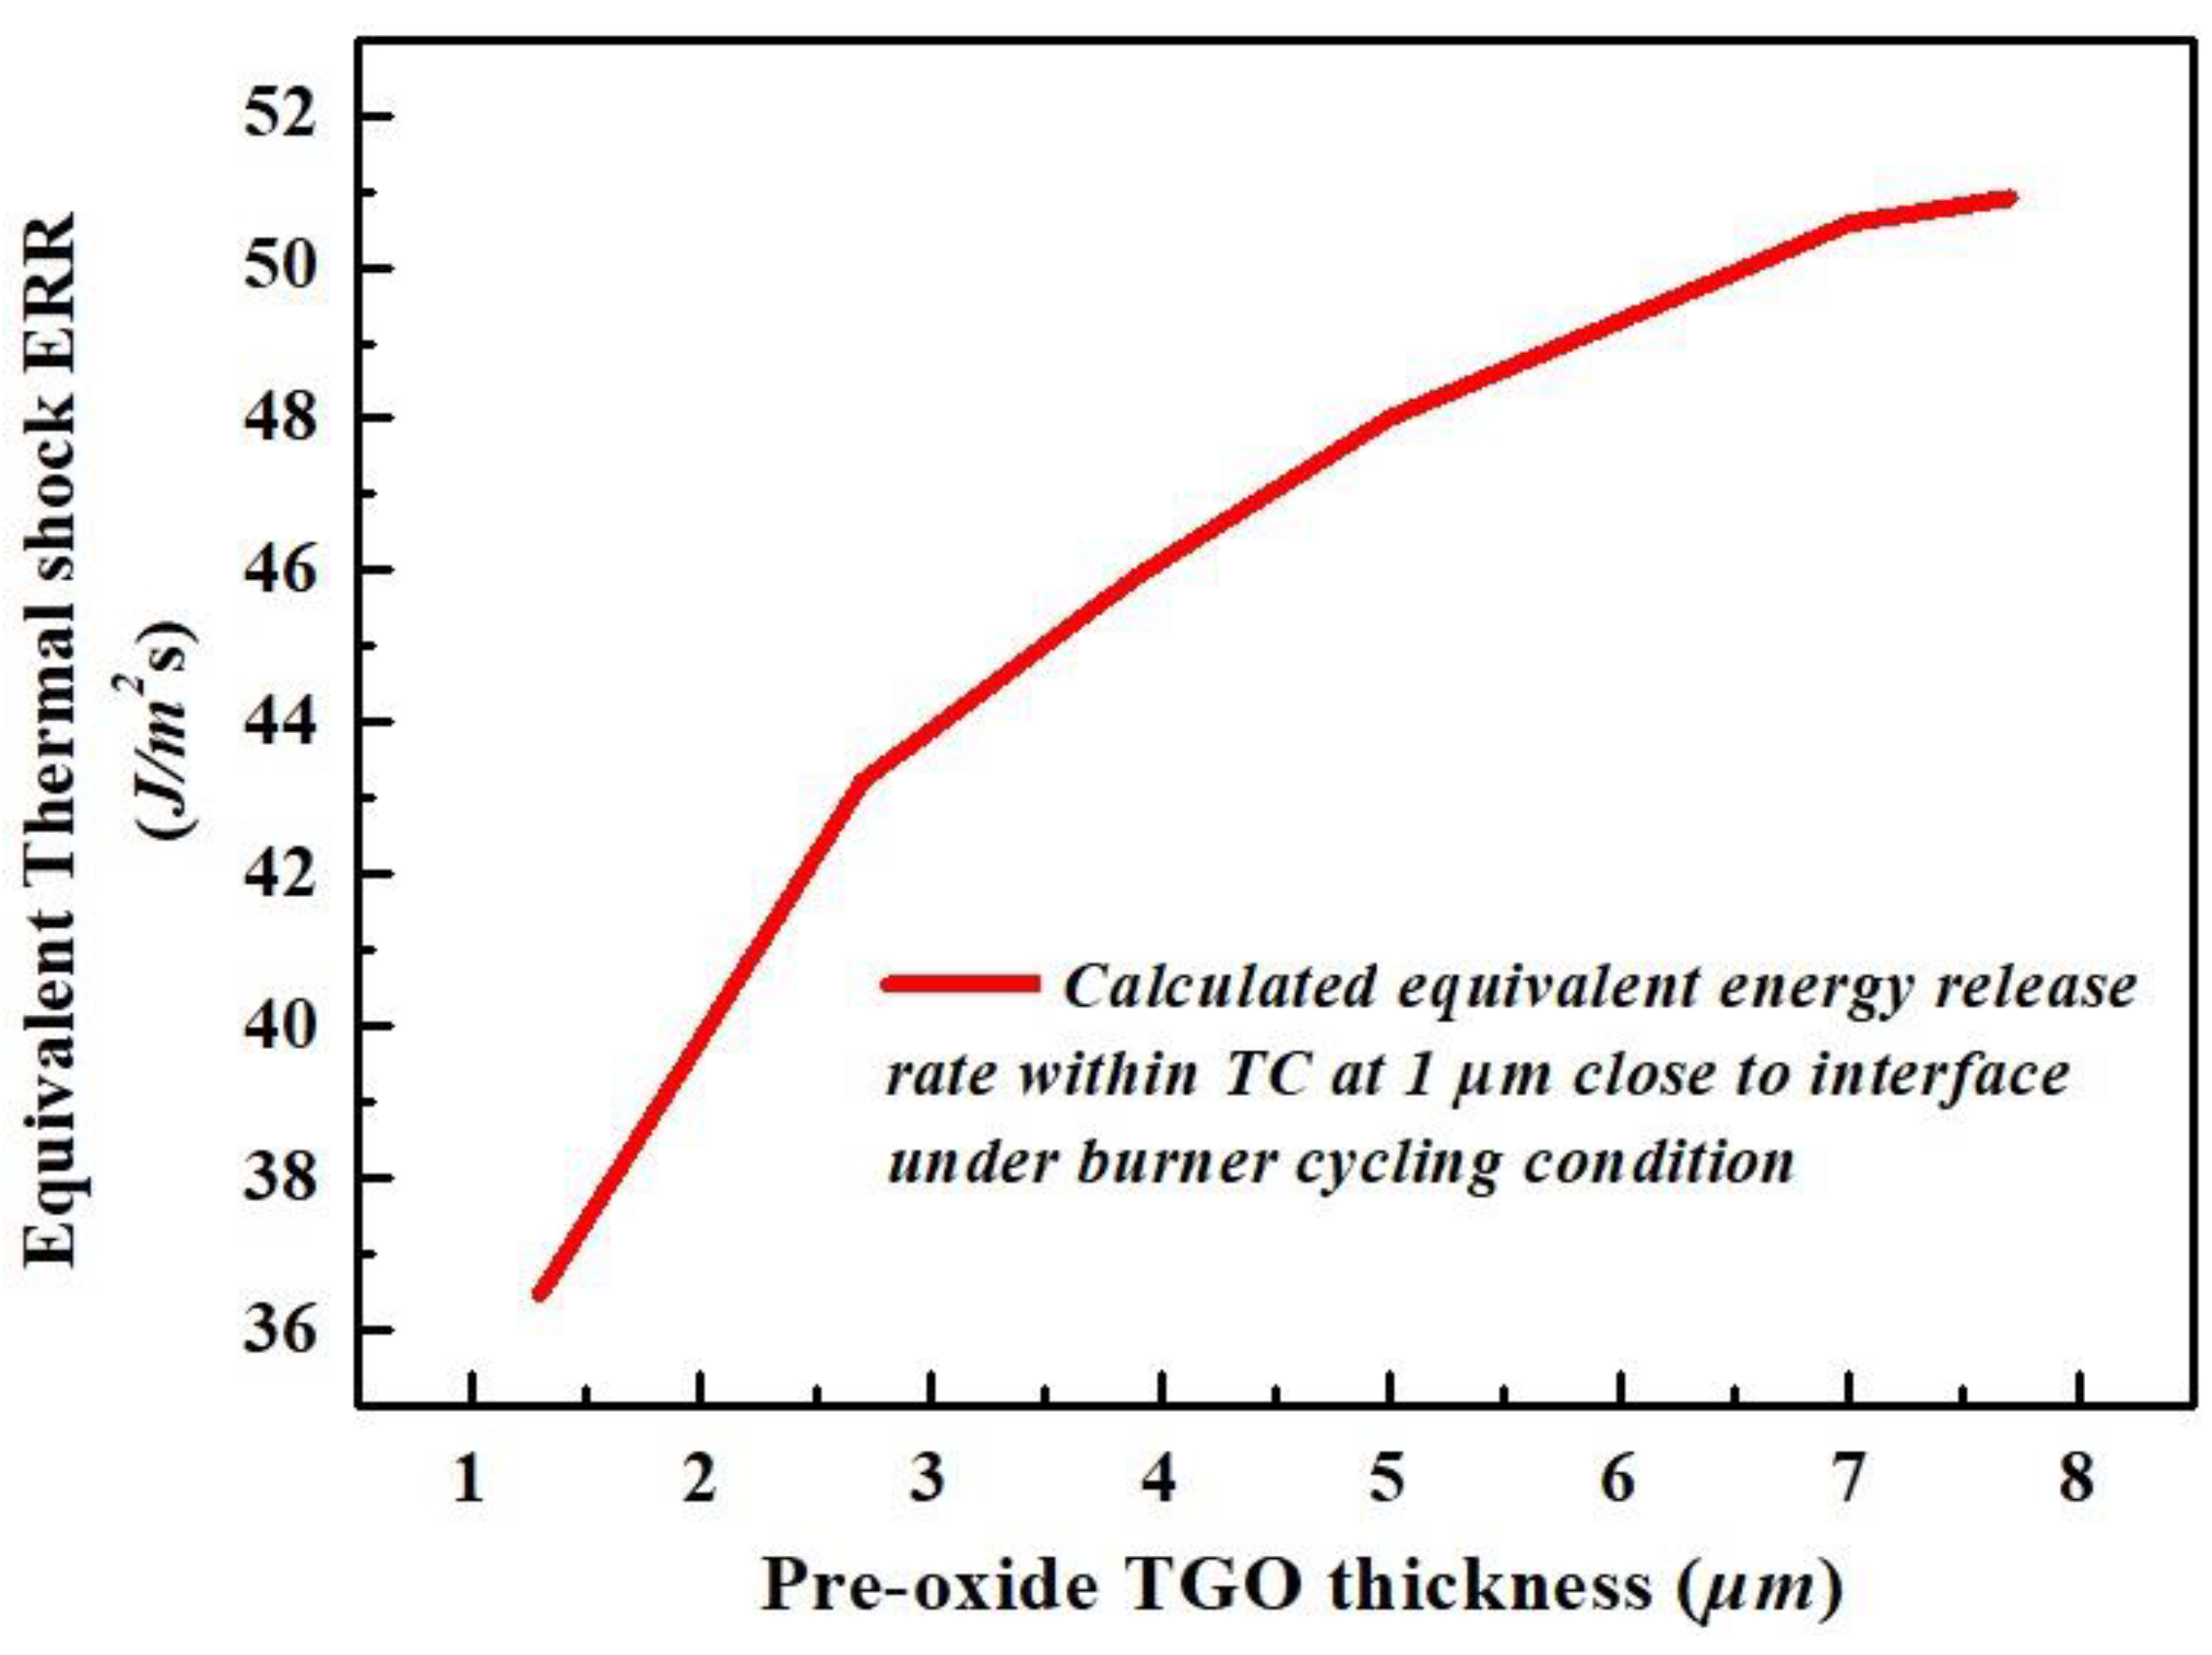
The effect of thermal shock on durability of APS-TBCs on the scale of lifetime is evaluated by equivalent thermal shock ERR, described by Equation (30). The result is illustrated in Figure 17.
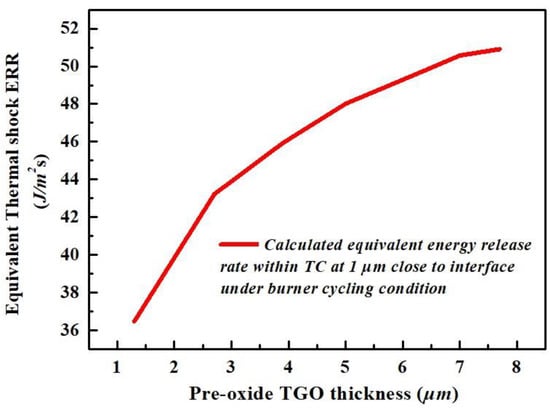
Figure 17.
The calculated equivalent thermal shock ERR vs. the pre-oxide TGO thickness under burner cycling condition.
It is evident that the thermal shock ERR increases vs. the pre-oxide thickness. Compared to the effect of thermal gradient (where the ERR might be different as the evaluated depth changes within TC), the effect of thermal shock applies to all the TBCs. This is reflected by the equivalent area and equivalent moment of inertia , which are evaluated throughout the thickness of TC (described in Supplementary Materials).
The rapid change in equivalent and at the beginning of the thermal cycles and the end of high-temperature holding time corresponds to the high rate of temperature variation, which, in turn, leads to the variation in calculated thermal shock , Figure 18.
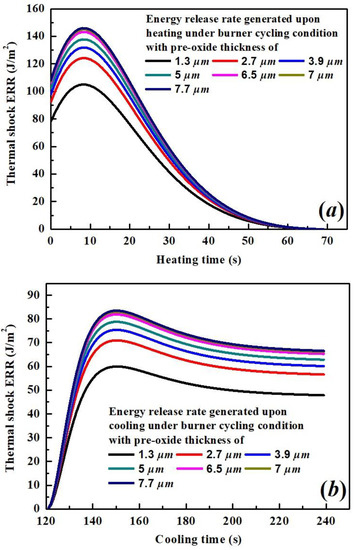
Figure 18.
The calculated thermal shock ERR developed upon (a) heating; (b) cooling vs. time under different pre-oxide TGO thickness.
Like the calculated thermal gradient ERR upon cooling, instead of showing at the beginning of calculated time, there is a short time interval for ERR to reach its maximum value whenever heating or cooling starts. The behavior might be explained by the time delay for the entire TBC to respond to the heating/cooling since the heating source/compressed air is applied to the surface of the TBC. The maximum value is higher for ERR , developed upon heating, but it experiences a rapid drop at a later stage. This is related to the essence of thermal shock. It refers to the process where a component experiences a sudden change in thermal stresses and strains of large magnitude, when the heat flux and component temperature gradient change abruptly [49]. At the later stage of heating/cooling process, the variation in temperature becomes uniform, which makes the thermal shock ERR drop dramatically. The difference between the decrease in thermal shock ERRs for heating and cooling processes can be explained by the variation in elastic modulus, i.e., the drop in elastic modulus upon heating makes the decrease in thermal shock ERR more evident. However, the increase in elastic modulus upon cooling flattens the curves of ERRs at later stages of the cooling process. Considering the calculated ERR, described from Section 4.1 to Section 4.4, it is evident that most ERR is developed upon cooling, indicating that a higher possibility for crack nucleation occurs upon cooling rather than at other stages of the thermal cycling test.
4.5. Calculated Equivalent Energy Release Rate vs. Calculated Depth
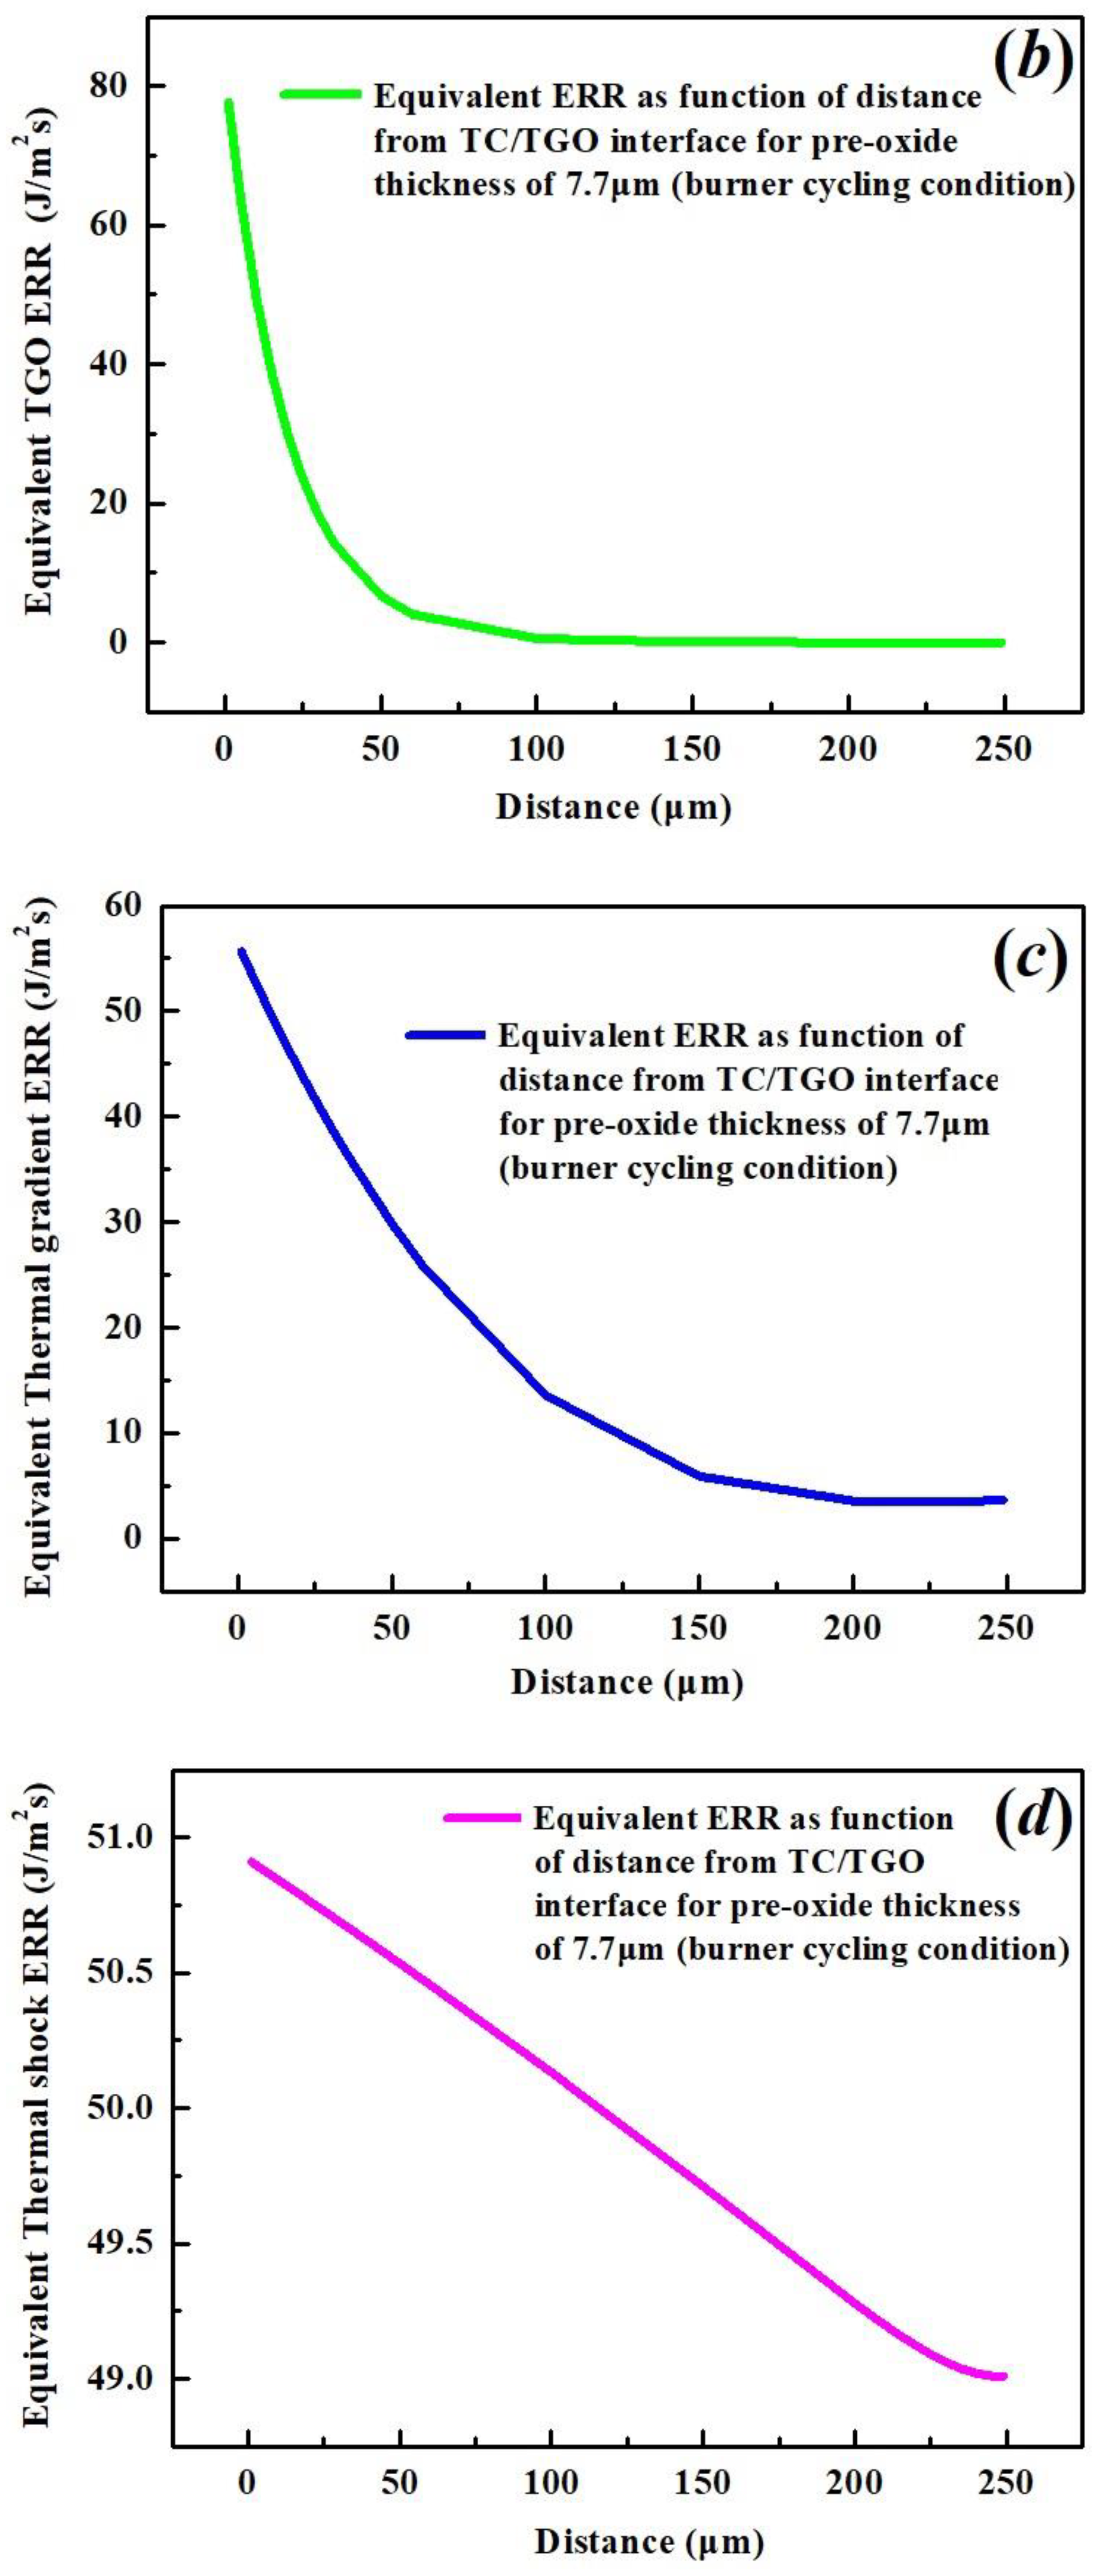
The equivalent ERRs in Section 4.1 to Section 4.4 are calculated 1 μm away from the interface between TC/TGO, where the current analytical models allow the estimation of crack driving forces at different depths with respect to pre-oxide thickness. Taking the pre-oxide thickness as 7.7 μm, the equivalent ERRs for different crack driving forces under burner cycling test are shown in Figure 19 vs. the distance away from the interface. The calculated equivalent ERRs, indicated by the spot in Figure 19a–d, are selected at positions close to the interface or surface of the TC, rather than at the middle of the TC layer.
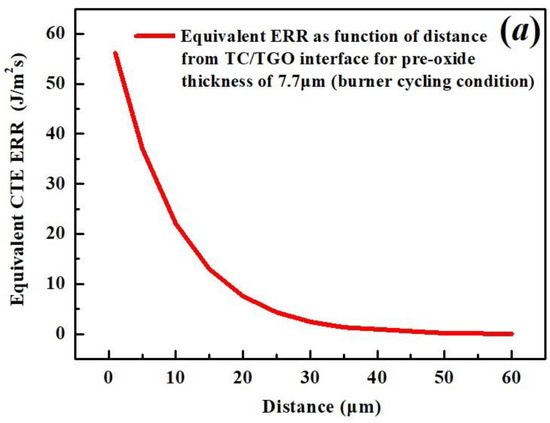
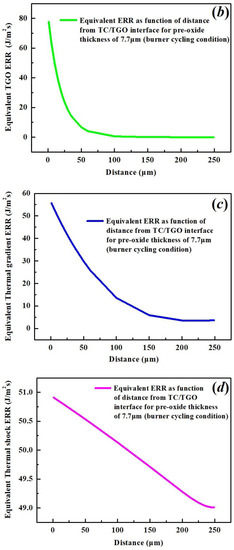
Figure 19.
The calculated equivalent ERR vs. the distance away from TC/TGO interface under burner cycling test due to (a) CTE misfit; (b) TGO growth; (c) thermal gradient; and (d) thermal shock.
It can be seen from Figure 19 that the equivalent ERRs decrease further away from the interface. Nevertheless, there are differences in magnitude among equivalent ERRs. The most affected by distance is the CTE ERR, Figure 19a. Regardless of the position of the x-coordinate, the calculated out-of-plane CTE stress is approximated to be zero as the distance away from the interface reaches 60 μm. This indicates that upon cooling, the region further than 60 μm from the interface is in compression, where the CTE ERR is zero. Therefore, the equivalent CTE ERR is calculated only for the distance within 60 μm. In comparison, distance does not affect the equivalent ERR generated due to thermal shock, Figure 19d. This might suggest that the effect of thermal shock is exerted throughout the entire TBC.
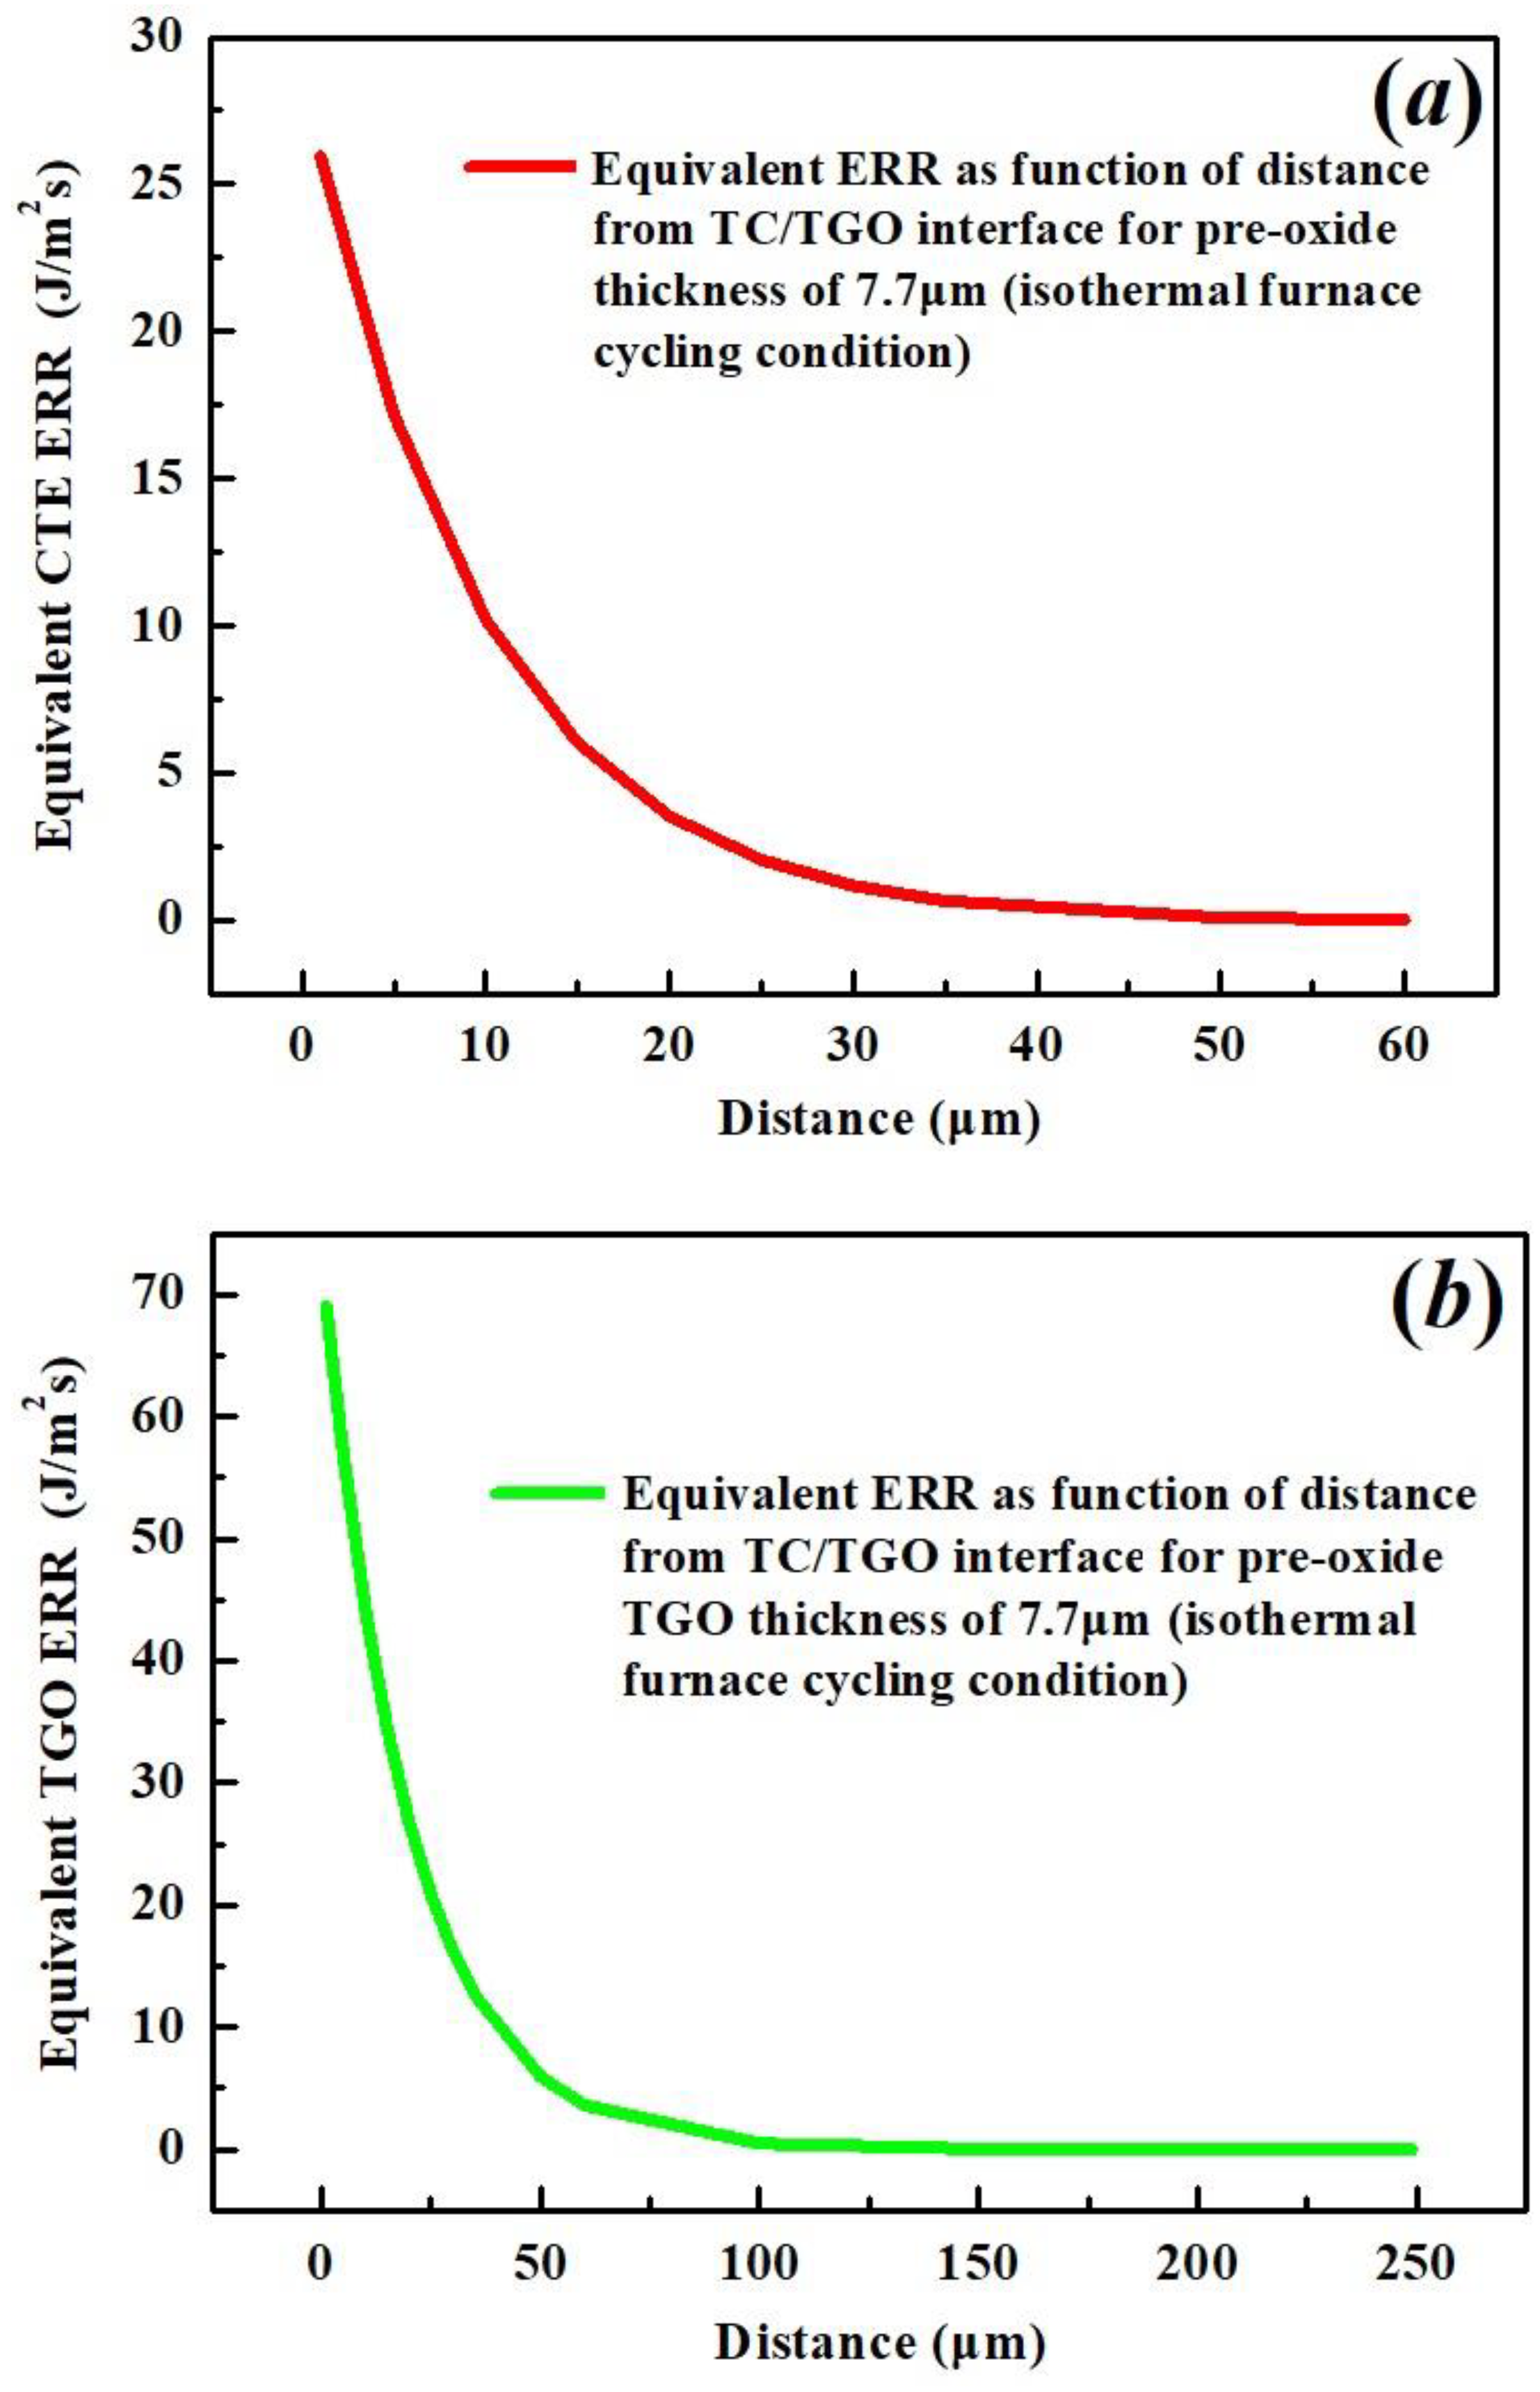
Similar to the results from burner cycling testing, the results for equivalent ERRs under isothermal furnace cycling tests are shown in Figure 20 as a function of distance.

Figure 20.
The calculated equivalent ERR vs. distance away from TC/TGO interface under iaothermal furnace cycling test due to (a) CTE misfit; (b) TGO growth.
Comparing the equivalent CTE and TGO ERR, the magnitudes of ERR obtained from the isothermal test are lower than those from the burner test (see Section 4.1 and Section 4.2). The difference between equivalent ERRs obtained from two thermal cycling tests also suggests a difference regarding possible cracking modes, which is different from the conclusion in [8]. From the burner cycling test results, the thermal gradient and equivalent thermal shock ERR with relatively high values close to the surface of TC indicate the possibility for vertical crack propagation perpendicular to the interface and penetrating in the direction of the TC thickness. These results were also suggested in [41,50].
However, for the isothermal furnace cycling test, all equivalent ERRs drop to zero when the position is close to the surface of the TC. This indicates that the maximum ERR is only possible close to the interface, where the nucleation of delamination cracks is found. The cracks propagate along the interface and lead to the spallation of the TC, which marks the failure of APS-TBCs.
5. Conclusions
In this paper, the crack driving forces for APS-TBCs are numerically quantified in terms of energy release rate (ERR) with respect to the pre-oxide thickness, under both burner cycling and isothermal furnace cycling testing from the literature, where material properties were characterized under two separate thermal treatments, isothermal preheating and further thermal cycling test. According to the test results, the concept of equivalent time is developed to connect the related parameters between the two different thermal processes. A new method was proposed to characterize the shifting of maximum out-of-plane CTE stress. The calculated results of equivalent ERR demonstrate a high pre-oxide thickness dependency, where differences are found for the calculated equivalent ERR due to CTE mismatch and TGO growth in burner cycling and isothermal furnace cycling tests. The effect of “mechanical interlocking” is demonstrated via equivalent CTE ERR vs. the pre-oxide thickness. There exists time-delay behavior for the calculated equivalent ERR due to thermal gradient and thermal shock.
For isothermal furnace cycling testing, it was demonstrated numerically that the calculated ERR due to TGO growth plays a critical role in determining the durability of APS-TBCs. For burner cycling testing, which simulates the temperature profile of an engine for short-time take off/landing, there exists a large ERR as a consequence of thermal gradient identified at different positions within the TC. Temperature differences arise from cooling, as well as thermal shock due to a rapid heating/cooling process. These two factors are expected to be the main crack driving forces under short-time thermal cycling service conditions, where the thermal gradient might introduce different crack routes. Real engine service conditions typically feature longer high-temperature dwell time and a slow heating/cooling process (also back-side cooling), such as the engine serving civil aircraft. Under such conditions, it is expected that the fraction of thermal gradient ERR generated during high-temperature dwell time increases, while the ERR due to thermal shock decreases. Although a relatively low temperature will be expected at the BC surface in the presence of thermal gradient, the relatively long dwell time makes it possible for slow TGO growth, which facilitates the crack propagation within the TGO layer and it becomes a dominating factor affecting the durability of TBCs.
Supplementary Materials
The following supporting information can be downloaded at: https://www.mdpi.com/article/10.3390/coatings12081069/s1, Figure S1: The thickness of pre-oxide TGO layer after isothermal pre-treatment at 1080 ℃; Figure S2: The increase in TC elastic modulus as function of sintering time under different temperatures; Figure S3: The calculated equivalent sintering time vs. preheat treatment sintering time; Figure S4: (a) The calculated TGO thickness using experimental data in [1] for model parameter fitting; (b) the calculated TGO thickness under isothermal furnace cycling at 1120 °C; Figure S5: The calculated elastic modulus of TC at different positions with pre-oxide thickness of 1.3 μm (a) for first three cycles; (b) during high-temperature dwell period; Figure S6: The calculated elastic modulus of TC at different positions with different pre-oxide thickness under isothermal furnace test (a) for first three cycles; (b) during high-temperature dwell period; Figure S7. Yield strength of bulk 7YSZ material [7]; Figure S8: The calculated yield strength of 7YSZ TC as a function of thermal cycling time; Figure S9: The process-dependent isothermal crack length as a function of time: (a) pre-oxide TGO thickness less than critical TGO thickness (5.5 μm); (b) pre-oxide TGO thickness more than critical TGO thickness (5.5 μm); Figure S10: The calculated compliance coefficient a11 as a function of thermal cycles for different pre-oxide thickness; Figure S11: The calculated average aij as a function of pre-oxide thickness (a) a11 (b) a22; Figure S12. The calculated compliance coefficient c12 as a function of thermal cycles for different pre-oxide thickness; Figure S13: The calculated average cij as a function of pre-oxide thickness (a) c11 (b) c12 (c) c21 (d) c22; Figure S14: A schematic of the tri-layer coating system identifying the parameters used in the analysis; Figure S15: The dimensionless quantity used as parameters characterizing the inhomogeneity in TC as a function of time: for upon (a) heating (b) cooling and for upon (c) heating (d) cooling; Table S1: The calculated equivalent initial TGO growth time for isothermal furnace cycling test. References [51,52,53,54,55,56,57] are cited in the supplementary materials.
Author Contributions
B.Z.: Conceptualization, Methodology, Validation, Investigation, Writing—original draft. K.C.: Conceptualization, Writing—review and editing, Supervision, Project administration, Resources, Funding acquisition. N.B.: Writing—review and editing, Supervision, Resources, Funding acquisition. All authors have read and agreed to the published version of the manuscript.
Funding
This research was supported by the Air Defence System Program of the National Research Council Canada (DTS-NRC 2016-2017). This work was also financially supported by the Natural Sciences and Engineering Research Council of Canada under grant number (RGPIN-2016-04190).
Institutional Review Board Statement
Not applicable.
Informed Consent Statement
Not applicable.
Data Availability Statement
Conflicts of Interest
The authors report no declarations of interest.
Nomenclature
| Symbols | Physical implication |
| Mechanical/Thermal properties of different layers | |
| E | Elastic modulus |
| κ | Bulk modulus |
| μ | Shear modulus |
| ν | Poisson’s ratio |
| α | Coefficient of thermal expansion |
| σY | Yielding strength |
| Pilling–Bedworth ratio for BC oxidation | |
| Geometrical parameters in TBCs | |
| H | TC thickness |
| dTGO | TGO thickness |
| S(x) | Roughness curve undulations |
| β(x) | Angle between the tangent to the roughness curve |
| A | Roughness amplitude |
| W | Roughness Wavelength |
| b | Sintering crack length |
| g(y) | Positions for residual stress evaluations |
| Y | Cracking tip geometrical parameter |
| Thermal cycling environments | |
| T | Temperature profile |
| ΔT | Temperature difference |
| t | Time |
| N | Number of thermal cycles |
| Calculated intermediate/final variables | |
| σ (σij) | Residual stress (Cauchy stress tensor) |
| ε | Strain |
| F | Force per length |
| M | Moment per length |
| KI (KII) | Mode I (Mode II) Stress intensity factor |
| Equivalent Energy Flux | |
| Mode mixture | |
| Dtr | Inelastic stretching tensor |
| f | Normalized fraction of the oxidizing phase |
| σV | Equivalent Von Mises stress |
| sij | Deviatoric stress tensor |
| Mean local dilatational strain | |
References
- Evans, A.G.; He, M.Y.; Hutchinson, J.W. Mechanics-based scaling laws for the durability of thermal barrier coatings. Prog. Mater. Sci. 2001, 46, 249–271. [Google Scholar] [CrossRef]
- Chen, W.R.; Archer, R.; Huang, X.; Marple, B.R. TGO Growth and Crack Propagation in a Thermal Barrier Coating. J. Therm. Spray Technol. 2008, 17, 858–864. [Google Scholar] [CrossRef]
- Karaoglanli, A.; Altuncu, E.; Ozdemir, I.; Turk, A.; Ustel, F. Structure and durability evaluation of YSZ + Al2O3 composite TBCs with APS and HVOF bond coats under thermal cycling conditions. Surf. Coat. Technol. 2011, 205, S369–S373. [Google Scholar] [CrossRef]
- Mahade, S.; Curry, N.; Björklund, S.; Markocsan, N.; Joshi, S. Durability of Gadolinium Zirconate/YSZ Double-Layered Thermal Barrier Coatings under Different Thermal Cyclic Test Conditions. Materials 2019, 12, 2238. [Google Scholar] [CrossRef] [PubMed] [Green Version]
- Kromer, R.; Cormier, J.; Costil, S.; Courapied, D.; Berthe, L.; Peyre, P. High temperature durability of a bond-coatless plasma-sprayed thermal barrier coating system with laser textured Ni-based single crystal substrate. Surf. Coatings Technol. 2018, 337, 168–176. [Google Scholar] [CrossRef] [Green Version]
- Huang, J.; Wang, W.; Li, Y.; Fang, H.; Ye, D.; Zhang, X.; Tu, S. Improve durability of plasma-splayed thermal barrier coatings by decreasing sintering-induced stiffening in ceramic coatings. J. Eur. Ceram. Soc. 2019, 40, 1433–1442. [Google Scholar] [CrossRef]
- Spitsberg, I.; More, K. Effect of thermally grown oxide (TGO) microstructure on the durability of TBCs with PtNiAl diffusion bond coats. Mater. Sci. Eng. A 2006, 417, 322–333. [Google Scholar] [CrossRef]
- Li, C.-J.; Dong, H.; Ding, H.; Yang, G.-J.; Li, C.-X. The Correlation of the TBC Lifetimes in Burner Cycling Test with Thermal Gradient and Furnace Isothermal Cycling Test by TGO Effects. J. Therm. Spray Technol. 2017, 26, 378–387. [Google Scholar] [CrossRef]
- Dong, H.; Yang, G.; Li, C.-X.; Luo, X.-T.; Li, C.-J. Effect of TGO Thickness on Thermal Cyclic Lifetime and Failure Mode of Plasma-Sprayed TBCs. J. Am. Ceram. Soc. 2014, 97, 1226–1232. [Google Scholar] [CrossRef]
- Sohn, Y.; Kim, J.; Jordan, E.; Gell, M. Thermal cycling of EB-PVD/MCrAlY thermal barrier coatings: I. Microstructural development and spallation mechanisms. Surf. Coat. Technol. 2001, 146–147, 70–78. [Google Scholar] [CrossRef]
- Cheng, B.; Zhang, Y.-M.; Yang, N.; Zhang, M.; Chen, L.; Yang, G.-J.; Li, C.-X.; Li, C.-J. Sintering-induced delamination of thermal barrier coatings by gradient thermal cyclic test. J. Am. Ceram. Soc. 2017, 100, 1820–1830. [Google Scholar] [CrossRef]
- Xie, X.; Guo, H.; Gong, S.; Xu, H. Thermal cycling behavior and failure mechanism of LaTi2Al9O19/YSZ thermal barrier coatings exposed to gas flame. Surf. Coatings Technol. 2011, 205, 4291–4298. [Google Scholar] [CrossRef]
- Yang, S.; Yuan, H.; Zeng, W.; Guo, H. Chemo-thermo-mechanical modeling of EB-PVD TBC failure subjected to isothermal and cyclic thermal exposures. Int. J. Fatigue 2020, 141, 105817. [Google Scholar] [CrossRef]
- Zhao, X.; Wang, X.; Xiao, P. Sintering and failure behaviour of EB-PVD thermal barrier coating after isothermal treatment. Surf. Coat. Technol. 2006, 200, 5946–5955. [Google Scholar] [CrossRef]
- Beck, T.; Herzog, R.; Trunova, O.; Offermann, M.; Steinbrech, R.W.; Singheiser, L. Damage mechanisms and lifetime behavior of plasma-sprayed thermal barrier coating systems for gas turbines—Part II: Modeling. Surf. Coat. Technol. 2008, 202, 5901–5908. [Google Scholar] [CrossRef]
- Zhang, B.; Chen, K.; Baddour, N.; Patnaik, P. Failure and life evaluation of EB-PVD thermal barrier coatings using temperature-process-dependent model parameters. Corros. Sci. 2019, 156, 1–9. [Google Scholar] [CrossRef]
- Giolli, C.; Scrivani, A.; Rizzi, G.; Borgioli, F.; Bolelli, G.; Lusvarghi, L. Failure Mechanism for Thermal Fatigue of Thermal Barrier Coating Systems. J. Therm. Spray Technol. 2009, 18, 223–230. [Google Scholar] [CrossRef]
- Ruud, J.A.; Bartz, A.; Borom, M.P.; Johnson, C.A. Strength Degradation and Failure Mechanisms of Electron-Beam Physical-Vapor-Deposited Thermal Barrier Coatings. J. Am. Ceram. Soc. 2001, 84, 1545–1552. [Google Scholar] [CrossRef]
- Zhang, B.; Chen, K.; Baddour, N.; Patnaik, P.C. Life Prediction of Atmospheric Plasma-Sprayed Thermal Barrier Coatings Using Temperature-Dependent Model Parameters. J. Therm. Spray Technol. 2017, 26, 902–912. [Google Scholar] [CrossRef]
- Vaßen, R.; Giesen, S.; Stöver, D. Lifetime of Plasma-Sprayed Thermal Barrier Coatings: Comparison of Numerical and Experimental Results. J. Therm. Spray Technol. 2009, 18, 835–845. [Google Scholar] [CrossRef]
- Zhou, L.; Mukherjee, S.; Huang, K.; Park, Y.W.; Sohn, Y. Failure characteristics and mechanisms of EB-PVD TBCs with Pt-modified NiAl bond coats. Mater. Sci. Eng. A 2015, 637, 98–106. [Google Scholar] [CrossRef]
- Fleck, N.; Cocks, A.; Lampenscherf, S. Thermal shock resistance of air plasma sprayed thermal barrier coatings. J. Eur. Ceram. Soc. 2014, 34, 2687–2694. [Google Scholar] [CrossRef]
- Bolcavage, A.; Feuerstein, A.; Foster, J.; Moore, P. Thermal Shock Testing of Thermal Barrier Coating/Bondcoat Systems. J. Mater. Eng. Perform. 2004, 13, 389–397. [Google Scholar] [CrossRef]
- Ramaswamy, P.; Seetharamu, S.; Varma, K.B.R.; Rao, K.J. Thermal Shock Characteristics of Plasma Sprayed Mullite Coatings. J. Therm. Spray Technol. 1998, 7, 497–504. [Google Scholar] [CrossRef]
- Kim, J.; Kim, M.; Park, C. Evaluation of functionally graded thermal barrier coatings fabricated by detonation gun spray technique. Surf. Coat. Technol. 2003, 168, 275–280. [Google Scholar] [CrossRef]
- Feist, J.P.; Sollazzo, P.Y.; Pilgrim, C.C.; Nicholls, J. Operation of a Burner Rig for Thermal Gradient Cycling of Thermal Barrier Coatings. In Proceedings of the ASME Turbo Expo, Düsseldorf, Germany, 16–20 June 2014. [Google Scholar] [CrossRef]
- Mack, D.E.; Wobst, T.; Jarligo, M.O.D.; Sebold, D.; Vaßen, R. Lifetime and failure modes of plasma sprayed thermal barrier coatings in thermal gradient rig tests with simultaneous CMAS injection. Surf. Coat. Technol. 2017, 324, 36–47. [Google Scholar] [CrossRef]
- Drexler, J.M.; Aygun, A.; Li, D.; Vaßen, R.; Steinke, T.; Padture, N. Thermal-gradient testing of thermal barrier coatings under simultaneous attack by molten glassy deposits and its mitigation. Surf. Coat. Technol. 2010, 204, 2683–2688. [Google Scholar] [CrossRef]
- Lima, R.S.; Marple, B.R.; Marcoux, P. Thermal Gradient Behavior of TBCs Subjected to a Laser Gradient Test Rig: Simulating an Air-to-Air Combat Flight. J. Therm. Spray Technol. 2015, 25, 282–290. [Google Scholar] [CrossRef]
- Simms, N.; Kilgallon, P.; Roach, C.; Oakey, J. Development of oxides at TBC—Bond coat interfaces in burner rig exposures. Mater. High Temp. 2003, 20, 519–526. [Google Scholar] [CrossRef]
- Beele, W.; Marijnissen, G.; van Lieshout, A. The evolution of thermal barrier coatings—Status and upcoming solutions for today’s key issues. Surf. Coat. Technol. 1999, 120–121, 61–67. [Google Scholar] [CrossRef]
- Hodge, P.E.; Stecura, S.; Gedwill, M.A.; Zaplatynsky, I.; Levine, S.R. Thermal barrier coatings: Burner rig hot corrosion test results. J. Mater. Energy Syst. 1980, 1, 47–58. [Google Scholar] [CrossRef] [Green Version]
- Xu, T.; He, M.; Evans, A. A numerical assessment of the durability of thermal barrier systems that fail by ratcheting of the thermally grown oxide. Acta Mater. 2003, 51, 3807–3820. [Google Scholar] [CrossRef]
- Karaoglanli, A.C.; Türk, A.; Özdemir, I.; Ustel, F. Comparison of Oxidation and Thermal Shock Performance of Thermal Barrier Coatings. Mater. Manuf. Process. 2014, 30, 717–723. [Google Scholar] [CrossRef]
- Mumm, D. The influence of test method on failure mechanisms and durability of a thermal barrier system. Acta Mater. 2004, 52, 1123–1131. [Google Scholar] [CrossRef]
- Evans, A.; Hutchinson, J. The mechanics of coating delamination in thermal gradients. Surf. Coat. Technol. 2007, 201, 7905–7916. [Google Scholar] [CrossRef]
- Freborg, A.; Ferguson, B.; Brindley, W.; Petrus, G. Modeling oxidation induced stresses in thermal barrier coatings. Mater. Sci. Eng. A 1998, 245, 182–190. [Google Scholar] [CrossRef]
- Sfar, K.; Aktaa, J.; Munz, D. Numerical investigation of residual stress fields and crack behavior in TBC systems. Mater. Sci. Eng. A 2002, 333, 351–360. [Google Scholar] [CrossRef]
- Białas, M. Finite element analysis of stress distribution in thermal barrier coatings. Surf. Coat. Technol. 2008, 202, 6002–6010. [Google Scholar] [CrossRef]
- Tanaka, K. Fatigue crack propagation from a crack inclined to the cyclic tensile axis. Eng. Fract. Mech. 1974, 6, 493–507. [Google Scholar] [CrossRef]
- Hutchinson, J.; Evans, A. On the delamination of thermal barrier coatings in a thermal gradient. Surf. Coat. Technol. 2002, 149, 179–184. [Google Scholar] [CrossRef]
- Rajasekaran, B.; Mauer, G.; Vaßen, R. Enhanced Characteristics of HVOF-sprayed MCrAlY Bond Coats for TBC Applications. J. Therm. Spray Technol. 2011, 20, 1209–1216. [Google Scholar] [CrossRef]
- Liu, Z.-G.; Zhang, W.-H.; Ouyang, J.-H.; Zhou, Y. Novel thermal barrier coatings based on rare-earth zirconates/YSZ double-ceramic-layer system deposited by plasma spraying. J. Alloy. Compd. 2015, 647, 438–444. [Google Scholar] [CrossRef]
- Lima, C.; Guilemany, J. Adhesion improvements of Thermal Barrier Coatings with HVOF thermally sprayed bond coats. Surf. Coat. Technol. 2007, 201, 4694–4701. [Google Scholar] [CrossRef]
- Hsueh, C.H.; Haynes, J.; Lance, M.; Becher, P.; Ferber, M.; Langer, S.A.; Carter, W.; Cannon, W.R.; Lum, L.S.H. Effects of Bond Coat Surface-Roughness on Residual Stresses of Thermal Barrier Coating Systems. Available online: https://www.nist.gov/publications/effects-bond-coat-surface-roughness-residual-stresses-thermal-barrier-coating-systems (accessed on 29 July 2021).
- Hsueh, C.; Becher, P.F.; Fuller, E.R.; Langer, S.; Carter, W. Surface-Roughness Induced Residual Stresses in Thermal Barrier Coatings: Computer Simulations. Mater. Sci. Forum 1999, 308–311, 442–449. [Google Scholar] [CrossRef] [Green Version]
- Meier, S.M.; Gupta, D.K. The Evolution of Thermal Barrier Coatings in Gas Turbine Engine Applications. J. Eng. Gas Turbines Power 1994, 116, 250–257. [Google Scholar] [CrossRef] [Green Version]
- Ahrens, M.; Vaßen, R.; Stöver, D. Stress distributions in plasma-sprayed thermal barrier coatings as a function of interface roughness and oxide scale thickness. Surf. Coat. Technol. 2002, 161, 26–35. [Google Scholar] [CrossRef]
- Xin, Q. Durability and reliability in diesel engine system design. Diesel Engine Syst. Des. 2013, 113–202. [Google Scholar] [CrossRef]
- Yanar, N.M.; Helminiak, M.; Meier, G.H.; Pettit, F.S. Comparison of the Failures during Cyclic Oxidation of Yttria-Stabilized (7 to 8 Weight Percent) Zirconia Thermal Barrier Coatings Fabricated via Electron Beam Physical Vapor Deposition and Air Plasma Spray. Met. Mater. Trans. A 2010, 42, 905–921. [Google Scholar] [CrossRef] [Green Version]
- Zhang, B.; Chen, K.; Baddour, N. Stress models for electron beam-physical vapor deposition thermal barrier coatings using temperature-process-dependent model parameters. J. Eur. Ceram. Soc. 2021. [Google Scholar] [CrossRef]
- Dong, H.; Yang, G.-J.; Cai, H.-N.; Ding, H.; Li, C.-X.; Li, C.-J. The influence of temperature gradient across YSZ on thermal cyclic lifetime of plasma-sprayed thermal barrier coatings. Ceram. Int. 2015, 41 Pt A, 11046–11056. [Google Scholar] [CrossRef]
- Evans, A.G.; Clarke, D.R.; Levi, C.G. The influence of oxides on the performance of advanced gas turbines. J. Eur. Ceram. Soc. 2008, 28, 1405–1419. [Google Scholar] [CrossRef]
- Von Mises Criterion (Maximum Distortion Energy Criterion) - Strength (Mechanics) of Materials - Engineers Edge. Available online: https://www.engineersedge.com/material_science/von_mises.htm (accessed on 12 January 2022).
- Busso, E.P.; Lin, J.; Sakurai, S.; Nakayama, M. A mechanistic study of oxidation-induced degradation in a plasma-sprayed thermal barrier coating system.: Part I: Model formulation. Acta Mater. 2001, 49, 1515–1528. [Google Scholar] [CrossRef]
- Busso, E.P. Oxidation-induced stresses in ceramic-metal interfaces. J. Phys. IV 1999, 9, Pr9-287–Pr9-296. [Google Scholar] [CrossRef]
- Yu, H.-H.; Hutchinson, J.W. Influence of substrate compliance on buckling delamination of thin films. Int. J. Fract. 2002, 113, 39–55. [Google Scholar] [CrossRef]


Publisher’s Note: MDPI stays neutral with regard to jurisdictional claims in published maps and institutional affiliations. |
© 2022 by the authors. Licensee MDPI, Basel, Switzerland. This article is an open access article distributed under the terms and conditions of the Creative Commons Attribution (CC BY) license (https://creativecommons.org/licenses/by/4.0/).