Article

All-Dielectric Refractive Index Sensor Based on Multiple Fano Resonance with High Sensitivity in the Long-Wave Infrared Region

1
Key Laboratory of Optical System Advanced Manufacturing Technology, Changchun Institute of Optics, Fine Mechanics and Physics, Chinese Academy of Sciences, Changchun 130033, China
2
University of the Chinese Academy of Sciences, Beijing 100039, China
*
Author to whom correspondence should be addressed.
Coatings 2022, 12(7), 970; https://doi.org/10.3390/coatings12070970
Submission received: 9 June 2022 / Revised: 3 July 2022 / Accepted: 5 July 2022 / Published: 8 July 2022
(This article belongs to the Section Functional Polymer Coatings and Films)

Abstract

:
In this paper, we propose an all-dielectric metamaterials structure which contains four asymmetric square holes in the unit cell to design a high-sensitivity refractive index sensor in the long-wave infrared region. Theoretical analysis of the electromagnetic field distributions shows that the four transmission dips originate from magnetic dipole, electric quadrupole and Toroidal dipole. And its position can be tuned by adjusting different geometric parameters, which can optimize the structure to obtain a narrower linewidth to improve the performance of the sensor. Finally, we evaluate the performance of the structure as refractive index sensor by changing the refractive index of the tested substrate. The results show the refractive index sensor has high sensitivity in the long-wave infrared region: the highest sensitivity is 2803 nm/RIU and the figure of merit will reach up to 350.

1. Introduction

Refractive index (RI) is an inherent property of materials. It is very important to identify different substances through the detection of RI in many fields, such as biological sensing [1,2,3], agriculture, food industry and other fields [4,5]. So far, many methods have been used for RI sensing, among which metamaterials [6,7] have attracted much attention because of their unique advantages such as simple volume, simple fabrication, and low losses. In the application of RI sensing, metamaterials are divided into plasmonic-based metamaterials and all dielectric-based [8] metamaterials. However, the metals used in plasmonic structures have intrinsic loss that leads to lower efficiency at optical frequencies [9,10]. These disadvantages will weaken the performance of RI device. All dielectric-based structures are favored because of their low losses versus plasmonic structures [11].
In the application of RI sensor, Fano resonance [12,13,14] is an effective method to improve the sensitivity (S) of RI sensor: a narrower linewidth and a large local field enhancement. The Fano resonance phenomenon was first discovered by Ugo Fano [15,16] in atomic physics, which originated from the interference between continuous state scattering and excited discrete states [17] meanwhile the difference of amplitude and phase between the two states leads to the asymmetric line shape of Fano resonance [18]. At present, the research interest of Fano resonance has shifted from single Fano resonance to multiple Fano resonance because of the different applications. Multiple Fano resonance [19,20,21,22,23] can be widely used in multi wavelength surface enhanced spectroscopy, multi-band slow light devices and multi-channel biosensors. For example, a multiple Fano resonance all-dielectric devices for RI sensing was proposed by Su et al. [24] whose the maximum S is 392 nm/RIU.
And by changing the size and shape of the all-dielectric metamaterials structure, we can adjust the resonance mode [25]. Based on this unique optical characteristic, it provides us with a method to improve the S of RI sensing. For example, an effective method is to obtain higher Q Fano resonance based on bound states in the continuum(BIC) [26,27] to obtain higher sensitivity RI sensing. BIC refers to a state in which the localized state with zero linewidth coexists with the continuous spectrum [28,29]. However, optical BICs shows zero linewidth and infinite Q value, which can not be used in the actual optical system. For practical application, BICs must be converted to the so-called quasi-BICs, which has higher Q value and narrower resonant linewidth [30]. At present, the most commonly used and effective method is to introduce asymmetry in the unit cell, which transforms BIC to quasi BICs governed by symmetry-protected BICs [31].
In this paper, we propose an all-dielectric metamaterials structure which contains four asymmetric square holes in the unit cell to design a high-sensitivity RI sensor in the long-wave infrared region. When the sizes of the four square nanoholes are the same, there are only two Fano resonance dips. By changing the size of the square hole to introduce asymmetry, four Fano resonance transmission dips will be produced which is because the asymmetric structure introduces two quasi-BIC resonance modes. Next, we analyze the electromagnetic field distributions of the four transmission dips, which are excited by magnetic dipole (MD), electric quadrupole (EQ), toroidal dipole (TD) and magnetic dipole respectively. Finally, we evaluate the performance of the structure as RI sensor by changing the RI of the tested substrate. The results show the RI sensor has high S in the long-wave infrared region: the highest S is 2803 nm/RIU and the figure of merit will reach up to 350.

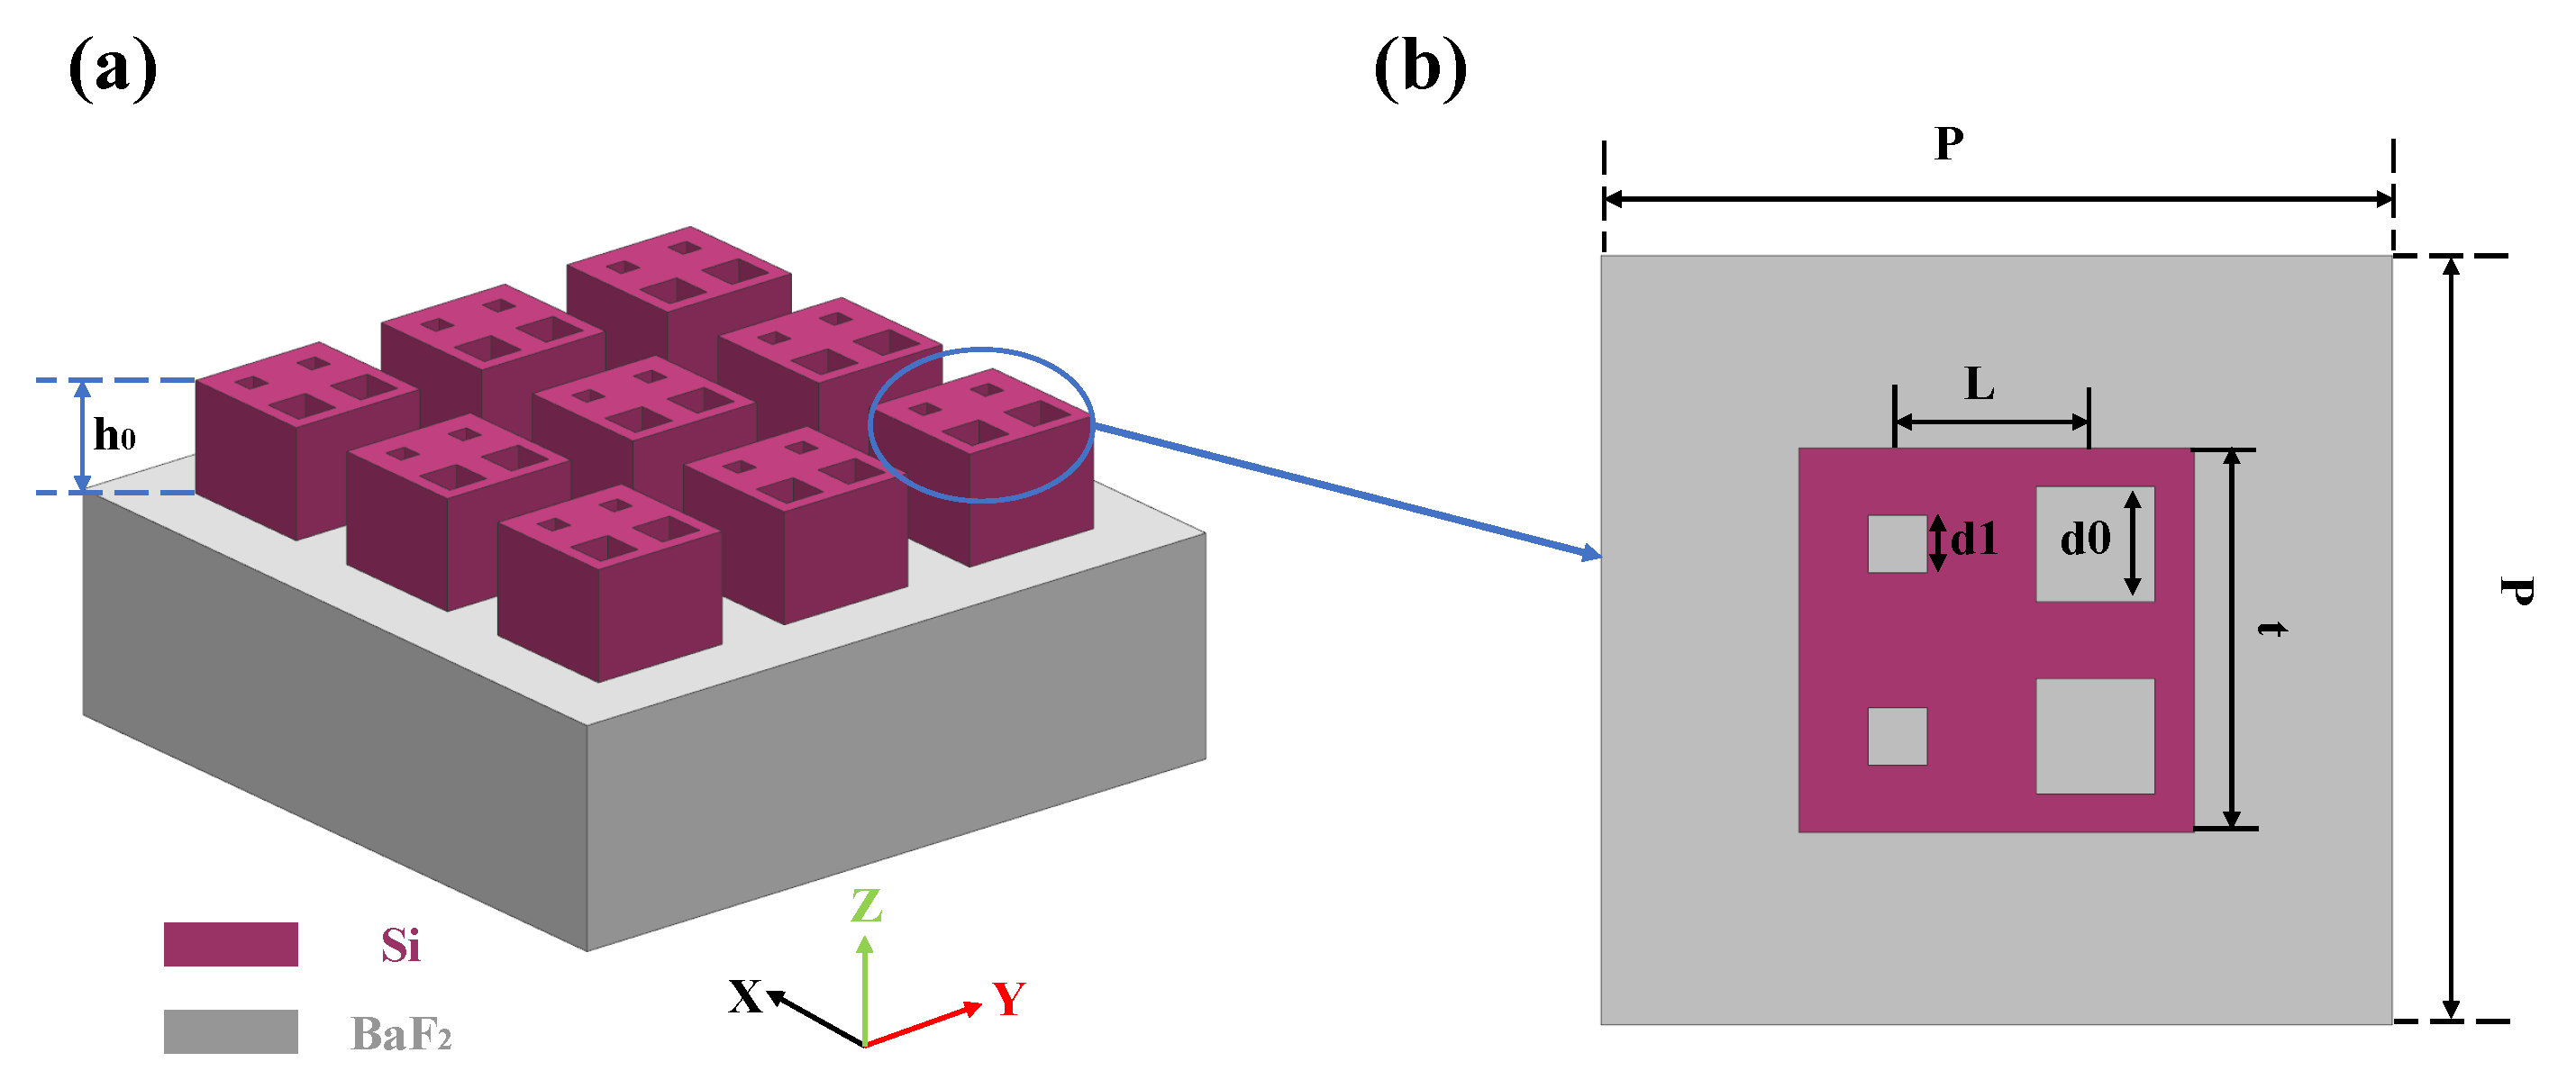
2. Unit Structure and Simulation Methods

As shown in the figure above, Figure 1a is the structural diagram of the designed high-sensitivity RI sensor, and Figure 1b shows the structural details of each unit cell. The designed RI sensor is composed of two layers: the top layers of structure contains four asymmetric nanoholes etched in the square Si structure, and the lower layer is barium fluoride (BF2) substrate. The period p of each unit cell is set to 6.2 µm, the thickness h 0 of the top layers of structure is 1.6 µm, the side length t is 5 µm, d0 and d1 is the side length of the nano square hole, and the distance L between the centers of the two square holes is 2 µm and the whole structure is immersed in a medium with RI of 1.33. We used a finite difference time-domain (FDTD) algorithm to analyze the optical proprieties of proposed RI sensor and set periodic boundary conditions along x and y directions; perfectly matched layers were selected in the z direction and it acted as a near-ideal absorber to simulate electromagnetic wave transmission to infinity. The permittivity values of Si and BF2 in the analysis were derived from Palik [32]. The polarization direction of the incident light is along Y axis of the asymmetric axis of the structure, which is to excite more obvious resonance dips responses. Meanwhile the mesh accuracy was set to 10 nm to ensure simulation precision. At the same time, we also analyze the feasibility of the experimental manufacture of the proposed RI sensor. The manufacturing process of the proposed RI sensor is well compatible with the traditional complementary metal-oxide-semiconductor (CMOS) technology. And a similar structure has been implemented in the previous work [33].

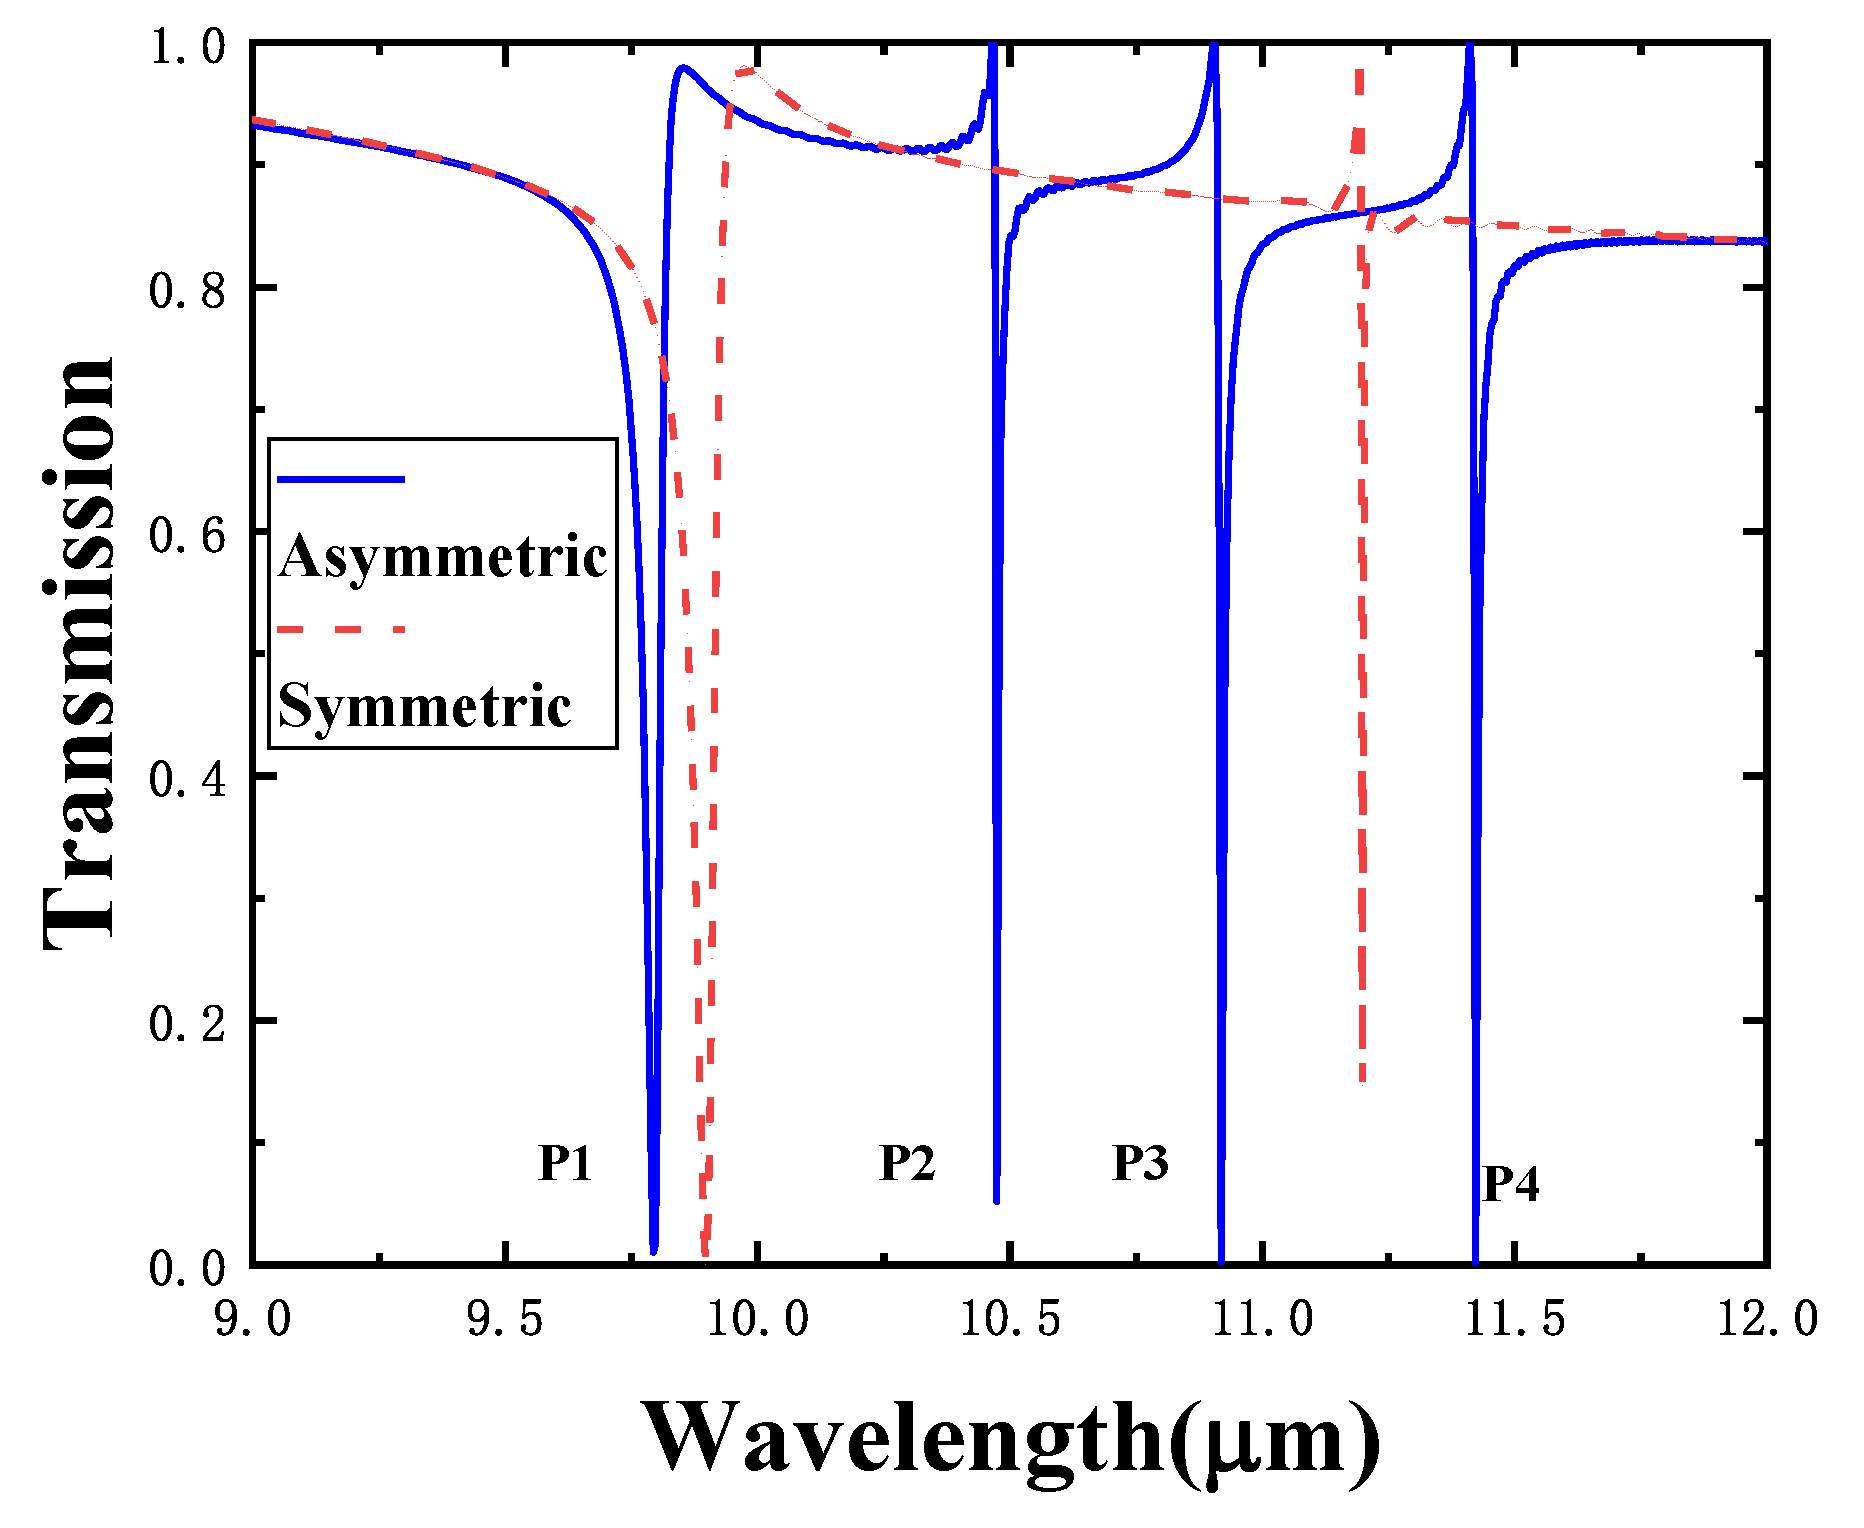
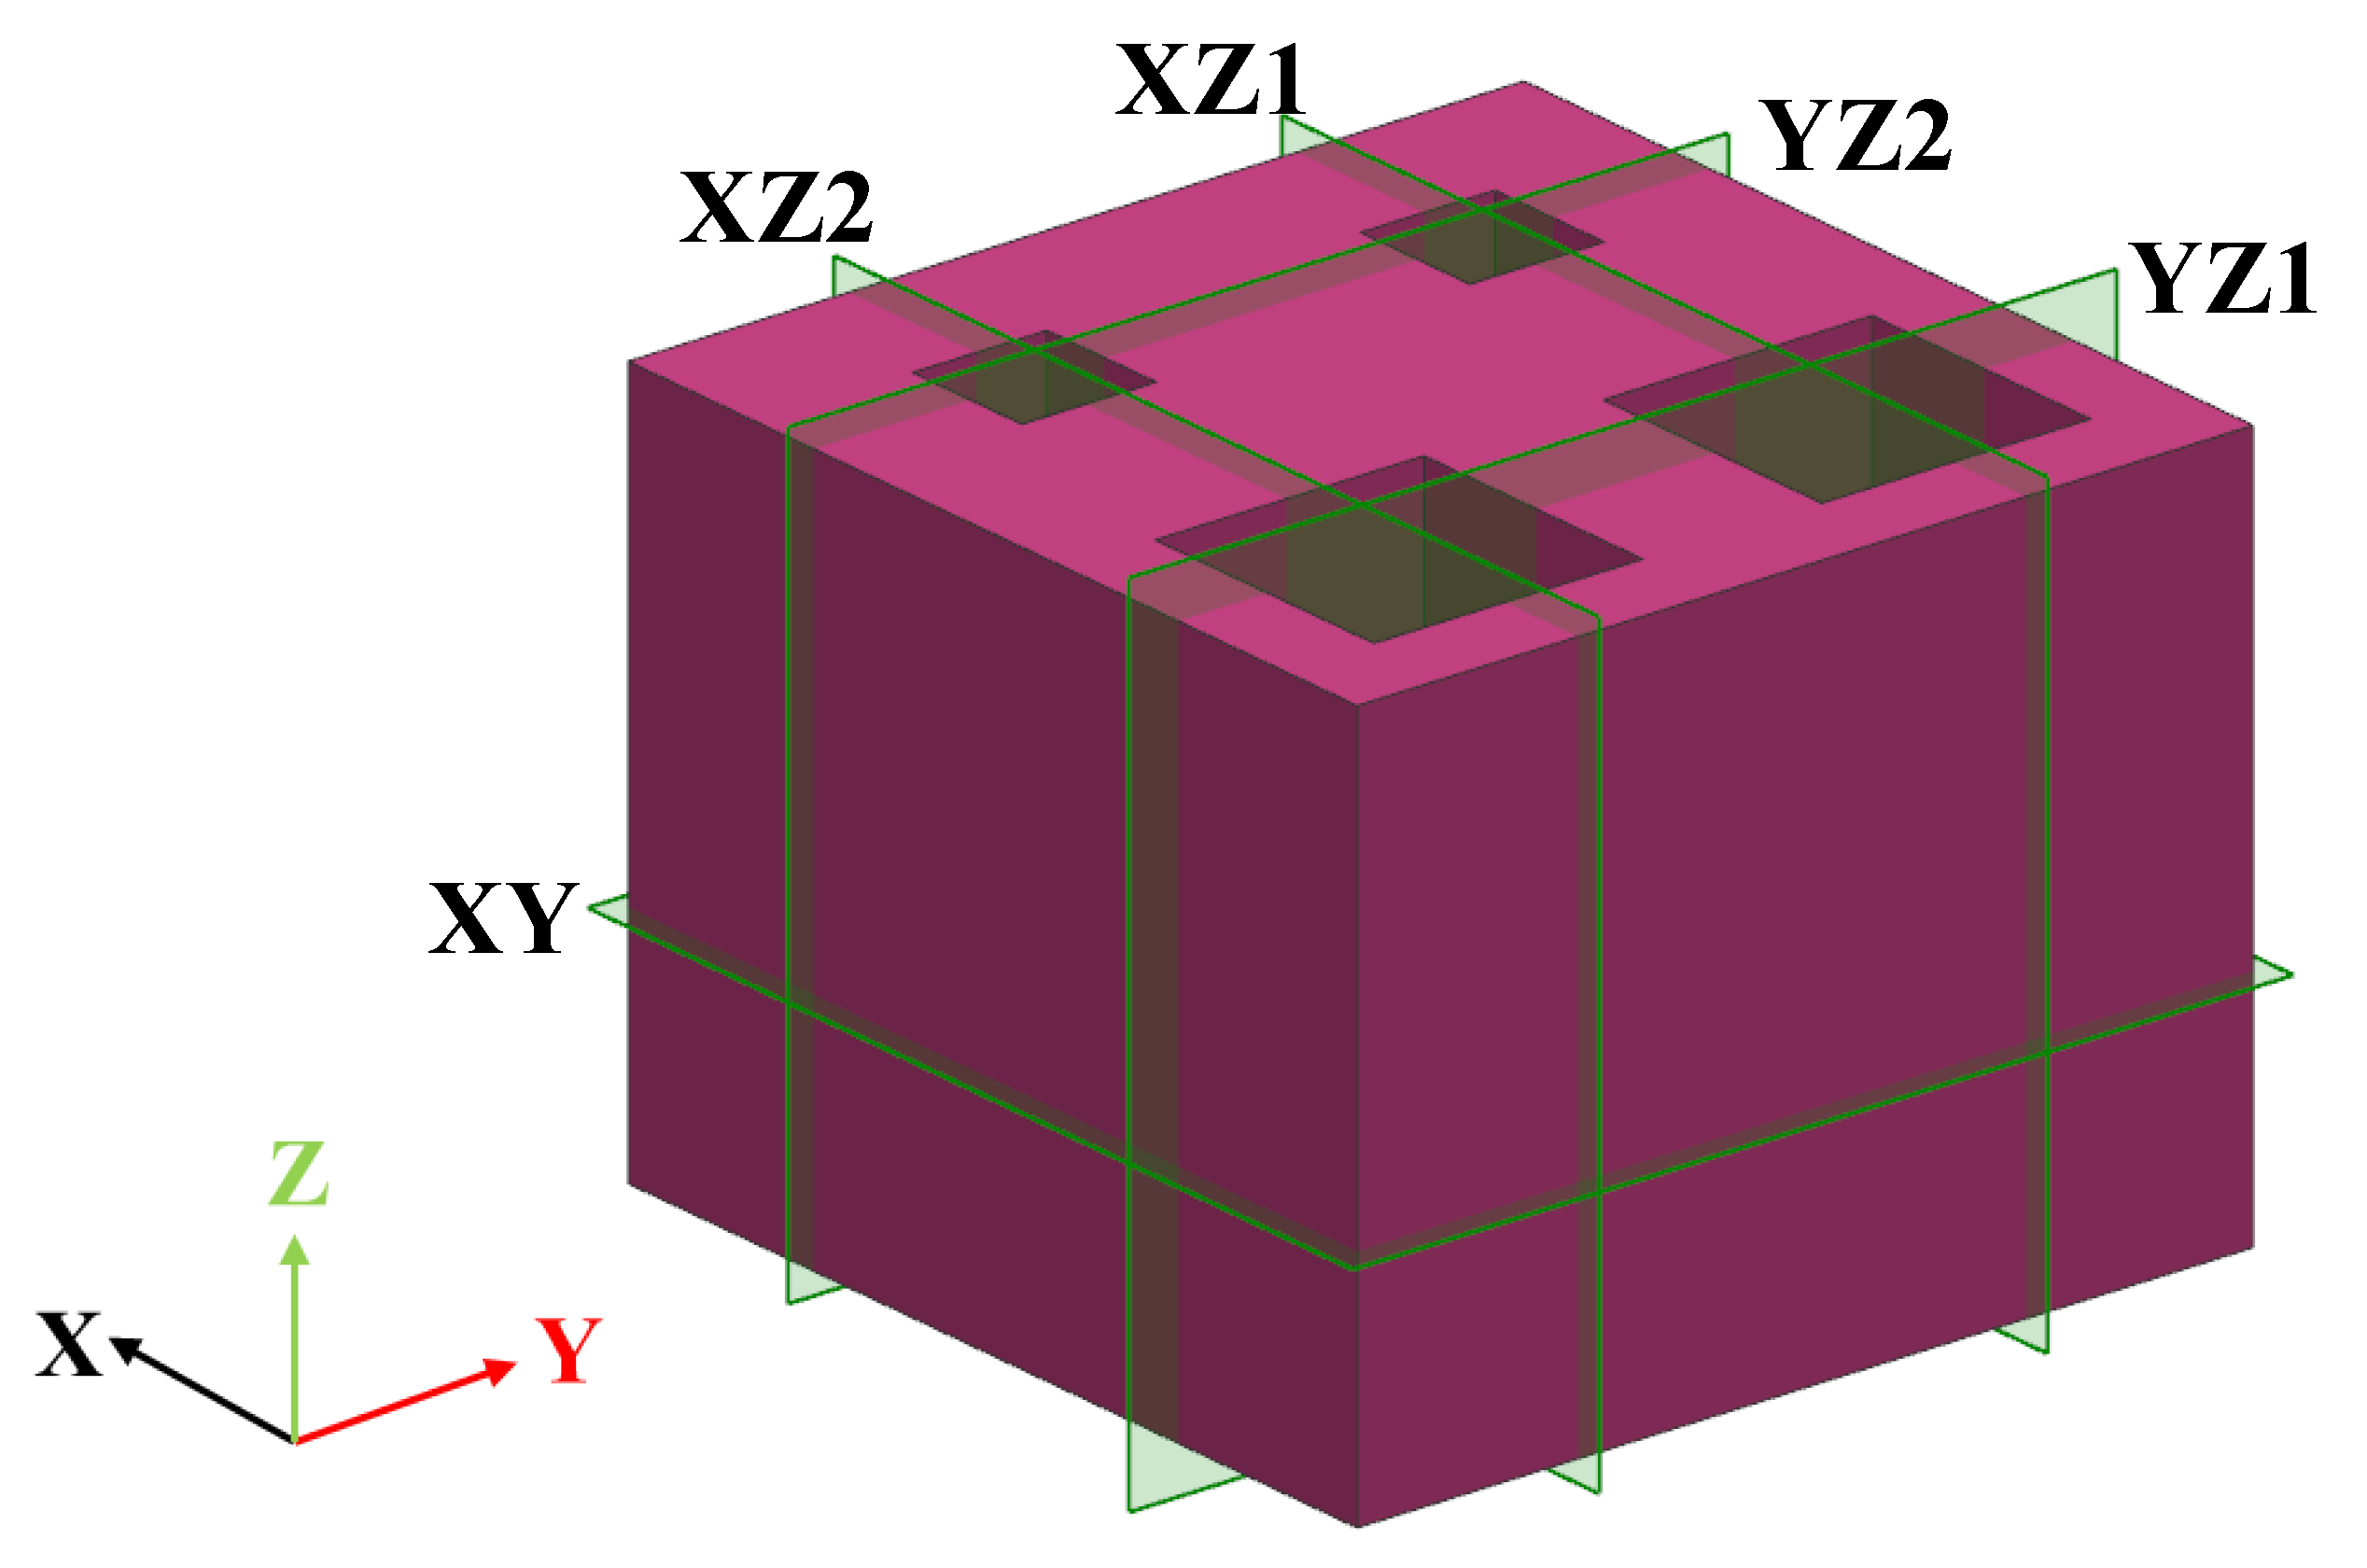
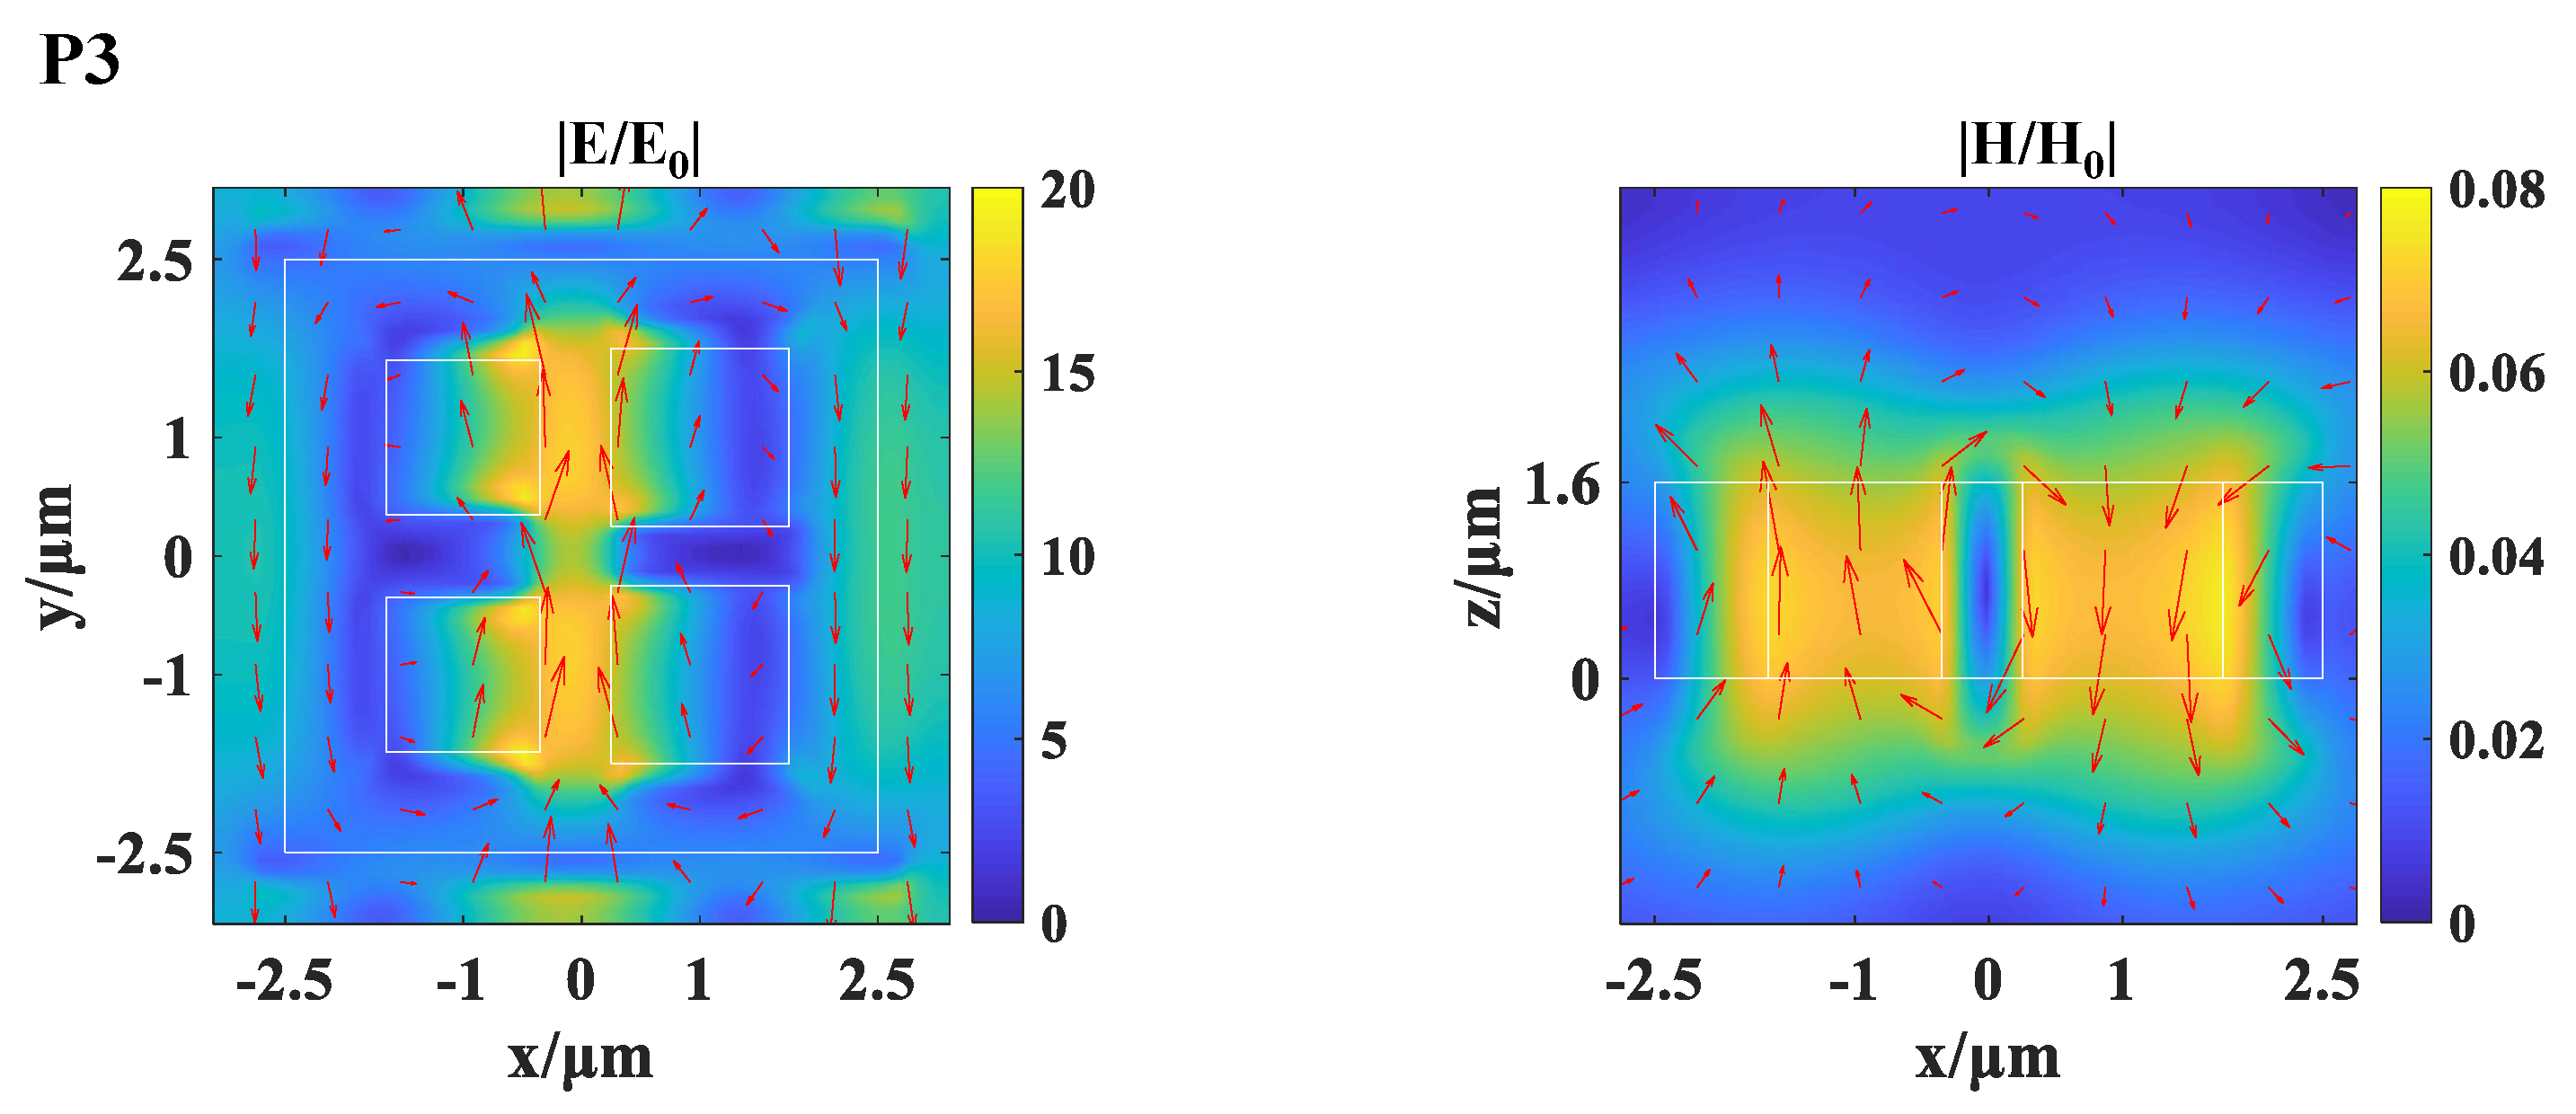
3. Results and Discussion

As shown in Figure 2 above, it is the simulated transmission spectrum of the RI sensor proposed when the nanoholes are symmetrical structure and asymmetric structure. The red dotted line is the spectral transmission curve when d0 = d1 = 1.3 µm. The transmission curve shows two asymmetric Fano dips. When we increase the size of d0 by to 1.5 µm. we change the symmetry of the structure, that is, when d0 ≠ d1, there are four asymmetric Fano dips, which are defined as P1, P2, P3 and P4. Compared with the transmission dips of symmetrical structure, the transmission dips of P1 and P2 have a slight blue shift, which is caused by the decrease of the effective RI of the structure when the size of the nanopore becomes larger [34]. At the same time, we were surprised to find that there were two asymmetric Fano resonance dips, P2 and P4 which is because the asymmetric structure introduces two quasi-BIC resonance modes. The traditional symmetry-protected BIC shows zero linewidth and infinite Q value [35,36,37]. By breaking the symmetry, the radiation channel between non radiation bound state and the free space continuum is established, so that the spectral curve shows wider and limited Q value.
Next, we study the electromagnetic field and vector distribution of different cross sections of the proposed structure to further analyze the mechanism of each Fano resonance. As shown in Figure 3, we will mainly observe the five cross sections of the whole structure: XY plane for z = h 0 /2, XZ1 plane for y = L/2, XZ2 plane for y = −L/2, YZ1 plane for x = −L/2 and YZ2 plane for x = L/2. The coordinate origin is at the center of the bottom surface of the unit cell.
Figure 4 shows the electromagnetic field and vector distribution at P1 resonance. The magnetic field forms two opposite vector rings in the XY plane, while the electric field forms a counterclockwise vector ring in the YZ1 plane, which represents the formation of a magnetic dipole along the positive direction of the X axis at P1 resonance.
By observing the electromagnetic field and vector distribution at the P2 resonance, we can define the resonance mode here as an electric quadrupole in the XY plane. As shown in Figure 5, the magnetic field in the XZ plane forms two opposite vector rings, which indicates that two electric dipoles are formed in the positive and negative Y−axis directions.
Figure 6 shows the electromagnetic field and vector distribution at P3 resonance. The electric field forms two opposite vector loops in the XY plane, and the magnetic field forms a vector ring in the xz plane, which represents the formation of a Toroidal dipole at P3 resonance.
The electromagnetic field distribution of the resonance P4 is presented in Figure 7, where the electric field forms one vector loop in the XY plane, and the magnetic field in the XZ plane is almost linearly polarized along the z axis, corresponding to a MD resonance mode.
Next, we study the dependence of the four resonant modes on the geometric dimensions of the structure by adjusting several parameters of the structure, such as the thickness H0 of the upper silicon structure, the side length t of the silicon structure, and the period p of the structure. This step is to better optimize the structure for better sensor performance.
From Figure 8a, we can see that with the increase of the side length of the silicon structure, the transmission dips of the four Fano resonances have a significant red shift, because the effective refractive index of the structure has changed. At the same time, we also found that the P3 resonant transmission dip changes obviously. This is because the coupling between the ring dipole and the incident electromagnetic wave is relatively weak, which is often covered by other stronger electromagnetic effects [38]. Therefore, we wish to form the stronger Toroidal dipole through reasonable structural design.
In Figure 8b, we can see that by adjusting the thickness t of the silicon structure, the four resonance modes have redshift significantly, because the effective refractive index of the designed structure changes with the change of the thickness.
Figure 8c shows the transmission spectra at different periods. It can be seen from the figure that the transmission spectra of the four Fano resonances are red shifted in varying degrees. At the same time, we also found that with the increase of the period, the linewidth of P2 and P4 transmission dips caused by quasi BIC decreased significantly, and the Q factor of Fano resonance increased, which is conducive to the improvement of the S of our designed RI sensor. Therefore, in the end, we choose the period p = 6.2 µm, the side length of silicon structure t = 5 µm, and the thickness of silicon structure h0 = 1.6 µm to obtain better sensor performance.
For our proposed long-wave infrared refractive index sensor, it is necessary to evaluate the performance of the sensor by several typical parameters, such as S, figure of merit (FOM) and quality factor (Q). In that the S is defined as the wavelength shift per RI unit, which is usually defined by the following formula [39]: S = Δ λ / Δ n. And the wavelength shift greatly with the change of per RI unit at longer wavelength which will improve the S of RI sensor. The Figure 9 shows the transmission spectrum of the proposed RI sensor whose surface is covered by liquids with different RI, in which the RI of the liquid varies from 1.33 to 1.37 with a change step of 0.01, and we assumed that the liquid fills the hole and covers the entire surface. Figure 10 shows relationship between the wavelength shift of four Fano resonces and the RI of the tested materials. In the figure, the black, red, blue and green lines represent the fitted curves of P1, P2, P3 and P4 respectively, and the black square, red circle, blue upright triangle and green inverted triangle represent the dip position of P1, P2, P3 and P4 respectively. In the figure, we can also clearly see that the sensitivity of the four Fano resonant transmission dips of the proposed RI sensor is 2403 nm/RIU, 2803 nm/RIU, 1483 nm/RIU and 1083 nm/RIU respectively. S of the proposed structure significantly improved.
Then, we also use FOM and Q factor to evaluate the performance of the designed RI sensor. The calculation formula of the two parameters are as follows [40]: FOM = S/FWHM and Q = λ /FWHM. RI has no effect on the value of FWHM, that is, the value of FWHM P1, P2, P3 and P4 remain 39 nm, 5 nm, 11 nm and 8 nm, so the value of FOM will not change. The FOM values of the four Fano resonces dips are: 56, 350, 134 and 135. At the same time, as the positions of the four transmission dips gradually redshift, the Q factor gradually increase.

4. Conclusions

In general, we have successfully designed a highly sensitive all dielectric RI sensor based on multi Fano resonance, which works in the long wave infrared band. Four Fano resonance dips, P1, P2, P3 and P4, were formed by etching four asymmetric nanoholes in the upper silicon layer. The formation of P2 and P4 Fano resonance dips are due to the breaking of structural symmetry, which makes BIC resonance into quasi BIC resonance. At the same time, we also analyze the electromagnetic field distribution at the four Fano dips. And the optimization of structural parameters enables us to design more sensitive sensors. Finally, the performance of the designed refractive index sensor is evaluated by S, FOM and Q values. The highest S of the designed RI sensor is 2803 nm/RIU, and the FOM value is almost unchanged. Its performance is higher than the current RI sensor based on metal materials.

Author Contributions

Conceptualization, K.W., Y.W., X.W. (Xiaokun Wang), X.W. (Xiaoyi Wang) and J.G.; Data curation, K.W., Y.W.; Formal analysis, X.W. (Xiaokun Wang), X.W. (Xiaoyi Wang) and J.G.; Investigation, K.W.; Writing-original draft preparation, K.W.; Writing-review and editing, J.G. and H.Y. All authors have read and agreed to the published version of the manuscript.

Funding

This research was funded by The National Natural Science Foundation of China (61875193).

Institutional Review Board Statement

Not applicable.

Informed Consent Statement

Not applicable.

Data Availability Statement

The authors confirm that the data supporting the findings of this study are available within the article.

Conflicts of Interest

The authors declare no conflict of interest.

References

  1. Liyanage, T.; Alharbi, B.; Quan, L.; Esquela-Kerscher, A.; Slaughter, G. Plasmonic-Based Biosensor for the Early Diagnosis of Prostate Cancer. ACS Omega 2022, 7, 2411–2418. [Google Scholar] [CrossRef]
  2. Hajshahvaladi, L.; Kaatuzian, H.; Danaie, M. A high-sensitivity refractive index biosensor based on Si nanorings coupled to plasmonic nanohole arrays for glucose detection in water solution. Opt. Commun. 2022, 502, 127421. [Google Scholar] [CrossRef]
  3. Zhang, Q.; Yan, H.H.; Ru, C.; Zhu, F.; Zou, H.Y.; Gao, P.F.; Huang, C.Z.; Wang, J. Plasmonic biosensor for the highly sensitive detection of microRNA-21 via the chemical etching of gold nanorods under a dark-field microscope. Biosens. Bioelectron. 2022, 201, 113942. [Google Scholar] [CrossRef] [PubMed]
  4. Hu, J.; Lang, T.T.; Shi, G.H. Simultaneous measurement of refractive index and temperature based on all-dielectric metasurface. Opt. Express 2017, 25, 15241. [Google Scholar] [CrossRef] [PubMed]
  5. Yesilkoy, F.; Terborg, R.A.; Pello, J.; Belushkin, A.A.; Jahani, Y.; Pruneri, V.; Altug, H. Phase-sensitive plasmonic biosensor using a portable and large field-of-view interferometric microarray imager. Light Sci. Appl. 2018, 7, 17152. [Google Scholar] [CrossRef]
  6. Danila, O.; Manaila-Maximean, D. Bifunctional Metamaterials Using Spatial Phase Gradient Architectures: Generalized Reflection and Refraction Considerations. Materials 2021, 14, 2201. [Google Scholar] [CrossRef] [PubMed]
  7. Dănilă, O.; Bărar, A.; Vlădescu, M.; Mănăilă-Maximean, D. An Extended k-Surface Framework for Electromagnetic Fields in Artificial Media. Materials 2021, 14, 7842. [Google Scholar] [CrossRef]
  8. Wang, K.; Xiong, Y.; Li, Q.; Wang, Y.C.; Zhang, J.; Liu, H.; Liu, Z.; Wang, T.T.; Shen, Z.F.; Wang, X.K.; et al. Near-infrared narrow-band minus filter based on a Mie magnetic dipole resonance. Opt. Express 2022, 30, 22830–22837. [Google Scholar] [CrossRef]
  9. Bontempi, N.; Chong, K.E.; Orton, H.W.; Staude, I.; Choi, D.Y.; Alessandri, I.; Kivshar, Y.S.; Neshev, D.N. Highly sensitive biosensors based on all-dielectric nanoresonators. Nanoscale 2017, 9, 4912–4980. [Google Scholar] [CrossRef]
  10. Yavas, O.; Svedendahl, M.; Dobosz, P.; Sanz, V.; Quidant, R. On-a-chip biosensing based on all-dielectric nanoresonators. Nano Lett. 2017, 17, 4421–4426. [Google Scholar] [CrossRef] [Green Version]
  11. He, J.N.; Fan, C.Z.; Wang, J.Q.; Ding, P.; Cai, G.W.; Cheng, Y.G.; Zhu, S.M.; Liang, E.J. A giant localized field enhancement and high sensitivity in an asymmetric ring by exhibiting Fano resonance. J. Opt.-UK 2013, 15, 025007. [Google Scholar] [CrossRef]
  12. Zhu, Z.; You, O.; Li, Q.; Fan, S. Fano resonance boosted cascaded optical field enhancement in a plasmonic nanoparticle-in-cavity nanoantenna array and its SERS application. Light Sci. Appl. 2015, 4, e296. [Google Scholar] [CrossRef]
  13. Zhang, Y.H.; Liang, Z.Z.; Meng, D.J.; Qin, Z.; Fan, Y.D.; Shi, X.Y.; Smith, D.R.; Hou, E.Z. All-dielectric refractive index sensor based on Fano resonance with high sensitivity in the mid-infrared region. Results Phys. 2021, 24, 104129. [Google Scholar] [CrossRef]
  14. Gao, Z.X.; Yao, B.C.; Qin, C.Y.; Yang, R.; Guo, Y.H.; Zhang, Y.F.; Wu, Y.; Bi, L.; Chen, Y.F.; Xie, Z.D.; et al. Biochemical sensing in graphene-enhanced microfiber resonators with individual molecule sensitivity and selectivity. Light Sci. Appl. 2019, 8, 107. [Google Scholar]
  15. Lu, H.; Liu, X.M.; Mao, D.; Wang, G.X. Plasmonic nanosensor based on Fano resonance in waveguide-coupled resonators. Opt. Lett. 2012, 37, 3780. [Google Scholar] [CrossRef]
  16. Miroshnichenko, A.E.; Flach, S.; Kivshar, Y.S. Fano resonances in nanoscale structures. Rev. Mod. Phys. 2010, 82, 2257–2298. [Google Scholar] [CrossRef] [Green Version]
  17. Nejad, F.Z.; Fleury, R. Topological Fano Resonances. Phys. Rev. Lett. 2019, 122, 014301. [Google Scholar] [CrossRef]
  18. Nazari, F.; Bender, N.; Ramezani, H.; Moravvej-Farshi, M.K.; Christodoulides, D.N.; Kottos, T. Optical isolation via pt-symmetric nonlinear Fano resonances. Opt. Express 2014, 22, 9574. [Google Scholar] [CrossRef] [Green Version]
  19. Zhou, H.J.; Su, S.J.; Qiu, W.B.; Zhao, Z.Y.; Lin, Z.L.; Qiu, P.P.; Kan, Q. Multiple Fano Resonances with Tunable Electromagnetic Properties in Graphene Plasmonic Metamolecules. Nanomaterials 2020, 10, 236. [Google Scholar] [CrossRef] [Green Version]
  20. Li, H.; Yu, S.L.; Yang, L.; Zhao, T.G. High Q-factor multi-Fano resonances in all-dielectric double square hollow metamaterials. Opt. Laser Technol. 2021, 140, 107072. [Google Scholar] [CrossRef]
  21. Zhang, Y.B.; Liu, W.W.; Li, Z.C.; Li, Z.; Cheng, H.; Chen, S.Q.; Tian, J.G. High-quality-factor multiple Fano resonances for refractive index sensing. Opt. Lett. 2018, 43, 1842–1845. [Google Scholar] [CrossRef] [PubMed]
  22. Chau, Y.F.C.; Chou Chao, C.T.; Jumat, S.Z.B.H.; Kooh, M.R.R.; Thotagamuge, R.; Lim, C.M.; Chiang, H.P. Improved Refractive Index-Sensing Performance of Multimode Fano-Resonance-Based Metal-Insulator-Metal Nanostructures. Nanomaterials 2021, 11, 2097. [Google Scholar] [CrossRef] [PubMed]
  23. Chou Chao, C.T.; Chau, Y.F.C.; Chiang, H.P. Multiple Fano resonance modes in an ultra-compact plasmonic waveguide-cavity system for sensing applications. Results Phys. 2021, 27, 104527. [Google Scholar] [CrossRef]
  24. Su, W.; Chen, X.Y.; Geng, Z.; Luo, Y.L. Multiple Fano resonances in all-dielectric elliptical disk-ring metasurface for high-quality refractive index sensing. Results Phys. 2020, 18, 103340. [Google Scholar] [CrossRef]
  25. Zhang, S.P.; Bao, K.; Halas, N.J.; Xu, H.X. Substrate-Induced Fano Resonances of a Plasmonic: Nanocube: A Route to Increased-Sensitivity Localized Surface Plasmon Resonance Sensors Revealed. Nano Lett. 2011, 11, 1657–1663. [Google Scholar] [CrossRef]
  26. Fan, K.B.; Shadrivov, l.V.; Padilla, W.J. Dynamic bound states in the continuum. Optica 2019, 6, 169. [Google Scholar] [CrossRef]
  27. Garmon, S.; Noba, K.; Ordonez, G.E.; Segal, D. Non-Markovian dynamics revealed at a bound state in the continuum. Phys. Rev. A 2019, 99, 010102. [Google Scholar] [CrossRef] [Green Version]
  28. Ndangali, F.R.; Shabanov, S.V. Electromagnetic bound states in the radiation continuum for periodic double arrays of subwavelength dielectric cylinders. J. Math. Phys. 2010, 51, 102901. [Google Scholar] [CrossRef] [Green Version]
  29. Hsu, C.W.; Zhen, B.; Stone, A.D.; Joannopoulos, J.D.; Soljačić, M. Bound states in the continuum. Nat. Rev. Mater. 2016, 1, 16048. [Google Scholar] [CrossRef] [Green Version]
  30. Sadrieva, Z.F.; Sinev, I.S.; Koshelev, K.L.; Samusev, A.; Iorsh, I.V.; Takayama, O.; Malureanu, R.; Bogdanov, A.A.; Lavrinenko, A.V. Transition from Optical Bound States in the Continuum to Leaky Resonances: Role of Substrate and Roughness. ACS Photonics 2017, 4, 723–727. [Google Scholar] [CrossRef]
  31. Li, B.; Yao, J.; Zhu, H.; Cai, G.; Liu, H.Q. Asymmetric excitations of toroidal dipole resonance and the magnetic dipole quasi-bound state in the continuum in an all-dielectric metasurface. Opt. Mater. Express 2021, 11, 2359. [Google Scholar] [CrossRef]
  32. Jerrard, H.G. Handbook of optical constant of solids. Opt. Laser Technol. 1986, 18, 142–149. [Google Scholar] [CrossRef]
  33. Zou, S.; Liu, J.S.; Wang, K.J. Microwave transmission properties of metamaterials with double sets of square holes. Sci. Bull. 2012, 57, 3769–3772. [Google Scholar] [CrossRef] [Green Version]
  34. Xu, L.; Kamali, K.Z.; Huang, L.; Rahmani, M.; Smirnov, A.; Camacho-Morales, R.; Ma, Y.; Zhang, G.; Woolley, M.; Neshev, D.; et al. Dynamic Nonlinear Image Tuning through Magnetic Dipole Quasi-BIC Ultrathin Resonators. Adv. Sci. 2019, 6, 1802119. [Google Scholar] [CrossRef] [Green Version]
  35. Koshelev, K.; Lepeshov, S.; Liu, M.; Bogdanov, A.; Kivshar, Y. Asymmetric Metasurfaces with High- Q Resonances Governed by Bound States in the Continuum. Phys. Rev. Lett. 2018, 121, 193903. [Google Scholar] [CrossRef] [Green Version]
  36. Sadrieva, Z.; Frizyuk, K.; Petrov, M.; Kivshar, Y.; Bogdanov, A. Multipolar origin of bound states in the continuum. Phys. Rev. B 2019, 100, 115303. [Google Scholar] [CrossRef] [Green Version]
  37. Koshelev, K.; Bogdanov, A.; Kivshar, Y. Meta-optics and bound states in the continuum. Sci. Bull. 2019, 64, 836–842. [Google Scholar] [CrossRef] [Green Version]
  38. Wang, Y.L.; Han, Z.H.; Du, Y.; Qin, J.Y. Ultrasensitive terahertz sensing with high-Q toroidal dipole resonance governed by bound states in the continuum in all-dielectric metasurface. Nanophotonics 2021, 10, 1295–1307. [Google Scholar] [CrossRef]
  39. Cao, Y.; Liu, H.; Tong, Z.; Yuan, S.; Zhao, S. Simultaneous measurement of temperature and refractive index based on a core-offset Mach-Zehnder interferometer cascaded with a long-period fiber grating. Optoelectron. Lett. 2015, 11, 69–72. [Google Scholar] [CrossRef]
  40. Xu, Y.; Bai, P.; Zhou, X.; Akimov, Y.; Png, C.E.; Ang, L.K.; Knoll, W.; Wu, L. Optical Refractive Index Sensors with Plasmonic and Photonic Structures: Promising and Inconvenient Truth. Adv. Opt. Mater. 2019, 7, 1801433. [Google Scholar] [CrossRef]
Figure 1. (a) Schematic of the proposed RI sensor. (b) Unit cell with the geometric parameters. Period p is 6.2 µm, the thickness h0 of the top layers of structure is 1.6 µm, the side length t is 5 µm, d0 and d1 is the side length of the nano square hole, and the distance L between the centers of the two square holes is 2 µm.
Coatings 12 00970 g001
Figure 2. Transmittance spectra of the proposed RI sensor with different d0. The red dashed curve for d0 = d1 = 1.3 µm, the blue solid curve for d0 = 1.5 µm, d1 = 1.3 µm.
Coatings 12 00970 g002
Figure 3. Different cross sections of unit cell.
Coatings 12 00970 g003
Figure 4. Magnetic field distributions in the x−y plane and electric field distributions in the y−z plane at P1 resonance in a unit cell. The red arrows demonstrate the instantaneous flow direction of the magnetic field and Electric field. The color bars stand for the normalized electric field and magnetic field intensity.
Coatings 12 00970 g004
Figure 5. Electric field distributions in the x−y plane and magnetic field distributions in the x−z plane at P2 resonance in a unit cell. The red arrows demonstrate the instantaneous flow direction of the magnetic field and Electric field. The color bars stand for the normalized electric field and magnetic field intensity.
Coatings 12 00970 g005
Figure 6. Electric field distributions in the x−y plane and magnetic field distributions in the x−z plane at P3 resonance in a unit cell. The red arrows demonstrate the instantaneous flow direction of the magnetic field and Electric field. The color bars stand for the normalized electric field and magnetic field intensity.
Coatings 12 00970 g006
Figure 7. Electric field distributions in the x−y plane and magnetic field distributions in the x−z plane at P4 resonance in a unit cell. The red arrows demonstrate the instantaneous flow direction of the magnetic field and Electric field. The color bars stand for the normalized electric field and magnetic field intensity.
Coatings 12 00970 g007
Figure 8. (a) The simulated transmission spectrum of the proposed RI sensor when t is set to 4.8 µm, 5.0 µm, 5.2 µm. (b) The simulated transmission spectrum of the proposed RI sensor when h0 is set to 1.4 µm, 1.6 µm, 1.8 µm. (c) The simulated transmission spectrum of the proposed RI sensor when p is set to 6 µm, 6.2 µm, 6.4 µm.
Coatings 12 00970 g008
Figure 9. The transmission spectra of the proposed structure when RI of the tested materials changes from 1.33 to 1.37 with a change step of 0.01.
Coatings 12 00970 g009
Figure 10. Fitted curve between the wavelength shift of four Fano resonance dips and the external RI.
Coatings 12 00970 g010
Publisher’s Note: MDPI stays neutral with regard to jurisdictional claims in published maps and institutional affiliations.

