Abstract
In recent years, colloidal quantum dots (CQD) have been intensively studied in various fields due to their excellent optical properties, such as size-tunable absorption features and wide spectral tunability. Therefore, CQDs are promising infrared materials to become alternatives for epitaxial semiconductors, such as HgCdTe, InSb, and type II superlattices. Here, we report a simulation study of a microspectrometer fabricated by integrating an intraband HgSe CQD detector with a distributed Bragg reflector (DBR). Intraband HgSe CQDs possess unique narrowband absorption and optical response, which makes them an ideal material platform to achieve high-resolution detection for infrared signatures, such as molecular vibration. A microspectrometer with a center wavelength of 4 µm is studied. The simulation results show that the optical absorption rate of the HgSe CQD detector can be increased by 300%, and the full-width-at-half-maximum (FWHM) is narrowed to 30%, realizing precise regulation of the absorption wavelength. The influence of the incident angle of light waves on the microspectrometer is also simulated, and the results show that the absorption rate of the HgSe quantum dot detector is increased 2–3 times within the incident angle of 0–23 degrees, reaching a spectral absorption rate of more than 80%. Therefore, we believe that HgSe CQDs are a promising material for realizing practical HgSe microspectrometers.
1. Introduction
Spectral detection is the core technology used in the fields of physicochemical property analysis, chemical composition analysis, and environmental monitoring [1,2,3,4]. It also shows great potential in emerging artificial intelligence networks, autonomous driving, and machine vision [5,6,7]. A spectrometer is generally composed of dispersive optics, a detector system, and an optical path adjustment system. An important development direction of the spectrometer is the miniaturization of spectrometers. Micro-spectrometers with a small size, low energy consumption, and low cost have become promising alternatives in many spectral detection fields. Currently, micro-spectrometers are mainly made by micro-nano optical processing or micro-electro-mechanical system (MEMS) technology, including photonic crystal arrays [8,9,10], arrayed waveguide gratings [11], planar etched gratings [12], micro-Michelson interferometers [13], and narrowband optical filters [14,15]. The use of non-silicon-based photodetectors is another way to fabricate spectrometers, including graphene detectors [16], organic photodetectors [17], and colloidal quantum dot detectors (CQDs) [18]. Compared with MEMS and etched gratings, spectrometers fabricated with detectors capable of detecting specific wavelengths have the advantages of compact structure and system stability.
Infrared detectors play a key role in spectrometers. Colloidal quantum dots (CQD) have been intensively studied in various fields due to their excellent optical properties, such as size-tunable absorption features and wide spectral tunability. Therefore, CQDs are promising infrared materials to become alternatives for epitaxial semiconductors, such as HgCdTe, InSb, and type II superlattices. At present, the tunable bands of the developed CQDs have covered the short-wave infrared (SWIR) [19], mid-wave infrared (MWIR) [20], long-wave infrared (LWIR), and terahertz bands [21,22]. Photodetectors based on quantum dots for photoconductivity [23], photovoltaics [20,24], and phototransistors have been investigated [25]. Benefiting from the ease of processing and spectral tunability of CQDs, filter-free narrowband photodetectors [26], double-endedSWIR/MWIR dual-band detectors [27], and SWIR hyperspectral sensors have been investigated [28].
Among narrow-band optoelectronic materials, mercury selenide (HgSe) CQDs have thus far demonstrated the only Lorentzian lineshape of optical absorption in mid-wave infrared (MWIR), which is suitable for spectrally selective detection [29,30]. Despite the exciting properties of HgSe CQDs, most infrared CQD detectors still suffer from a common problem, a low absorption rate limited by the CQD film thickness [24]. CQD detectors are usually made by layer-by-layer drop-casting, and for an infrared CQD detector, the typical thickness is ~400 nm, and only 20% of incident light can be absorbed [31]. Another problem that needs to be improved is that HgSe CQDs still have a relatively broad FWHM. In this work, high-performance HgSe CQD microspectrometers are designed by integrating a HgSe CQD sensor and a resonant cavity (RC) composed of distributed Bragg reflectors (DBR). Finite element analysis of HgSe CQD microspectrometer detectors was systematically conducted.
The simulation results show that the spectrometer has strong wavelength selectivity, high absorption rate up to 91%, and extremely narrow full width at half maximum down to 0.2 µm in MWIR. The wavelength selection of the absorption peak can be achieved by adjusting the thickness of the optical cavity. Therefore, the integration of the narrowband CQD material HgSe with the resonator can achieve precise spectrally selective detection. It can be concluded that the spectrometer has the advantages of adjustable wavelength, narrow half-peak, high spectral resolution, high spectral responsivity, small size, and low cost.
2. Modeling and Simulation
COMSOL Multiphysics is used to conduct the simulation in our study. The proposed design of a CQD microspectrometer with a resonant cavity is illustrated in Figure 1a. A sapphire (Al2O3) with high transmittance in the infrared band is used as the substrate, and Ti3O5 and SiO2 are periodically deposited on it as the DBR. The optical spacer layer and CQD detector were fabricated on the DBR and capped with insulating layers and gold film. The DBR is composed of alternating layers of two materials, each of which has a different refractive index. The interference effect between reflected waves makes the reflection window of the DBR depend on wavelength. To save computation resources, a two-dimensional (2D) simulation is used, as shown in Figure 1b. There is only one physical field in the model, a simple parallel light field entering the device from the entrance port. The light is introduced from the “incident port” with a controlled power of 1 W. The wavelength of incident light is swept from 2.5 to 10.0 µm to calculate spectral absorption.
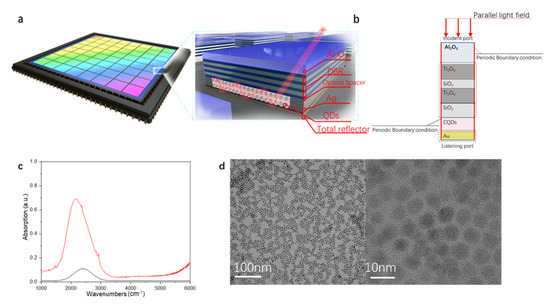
Figure 1.
Architecture of the HgSe CQD microspectrometer. (a) Schematic of the CQD microspectrometer, consisting of a CQD sensor and filters. The optical spacer layer is under the DBR, and the quantum dot layer is sandwiched between the optical spacer layer and the optical reflection layer. (b) Simulation model of a CQD microspectrometer with a resonant cavity. (c) Spectral absorption plots of HgSe CQDs (red line), simulated spectral absorption plots (black lines). (d) TEM of HgSe CQDs.
The listening port is placed at the bottom of the model. Considering that the size of the model is much smaller than the size of the actual device, we set the left and right sides as “continuous periodic boundary conditions” to avoid the influence caused by the limited width of the model. Below the incident port is the substrate, and the material of the substrate is chosen to be Al2O3 with a refractive index of 1.6 + 0i because of its low absorption for infrared light.
The DBR is composed of alternating layers of high and low refractive index dielectric films. The material of the high refractive index layer of the DBR is selected as Ti3O5 with a refractive index of 2.35 + 0i, and the material of the low refractive index layer is selected as SiO2 with a refractive index of 1.4 + 0i. The optical spacer layer is used to regulate the thickness of the resonator cavity, and the material is also SiO2. HgSe CQD were used as the photosensitive layer of the micro-spectrometer, and the refractive index was obtained by fitting the actual absorption spectrum of HgSe CQD, which had an absorption peak with a central wavelength of 4.19 µm in the range of 1.67–10 µm, as shown in Figure 1c,d. The mean size of the CQDs is 4.7 nm, and the size distribution is uniform, with a standard deviation of 0.5 nm. The bottom of the model is the gold film, as the total reflection layer of light waves, which, together with the DBR and the optical spacer layer, constitutes an optical resonant cavity. The rest of the model is set to air with a refractive index of 1 + 0i. In the simulation, the width of the 2D model is 0.4 µm, the thickness of the Al2O3 substrate is 1.1 µm, the thickness of the HgSe CQD film is set to 0.4 µm which is the thickest thickness of the active layer in most CQD detectors [31], and the thickness of the DBR dielectric film layer is determined by [32]:
where nH and nL are the
refractive indices of the DBR high and low refractive index dielectric layers, dH
and dL are the thicknesses of the two dielectric layers, and λ0 is the center
wavelength of the DBR reflection window. In the design, we use unpolarized
plane waves with uniform intensity distribution. To reduce manufacturing
complexity, the spectrometer uses a vertically stacked architecture. The
absorption, wavelength of the absorption peak, and FWHM can be regulated by
adjusting the thickness of the optical spacer layer.
3. Results and Discussion
When light passes through the structure, reflected waves are generated between multiple interfaces. The bandwidth of the reflection window of the DBR is given by [33,34]:
where λ0 is
the center wavelength of the bandwidth. Another important factor determined by
the DBR is the reflectivity of the resonator top mirror. The reflectivity R of
the distributed DBR is given by:
where nH and nL are the refractive
indices of the high refractive index layer and the low refractive index layer, na and nb are the refractive
index of substrates on both sides of the DBR, and N is the number of layers of
the DBR. For the resonant cavity, continuous resonance wavelength modulation is
achieved by changing the optical length of the layer of the DBR and cavity, which
can be done by tuning the thickness of the optical spacer layer and the layer
of the DBR. In our design, the thickness of the DBR dielectric layer needs to
match the absorption wavelength of the quantum dot narrowband material, so the
absorption rate and FWHM of the photodetector source layer can be regulated by
simply changing the number of DBR layers and the thickness of the optical
isolation layer.
By introducing spectrally flat light as an illumination source, the optical field distributions in the resonant cavity are simulated, as shown in Figure 2. The core of the optical field is located on the boundary between the active layer and the optical spacer layer, which may be due to the absorption of photons by the active layer. Since the active layer placed in the resonant cavity is a narrowband CQD material, unwanted resonances and broadening FWHM of peaks are avoided, allowing tunable narrowband photodetection. The simulated absorption of the microspectrometer further demonstrates the accurate spectral tunability of our device.
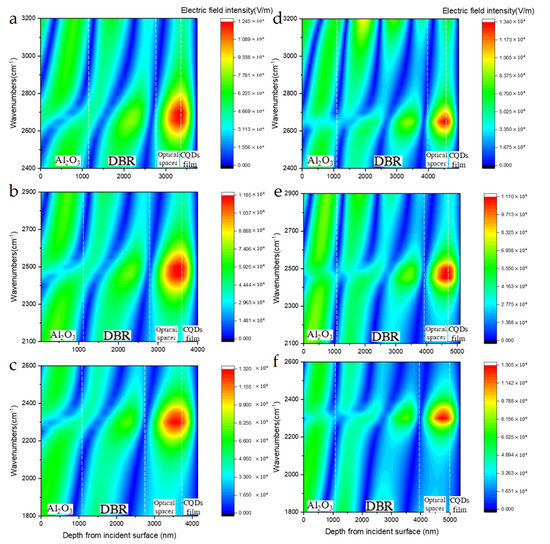
Figure 2.
Optical field distributions of the resonant cavity. Optical field distributions for optical spacer layer thicknesses of (a) 0.6, (b) 0.8, and (c) 1.0 µm of one layer of DBR are shown. (d–f). The optical field distributions for two layers of DBR with the same optical spacer layer thickness as one layer. Different layer positions are marked by white dashed lines.
The quantum efficiency depicting the absorption of
a photodetector to optical signals is also analyzed. At zero bias, assuming that
the optical active layer is defect free, η can be calculated
using:
where is
the absorption coefficient, d is the thickness of the active layer, and R is surface
reflection of the photodetectors. In our design, the total quantum efficiency ηtot of photodetector
with RC is [35,36]:
where R1 is
the corresponding power reflectivity of the top mirror composed of DBR of RC, R2 is the
corresponding power reflectivity of the bottom reflective mirror composed of
gold reflective film of RC, L, and n are the thickness and refractive
index of the optical spacer layer, are
the phase shift caused by the top and the bottom mirror of the resonant cavity
to the reflected light, and λ is
the wavelength of incident light. The improvement in the reflectivity of the
top mirror increases the resonant effect of the resonator and hinders light from
entering the resonator, so the quantum efficiency of the photodetector is
greatly reduced when the number of DBR layers increases, which is proved in our
simulation. In truth, in our simulations, when the number of layers of the DBR
reaches three, the absorption rate of the CQD detector drops sharply. The full
quantum efficiency is more dependent on the αd of the
optoelectronic material. Limited by the layer-by-layer drop-casting method of
the CQD detector, a further increase of film thickness would lead to cracks and
delamination due to mechanical stress from the drying and ligand exchange
process [31]. Additionally, the variation in
the thickness of the optical isolation layer affects the periodic shift of the
central wavelength of the spectral absorption peak.
The HgSe active layer in the device is replaced by a virtual broadband material whose imaginary part of the refractive index is constant, independent of the wavelength of light, unlike HgSe CQDs. It can be considered a broad-spectrum optoelectronic material with the same absorption for different wavelengths of light, and the results are shown in Figure 3. For broad-spectrum optoelectronic materials, the harmonic density and order of the spectral absorption peaks gradually increase, and the side mode suppression ratio also decreases gradually when the wavelength decreases and the thickness of the optical spacer layer increases. In our design, the absorption suppression of the harmonic sub-peaks of the resonant cavity comes from the unique intraband transition characteristics of HgSe CQDs as the active layer material. A unique intraband transition property of HgSe CQDs is that electronic transitions occur between the first two conduction band states, 1S e and 1P e of HgSe CQDs. When the incident photon energy Ephoton in the infrared matches the intraband energy gap Eintra, the light absorption reaches a maximum value, and if the energy of the incident photon is higher or lower than Eintra, the light absorption drops sharply, which creates the Lorentzian lineshape of the absorption properties of HgSe CQDs.
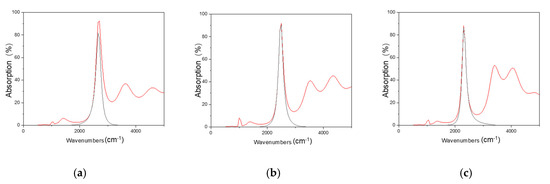
Figure 3.
Spectral absorption of photodetectors with resonant cavities constructed from narrowband (HgSe, black line) and broadband (red line) optoelectronic materials at optical spacer layer thicknesses of 0.6 (a), 0.8 (b), and 1.0 (c) µm.
According to existing experimental conclusions, the influence of the size and size of the CQDs on the energy band can be further learned. The absorption peaks of HgSe redshift with increasing size, which is controlled by the reaction conditions for synthesizing CQDs [37,38]. By controlling the reaction time and temperature, the energy gap of the CQDs becomes smaller, and as a result, the Fermi level is in the Se state, defined as the two electrons in the conduction band of each CQD being in the Se state and the Pe state being empty. Compared to other electron doping densities, the dark current of HgSe film is reduced [39,40]. On the other hand, the uneven distribution of quantum dot size will also have an impact on carrier mobility. The carrier mobility of the HgSe film can be measured and calculated by the FET circuit, and the mechanism is explained by Marcus theory [40]:
where Con is the constant, ∆G is the energy difference caused by uneven size of CQDs, T is the temperature in Kelvin, is the Boltzmann constant. γ is the recombinant energy of the polarization effect of the medium around the carrier [41]. γ is obtained by:
where e is the elementary charge, ε0 is the vacuum permittivity, D is the radius of the CQDs, is the spacing between CQDs, is the optical dielectric constant of the matrix surrounding CQDs, is the static dielectric constant. The intraband transition property makes HgSe CQDs an excellent optoelectronic material for detecting specific wavelengths of infrared. By tuning the size of the HgSe CQDs, the Eintra and the corresponding peak absorption wavelength can be controlled. This design can modify the reflection window of the DBR to match the specific wavelength detectable by HgSe by adjusting the optical length of the DBR dielectric thin-film layer. The resonance enhancement effect of the resonant cavity is used to improve the absorption rate and fine-tune the absorption wavelength of the HgSe CQD detector. Previous studies have already demonstrated that photo-excited carriers through intraband transition can be collected to generate photocurrents. The application of the intraband transition for photoconductors was first demonstrated in the 3–5 µm range of infrared [42].
To verify the optical functionality of the DBR design, the spectral absorption of the CQD detector in the single-band microspectrometer was simulated using a one-layer and two-layer DBR, as shown in Figure 4. The number of layers of DBR is determined by the number of high and low refractive index film layer pairs. When the resonant wavelength of the resonant cavity accurately matches the absorption peak of the CQD active layer, the absorption rate of the CQD detector increases 2.8 times. The FWHM is reduced to 18% and 31%, respectively, in the application of one layer and two layers of DBR. There is an approximate linear relationship between the central wavelength of the absorption peak and the thickness of the optical spacer layer, indicating that the central wavelength of the absorption peak can be precisely tuned by changing the thickness of the optical spacer layer (Figure 4d). Compared with one-layer DBR, the FWHM of the absorption peak of the CQD detector with two layers of DBR is narrower, but the peak absorption oscillates when the optical isolation layer is thickened, which may indicate that increasing the number of layers of DBR will produce more interference when the optical length of the resonant cavity increases.
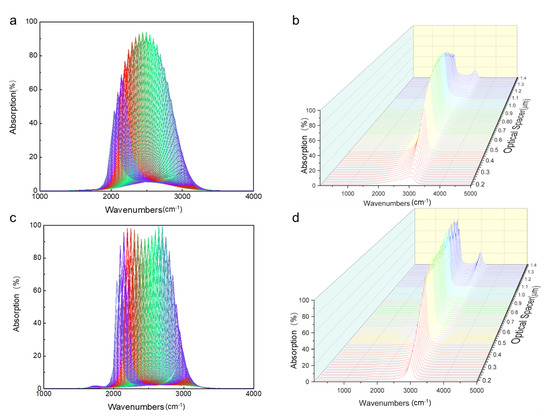
Figure 4.
Absorption of the CQD microspectrometer. (a,b) Absorption of a CQD microspectrometer with different optical spacer thicknesses with one layer of DBR. (c,d) Absorption of a CQD microspectrometer with different optical spacer thicknesses and two layers of DBR.
Overall, the performance of the CQD detector was significantly increased after adopting the resonator with one layer of DBR. The absorption of the CQD detector was increased 2–3 times, and the FWHM was narrowed to 30% of the original. The central wavelength of the absorption peak can be tuned in the range of 0.7 µm, which is consistent with previously reported studies [26].
In addition to modeling the cavity length of the resonator, the influence of the angle of incidence was also studied. For a cavity with an optical spacer layer of 0.82 µm (absorption > 90%, Figure 5a), we simulated spectral absorption of the CQD detector with incident light from 0 degrees to 90 degrees, and the modeling of the incident angle of the light wave is shown in Figure 6a. The simulation results are shown in Figure 6b,c. The results show that within the incident angle of 0–25 degrees, the absorption of the CQD detector is still increased 2–3 times, and the FWHM is narrowed by 30%, but the center wavelength is shifted by 0.3 µm at most (Figure 6d–f). After the incident angle exceeds 25 degrees, the absorption rate of the CQD detector drops sharply, and the center wavelength of the peak of absorption produces a large periodic change.
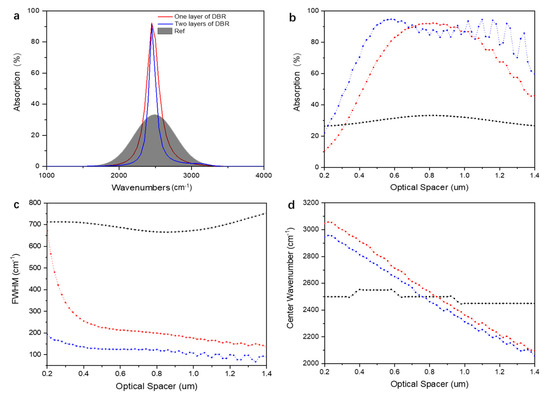
Figure 5.
Effect of resonant cavity composed of DBR on CQD detector. (a) Absorption of the CQD detector with one layer of DBR, two layers of DBR, and no DBR (Ref) for the thickness of the optical spacer layer is 0.82 µm. Absorption (b), FWHW (c), and center wavenumber (d) of absorption peak of the CQD detector at different thicknesses of the optical spacer layer with one layer (red line), two layers (blue line) of DBR, and no DBR (black line).
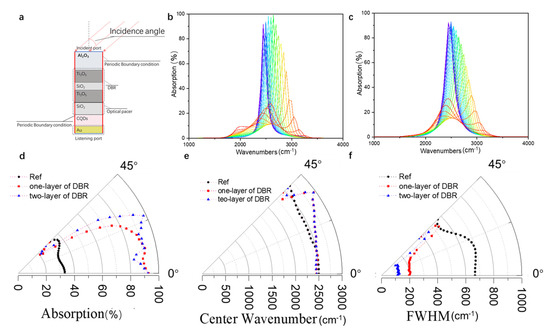
Figure 6.
Influence of incidence angle on mincrospectrometer performance. (a) Simulation model of a CQD microspectrometer with an incident angle. Absorption of a CQD microspectrometer with different incident angles in one layer of DBR (b) and two layers of DBR (c). Absorption (d), center wavenumber (e), and FWHW (f) of absorption peak of the CQD detector in the range of incident angle of 0–45 degrees with one layer (red line), two layers (blue line) of DBR, and no DBR (black line).
4. Conclusions
In conclusion, our design and simulation confirm that the wavelength-specific detection of HgSe for infrared forms a good match with the reflection window formed by DBR and the resonance wavelength of the resonant cavity, which can further obtain a lower FWHM and a higher absorption rate. The detector assumes the function of a single-band spectrometer in the range of MWIR according to the simulation results, and it is possible to fabricate a snapshot HgSe CQD microspectrometer by integrating multiple photodetectors capable of detecting various infrared regions by simply adjusting the cavity length of the resonant cavity. We believe that the simulation results have important implications for microspectrometers. In addition, the effect of enhancing the light absorption of the active layer with this device structure should be applicable to thinner film-like detectors.
Author Contributions
Conceptualization, X.T., C.W. and G.M.; methodology, M.C.; software, C.W.; validation, X.T., C.W., G.M. and X.Z.; formal analysis, X.Z. and M.C.; investigation, X.T., C.W. and G.M.; resources, X.T., C.W. and G.M.; data curation, X.T., C.W., X.Z. and G.M.; writing—original draft preparation, C.W. and G.M.; writing—review and editing, X.T. and M.C.; visualization, X.T., C.W. and G.M.; supervision, X.T.; project administration, X.T.; funding acquisition, X.T. All authors have read and agreed to the published version of the manuscript.
Funding
This research was funded by the National Key R&D Program of China: 2021YFA0717600; National Natural Science Foundation of China: NSFC No. 62035004; National Natural Science Foundation of China: NSFC No. 62105022.
Institutional Review Board Statement
Not applicable.
Informed Consent Statement
Not applicable.
Data Availability Statement
Not applicable.
Conflicts of Interest
The authors declare no conflict of interest.
References
- Kindt, J.T.; Luchansky, M.S.; Qavi, A.J.; Lee, S.-H.; Bailey, R.C. Subpicogram Per Milliliter Detection of Interleukins Using Silicon Photonic Microring Resonators and an Enzymatic Signal Enhancement Strategy. Anal. Chem. 2013, 85, 10653–10657. [Google Scholar] [CrossRef] [PubMed]
- Ryckeboer, E.; Bockstaele, R.; Vanslembrouck, M.; Baets, R. Glucose sensing by waveguide-based absorption spectroscopy on a silicon chip. Biomed. Opt. Express 2014, 5, 1636–1648. [Google Scholar] [CrossRef] [PubMed] [Green Version]
- Garcia-Perez, A.; Romero-Troncoso, R.; Cabal-Yepez, E.; Osornio-Rios, A.R. The Application of High-Resolution Spectral Analysis for Identifying Multiple Combined Faults in Induction Motors. IEEE Trans. Ind. Electron. 2011, 58, 2002–2010. [Google Scholar] [CrossRef]
- Green, O.R.; Eastwood, M.L.; Sarture, C.M.; Chrien, T.G.; Aronsson, M.; Chippendale, B.J.; Faust, A.J.; Pavri, E.B.; Chovit, C.J.; Solis, M.; et al. Imaging Spectroscopy and the Airborne Visible/Infrared Imaging Spectrometer (AVIRIS). Remote Sens. Environ. 1998, 65, 227–248. [Google Scholar] [CrossRef]
- Millán, M.S.; Escofet, J. Fabric inspection by near-infrared machine vision. Opt. Lett. 2004, 29, 1440–1442. [Google Scholar] [CrossRef]
- Janssens, O.; Van De Walle, R.; Loccufier, M.; Van Hoecke, S. Deep Learning for Infrared Thermal Image Based Machine Health Monitoring. IEEE ASME Trans. Mechatron. 2017, 23, 151–159. [Google Scholar] [CrossRef] [Green Version]
- Wang, H.; Wang, B.; Liu, B.; Meng, X.; Yang, G. Pedestrian recognition and tracking using 3D LiDAR for autonomous vehicle. Robot. Auton. Syst. 2017, 88, 71–78. [Google Scholar] [CrossRef]
- Ding, H.; Liu, C.; Gu, H.; Zhao, Y.; Wang, B.; Gu, Z. Responsive Colloidal Crystal for Spectrometer Grating. ACS Photon. 2014, 1, 121–126. [Google Scholar] [CrossRef]
- Kim, S.-H.; Park, H.S.; Choi, J.H.; Shim, J.W.; Yang, S.-M. Integration of Colloidal Photonic Crystals toward Miniaturized Spectrometers. Adv. Mater. 2009, 22, 946–950. [Google Scholar] [CrossRef]
- Redding, B.; Liew, S.F.; Sarma, R.; Cao, H. Compact spectrometer based on a disordered photonic chip. Nat. Photon. 2013, 7, 746–751. [Google Scholar] [CrossRef] [Green Version]
- Muneeb, M.; Vasiliev, A.; Ruocco, A.; Malik, A.; Chen, H.; Nedeljkovic, M.; Penades, J.S.; Cerutti, L.; Rodriguez, J.-B.; Mashanovich, G.Z.; et al. III-V-on-silicon integrated micro—spectrometer for the 3 μm wavelength range. Opt. Express 2016, 24, 9465–9472. [Google Scholar] [CrossRef] [Green Version]
- Kyotoku, B.B.C.; Chen, L.; Lipson, M. Sub-nm resolution cavity enhanced microspectrometer. Opt. Express 2009, 18, 102–107. [Google Scholar] [CrossRef] [PubMed]
- Salem, A.M.; Sabry, Y.M.; Fathy, A.; Khalil, D.A. Single MEMS Chip Enabling Dual Spectral-Range Infrared Micro-Spectrometer with Optimal Detectors. Adv. Mater. Technol. 2021, 6, 2001013. [Google Scholar] [CrossRef]
- Bao, J.; Bawendi, M.G. A colloidal quantum dot spectrometer. Nature 2015, 523, 67–70. [Google Scholar] [CrossRef]
- Zhu, X.; Bian, L.; Fu, H.; Wang, L.; Zou, B.; Dai, Q.; Zhong, H. Broadband perovskite quantum dot spectrometer beyond human visual resolution. Light Sci. Appl. 2020, 9, 73. [Google Scholar] [CrossRef]
- Liu, Y.; Gong, T.; Zheng, Y.; Wang, X.; Xu, J.; Ai, Q.; Guo, J.; Huang, W.; Zhou, S.; Liu, Z.; et al. Ultra-sensitive and plasmon-tunable graphene photodetectors for micro-spectrometry. Nanoscale 2018, 10, 20013–20019. [Google Scholar] [CrossRef] [PubMed]
- Xing, S.; Nikolis, V.C.; Kublitski, J.; Guo, E.; Jia, X.; Wang, Y.; Spoltore, D.; Vandewal, K.; Kleemann, H.; Benduhn, J.; et al. Miniaturized VIS-NIR Spectrometers Based on Narrowband and Tunable Transmission Cavity Organic Photodetectors with Ultrahigh Specific Detectivity above 10 Jones. Adv. Mater. 2021, 33, 2102967. [Google Scholar] [CrossRef]
- Zobenica, Ž.; Van Der Heijden, R.W.; Petruzzella, M.; Pagliano, F.; Leijssen, R.; Xia, T.; Midolo, L.; Cotrufo, M.; Cho, Y.; Van Otten, F.W.M.; et al. Integrated nano-opto-electro-mechanical sensor for spectrometry and nanometrology. Nat. Commun. 2017, 8, 2216. [Google Scholar] [CrossRef]
- Böberl, M.; Kovalenko, M.; Gamerith, S.; List, E.J.W.; Heiss, W. Inkjet-Printed Nanocrystal Photodetectors Operating up to 3 μm Wavelengths. Adv. Mater. 2007, 19, 3574–3578. [Google Scholar] [CrossRef]
- Ackerman, M.M.; Tang, X.; Guyot-Sionnest, P. Fast and Sensitive Colloidal Quantum Dot Mid-Wave Infrared Photodetectors. ACS Nano 2018, 12, 7264–7271. [Google Scholar] [CrossRef]
- Keuleyan, S.E.; Guyot-Sionnest, P.; Delerue, C.; Allan, G. Mercury Telluride Colloidal Quantum Dots: Electronic Structure, Size-Dependent Spectra, and Photocurrent Detection up to 12 μm. ACS Nano 2014, 8, 8676–8682. [Google Scholar] [CrossRef] [PubMed]
- Goubet, N.; Jagtap, A.; Livache, C.; Martinez, B.; Portalès, H.; Xu, X.Z.; Lobo, R.P.S.M.; Dubertret, B.; Lhuillier, E. Terahertz HgTe Nanocrystals: Beyond Confinement. J. Am. Chem. Soc. 2018, 140, 5033–5036. [Google Scholar] [CrossRef] [PubMed] [Green Version]
- Keuleyan, S.; Lhuillier, E.; Guyot-Sionnest, P. Synthesis of Colloidal HgTe Quantum Dots for Narrow Mid-IR Emission and Detection. J. Am. Chem. Soc. 2011, 133, 16422–16424. [Google Scholar] [CrossRef] [PubMed]
- Tang, X.; Ackerman, M.M.; Guyot-Sionnest, P. Thermal Imaging with Plasmon Resonance Enhanced HgTe Colloidal Quantum Dot Photovoltaic Devices. ACS Nano 2018, 12, 7362–7370. [Google Scholar] [CrossRef] [PubMed]
- Huo, N.; Gupta, S.; Konstantatos, G. MoS2-HgTe Quantum Dot Hybrid Photodetectors beyond 2 µm. Adv. Mater. 2017, 29, 1606576. [Google Scholar] [CrossRef] [PubMed]
- Tang, X.; Wu, G.F.; Lai, K.W.C. Plasmon resonance enhanced colloidal HgSe quantum dot filterless narrowband photodetectors for mid-wave infrared. J. Mater. Chem. C 2016, 5, 362–369. [Google Scholar] [CrossRef]
- Tang, X.; Ackerman, M.M.; Chen, M.; Guyot-Sionnest, P. Dual-band infrared imaging using stacked colloidal quantum dot photodiodes. Nat. Photon. 2019, 13, 277–282. [Google Scholar] [CrossRef]
- Tang, X.; Ackerman, M.M.; Guyot-Sionnest, P. Acquisition of Hyperspectral Data with Colloidal Quantum Dots. Laser Photon. Rev. 2019, 13, 1900165. [Google Scholar] [CrossRef]
- Guyot-Sionnest, P.; Hines, M.A. Intraband transitions in semiconductor nanocrystals. Appl. Phys. Lett. 1998, 72, 686–688. [Google Scholar] [CrossRef]
- Wehrenberg, B.L.; Wang, C.; Guyot-Sionnest, P. Interband and Intraband Optical Studies of PbSe Colloidal Quantum Dots. J. Phys. Chem. B 2002, 106, 10634–10640. [Google Scholar] [CrossRef]
- Tang, X.; Chen, M.; Ackerman, M.M.; Melnychuk, C.; Guyot-Sionnest, P. Direct Imprinting of Quasi-3D Nanophotonic Structures into Colloidal Quantum-Dot Devices. Adv. Mater. 2020, 32, e1906590. [Google Scholar] [CrossRef] [PubMed]
- Bing-Zheng, D.; Jing-Ping, Z.; Yu-Zheng, M.; Hong, L.; Kai, W.; Xun, H. Effects of Bragg periods per grating period on performance of Bragg concave diffraction grating. Acta Phys. Sin. 2017, 66, 224202. [Google Scholar] [CrossRef]
- Zhang, Y.; Zhang, S.-C.; Zhang, H.-B.; Xin, Q.; Kong, Y.-Y.; Chai, B. Comparitive Study of Coaxial Bragg Resonators. J. Infrared Millim. Terahertz Waves 2010, 31, 1126–1135. [Google Scholar] [CrossRef]
- Kang, Y.M.; Arbabi, A.; Goddard, L.L. A microring resonator with an integrated Bragg grating: A compact replacement for a sampled grating distributed Bragg reflector. Opt. Quantum Electron. 2009, 41, 689–697. [Google Scholar] [CrossRef]
- Cui, H.; Zhou, S.; Ma, R.; Huang, Y.; Ren, X. Optimized Design for Resonant-cavity-enhanced (RCE) Photodetector. Semicond. Optoelectron. 2005, 26, 280–283. [Google Scholar]
- Kishino, K.; Unlu, M.S.; Chyi, J.I.; Reed, J.; Arsenault, L.; Morkoc, H. Resonant cavity-enhanced (RCE) photodetectors. IEEE J. Quantum Electron. 1991, 27, 2025–2034. [Google Scholar] [CrossRef]
- Grigel, V.; Sagar, L.K.; De Nolf, K.; Zhao, Q.; Vantomme, A.; De Roo, J.; Infante, I.; Hens, Z. The Surface Chemistry of Colloidal HgSe Nanocrystals, toward Stoichiometric Quantum Dots by Design. Chem. Mater. 2018, 30, 7637–7647. [Google Scholar] [CrossRef]
- Martinez, B.; Livache, C.; Meriggio, E.; Xu, X.Z.; Cruguel, H.; Lacaze, E.; Proust, A.; Ithurria, S.; Silly, M.G.; Cabailh, G.; et al. Polyoxometalate as Control Agent for the Doping in HgSe Self-Doped Nanocrystals. J. Phys. Chem. C 2018, 122, 26680–26685. [Google Scholar] [CrossRef]
- Melnychuk, C.; Guyot-Sionnest, P. Auger Suppression in n-Type HgSe Colloidal Quantum Dots. ACS Nano 2019, 13, 10512–10519. [Google Scholar] [CrossRef]
- Zhao, X.; Mu, G.; Tang, X.; Chen, M. Mid-IR Intraband Photodetectors with Colloidal Quantum Dots. Coatings 2022, 12, 467. [Google Scholar] [CrossRef]
- Prodanović, N.; Vukmirović, N.; Ikonić, Z.; Harrison, P.; Indjin, D. Importance of Polaronic Effects for Charge Transport in CdSe Quantum Dot Solids. J. Phys. Chem. Lett. 2014, 5, 1335–1340. [Google Scholar] [CrossRef] [PubMed]
- Deng, Z.; Jeong, K.S.; Guyot-Sionnest, P. Colloidal Quantum Dots Intraband Photodetectors. ACS Nano 2014, 8, 11707–11714. [Google Scholar] [CrossRef] [PubMed]
Publisher’s Note: MDPI stays neutral with regard to jurisdictional claims in published maps and institutional affiliations. |
© 2022 by the authors. Licensee MDPI, Basel, Switzerland. This article is an open access article distributed under the terms and conditions of the Creative Commons Attribution (CC BY) license (https://creativecommons.org/licenses/by/4.0/).