1. Introduction
The extracellular matrix (ECM) is a complex cellular environment and integral mechanical and structural part of the tissues. It provides pathways for cellular signaling, directing cell adhesion, function, differentiation, migration, proliferation and tissue formation [
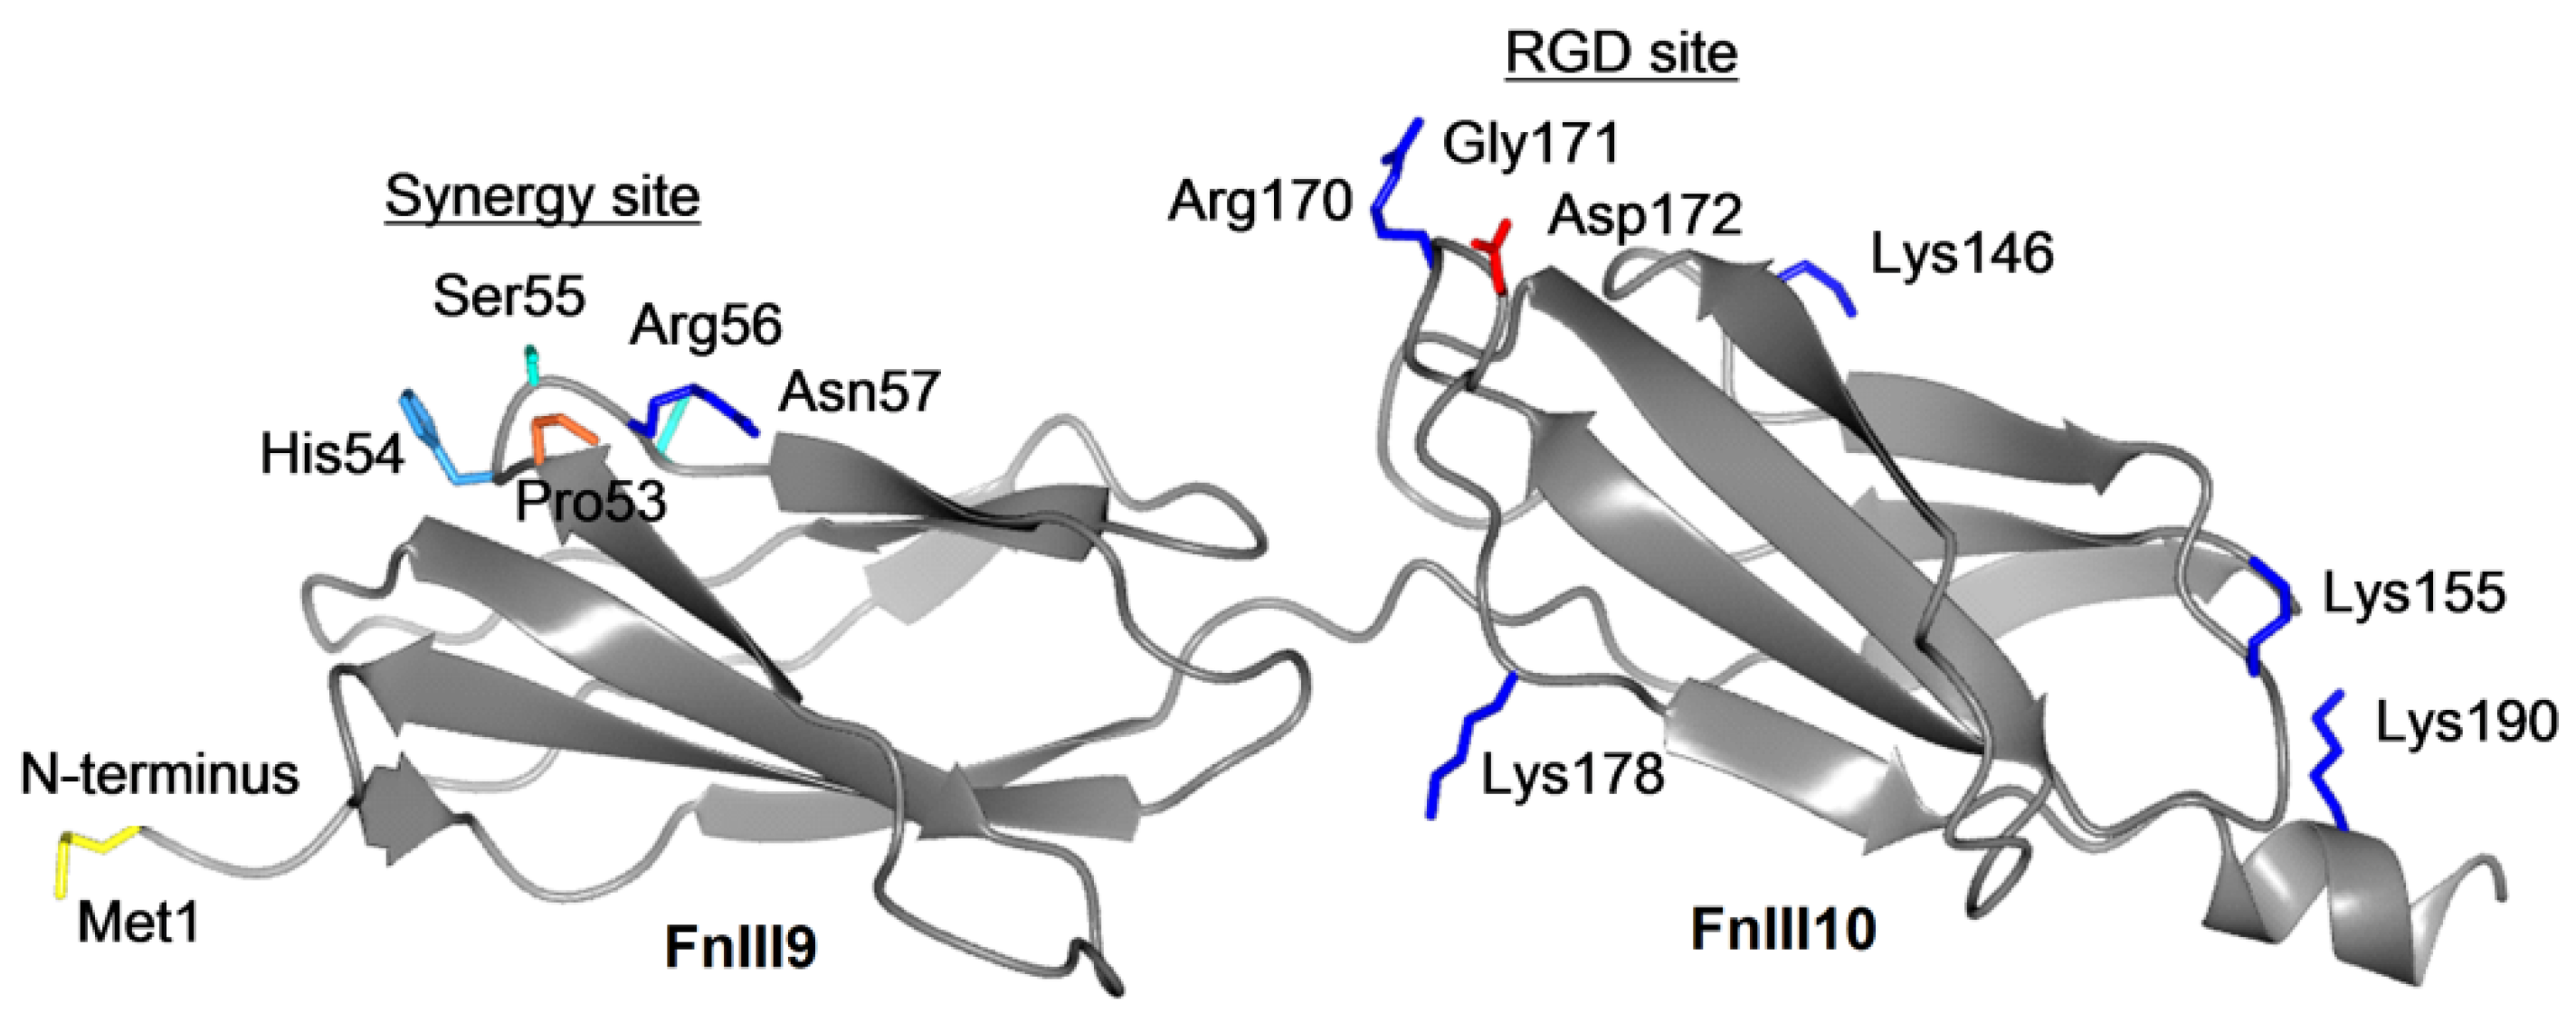
1]. Fibronectin (Fn) is a ubiquitous ECM protein, which is responsible for cytoskeletal assembly, cell attachment and migration. The globule of Fn displays several exposed molecular recognition sites for other ECM macromolecules and for cell receptors, including the well-studied Arginine–Glycine–Aspartic acid (RGD) loop and Pro–His–Ser–Arg–Asn (PHSRN) synergy site located at the Fn type-III domain repeats 10 (FnIII10) and 9 (FnIII9), respectively [
2]. Controlling the interactions between the Fn molecule and cellsoffers an interesting strategy to stimulate cellular responses [
3]. Specific fragments of Fn can be deposited on artificial surfaces and employed, for example, in analyzing phenotypes of adherent cells [
4]. On the other hand, further dissection of Fn into smaller peptide fragments, e.g., RGD or RGD-PHSRN, leads to the loss of the correct structural context of the interacting cells and significantly lowers the overall adhesion strength [
5].
Conformation of FnIII9-10 and/or FnIII10 at artificial interfaces has been analyzed by different modeling and experimental techniques. Molecular dynamics (MD) studies have been carried out on the physisorption of FnIII9-10 [
6] and FnIII8-10 [
7], describing the biological activity of the physisorbed Fn fragments. Additionally, MD simulations of FnIII7-10 indicated transient interactions with self-assembled monolayers [
8]. A force spectroscopy study [
9] reported on FnIII8-14 transition from “side-on” to “end-on” orientation during surface adsorption. However, non-covalent protein immobilization on surfaces does not provide a stable interface, leading to substantial protein desorption in cell culture medium [
10].
There are numerous different approaches for surface functionalization by covalently attaching the entire Fn molecules (recently reviewed by Palomino et al. [
11]). Some previous reports have indicated that coupling chemistry and/or choice of specific pining positions on the polypeptide chain are important for the functionality of the bound protein. For example, Vallieres et al. [
12] covalently anchored Fn on amino-functionalized silica via primary amine groups, finding that such an immobilization was more favorable for cell adhesion than immobilization via the thiol moiety.
Furthermore, a few reports have suggested controlled immobilization of the Fn fragments as a strategy for investigation of cellular adhesion: covalent docking via primary amines [
5], thiol [
13,
14] and fusion protein [
15] have been reported. Markowski et al. [
13] analyzed interactions of epithelial cells with FnIII9-10 variants covalently immobilized on polyacrylamide hydrogels, taking into account the substrate stiffness. They found that Fn fragments and the substrate mechanics act synergistically to direct the epithelial-to-mesenchymal transition of the cells. Hui et al. [
14] covalently bound FnIII9-10 variants to hyaluronic acid hydrogels, mimicking the mechanics of healthy and fibrotic lung tissue to study the adhesion of lung fibroblasts. They found that the viscoelastic and adhesive cues together regulate fibroblast mechanobiology. However, the above-referred studies lack the details on the surface characterization of the coatings consisting of the Fn fragments.
Precise tailoring of the cellular environment in terms of the selection and orientation of specific ECM building blocks could be combined with the promising technologies of cell patterning and networking [
16]. Cell chips comprising micro/nanometer-scale features consisting of ECM fragments could open new possibilities for miniaturized and highly parallelized analysis of the fundamental mechanisms involved in cellular adhesion, proliferation, differentiation and migration.
Recently, we introduced an efficient platform for cell chip fabrication taking advantage of initiator-free synthesis of polyethylene glycol methacrylate (PEG MA) hydrogels on glass substrates [
17]. We demonstrated that such substrates can be efficiently used for the covalent immobilization and patterning of different proteins. Covalent immobilization of Fn in micropatterns with a high density of molecules in a hydrogel-like state has proved useful, for example, in studies of human primary cardiac stem cell differentiation [
18]. Therefore, in the present study, we report on the possibility of fabricating biochip surfaces consisting of FnIII9-10 or FnIII10 covalently immobilized on a chemically activated PEG MA surface by microcontact printing [
19].
Contrary to the above-cited studies on various Fn fragment immobilization, we performed characterization of our biochip surfaces by a set of surface analysis techniques. Having ensured that the Fn fragments can be docked to the bioinert PEG hydrogel substrates with a controlled surface density, homogeneity and stability, we further compared cell adhesion. We tested Fn fragment-decorated biochip surfaces in human foreskin fibroblast and epithelial HeLa cell cultures. Our study suggests different responses of the selected cell types to the Fn fragment vs. full-length Fn surfaces, as judged from the cell proliferation assay.
2. Materials and Methods
2.1. DNA Constructs, Recombinant Protein Production and Purification
Human fibronectin 1 (Fn1) (NG_012196.1) fragments corresponding to FnIII9-10 and FnIII10 included segments 4338-4910 and 4608-4910 of the Fn1 transcript mRNA (NM_212474.3) sequence. The fragment FnIII9-10 was PCR cloned from FN207 plasmid [
20] (No. 50497; Addgene, Watertown, MA, USA); for FnIII10, the codon usage was optimized for
E. coli and the nucleotide sequence was produced by gene synthesis (Thermo Fisher Scientific, Waltham, MA, USA) (
Supplemental Materials,
Figure S1).
The Impact (New England BioLabs, Ipswich, MA, USA) protein purification system utilizing a C-terminus-fused, self-cleavable intein tag with a chitin-binding domain was used for protein production. All steps were carried out according to manufacturer instructions with several modifications. Restriction enzymes NdeI and LguI (Thermo Fisher Scientific Baltics, Vilnius, Lithuania) were used to clone the constructs into a pTXB1 vector (New England BioLabs, Ipswich, MA, USA) and electrocompetent
E. coli DH5 alpha (McLab, South San Francisco, CA, USA) cells were transformed for clone selection and
E. coli BL21 (DE3) (McLab, South San Francisco, CA, USA) was used for protein production. The overnight bacterial culture was diluted in Lysogeny Broth (LB) medium [
21] containing 100 µg·mL
−1 of ampicillin, incubated to reach the OD
600 0.4–0.6 and protein production, was induced with 1 mM of isopropyl-β-D-thiogalactoside for 4 h at 37 °C. The cells were centrifuged, and the pellet was resuspended in ~1/10 volume of ice-cold 20 mM Tris-HCl, pH 8.8, supplemented with 0.5 mM of phenylmethylsulfonyl fluoride and 1 mM of tris (2-carboxyethyl) phosphine. The cells were lysed, cellular debris was removed by centrifugation and the supernatant was loaded on the column, packed with 10 mL of chitin beads (New England BioLabs, Ipswich, MA, USA). Intein cleavage was induced by 40 mM dithiothreitol (DTT) at 4 °C overnight. The eluted protein was desalted using PD-10 columns (GE Healthcare, Chicago, IL, USA).
2.2. Recombinant Protein Characterization
The recombinant protein samples were separated by sodium dodecyl sulfate–polyacrylamide gel electrophoresis (SDS PAGE) on 12% polyacrylamide gel using the Mini Protean system (BioRad, Hercules, CA, USA). After staining with Expedeon Instant Blue dye (Abcam, Cambridge, UK), the gels were scanned with an FLA 9000 scanner (GE Healthcare, Chicago, IL, USA), and the target protein purity was assessed using ImageQuant TL v.7.0 software (GE Healthcare, Chicago, IL, USA). The protein bands were excised from the gel, and in-gel digestion was carried out using MS-grade trypsin (Pierce, Appleton, WI, USA) according to Kondo and Hirohashi [
22] and Shevchenko et al. [
23]. Tryptic peptides were loaded and desalted on a 100 μm × 20 mm Acclaim PepMap C18 trap column and separated on a 75 μm × 150 mm Acclaim PepMap C18 column using an Ultimate3000 RSLC system (Thermo Fisher Scientific, Waltham, MA, USA), coupled to a Maxis G4 Q-TOF mass spectrometer detector with a Captive Spray nanoelectrospray ionization source (Bruker, Billerica, MA, USA). Peptide identification was performed using the MASCOT server (Matrix Science, London, UK) against the corresponding Fn1 fragment sequence and the SwissProt database (The UniProt Consortium, 2021). The data were visualized using the ProteinScape software (Bruker, Billerica, MA, USA).
2.3. Hydrogel-Coated Substrates
The detailed procedures for hydrogel synthesis are described elsewhere [
17]. Briefly, commercial glass (AG Schott, Perai, Malaysia) or silica (Accurion GmbH, Göttingen, Germany) substrates were rinsed in ethanol and dried under a stream of nitrogen gas (99.999% purity). Then, they were washed for 10 min using the SC-1-cleaning procedure, in a 5:1:1 mixture of ultrapure water, 30% H
2O
2 (Carl Roth GmbH, Karlsruhe, Germany) and 25% NH
4OH (Carl Roth GmbH) solutions, at 85 °C temperature for 10 min. Subsequently, they were treated in a plasma dry cleaner for 3 min at a 20 W power (Femto, Diener Electronic GmbH, Ebhausen, Germany). The plasma-treated glass or silica substrates were modified with (3-aminopropyl)trimethoxysilane (APTMS) (Sigma, St. Louis, MO, USA) in a custom-made vacuum chamber for 20 min at a 50 mm bar pressure and baked for 2 h at 120 °C temperature. Just before hydrogel synthesis by self-initiated photografting and photopolymerization (SIPGP) reaction, the samples were rinsed in water for 20 s and dried in a stream of nitrogen gas. Then, a drop of 5% of glutaraldehyde solution (GA) (Sigma) in 0.1 M phosphate buffer (PB) pH 8.0 was placed on the sample surface for 10 min to convert the amine groups into aldehyde groups. After this step, the samples were rinsed in ultrapure water and gently blown dry in nitrogen gas. Monomer solutions of 360 mM of 2-hydroxyethyl methacrylate (HEMA), poly(ethylene glycol) methacrylate (PEGMA) and methacrylic acid (MA) (all from Sigma) were all prepared in ultrapure water (taken directly from a Synergy 185 UV unit, Millipore). The monomer solutions were mixed in a 1:1:1 ratio using a regular shaker. Drops of 8 μL of the mixed monomers were used to coat 400 mm
2 size samples for the subsequent SIPGP procedure, which was performed under UV light with the main emission peak at 254 nm. The glass and silica substrates with the synthesized hydrogel coatings were rinsed in ultrapure water for 1 min, dried under a nitrogen gas stream and kept dry at 4 °C till further use.
2.4. Protein Immobilization
The polypeptides were immobilized on the hydrogel substrate by means of random covalent coupling through the primary amines (lysines and N-terminus) to activated carboxyls of the PEG-based hydrogel coating. Briefly, substrates coated with the hydrogel containing functional carboxyl groups were incubated in ethanol solution of N-hydroxysuccinimide (NHS) and 1-ethyl-3-(3-dimethylaminopropyl)carbodiimide hydrochloride (EDC) (both from Sigma) for 25 min. After incubation, the chip substrates were cleaned in an ultrasonic bath in ethanol and ultrapure water, respectively. Cell-adhesive zones consisting of the Fn protein or Fnfragments were fabricated by microcontact printing [
19]. Briefly, circular 6 mm diameter polydimethylsiloxane PDMS (Dow Corning) elastomeric stamps containing a surface topography of protruding 190 µm wide stripes with 200 µm spacing were employed. They were treated with oxygen plasma for 30 s, then coated with solutions of 1 mg·mL
−1 FnIII9-10, FnIII10 or 0.1 mg·mL
−1 Fn (Yo Proteins AB, Huddinge, Sweden) and incubated for 5 min. After incubation, the excess protein solution was removed with a pipette, and the elastomeric stamp was dried under the nitrogen gas flow and transferred into contact with the activated hydrogel surface. After 5 min, the elastomeric stamp was removed from the hydrogel surface, which was chemically quenched in 0.1 M ethanolamine solution in phosphate buffer for 40 min. After the passivation step, the fabricated chips were rinsed in ultrapure water and blown dry in the nitrogen gas stream. For inspection of the FnIII9-10 and FnIII10 RGD fragments, we chose to use antibodies that recognize the cell attachment fragments of human fibronectin molecules. We obtained biochip surfaces containing the FnIII9-10, FnIII10 and Fn zones, which were visualized with anti-fibronectin cell attachment fragment antibody (Merck, MAB88916-C), diluted 1:1000 with PBS buffer and incubated on substrates for 1 h at room temperature (RT). The secondary antibody Alexa Fluor goat anti-mouse IgG (H&L) was used at 2 μg·mL
−1 for 30 min in the dark.
2.5. Imaging Ellipsometry
A single-wavelength imaging null-ellipsometer Nanofilm EP3, equipped with a laser emitting at the 658 nm wavelength (Accurion GmbH, Germany), was employed for the hydrogel and protein thickness mapping on silica-coated substrates (Accurion GmbH, Germany). Measurements were performed at a 60° angle of incidence. The thickness of the protein layer was modeled using the Accurion data analysis program, EP4 Model. The refractive index values were taken from the inbuilt databases. The analyzed hydrogel layers and protein zones were modeled as an ‘organic’ layer with a refractive index of n = 1.5 and k = 0. At least nine FnIII9-10 and FnIII10 surfaces that were prepared in three batches were measured, and at least six height maps were acquired from each sample for analysis. Four Fn surfaces were prepared, and at least six height maps were acquired for analysis.
2.6. Atomic Force Microscopy
Surface topography and thickness of the Fn/Fn fragment layers were analyzed using a NanoWizard 3 (Bruker) atomic force microscope (AFM). To evaluate the layer changes as the hydrogel and Fn/Fn fragments swell, the samples were scanned both in air and in 1× phosphate-buffered saline (PBS) (pH 7.4). All measurements were carried out in the quantitative imaging (QI) mode with MLCT-A (Bruker AFM) probes, at a set point of 1 nN. The scanned area ranged from 10 µm × 10 µm to 5 µm × 5 µm with a set resolution of 256 × 256 pixels. The QI mode is based on measuring force–displacement curves for each pixel. Therefore, for the scans of a swelled sample, a contact point height (CPH) was calculated to eliminate any surface deformations eventually occurring during the measurements. The CPH was determined by finding a height from the approach part of the force–displacement curve at which deflection was detected. The AFM scan data were processed employing the JPK Data Processing (v.6.1.120) and Gwyddion (v.2.53) [
24] software. All the samples mapped by imaging ellipsometry samples were additionally analyzed by AFM, and at least three zones were imaged on each sample.
2.7. Cell Adhesion and Proliferation
Human foreskin fibroblasts transfected with a green fluorescent protein (HF-GFPs) and HeLa cells were maintained in a humidified 37 °C incubator (Binder C150, Tuttlingen, Germany) purged with 5% CO2. HF-GFPs were cultivated in the Medium106 media (Gibco, ThermoFisher Scientific, Waltham, MA, USA) with a low serum growth supplement (LSGS) (Gibco, ThermoFisher Scientific), 0.1 mg·mL−1 streptomycin/penicillin. The HeLa cells were cultivated in the Advance DMEM medium (Gibco, ThermoFisher Scientific) with 10% fetal bovine serum (FBS) and 200 mM L-glutamine, 0.1 mg·mL−1 streptomycin/penicillin. All samples were fixed in 4% paraformaldehyde in PBS for 10 min, washed three times with PBS, and examined under an Olympus BX51 upright microscope and an Olympus IX81 inverted microscope.
The biochips consisting of the hydrogel coatings with the immobilized FnIII9-10, FnIII10 or Fn proteins were used for single-cell shape analysis. They were placed into a tissue culture plate (TCP) (Techno Plastic Products AG, Trasadingen, Switzerland), and then approx. 2500 HF-GFP or HeLa cell were seeded. The biochip samples were kept in the cell culture for 24 h and then fixed. For permeabilization and blocking of nonspecific binding, the samples were incubated in PBS containing 0.1% Triton X-100 for 5 min and in 1% bovine serum albumin (BSA) for 30 min. The primary antibodies to vinculin (ab18058) were diluted 1/250 and incubated with samples for 2 h at RT. The secondary antibodies ab150113 AlexaFluor 488 goat anti-mouse IgG (H&L) were used at 2 μg·mL−1 for 30 min. Seven samples of each FnIII9-10, FnIII10 and Fn-modified biochips were prepared for HF-GFP single-cell shape analysis and 178, 198 and 83 single cells, respectively, were selected for analysis. Four of each FnIII9-10, FnIII10 and Fn chip, samples were prepared for HeLa single-cell shape analysis, and at least 265 cells from each surface type were selected for analysis. For controlled cell culture experiments, the HF-GFP and HeLa cells were seeded (approx. 2500 cells) both on the chips placed into the TCPs, as well as on empty TCPs, to facilitate cell counting. After 96 h of culturing, the chips were washed with 10 mM PBS twice and fixed. For cell proliferation, the CCK8 assay (Abcam, ab228554) was used. Cell proliferation experiments were performed on Days 1, 2 and 4, according to the manufacturer’s instructions. Fixed cell blockings were performed as described above. The primary antibodies to the full length of Fn protein (ab268020) were diluted 1/500 and incubated with samples for 1 h 30 min at RT. The secondary antibodies were ab6719 TexasRed goat anti-rabbit IgG (H&L), used at 2 μg·mL−1 for 30 min in the dark. Proliferation experiments on FnIII9-10, FnIII10, Fn and TCP surfaces were repeated three times, and four samples (chips) were used in each experiment.
2.8. Statistical Analysis
The imaging ellipsometry, AFM and CCK8 data were analyzed in Microsoft Office Excel 2010, and the quantitative results are presented as mean ± standard errors.
In the single-cell adhesion analysis, the cell borders, area, perimeter and focal adhesion areas were calculated with the ImageJ v.1.49h [
25] software. The cell shape index was calculated applying the equation: shape index = 4πA/P
2, where A is the cell area, and P is the cell perimeter. The quantitative results are presented as mean ± standard errors. The statistical data analysis was performed by applying the Analysis of variance (ANOVA) with the LSD post hoc test. Differences were considered statistically significant when
p < 0.05. The data were processed using the Microsoft Office Excel 2010 and SPSS 20 (IBM) software.
3. Results
The fibronectin fragments corresponding to the type-III repeats 9-10 (FnIII9-10) and repeat 10 (FnIII10) include either combination of the cell adhesion synergy site with the RGD motif (FnIII9-10) or the RGD motif only (FnIII10). Recombinant protein production using a C-terminus fused self-cleavable intein tag with a chitin-binding domain, followed by chitin affinity matrix purification, yielded purities of FnIII9-10 and FnIII10 of 98% and 93%, respectively (see
Supplementary Materials,
Figure S2). This was comparable to the purity of the commercial Fn, 95%. To assess the potential effect of post-translational modifications resulting from expression in the bacterial cells or protein purification procedure, tryptic digestion of the SDS PAGE band corresponding to the FnIII9-10 fragment was analyzed by mass spectrometry (
Supplementary Materials,
Figure S3). The analysis resulted in the 97.4% coverage of the protein sequence and revealed partial oxidation of the two methionine residues (Met1 and Met192). However, we assume that the type and location of this modification would not be likely to affect the efficiency of immobilization and the cell-binding properties of the fragments.
3.1. Characterization of Biochip Surfaces
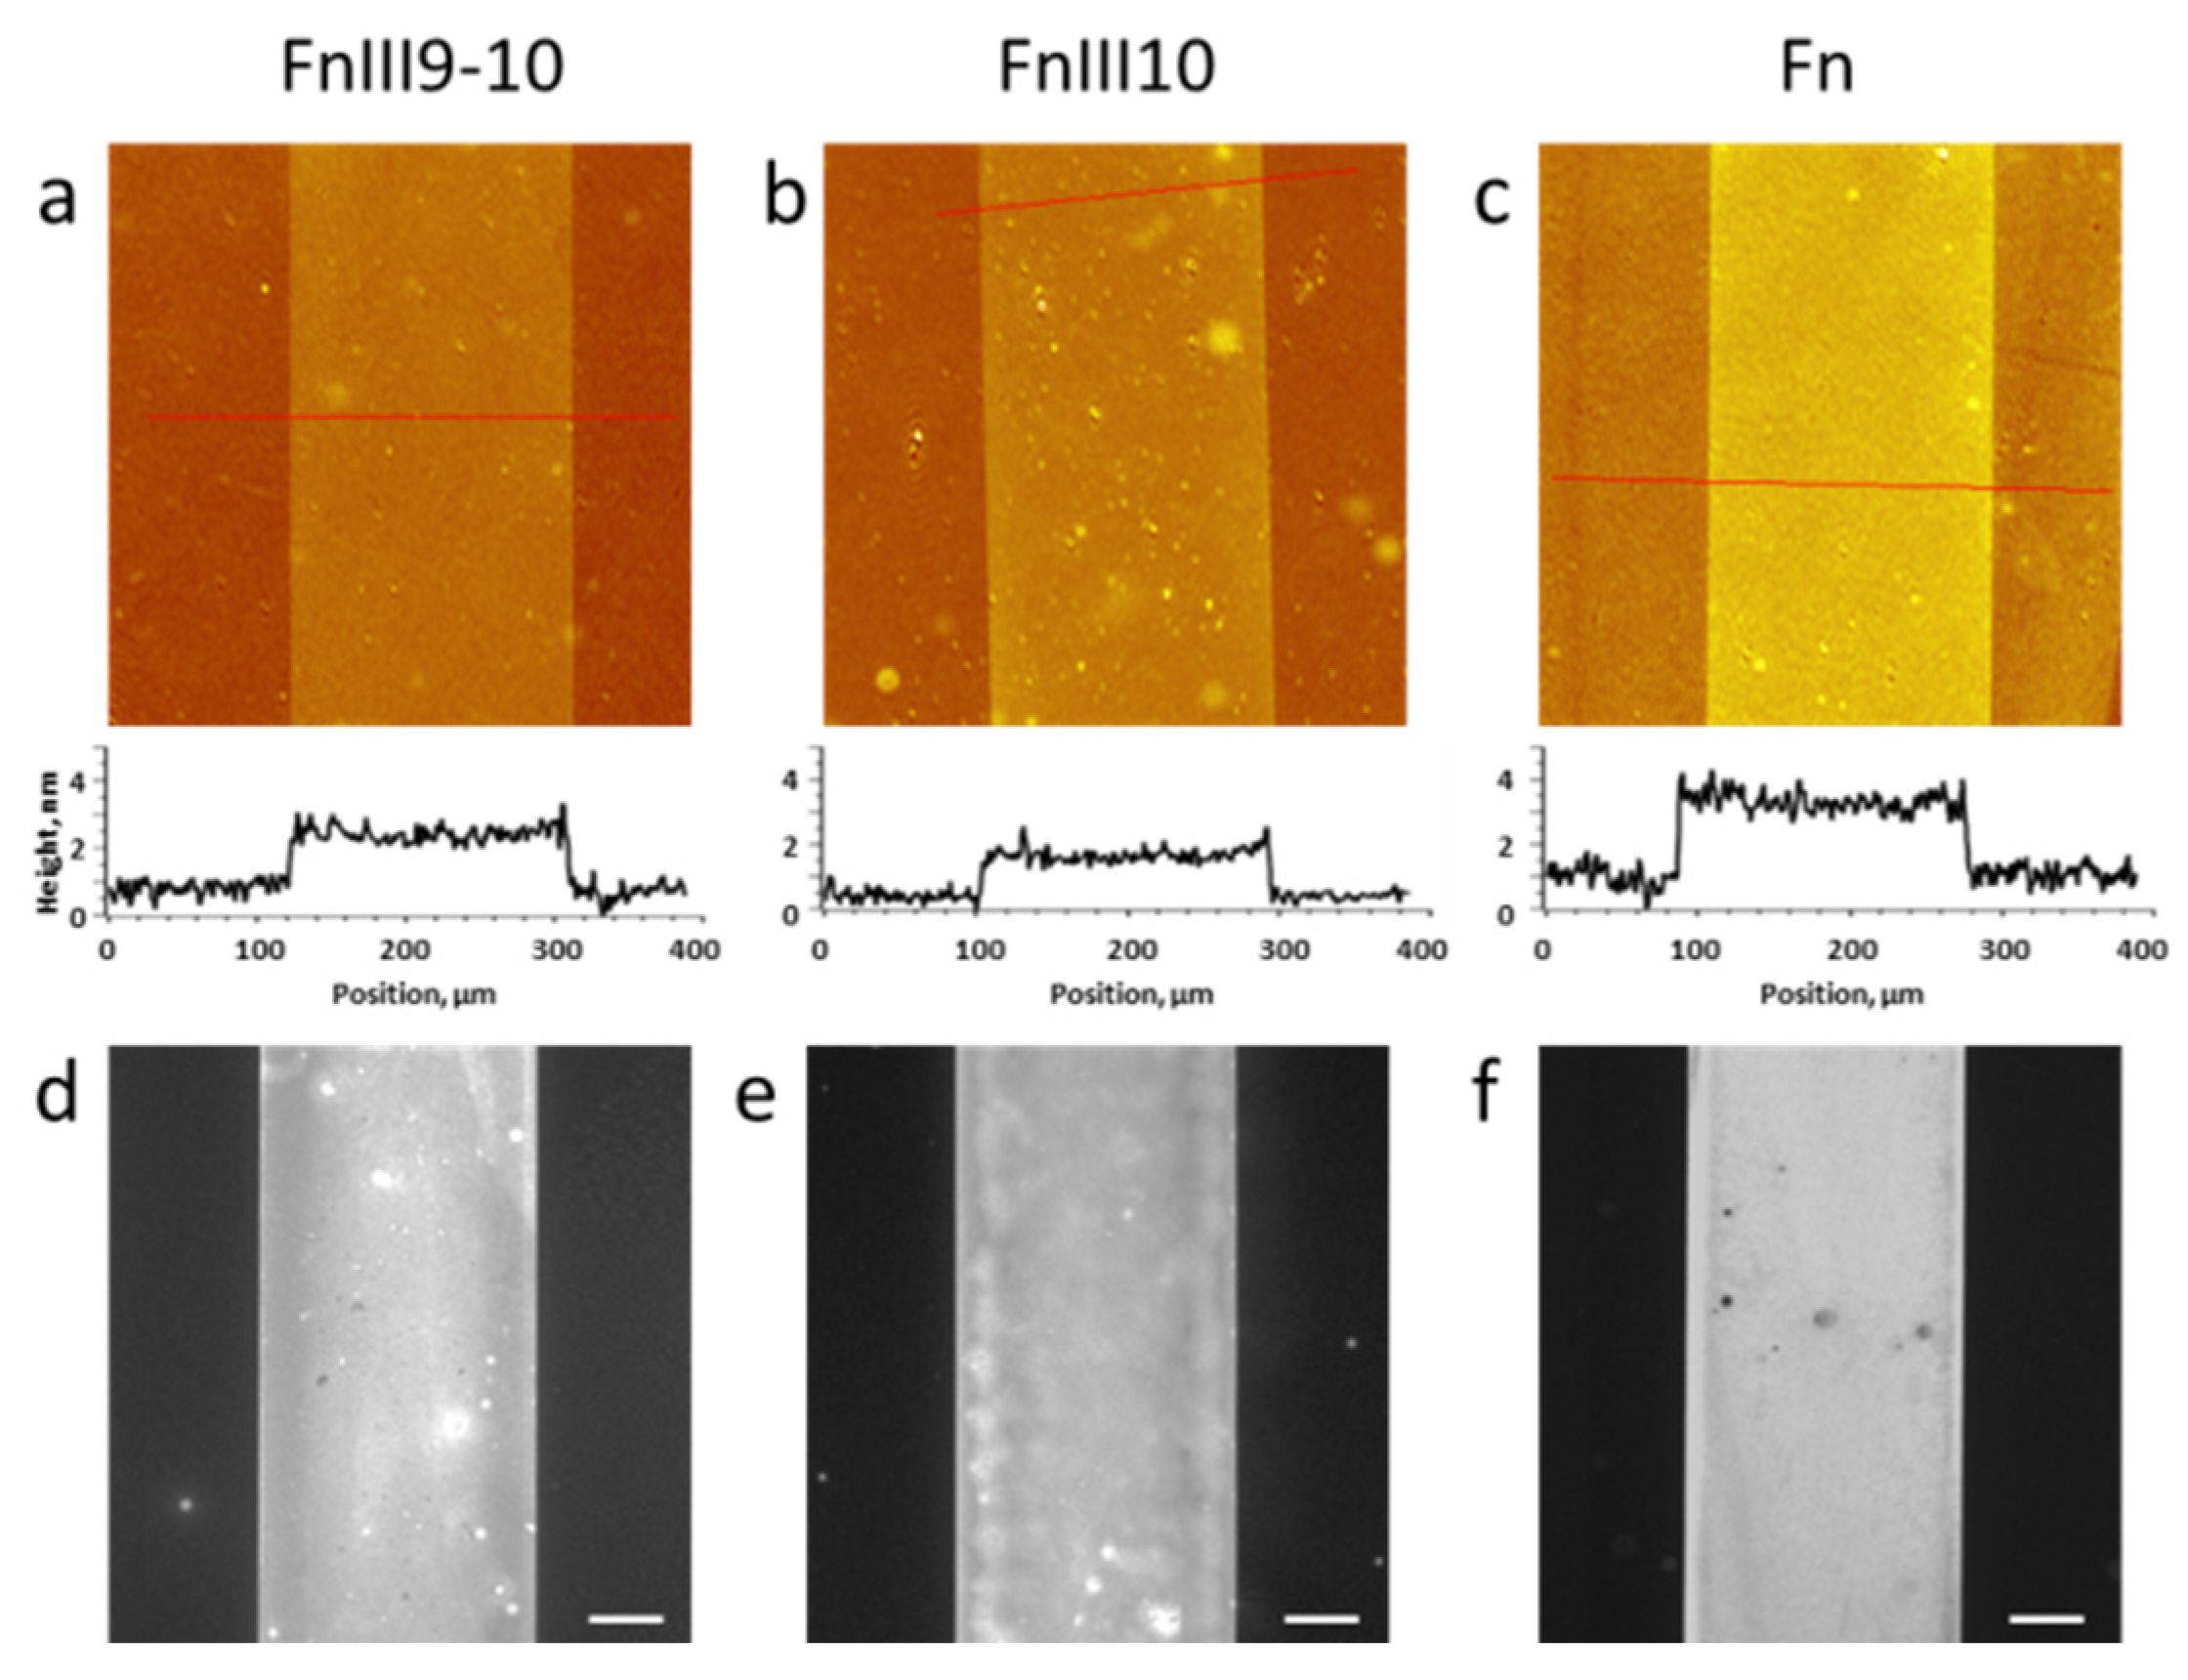
We characterized the fabricated biochip surfaces that consisted of the cell-adhesive (Fn fragment or Fn) zones and bioinert (cell- and protein-repellent) zones by a set of complementary surface analysis techniques: imaging ellipsometry, fluorescence microscopy and atomic force microscopy (AFM).
Figure 1a–c show representative examples of label-free visualization of the surfaces: imaging ellipsometry height maps of FnIII9-10, FnIII10 and Fn covalently immobilized onto the PEG MA hydrogel on silica, respectively. We could confirm that the microcontact printing process yielded homogeneous zones consisting of both the Fn fragment and full Fn protein. The ellipsometric height of the obtained layers ranged from 1.4 ± 0.4 nm for FnIII9-10 and FnIII10 to 2.4 ± 0.5 nm for Fn. Such thickness values can be compared to the average size of the Fn globule, which is 2 nm [
26], indicating formation of a dense layer of the selected biomolecules.
We tested the functionality of the two immobilized Fn fragments and Fn by antibody binding against the cell attachment fragment. As shown in
Figure 1d–f, in all three cases, antifibronectin (cell attachment fragment antibody) binding suggested the RGD motive being exposed to the ambient. Note that for fluorescence visualization and for the cell studies presented below, we fabricated samples containing the Fn fragments/Fn on PEG MA hydrogels synthesized on glass substrates. The efficient antibody binding to the fragment/protein zones confirms the completeness of the immobilized fragment/protein layers, despite the exposure of the molecules to air during the microcontact printing process and covalent attachment to the PEG MA surface via multiple primary amine groups of the polypeptide chain. Additionally, this experiment confirms the excellent resistance of the PEG MA coating to nonspecific protein binding [
17].
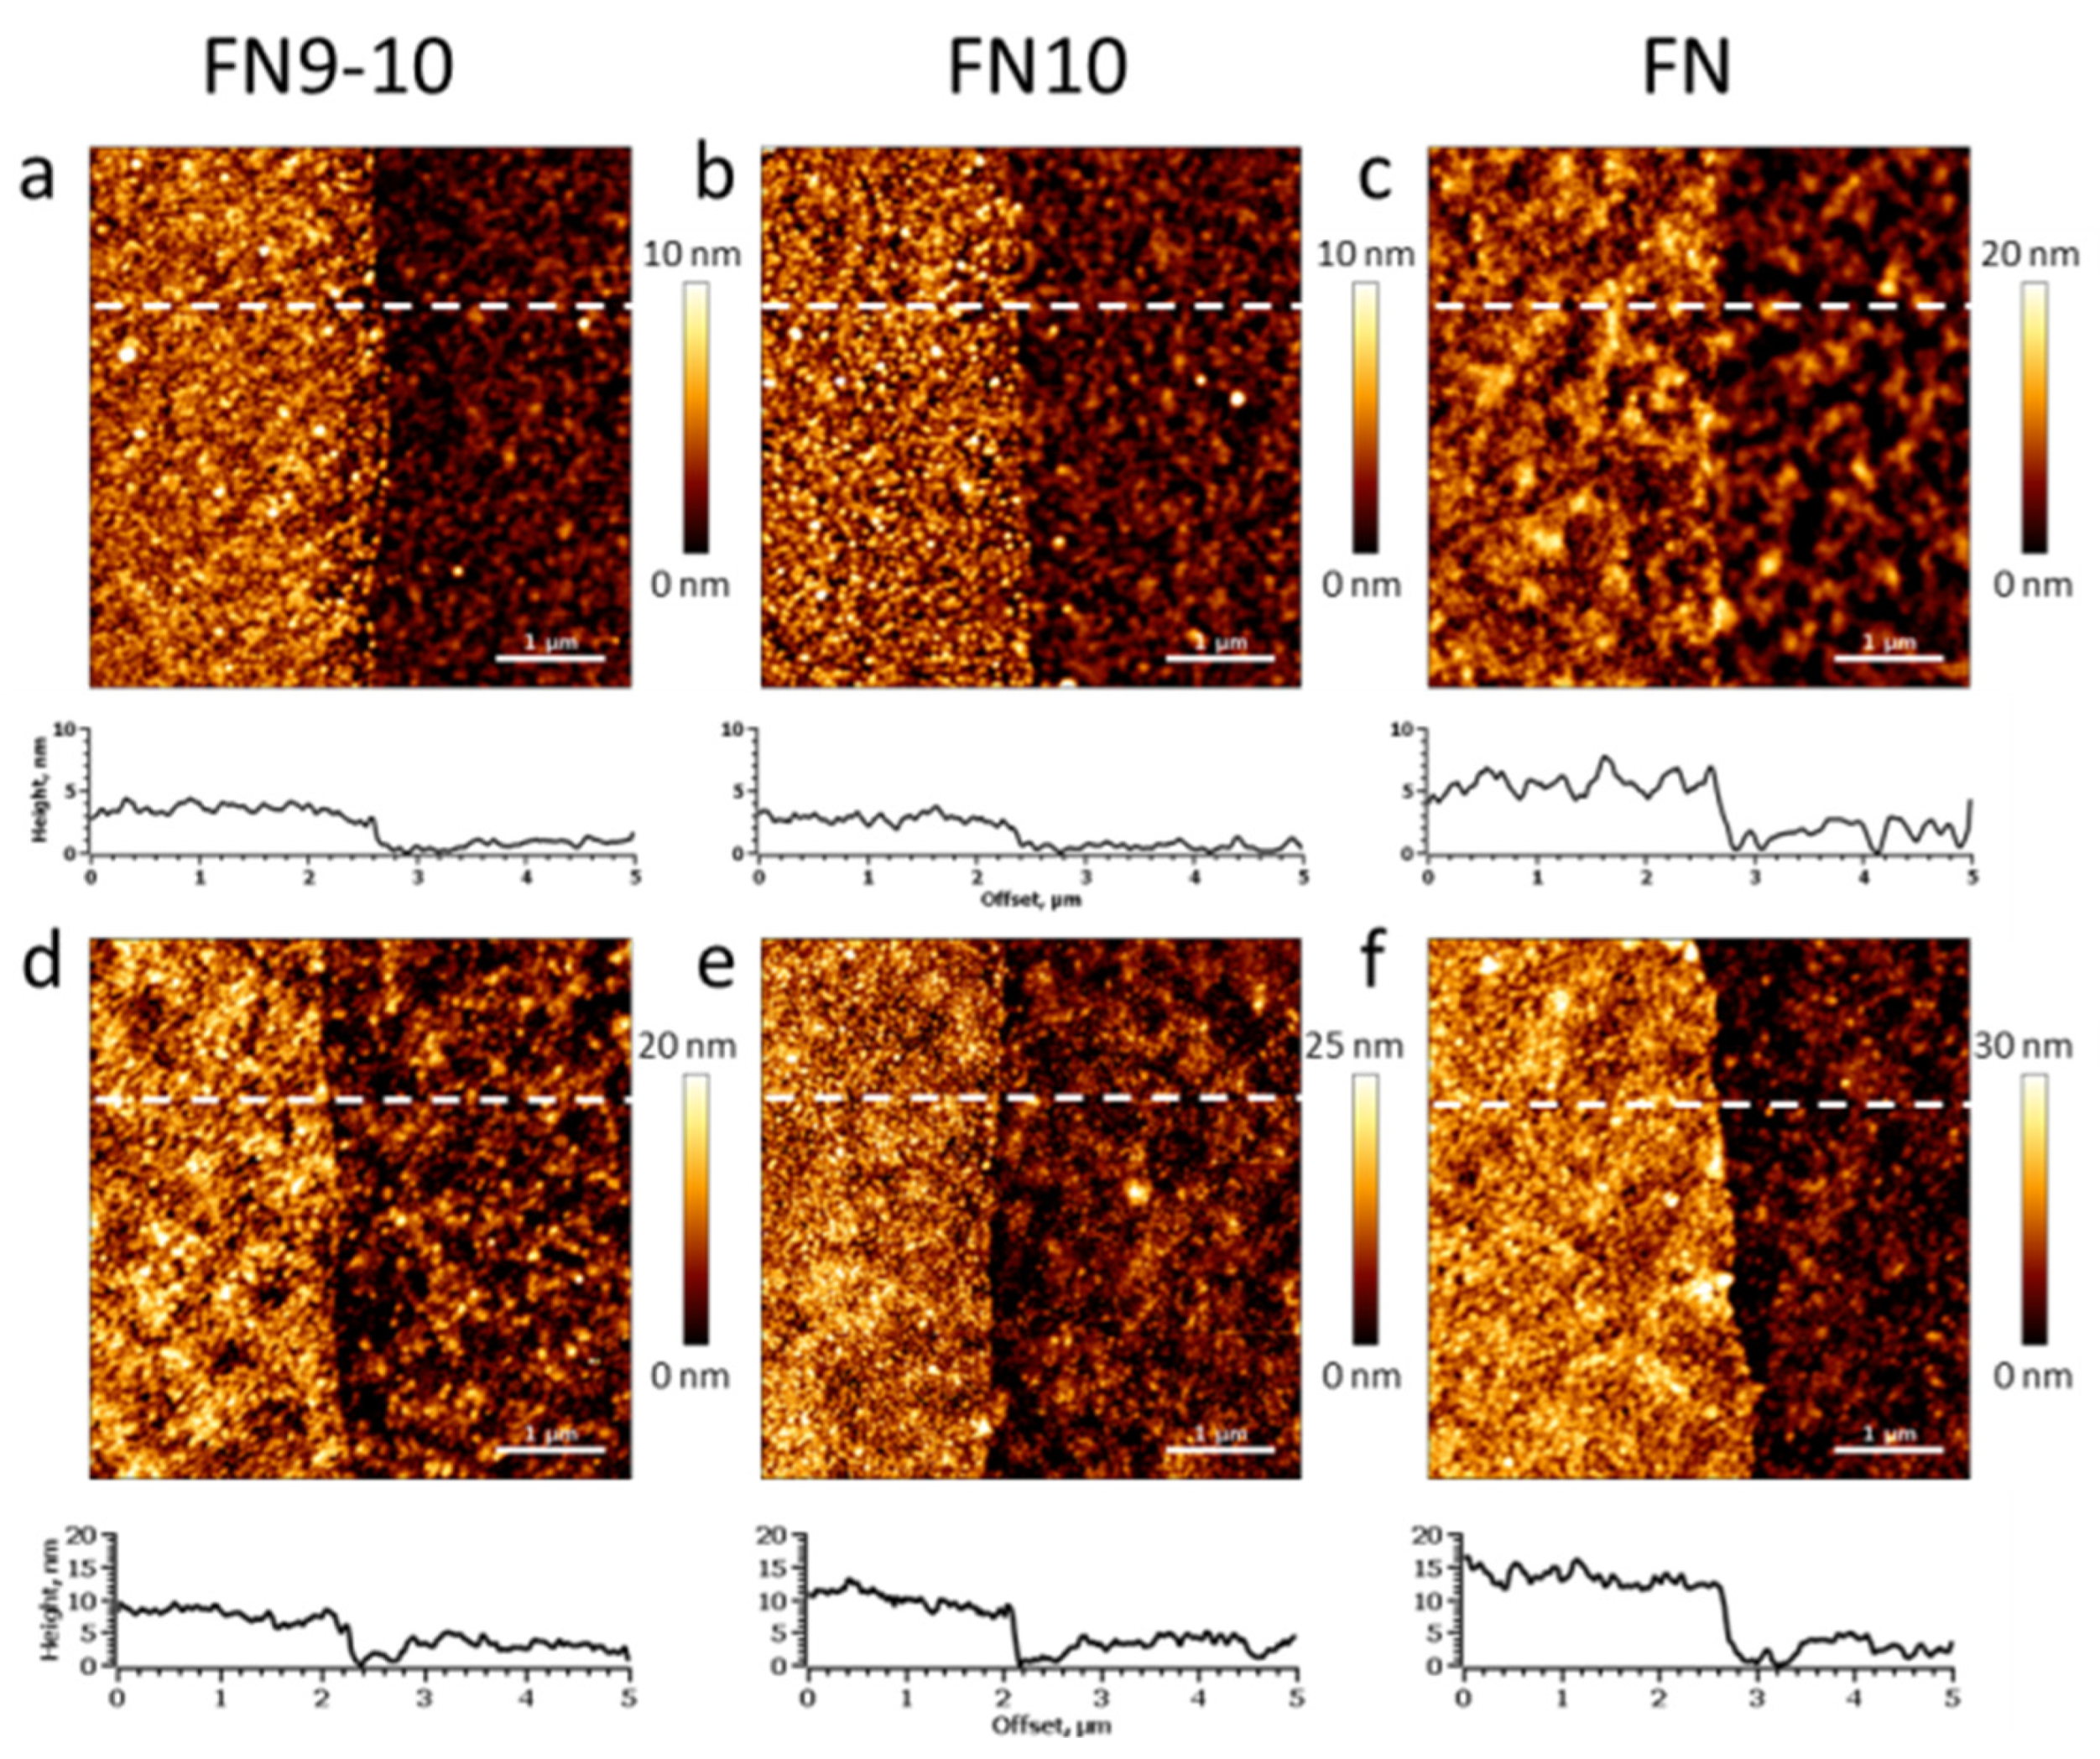
To verify the Fn protein/fragment layer thickness independently and to obtain nanometer-scale structural information, we carried out AFM analysis of the surfaces both in air and in buffer.
Figure 2a–c shows representative AFM topography images recorded in air. The AFM topography height was 2.4 ± 0.2 nm, 1.8 ± 0.2 nm and 3.9 ± 0.4 nm for FnIII9-10, FnIII10 and Fn, respectively. The formed protein/fragment zones were complete, smooth and resembled the topography of the hydrogel surface (within the range of standard deviation), and they had well-defined borders.
Upon submerging the biochip samples in PBS buffer (pH 7.4), the AFM height of the protein layer increased to 6.2 ± 0.7 nm, 6.5 ± 0.7 nm and 10.9 ± 1.1 nm for FnIII9-10, FnIII10 and Fn, respectively. The RMS surface roughness also increased. Despite the observed swelling, all FnIII9-10, FnIII10 and Fn zones remained stable and preserved their structural integrity (see
Table 1 for details).
3.2. Single-Cell Analysis
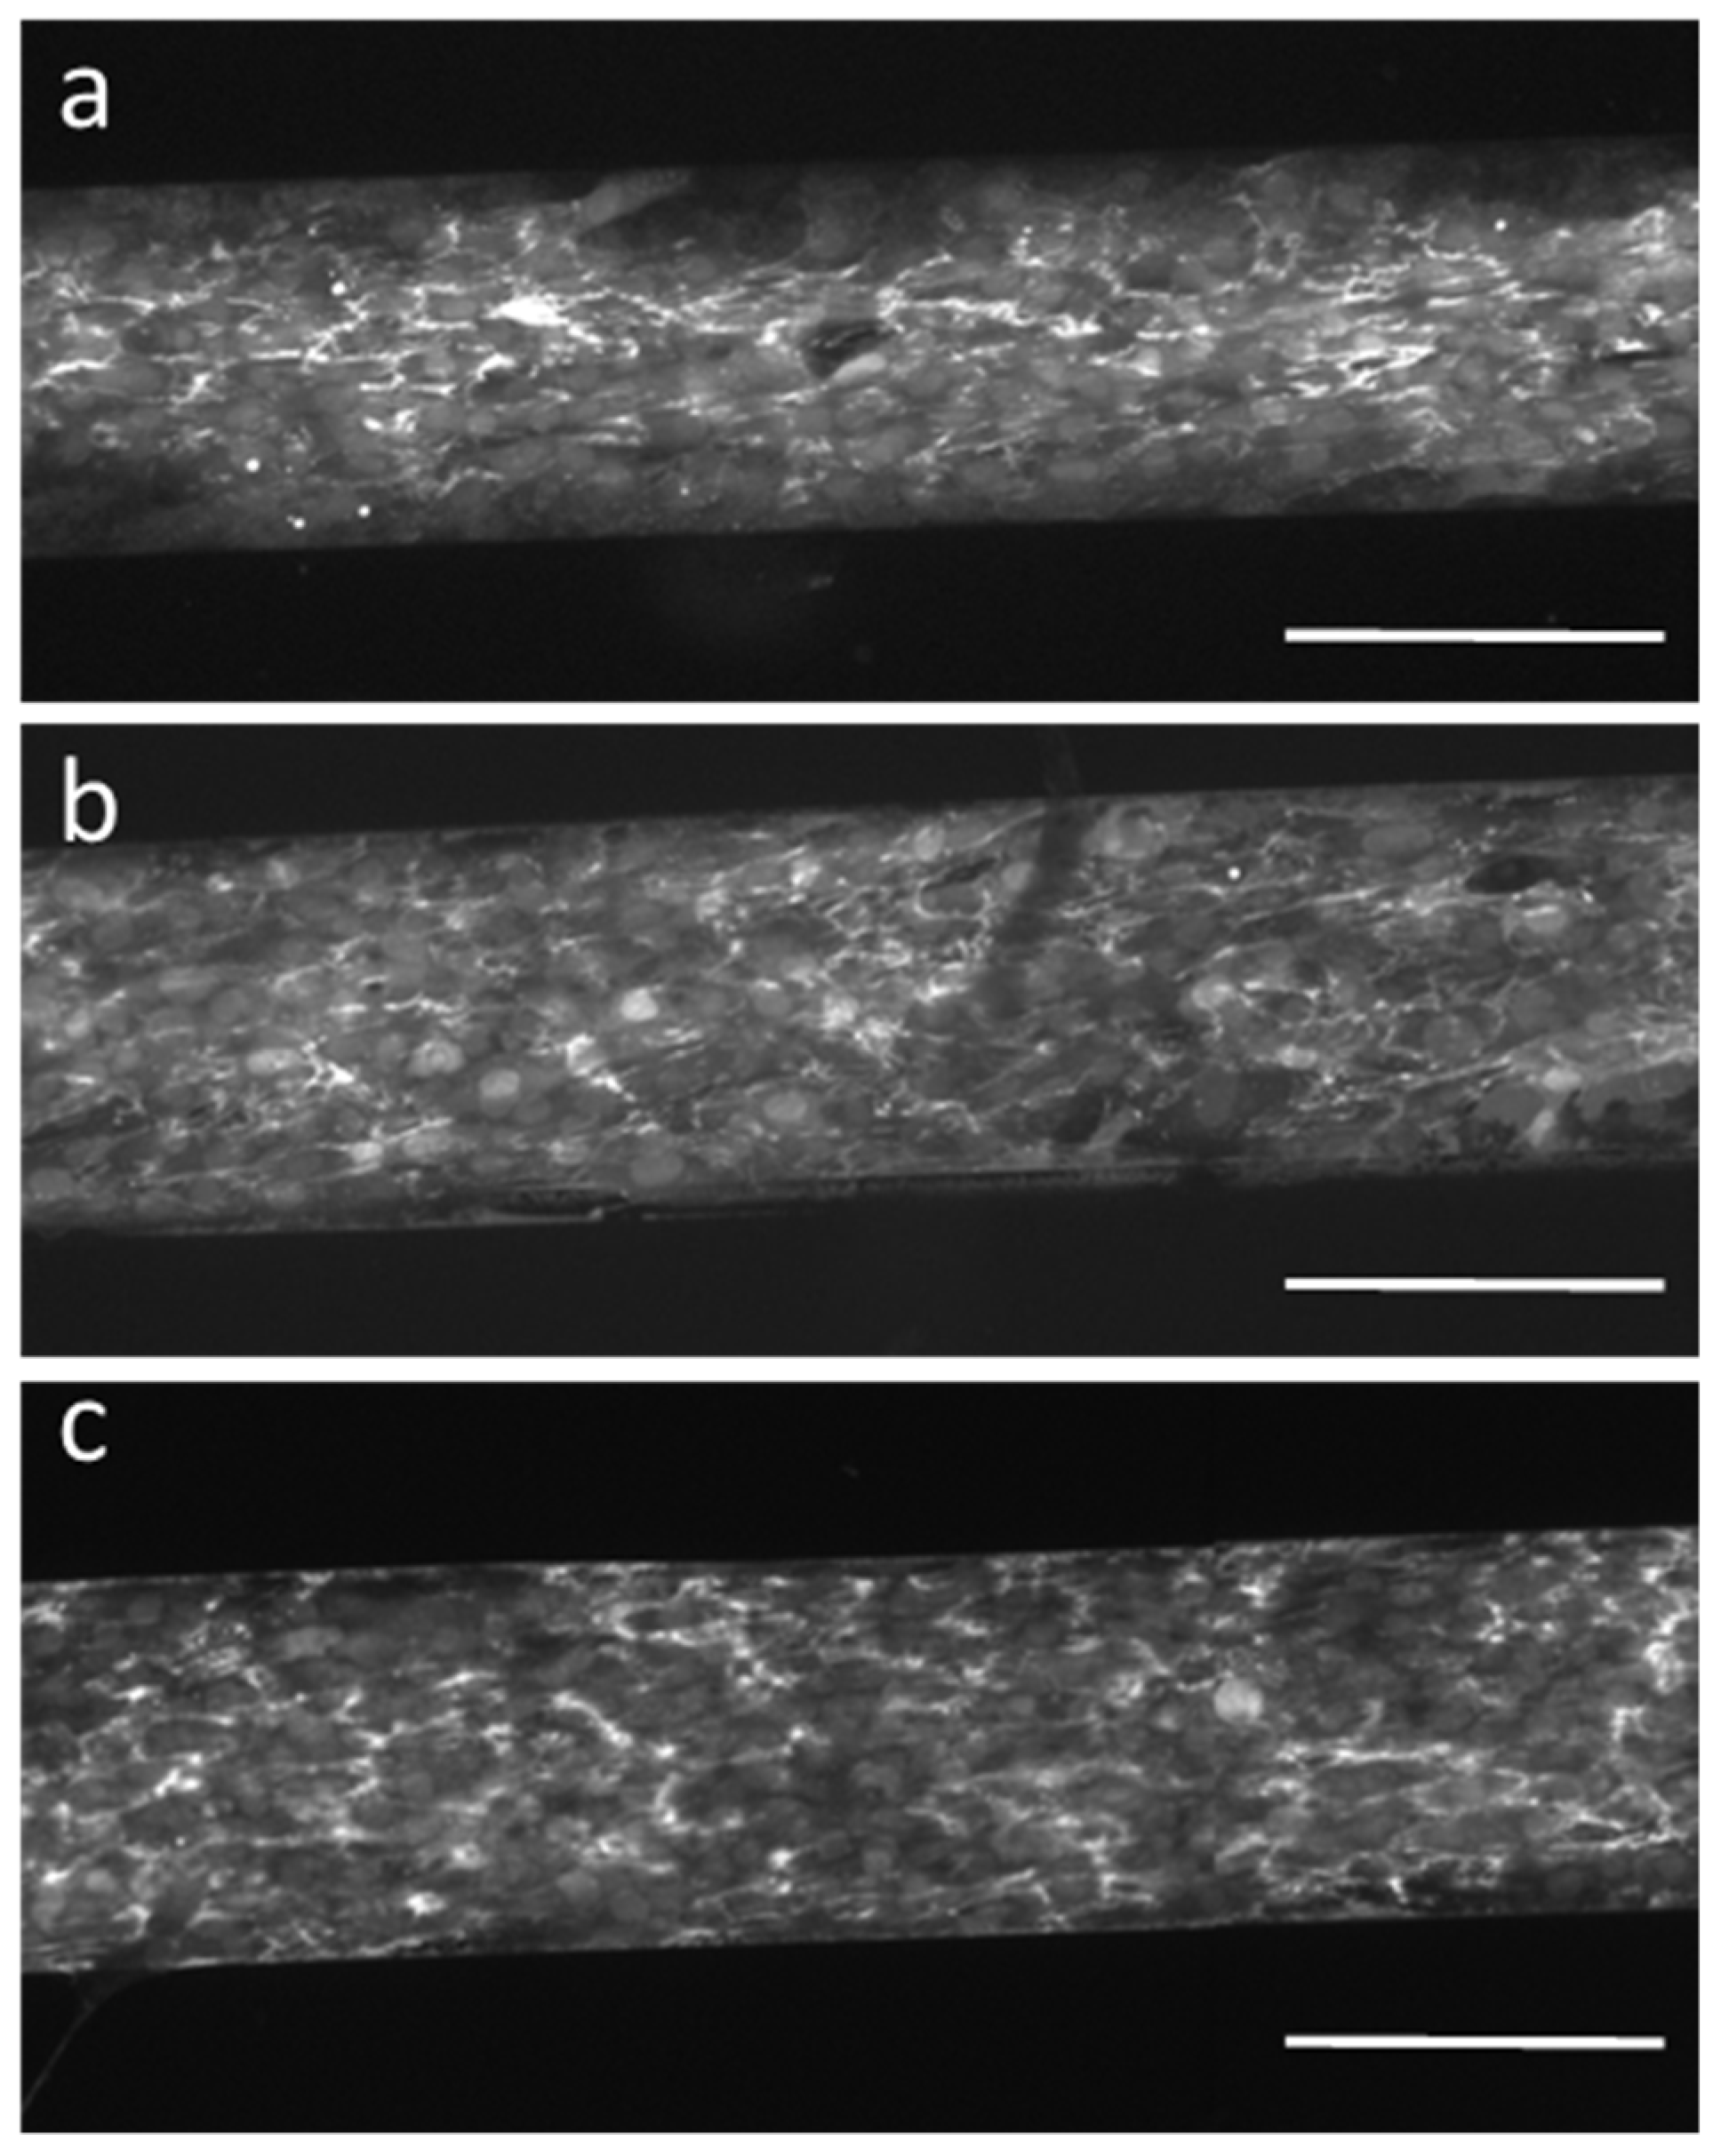
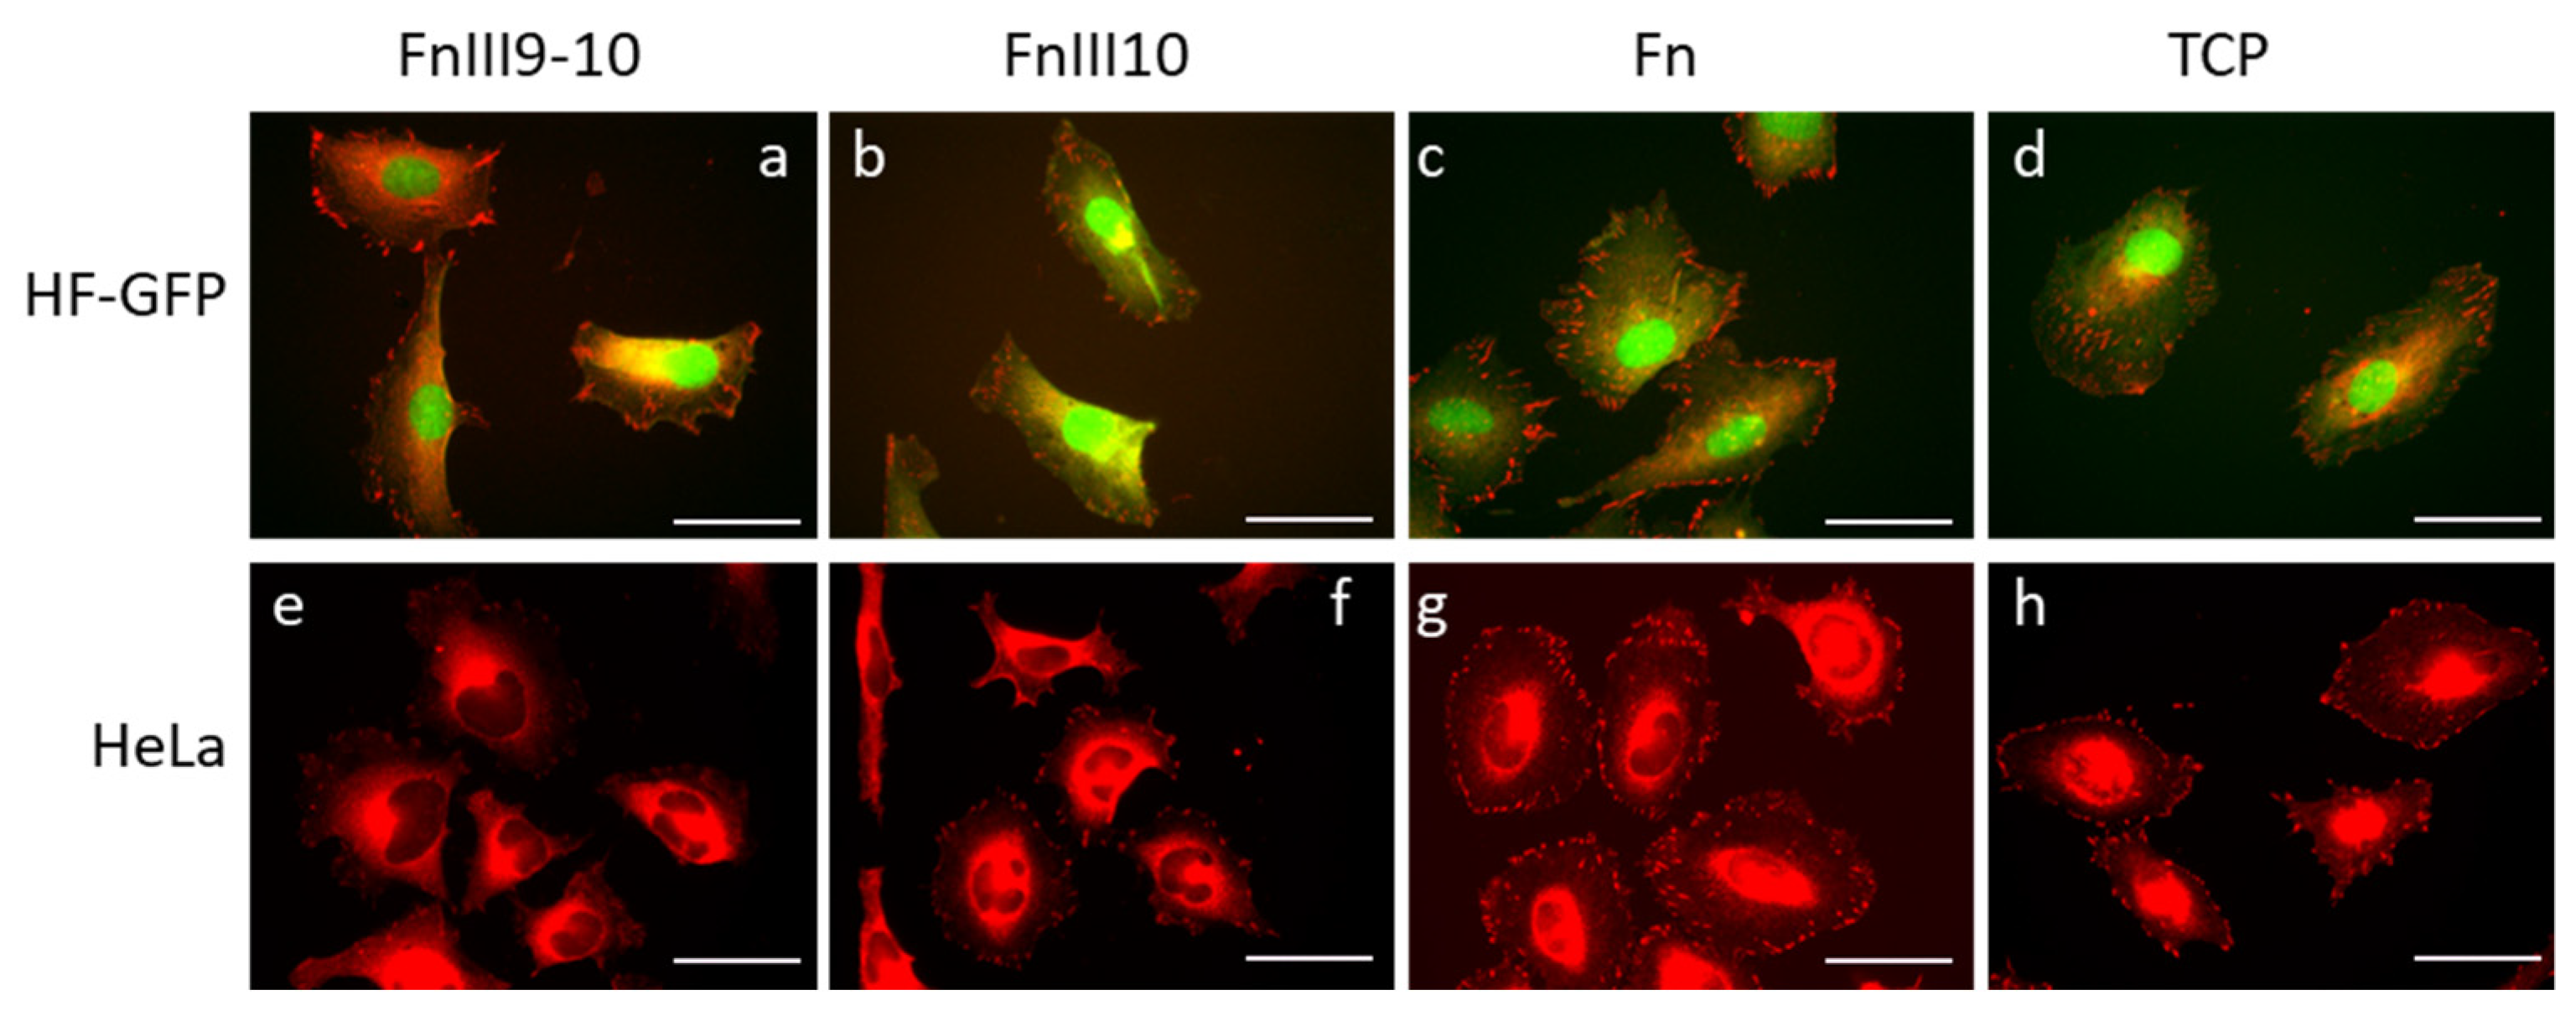
We estimated single-cell adhesion behavior by carrying out fluorescence microscopy of individual HF-GFP and HeLa cells, respectively. We fixed the cells after 24 h and immunostained them for vinculin (the red signal channel).
Figure 3 shows representative epifluorescence microscopy images of selected Fn fragment/protein zones containing adherent cells. We used the same images also for the statistical analysis of the mean values of the cell area, cell shape index and focal adhesion area (see text below).
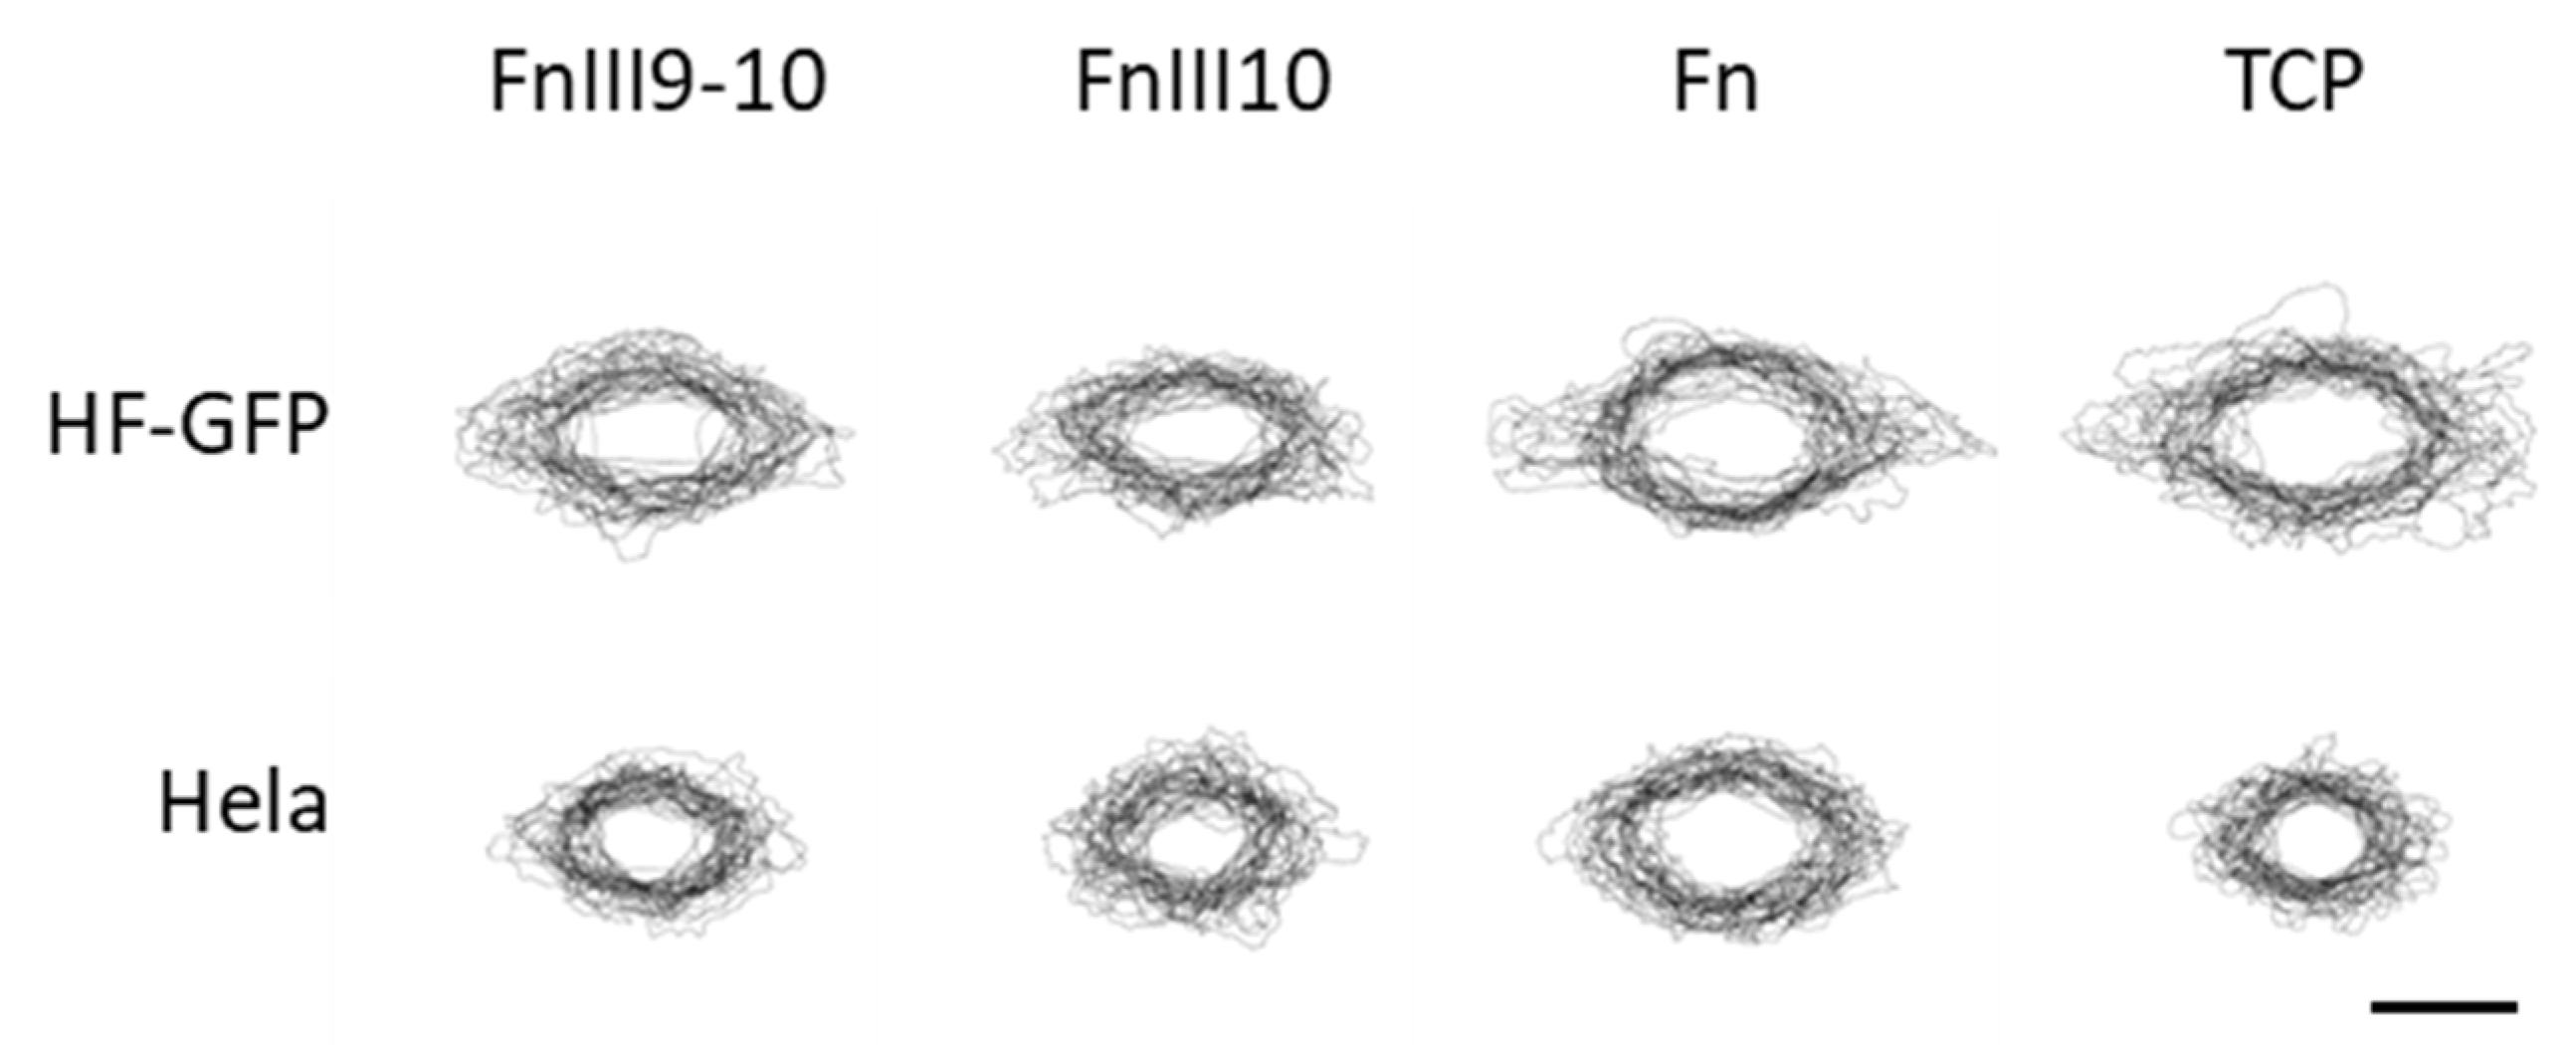
We determined the cell shape and focal adhesion area from the fluorescence microscopy images and analyzed the data by standard image processing. For this purpose, we repositioned the cell images placing a cell in the center of the image and rotating it to align the cell axis horizontally.
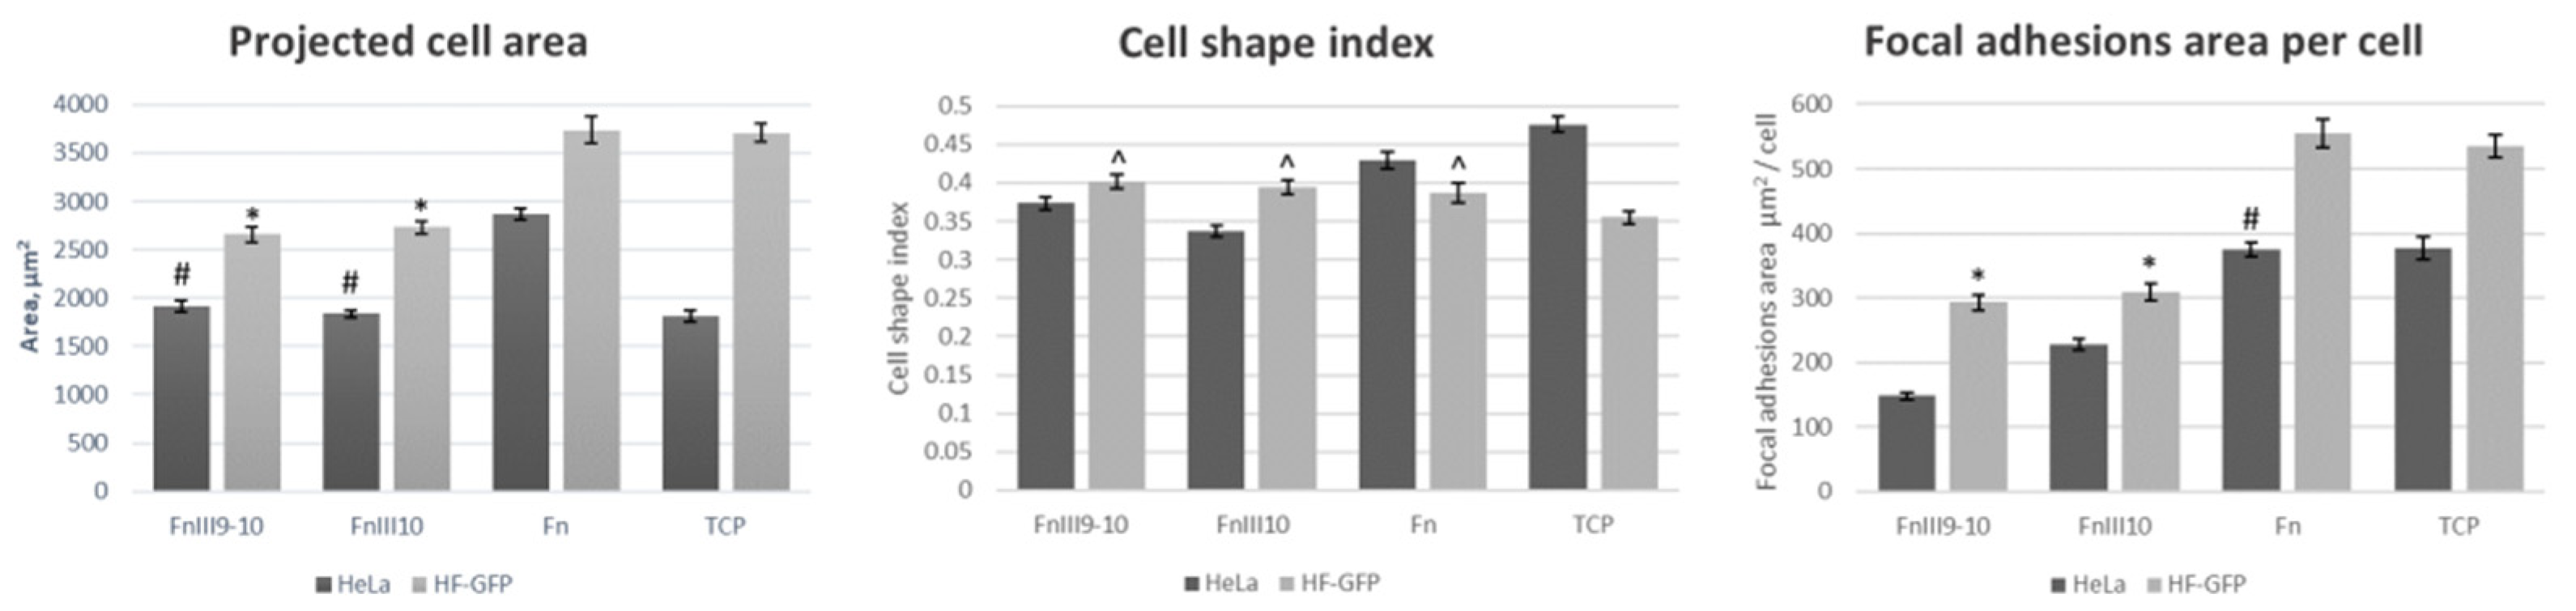
Figure 4 shows the overlays of the contours of 30 randomly selected HF-GFP and HeLa cells on the biochip surface and tissue culture plate (TCP).
Further on,
Figure 5 shows the summary of the performed statistical analysis. The adhesion behavior of HF-GFP on the FnIII9-10 and FnIII10 surfaces was rather similar and did not present any statistically significant differences. The values for the area of the HF-GFP, cell shape index and area of the cell adhesion were around 3000 µm
2, 0.4 and 300 µm
2, respectively. We could state that HF-GFP cells on the Fn surface and TCP plate presented similar adhesion behavior in terms of the cell area and adhesion zone area, respectively, with the cell area being around 3700 µm
2 and a focal adhesion area of around 550 µm
2. The cell shape index was similar for the cells on all protein/fragment surfaces, but statistically different from TCP.
Similar to fibroblasts, the adhesion behavior of the HeLa cells on FnIII9-10 and FnIII10 was statistically similar. HeLa on the Fn surfaces had more than 1.5 times larger cell and adhesion areas, respectively. The cell shape index increased from 0.37 and 0.34 for FnIII9-10 and FnIII10, respectively, and to 0.43 for Fn. The HeLa cells on TCP displayed an intermediate behavior, and the cell area was closer to cells on FnIII9-10 and FnIII10. However, the cell shape index and area of the adhesion were closer to the cells on Fn.
3.3. Proliferation
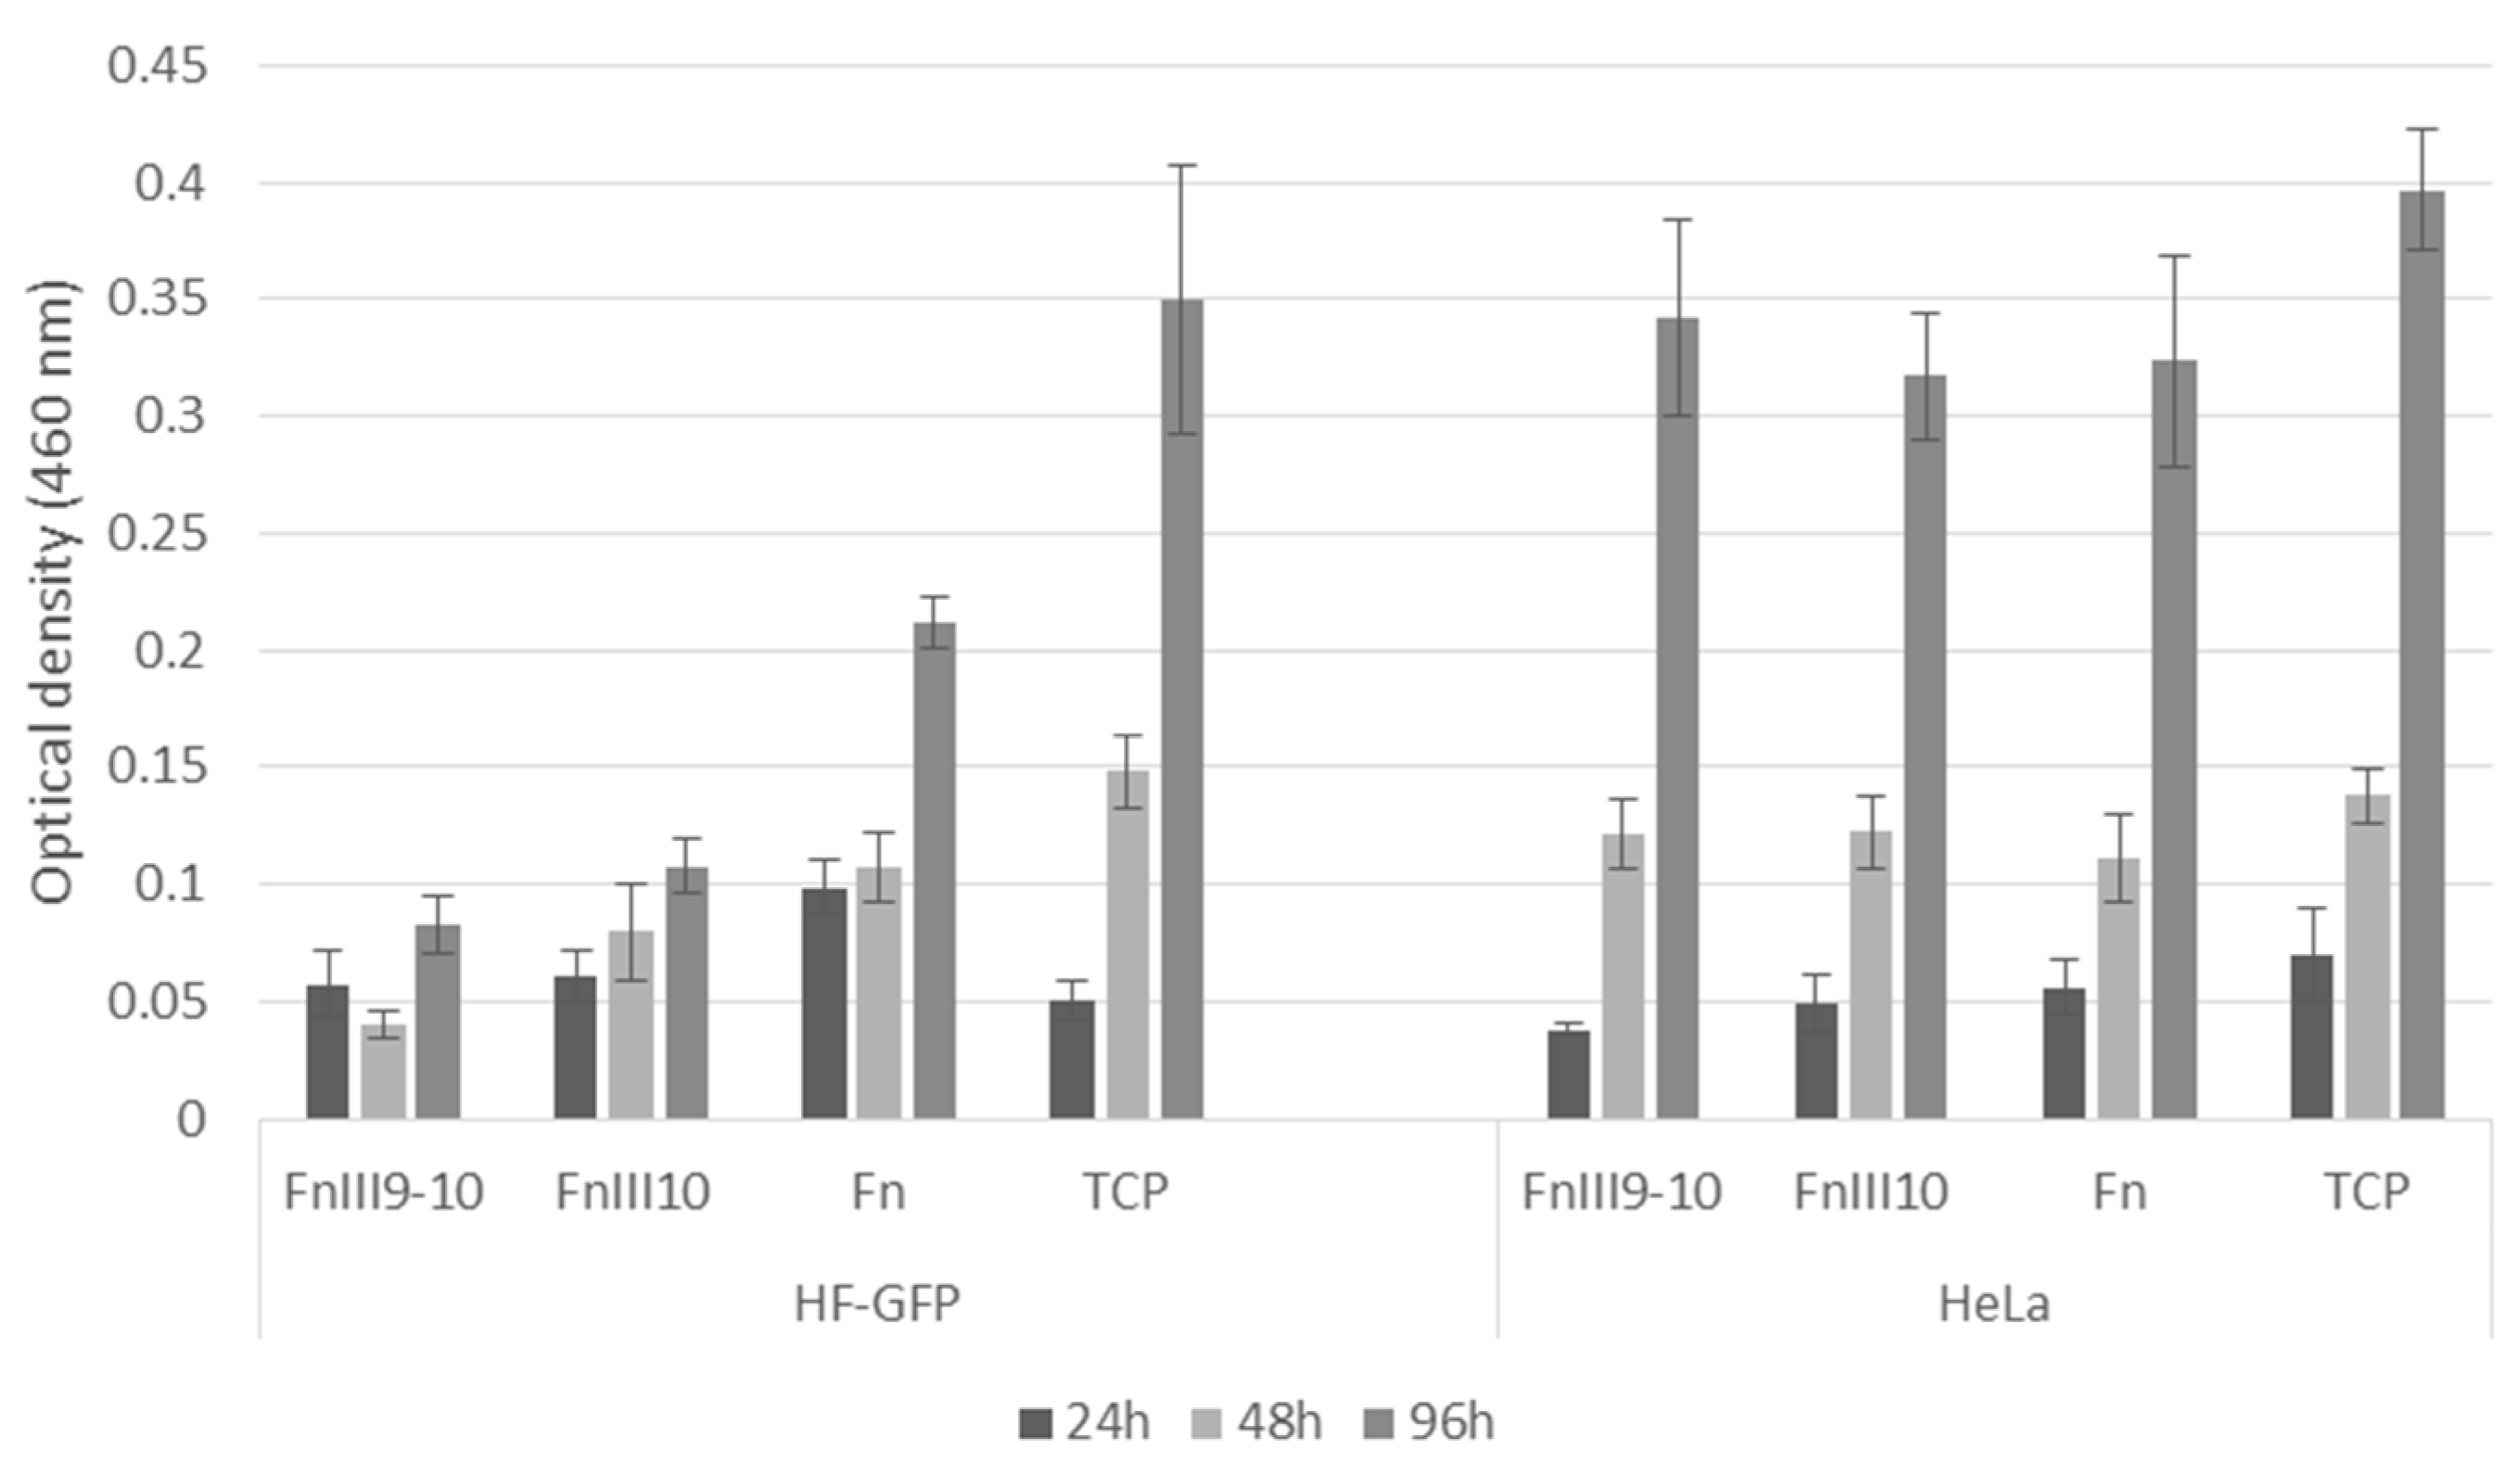
To estimate cell proliferation, we employed the CCK-8 assay (
Figure 6). Again, HF-GFP proliferation on the FnIII9-10 and FnIII10 surfaces was similar, at least with the selected period of 96 h. Notably, the HF-GFP cells on the Fn surfaces proliferated faster, and at 96 h, the optical density (OD) value was 2–2.5 times higher than in the case of FnIII9-10 and FnIII10. The cells on the TCP plate had the largest area to proliferate, and this could explain the observed highest OD value at 96 h.
Contrary to the HF-GFP culture, the HeLa cells within the error range showed a similar proliferation rate on all types of surfaces and TCP plates within the course of the experiment. This result suggests that cytotoxicity effects due to the potential presence of the pyrogenic lipopolysaccharide (LPS) impurities of the FnIII9-10 and FnIII10 surfaces were unlikely. Previously, Hao et al. reported LPS-mediated stimulation of HeLa cell proliferation [
27]. However, in our cell cultures, we observed statistically similar proliferation behavior on both the commercial Fn-made and recombinant FnIII9-10 and FnIII10 surfaces.
3.4. Secretion of Fibronectin
Finally, we verified the functional activity of the adherent cells by analyzing the secretion of fibronectin during proliferation on the different biochip surfaces. After one week, despite the above-mentioned differences in proliferation, confluent cell layers formed on all protein/fragment surfaces. We fixed the HF-GFP cells and immunostained them for the full-length fibronectin. We could detect fibronectin secretion by HF-GFP cells on all biochip surfaces (
Figure 7), which indicates that the cells preserved their basic function. At the same time, we could observe no fibronectin bound to the bare PEG MA zones of the biochip surfaces, again confirming the excellent cell-/protein-repellent properties of this hydrogel coating serving as a substrate for protein/fragment immobilization [
17].
5. Conclusions
To conclude, we have shown that engineered Fn fragments can be used in prototyping biochip surfaces by microcontact printing, a process that yields densely packed, homogenous and stable layers, as proved by several surface analysis techniques. We found that the FnIII9-10- and FnIII10-modified PEG MA hydrogel surfaces were stable in HF-GFP and HeLa cultures for at least 96 h. The HF-GFP cells displayed lower cell and focal adhesion areas, respectively, as well as lower proliferation rates on the Fn fragment surfaces as compared to the immobilized full-length Fn. The observed interaction differences could be either related to the differences in the preferential integrin engagement or to the molecular conformation differences of the surface-pinned fragments. Despite of that, we could confirm the secretion of Fn by the adherent HF-GFP cells both on the Fn fragment and full-length Fn coatings.
Future studies could employ amino acid residue replacement and different chemical conjugation approaches to obtain biochip surfaces with oriented immobilization of FnIII9-10 and FnIII10 proteins. Additionally, it would be useful to introduce post-translational modifications to FnIII9-10 and FnIII10 by selecting a different protein expression system. Finally, we plan to explore the Fn, FnIII9-10 and FnIII10 biochip surfaces as a strategy to stimulate specific cellular responses by differential engagement of integrins.
Our present study is a step toward the development of stable biochip surface architectures with well-controlled biomolecular composition and physicochemical characteristics. More complex cell–cell and cell–ECM interaction analysis in the high-throughput, high-content mode can be designed in the future by employing the combined biochip and engineered protein fragment platform, e.g., by designing combinations of the fragments, printing fragment gradients and introducing geometrical/mechanobiological cues [
16].


 ,
, 


