Article

Absorption Enhancement in a Quantum Dot Thz Detector with a Metal-Semiconductor-Metal Structure

1
School of Physics and Electronic Science, Shanxi Datong University, Datong 037009, China
2
Institute of Modern Optics, Nankai University, Tianjin 300350, China
3
Department of Applied Physics, East China Jiaotong University, Nanchang 330013, China
4
School of Integrated Circuits and Electronics, Beijing Institute of Technology, Beijing 100081, China
5
Terahertz Technology (Datong) Institute, Datong 037009, China
6
Department of Physics, Capital Normal University, Beijing 100048, China
*
Authors to whom correspondence should be addressed.
Coatings 2022, 12(7), 874; https://doi.org/10.3390/coatings12070874
Submission received: 17 April 2022 / Revised: 6 June 2022 / Accepted: 17 June 2022 / Published: 21 June 2022
(This article belongs to the Topic Optical and Optoelectronic Materials and Applications)

Abstract

:
The low absorptivity of quantum dot nano-structures cannot meet the requirements for high-performance next-generation Thz detectors which can be used for environmental pollution detection. In this study, a novel metal-semiconductor-metal (MSM) cavity structure with a square hole array instead of a traditional planar metal electrode was developed to improve and enhance the absorptivity of a quantum dot Thz detector. The possible modes and loss problems in the metal resonant cavity were analyzed using the finite-element transmission matrix, the eigenvector method, and Kirchhoff diffraction theory. The results demonstrate that the MSM cavity structure introduced in the detector can enhance absorption up to 8.666 times higher than that of the conventional counterpart.

1. Introduction

In recent years, quantum dot detectors have shown favorable characteristics, such as low dark current, high responsivity, and high detectivity due to the unique three-dimensional constrained quantum dot nano-structure in the detection application of the environmental pollution, protection, and they have gained more attention [1,2]. Although highly efficient and miniatured quantum dot detectors can be achieved, reports pointed out that quantum dot detectors could suffer inhomogeneous size distribution and non-optimized energy bands [3,4], which can lead to a reduction in absorption rate and sensitivity of the detectors. To solve these issues, several methods have been developed to enhance the absorption performance of quantum dot detectors, such as the structural control [5,6] grating anti-reflection [7], and resonant cavity method [8,9]. Among these methods, the structure control method is considered the most desirable as in this method it is simple and easy to control the performance of the detector by adjusting only the thickness of the barrier and quantum dot cap layers. However, it can only slightly improve the absorption efficiency of the detector as it is limited by its structural parameters. The grating anti-reflection method is based on the principle of optical film anti-reflection, where an anti-reflection grating is placed on the top of the quantum dot detector. Thus, more incident light can enter into the detector for photoelectric conversion. However, due to the diffraction bottleneck, its effect on the penetration of incident light is limited, which cannot satisfactorily meet the application requirements. The cavity method enhances absorption by placing two mirrors at the top and bottom of the absorption region in the detector, which allows incident light to be reflected multiple times between these two mirrors. Although this method is more complicated than the other two methods, the effective performance improvement is evident that many scientists have begun to pay attention to. In 2007, Attaluri et al. used a semiconductor GaAs/Al0.98Ga0.02As Bragg mirror to form a resonant cavity to improve the performance of an InAs/In0.5Ga0.85As quantum dot detector. Its quantum efficiency was enhanced by 10% and 1.25% at 9.5 and 10 μm of the light wavelength [10], respectively. In 2013, Negi et al. used the Kronig–Penney model to calculate the photocurrent responsivity of a quantum dot detector with a resonant cavity structure [11]. It was found that resonant cavity structure is not only realized using semiconductors but with metals as well. In 2015, researchers in the Shanghai Institute of Technical Physics of the Chinese Academy of Sciences studied the performance enhancement effect of metal films and metal strips as resonator structures in quantum dot detectors [12]. In 2017, Choi of the United States also made a similar discussion on resonant cavity structure for detectors [13]. In 2020 and 2021, Roelli, Chen, and his workers studies the up conversion of Thz light by a plasmonic nanocavity [14,15]. These researchers studied the influences of the resonant cavity on the absorption of quantum dot detectors and reported the corresponding enhancement, which was approximately 1.25 times. However, there was no detailed analysis about the resonance mode and resonance loss, which are key factors affecting the absorption coefficient and quantum efficiency of quantum dot detectors. In addition, the enhancement was too small to be satisfactory. In this contribution, the resonant modes and loss problem of a quantum dot detector with a metal-semiconductor-metal (MSM) resonator structure were studied using the eigenvector method and surface plasmon theory. In this study, the detector obtained the enhanced absorption which is 8.666 times higher than that of the conventional detector. Moreover, the influence of the MSM structure parameters on the detector performance was systematically investigated, which can provide a reliable theoretical basis and technical guidance for structural optimization and performance enhancement of quantum dot detectors. It is believed that the results of this study could provide a new insight into the development of Thz detectors.

2. Theoretical Model

The mathematical model and calculation method, which were based on the structure of the quantum dot detector with the designed MSM cavity, are discussed in this section.

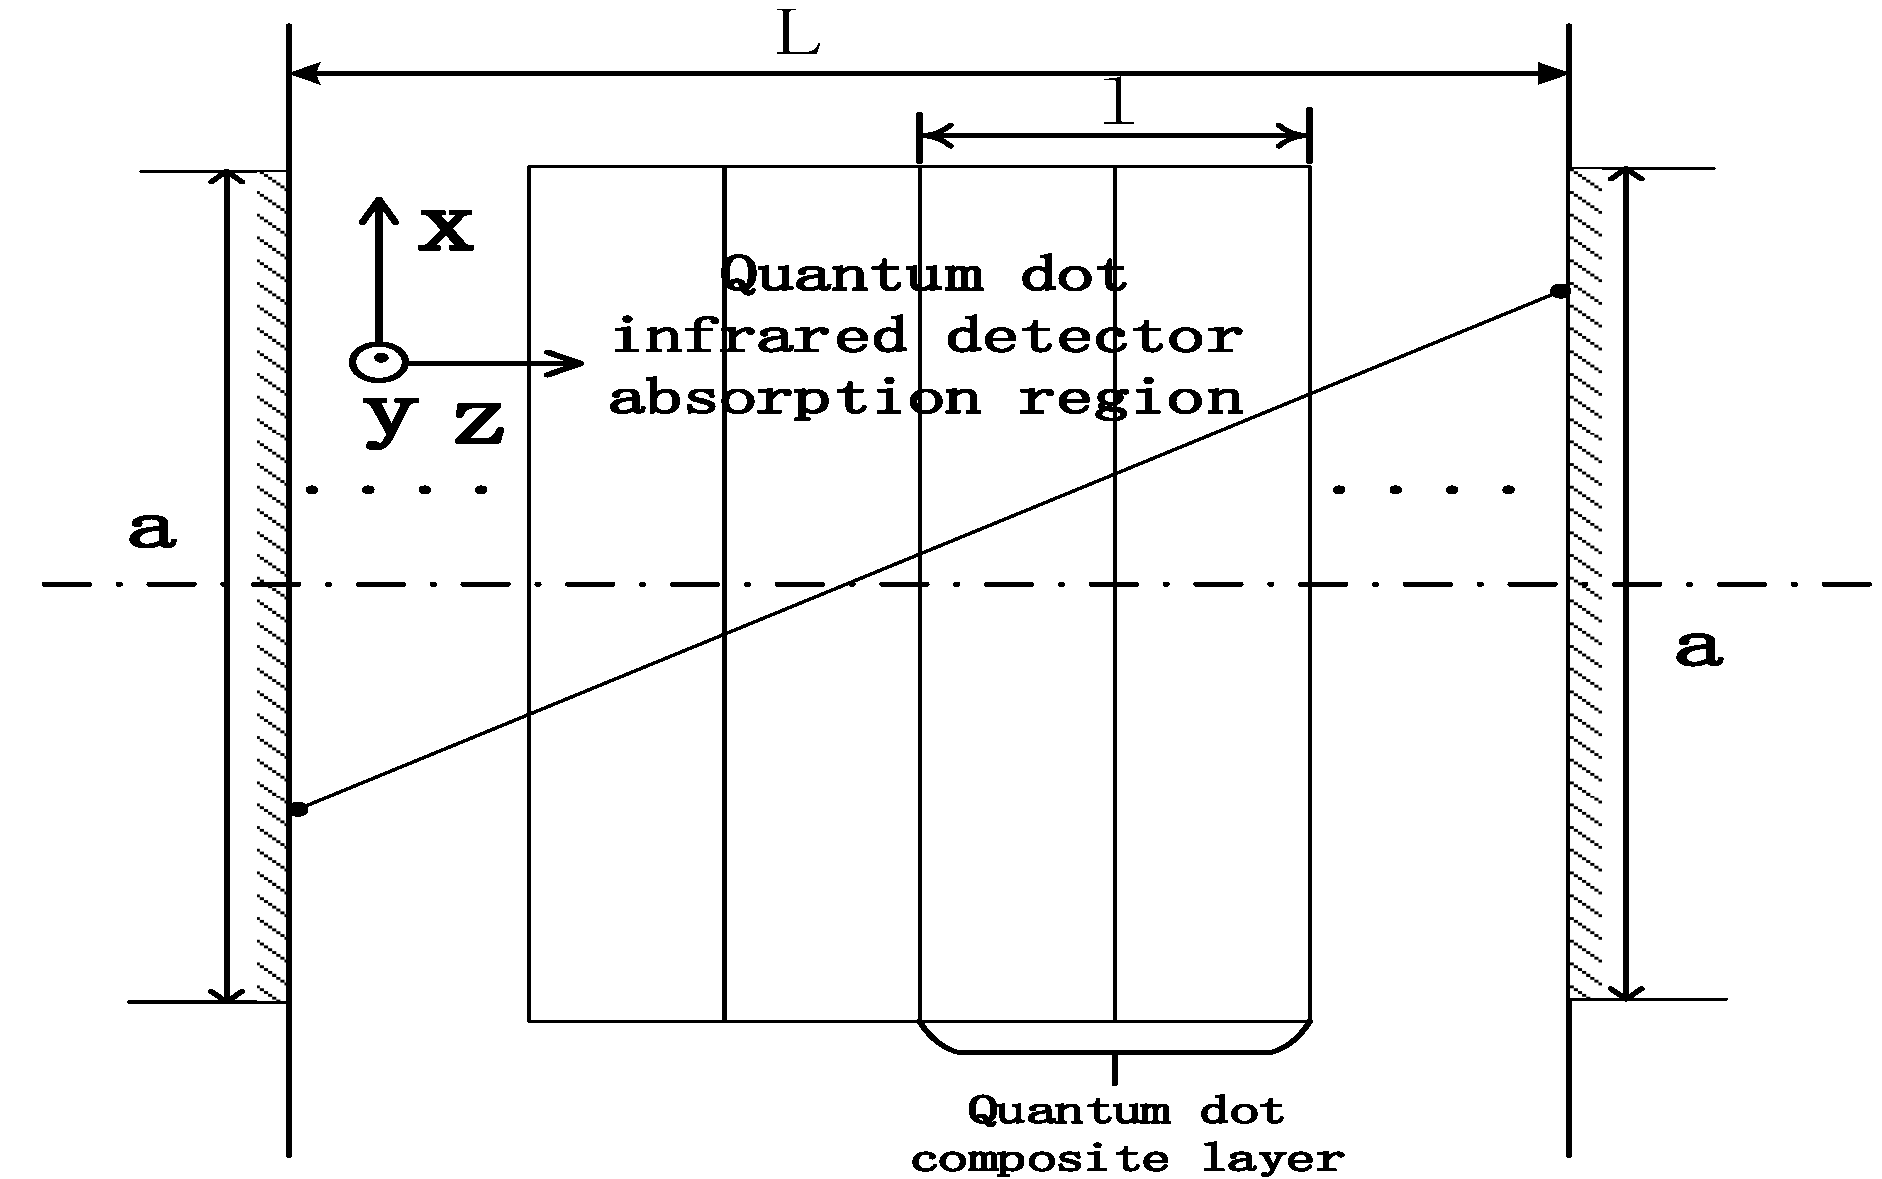
2.1. Detector Structure

Conventional quantum dot detectors are mainly composed of several periodic quantum dot composite layers. The quantum dot detector with an MSM structure can be constructed by placing a metal square hole array and a metal reflective layer at its top end and bottom end layers, respectively. As shown in Figure 1 that the top of the quantum dot detector with the MSM structure is a uniform square holes metal layer. Below the metal square hole grating layer is the quantum dot absorption region (the same as the conventional quantum dot detectors under the ignoring the electrodes), which was composed of a top contact layer, several quantum dot composite layers, and a bottom contact layer. Finally, the bottom metal reflecting layer was placed below the absorption region of the quantum dot, which formed the resonant cavity together with a metal hole array layer at the top. In the quantum dot region, the quantum dot composite layer was composed of a quantum dot layer and a barrier layer, which were arranged alternately. The quantum dot and barrier layers in the quantum dot composite layer were made of GaAs and InGaAs, respectively [16,17,18]. The GaAs quantum dot was a blue conical shape body with a height of 10 nm or less, and the dimension of its base was within 100 nm. It is assumed that the detector contained 10 periods of the composite layers in this study, and each composite layer was 31.5–61.6 nm in thickness. Then, the length of the entire detector with the MSM structure, including the two metal layers and the quantum dot absorption region, was approximately 380–580 nm, here the cavity length L is defined as the distance from the surface below the top metal grating to the surface upon the bottom metal layer which does not include the thickness of the top metal grating (20 nm) and that of the bottom metal layer (60 nm). The radius of the bottom and the top circular metal layers ranged from 100–500 nm, which is named the linewidth of the resonate cavity. According to the dispersion relations and surface plasmon theory [19,20], the period of the metal square hole array at the top of the detector was set as 37.59–209.82 µm. When an incident light (484~2693 μm) is incident from the metal square hole array to the lower quantum dot absorption region, a surface plasmon can be formed at the interface between the metal array and the lower quantum dot absorption region. The wavelength range of the coupling-enhanced light was 135–735 µm. The coupled enhanced light entered the lower quantum dot absorption region for absorption, and the other unabsorbed light transmitted through from the absorption region, was reflected by the underlying metal layer, which again entered the quantum dot absorption region for secondary absorption. Then, similar to the transmission above, the part of the reflected light was absorbed, and part of it was transmitted through the absorption region reflected and reached the top metal array layer for reflection. The rest of the light went for another cycle several times which enhanced the absorption and formed the resonance mode of the incident light at the same time.

2.2. MSM Resonant Cavity Theory

As described above, when the light was incident perpendicular to the quantum dot detector with the MSM structure, the coupling of enhanced light was reflected multiple times to form a resonance. Similar to a laser cavity [21], the light field in the metal cavity can also form a stable mode, which leads to a much higher absorptivity of the MSM structure quantum dot detector than the traditional quantum dot detector. To determine the resonance mode in the MSM quantum dot detector and its enhancement effect on absorption, a transition integral equation was established and the field distribution was calculated using the finite-element eigenvector method. Thus, combining with the optical field transition integral equation on basis of the Fresnel-Kirchhoff diffraction principle, the transmission matrix eigenvector method was used to solve the optical field in the MSM metal resonator, the stable light field mode and its enhanced absorption of the detector with MSM structure could be calculated. The performance of the quantum dot detector with the MSM resonator structure in comparison with the conventional quantum dot detector without a metal cavity structure is also presented in this paper.
In the quantum dot detector with the MSM structure, the top and bottom metal layers are like two mirrors, which make the light coupled into the quantum dots absorption region through the top metal square hole array grating be continuously reflected between the two metal layers to reemit. The continuous reflections are the reemission of the light below the top metal grating and the bottom metal layer in fact [22,23], and it not only resulted in the formation of a stable field distribution in the detector with MSM resonator structure, which is called “self-reproduction mode”; more importantly, the quantum dot region can repeatedly absorb the incident light, furthermore leading to higher performance. What exactly is this case? There is a need to analyze the light field distribution inside the cavity formed by the upper and lower metal layers in the quantum dot detector by the Kirchhoff diffraction and transfer matrix eigenvector methods. Specifically, the solution of the light field distribution can be briefly summarized into four steps. Firstly, the metal reflection layer was divided. Then, based on the diffraction integral equation and the field value relationship, the transmission matrix was established. Then the eigenvector and eigenvalues of the matrix were calculated, and the resonance mode and round-trip loss in the cavity were obtained [21,24].
As Figure 1 shown above that the circular cavity in our quantum dot detector belongs to the symmetric coaxial spherical mirror cavity, and based on this structure, the two rectangular coordinates are established. Specifically, as Figure 2 shown, the surface of the top metal holes grating layer is put at the left, and that of the bottom metal layer is at the right, they respectively built the x O y and x O y surfaces with the optical axis direction as the z-axis. As well, the circular planar mirror cavity has a cavity length, and the linearity of the top metal reflective layer a 1 , and the linearity of the bottom metal reflective layer a 2 . In general, a 1 = a 2 . Assuming that a light field u 0 ( x , y ) starts from the left metal reflective layer, penetrates through the quantum dot region having a length l , and get to the bottom metal reflective layer, which will have the light field distribution u 0 ( x , y ) . The transmission process will obey Kirchhoff diffraction law, thus after j passes, the distribution of the field tends to be stable [21]. This process can be described by the stable light field and the eigenvector and eigenvalue of a matrix.
To be concreted, the left and right metal surfaces are firstly divided into Q , P units along the x and y directions, respectively, so that the corresponding matrices u 1 n and u 2 n are respectively shown as:
u 1 n = [ u 1 [ 1 ] , u 1 [ 2 ] , u 1 [ Q ] ] T
u 2 n = [ u 2 [ 1 ] , u 2 [ 2 ] , u 2 [ P ] ] T
The light field distribution of every unit in u 2 should be the sum of the light fields from all the divided units in u 1 . Once Q , P are sufficiently large, u 1 [ m ] and u 2 [ n ] will be independent of the integral variable; thus, a unit in u 2 can be written as
u 2 [ p ] = q = 1 Q A [ p , q ] u 1 [ q ]
where A   [ p , q ] is determined by Kirchhoff diffraction under the condition of the paraxial approximation, and it corresponds to the transmission from the top metal grating to the bottom metal layer, which includes the reflection upon the bottom metal layer, and it can be written as:
A [ p , q ] = r 1 ( i L λ ) e i k L S Q e i k [ ( x x ) 2 2 L + ( y y ) 2 2 L ] d S Q
where r 1 is the reflectivity upon the bottom metal layer, which is called as the reflectivity of the bottom metal layer.
Equation (4) can be extended by matrix multiplication, which can be shown as:
[ u 2 [ 1 ] u 2 [ 2 ] u 2 [ P ] ] = [ A [ 1 , 1 ] A [ 1 , 2 ] A [ 1 , Q ] A [ 2 , 1 ] A [ 2 , 2 ] A [ 2 , Q ] A [ P , 1 ] A [ P , 1 ] A [ P , Q ] ] · [ u 1 [ 1 ] u 1 [ 2 ] u 1 [ Q ] ]
Thus, u 2 = A u 1 . Similarly, when crossing from the right metal surface (corresponding to the bottom metal layer) to the left metal surface (the top metal grating layer), u 1 = B u 2 , and B is the transmission matrix, and is similar to A . Here, since the squares holes in the top metal grating layer has the transmission of the light in cavity, the transmission matrix B from the bottom metal grating to the top metal layer, which includes the reemission below the top metal grating layer, which can be written as:
B [ p , q ] = r 2 ( 1 d c ) ( i L λ ) e i k L S Q e i k [ ( x x ) 2 2 L + ( y y ) 2 2 L ] d S Q
where, r 2 denotes the reflectivity of the bottom metal reflective layer, which means the energy loss ratio reflected by the bottom metal layer one time, d c is the duty cycle of the top metal reflective layer, r 2 ( 1 d c ) is the energy loss ratio reflected by top metal grating one time.
Thus the transmission matrix corresponding to the round trip of incident light is can written as:
Q = B A
This transmission matrix is the final transmission matrix of the quantum dot detector with MSM resonator structure.
The number of discrete units Q and P are supposed as the same, the A and B are single-pass transmission matrices, the B A is the round-trip transmission matrices, respectively. Calculating the eigenvectors and eigenvalues of the matrix, the eigenvector u ( x , y ) and the complex constant γ satisfying the diffraction equation of the cavity, as well as the mode distribution in the cavity and the absorption of the photodetector can be obtained. Furthermore, the quantum efficiency of the detector can be calculated.
As well it is known that the quantum efficiency is defined as the ratio of the number of the electron-hole and that of the incident photo, and strongly depends on the reflection of the top of the detector and the absorption of the detector [25]. Hence the quantum efficiency of the detector can be written as:
η = ( 1 r ) [ 1 exp ( α 0 W ) ]
where α 0 W is the absorbtion coefficient of the detector, r is the reflection of the top of the detector, which equals to the reflectivity upon the top metal grating.
In summary, the key to the numerical method was to find the transmission matrix of the metal cavity. The finite-element eigenvector method did not need to be iterated many times, and the stable field distribution and eigenvalue could be directly obtained. The eigenvector containing possible stable light field modes and the specific modes of different orders could be obtained by extracting corresponding elements, and further the absorption and quantum efficiency of the quantum dot.

3. Results and Discussion

As mentioned above, when an incident light was directed perpendicular to the quantum dot detector with the MSM resonator structure, a surface plasmon polariton effect occurred at the interface of the top metal square hole array layer, which enhanced the light coupled into the quantum dot absorption region. Therefore, based on the surface plasmon theory [19], the wavelength range of the plasmon resonance of the metal square-hole periodic array interface was 135–750 µm, and the excitonic resonance-enhanced light reciprocated within the metal cavity to achieve enhanced detector absorption. Based on this, this section gives the enhancement in the absorption of the quantum dot detector with the MSM structure and the related reasons are discussed. Furthermore, the wavelength of the incident light, the width of the metal reflective layer, the cavity length of the metal resonance, the duty cycle of the square hole array, and the absorption coefficient of the quantum composite layer were calculated to analyze their influences on the absorption rate of the detector.

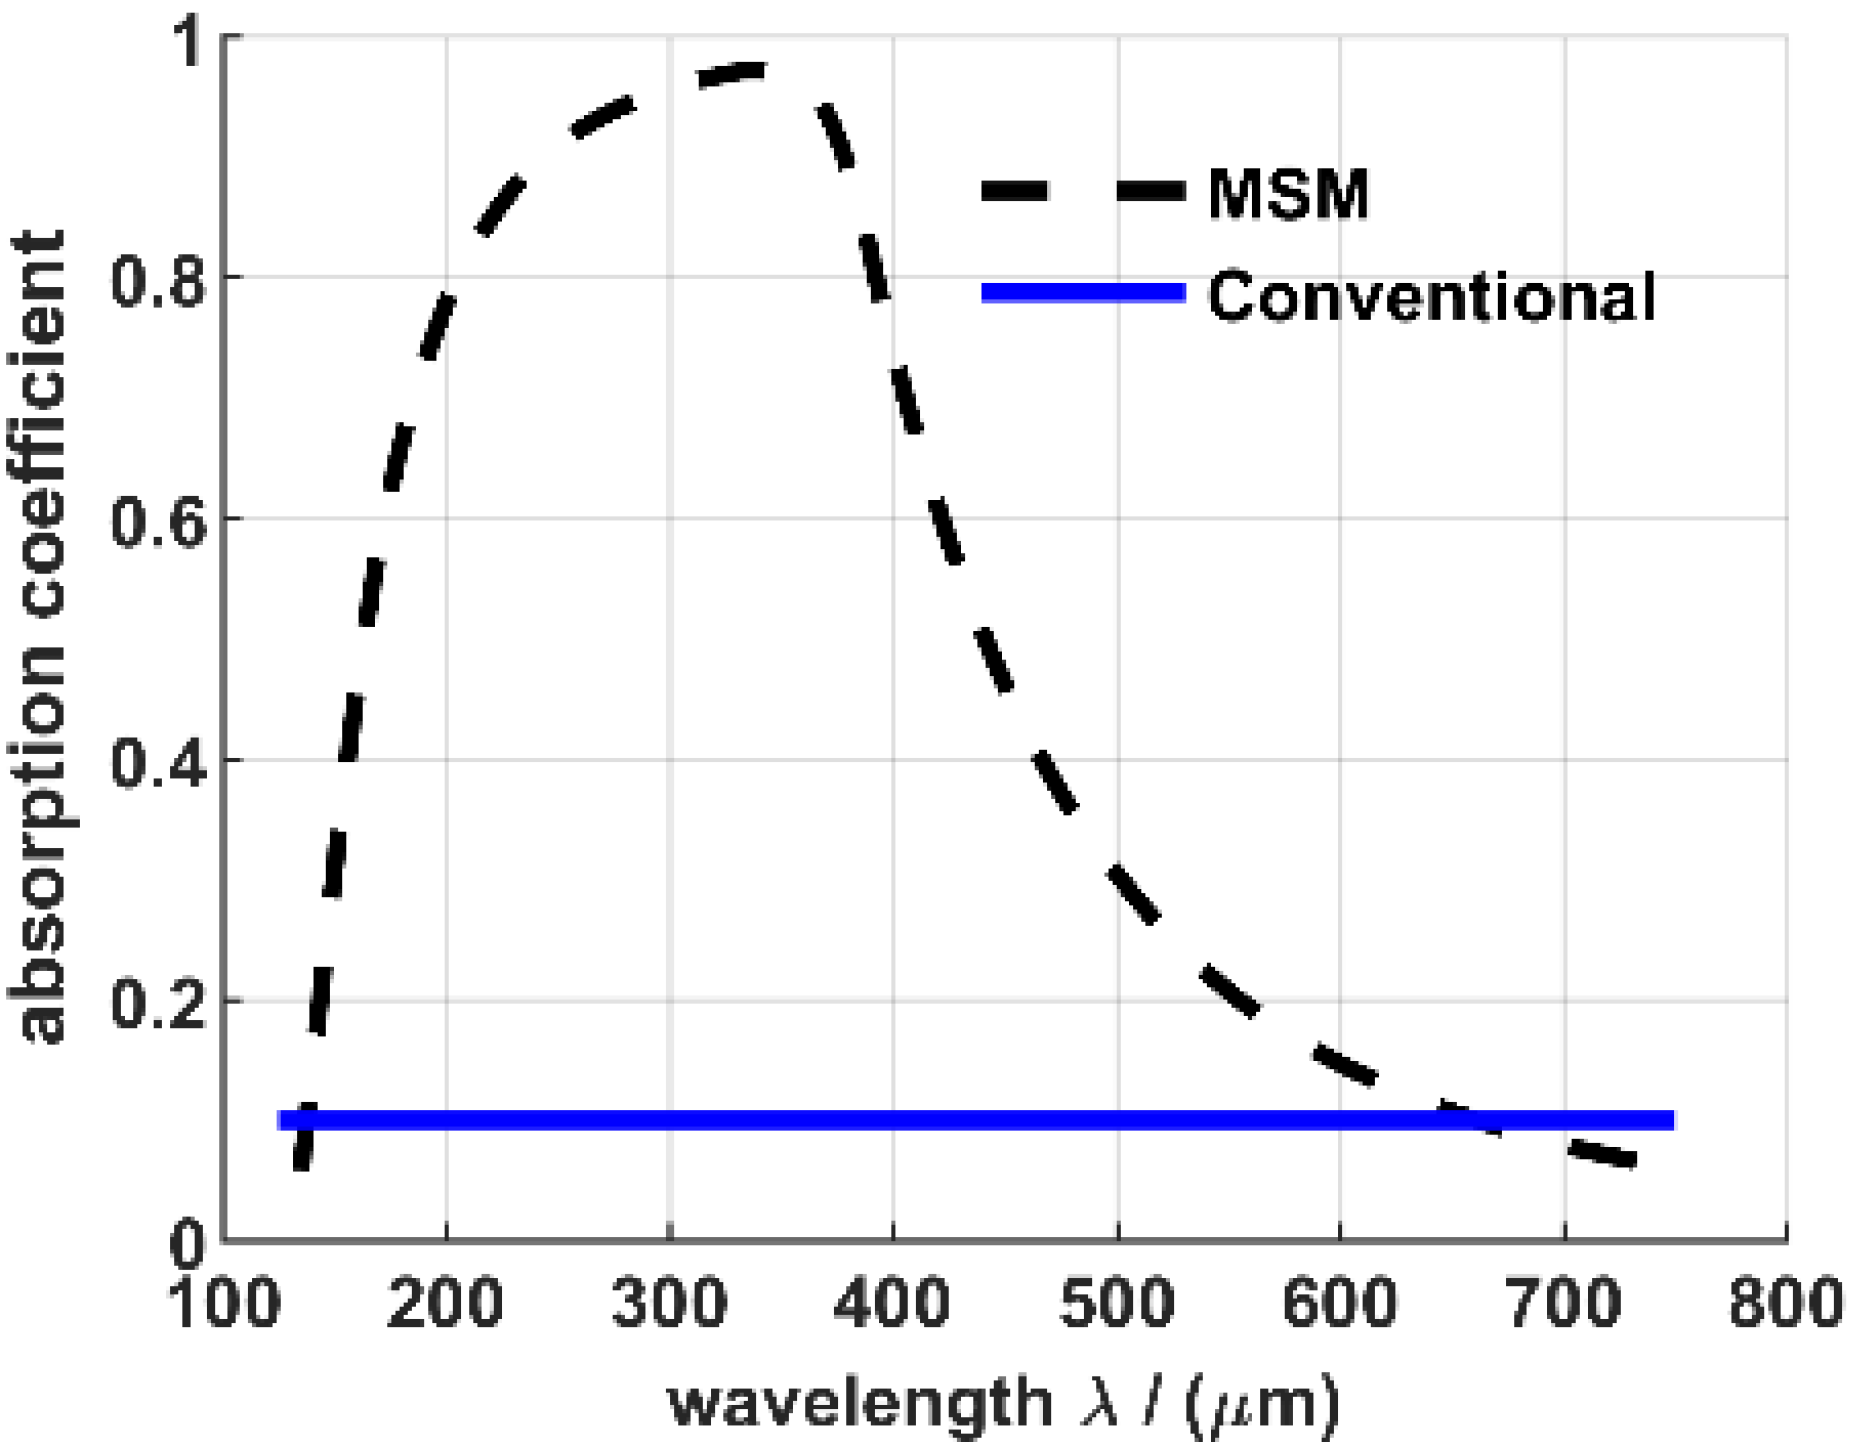
3.1. Enhanced Absorption Coefficient of Detector

When the incident light illuminates the quantum dots detector with MSM resonator structure, this detector can let light pass back and forth through the quantum dot region due to the reflection of the top and the bottom metal layer, which will lead to repeated absorption of the incident light. As a result, the absorption of the detector is enhanced, which will improve the other performances of the detector, such as quantum efficiency. Of course, it can be noted that there is a large energy loss due to the diffraction on the mirror metal surface of the cavity and the absorption of the quantum dot region, which has a negative effect on absorption. Hence, to clarify this enhancement, the absorptivity of the detector was calculated by comparing the loss of the metal cavity alone with the loss of the metal cavity including the quantum dot region (i.e., the quantum dot detector with MSM structure). The structural parameters of the quantum dot detector with the MSM structure were as follows: the cavity length was 1 . 5 × 10 - 6   m , the line width was 3 × 10 - 4   m , and the absorption coefficient of one-period quantum dot layer was 2 × 10 6   m 1 . Based on the mentioned values above, the fundamental transverse mode TEM00 was taken as an example to study the absorption of the detector as TEM00 has a uniform intensity distribution and is easy to analyze (the concrete field mode is discussed in Section 3.2).
As depicted in Figure 3, the curve “+” represents the energy loss of the metal cavity alone, that is, no elements (including the quantum dot layer) in the cavity. The curve “*” represents the total energy loss of the quantum dot detector with the MSM structure, which contains the quantum dot absorption region in the metal resonator; hence, the loss includes the loss in the cavity and the energy loss caused by the repeated absorption of the quantum dot region. The curve “o” represents the absorptivity of the quantum dot detector with the MSM structure, which can be obtained by the difference between the total loss (the value of curve “*”) and the loss in the cavity (the value of curve “+”). It can be seen in curves “*” and “+” that these loss curves increased with increasing wavelength. The increasing trends can be explained as follows. When the wavelength is increased, the diffraction loss factor becomes bigger according to the proportional relationship, which can be written as: δ d = L λ / a 2 . As a result, a larger diffraction loss factor leads to a higher energy loss of the diffraction. Furthermore, curve “+” indicates that the loss of the metal cavity was very small, close to zero, within the wavelength range 135–319 µm. When the wavelength of the incident light increased from 319 to 750 µm, the loss of the metal cavity also increased from 0 to 0.9391 and finally approached 1. This increase in loss could be attributed to the increase in diffraction loss with wavelength. Curve “*”, which describes the energy loss of the quantum dot detector, shows that the loss of the detector was 0.0582 when the wavelength was 135 µm and increased to 0.9989 when the wavelength was increased to 750 µm, which was 0.9407 higher than that at 135 µm. The reason for this is that the diffraction loss of the metal cavity increased as the wavelength increased, which is similar to the metal cavity loss shown in curve “+”. In addition, the incident light was repeatedly absorbed in the quantum dot absorption region due to the reflection of the metal layers, which also led to an increase in the energy loss in the detector. Thus, both phenomena increased the loss in the detector as the wavelength increased, and then stabilized at a maximum loss. Comparing curve “+” and curve “*”, it can be found that the loss in the detector was relatively larger than that in the metal cavity in the 135–750 µm wavelength. For the detector, as the metal cavity structure was installed in the quantum dot detector to form the MSM structure, the incident light could be repeatedly absorbed by the quantum dot region in the detector. Thus, the absorption of the detector can be greatly enhanced as well as its other properties (e.g., quantum efficiency). The absorptivity of the detector with the MSM cavity structure can be calculated by taking the difference between the loss in the MSM structure quantum dot detector and in the metal cavity. This difference is the loss due to the repeated absorption of incident light by the quantum dot region. This loss, labeled as curve “o” in Figure 3 is the increased absorptivity caused by the introduction of the MSM structure to the conventional quantum dot detector. It can be seen that the trend of curve “o” is not similar with those of curves “*” and “+”. Hence, the absorptivity of the detector with the MSM structure was increasing within the wavelength range of 135–319 µm and decreasing within the range of 319–750 µm. For example, when the wavelength changed from 180 to 380 µm, the absorption coefficient correspondingly increased from 0.6825 to 0.8929, which is a 1.31-times increase. This could be due to absorption, which played a dominant role in the total loss in the detector in the wavelength range of 135–319 µm; however, once the wavelength increased to 319 µm, the absorption of the detector gradually decreased as the loss in the cavity (e.g., diffraction loss, incomplete reflection loss of top metal layer) gradually increased. When the wavelength reached 500 µm, the loss in the cavity became significant, and thus, the absorption decreased as the wavelength was increased. Specifically, when the wavelength increased from 319 to 750 µm, the absorption coefficient of the quantum dot detector decreased from 0.9666 to 0.0598, which clearly illustrates the competing relationship between loss and absorption in the detector.
To prove the enhancement effect of the MSM structure on the absorption coefficient of the detector, Figure 4 shows the absorption coefficients of the quantum dot detector with the MSM structure and that of the conventional quantum dot detector. In Figure 4, the curve “--” represents the absorption coefficient of the quantum dot detector with the MSM structure, which was caused by the repeated absorption of the quantum dot region due to the reflection of the metal resonator. The curve “-” represents the absorption coefficient of the conventional quantum dot detector, which considered only the primary absorption of the incident light in the quantum dot region. Comparing the two curves, it can be found that the absorption coefficient of the detector with the MSM structure was 0–8.666 times higher than that of the conventional detector in the wavelength range of 150–663 µm. Further, the maximum absorption coefficient of the quantum dot detector with the MSM structure was 0.9666 at 319 µm wavelength, which was 0.8666 larger than that of the conventional quantum dot detector, indicating that the MSM structure can increase the absorption performance of the quantum dot detector. In this study, it can also be observed that the absorption coefficient curve initially increased and then decreased as the wavelength increased. This was due to the increase in the loss (including diffraction loss) as the wavelength increased.

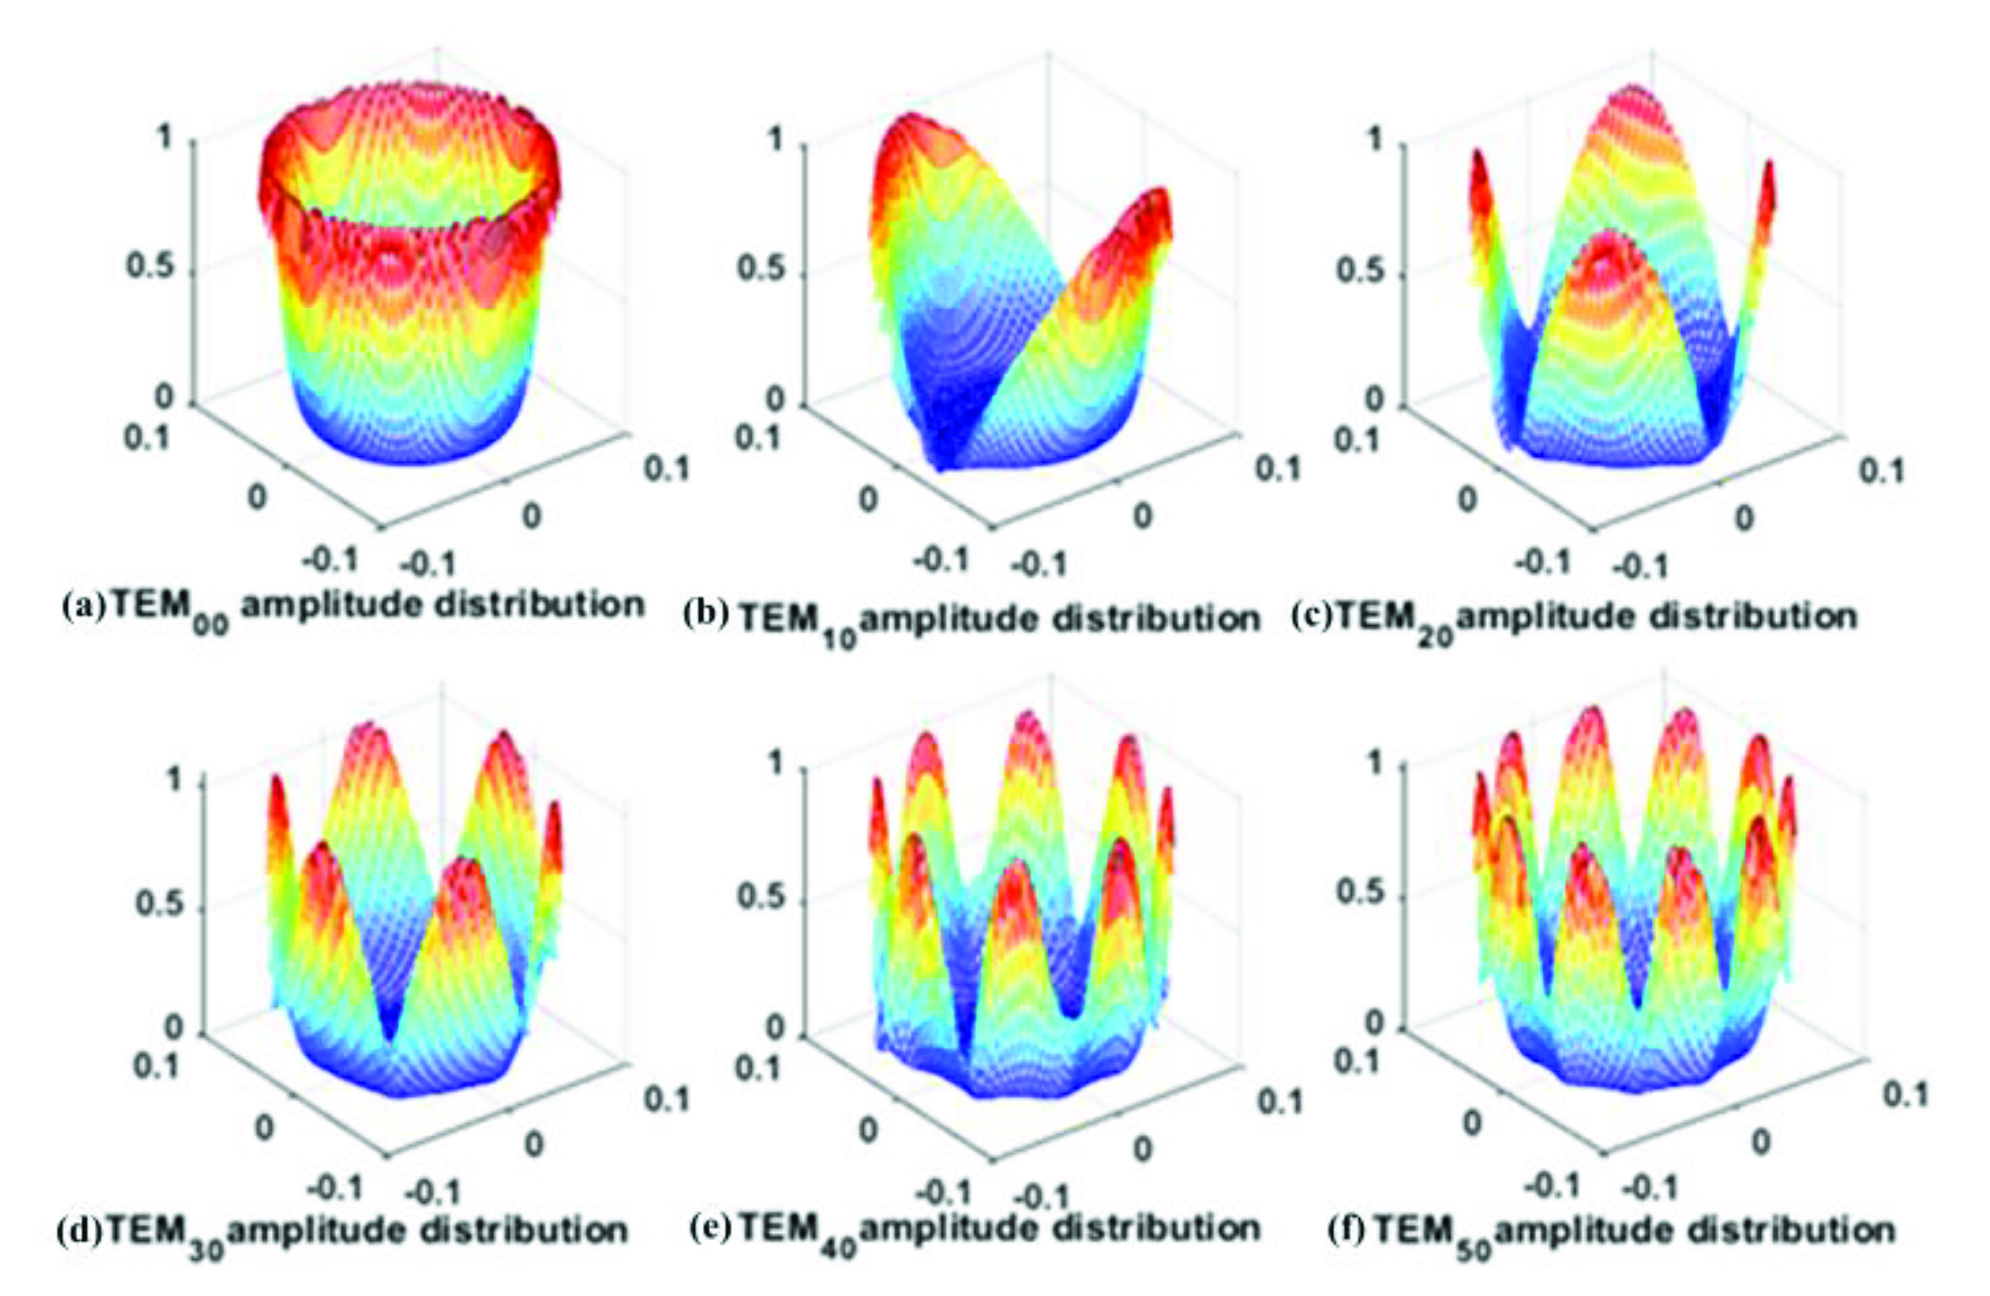
3.2. Light Field Mode

It can be clearly observed that the absorption of the quantum dot detector with the MSM structure was enhanced due to the resonance of the incident light caused by the reflection of the upper and lower metal layers in the detector, which can be seen from the stable field distribution. To explain this phenomenon, the light field mode is discussed in this section. The light field mode in the MSM resonator was calculated by taking the incident light at 265 µm as an example. In the quantum dot absorption region of the detector, the thickness l of one periodic quantum dot layer was 5 × 10 8   m , the unit absorption coefficient α was 2 × 10 6   m 1 , the total thickness l M of the cavity formed by the two reflective metal layers was 1.5 × 10 4   m , and the horizontal and vertical line widths a was taken as 1 × 10 4   m . Based on these parameters, Figure 5 shows the stabilized transverse field distributions for modes TEM00–TEM50 in the metal cavity in the direction perpendicular to the propagation of light. In this study, TEM00 was a zero-order transverse mode, which had no pitch line distribution in both radial and angular directions, and TEM10 was a first-order transverse mode, which had a pitch line distribution in the longitudinal direction, but none in the radial direction. The TEM20 was a two-order transverse mode, which had two pitch lines in the angular direction. The TEM30 transverse mode had three pitch lines along the angular direction of the circular metal reflective layer, but no pitch line distribution in the radial direction. The other modes also showed similar distribution. Besides the waveband at 265 µm, the stable modes of the other bands can also be obtained by a similar method.
To make the mode distribution clearer, the three-dimensional amplitude distribution of the six stable light field modes of TEM00–TEM50 was further analyzed, and the corresponding results are shown in Figure 6. The amplitude of the TEM00 (zero-order mode) was uniform and had no pitch line in both angular and radial directions, which was similar to the two-dimensional light intensity distribution of the TEM00 shown in Figure 5. The similarity demonstrates that the correction made in the calculations from the other side are in accordance with the relationship between incident light intensity and amplitude. The amplitude distributions of the TEM20 and TEM30 modes had two and three pitch lines, respectively, in the angular direction, but no pitch lines in the radial direction, which were consistent with the cross distribution of the light intensity in TEM20 and TEM30 presented in Figure 5. The distributions of the TEM40 and TEM50 modes were also similar to the corresponding distributions shown in Figure 5. It can be observed that the edges of these distributions are sharp, which were due to the diffraction loss on the mirror surface and the absorption loss in the quantum dot region.
From the above discussions, it can be noticed that there were no pitch lines in the radial direction in the transverse mode of the quantum dot detector with the MSM structure, which means that there will be no nth transverse mode for TEM0n. The reasons can be (1) the wavelength of the incident light is relatively larger than the length of the resonant cavity, and (2) the incident light is reflected by the metal layer before it forms the light interference in the radial direction. Therefore, there will be no pitch lines in the amplitude distribution in the radial direction.

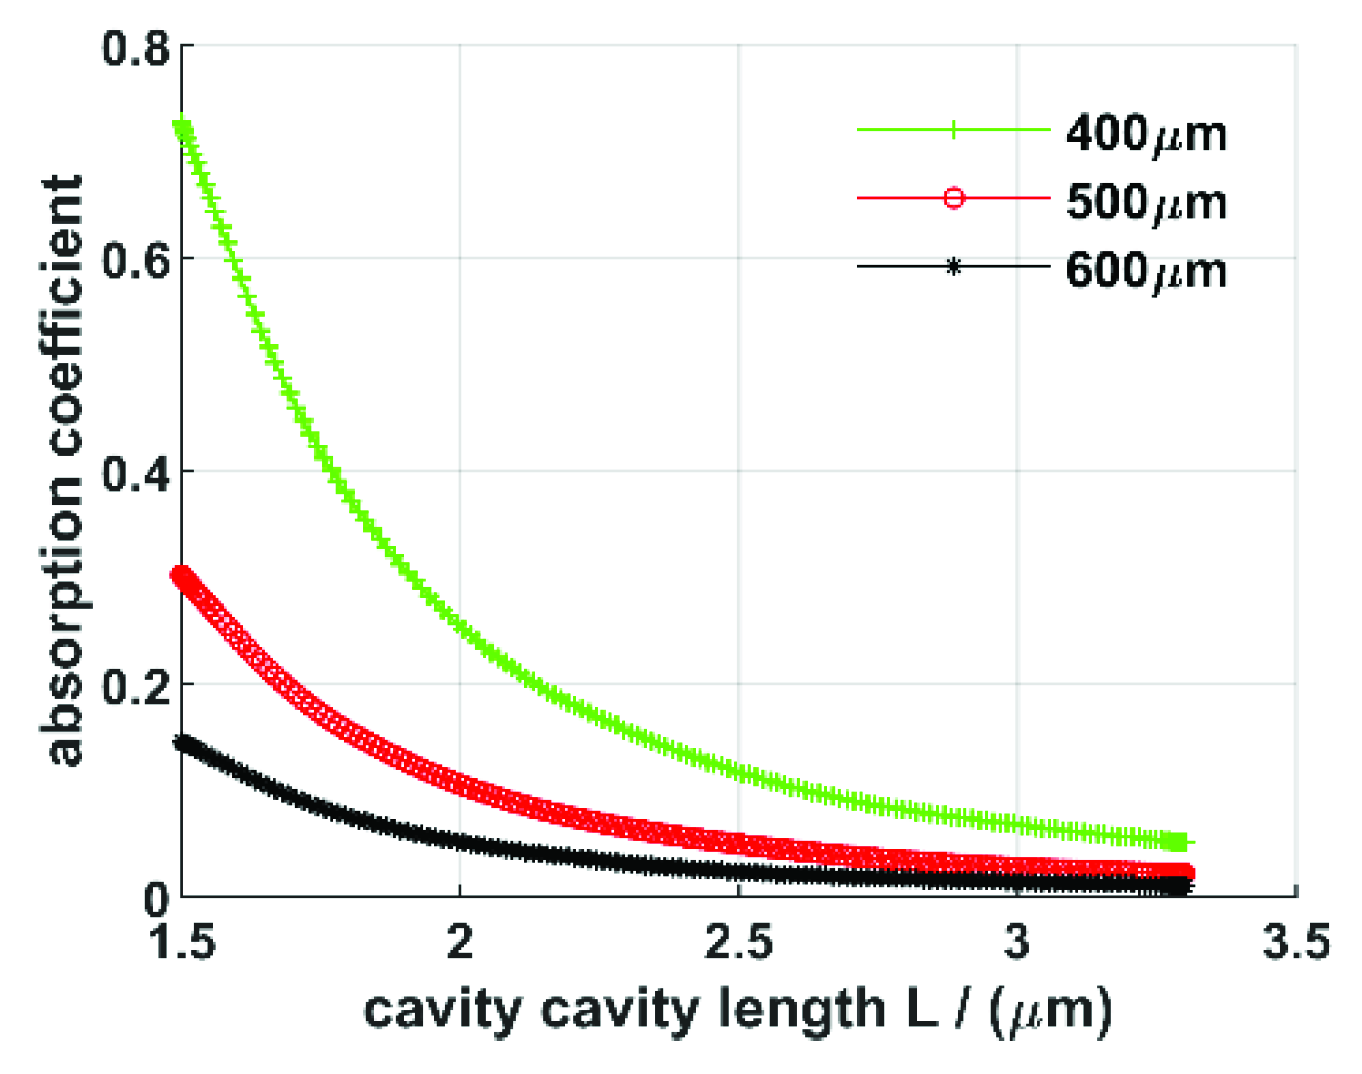
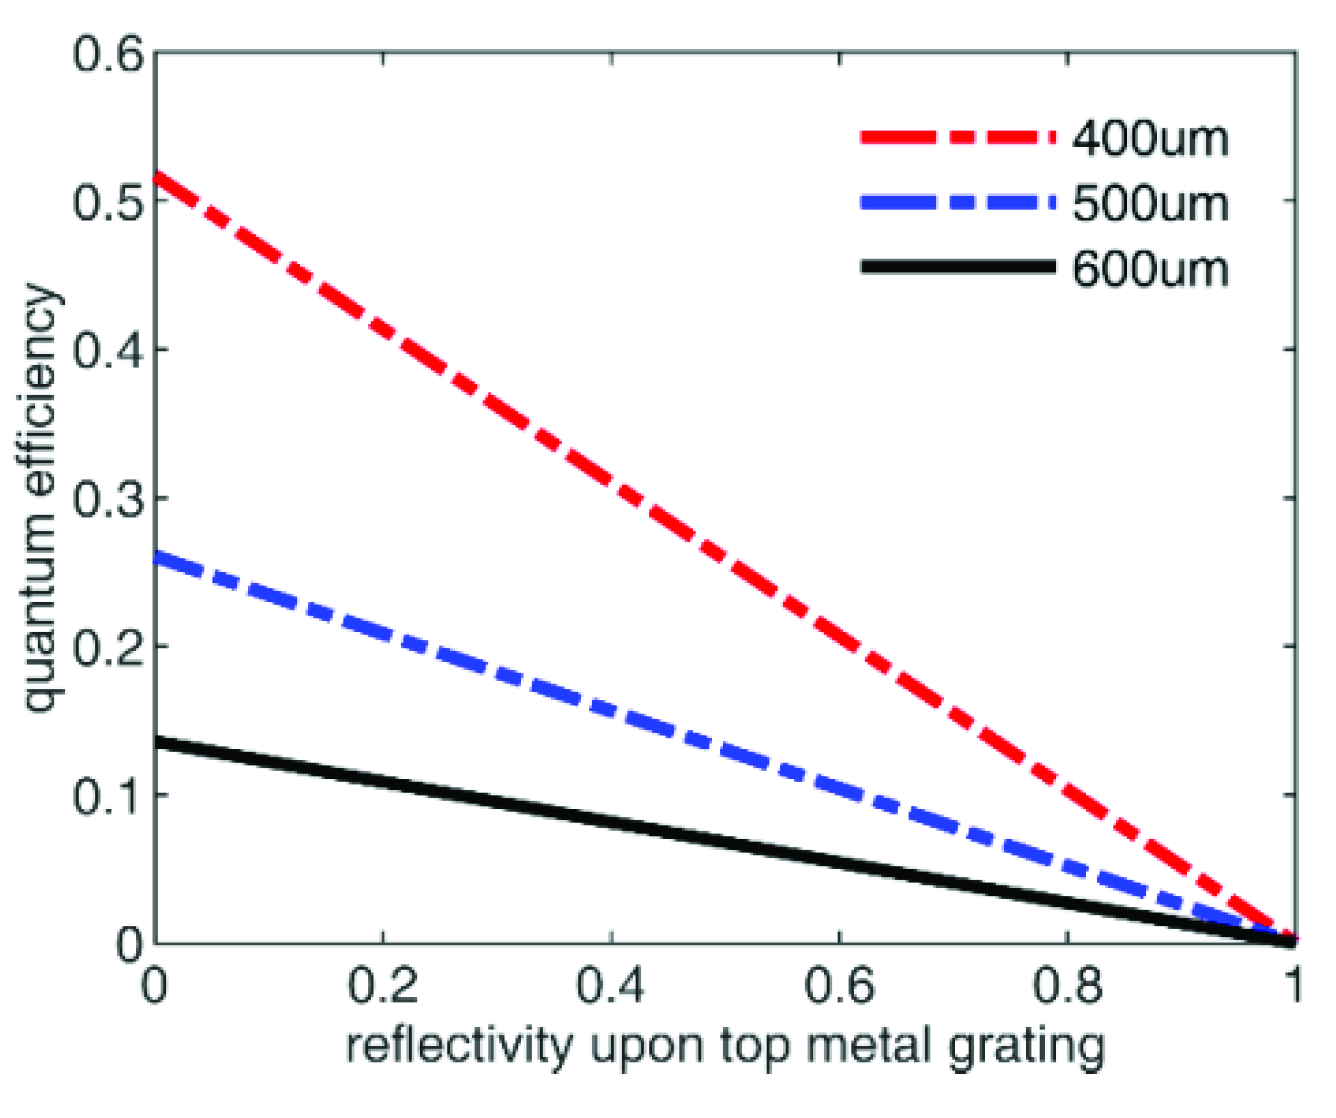
3.3. Influence of the Metal Resonance Structural Parameters

Based on the enhancement of the absorption coefficient mentioned above, the influence of the structural parameters of the metallic cavity on absorption coefficient is discussed in this section. Keeping the other structural parameters unchanged, three wavelengths (i.e., 400, 500, and 600 µm) were chosen as examples in the wavelength range from 135–750 µm to study the influence of the parameters of the metallic cavity on absorption coefficient.
Figure 7 shows the influence of the line width of the metallic cavity (i.e., the diameter of the metal reflective layer) on the absorption coefficient of the detector under the condition where the other structural parameters remained unchanged. As shown in Figure 7, when the line width of the metallic cavity increased from 100 to 500 µm, the quantum dot detector with the MSM structure exhibits the increased tendency first and then decreased on the absorption coefficient. For instance, in the curve at 400 µm wavelength, the line width of the metallic cavity increased from 100.0 to 366.3 µm. The absorption coefficient correspondingly increased from 0 to 0.8991. However, the absorption coefficient of the detector showed a decreasing trend when the line width of the metallic cavity was within the 366.3–500 µm range. For example, the absorption coefficient of the detector was 0.8271 corresponding to the line width of 400 µm of the metallic cavity. When the line width was increased to 500 µm, the absorption rate of the detector was reduced to 0.2232, which was 0.6039 smaller than that at 400 µm.
In addition, it can be noted that the wavelength also had an influence on the absorption coefficient. At 500 µm wavelength, the absorption coefficient of the detector correspondingly increased from 0 to 0.8798 when the line width of the metallic cavity changed from 100 to 403.8 µm. The absorption coefficient at 600 µm wavelength increased from 0 to 0.9131 in the line width range of 100–446.3 µm. Thus, the above results clearly demonstrate that the wavelength can have an influence on the absorption coefficient, where the absorption coefficient changes when the wavelength is changed.
Besides the line width of the metallic cavity, its cavity length also has a substantial influence on the absorption coefficient of the detector. Assuming that the distance between the two metal reflective layers was simply widened to increase the cavity length, while keeping the material period in the cavity and the other parameters of the cavity unchanged, the influence of the length of the metallic cavity on the absorption coefficient of the detector was investigated. The results are shown in Figure 8. In this figure, under the assumption that the other structural parameters remained unchanged, the absorption coefficient of the detector showed a decreasing trend when the cavity length increased from 1.5 to 3.2 µm. For instance, for curve 400 µm (corresponding to the absorption coefficient at 400 µm wavelength), when the cavity length was increased from 1.6 to 2.5 µm, the absorption coefficient of the detector decreased from 0.5805 to 0.1162, corresponding to a reduction of approximately 0.4643. Similar decreasing trends can be also observed in curves 500 and 600 µm. When the cavity length increased from 1.6 to 2.5 µm, the absorption coefficient of the detector decreased from 0.2404 to 0.0490 at 500 µm wavelength, with a reduction of 0.1914. Under the same length range, the absorption coefficient at 600 µm also decreased from 0.1168 to 0.0232, with a reduction of 0.0936.
Figure 9 shows the influence of the duty cycle of the square hole array on the absorption coefficient of the detector with the MSM structure. In this figure, while keeping the other structural parameters unchanged, the absorption coefficient of the quantum dot detector with the MSM structure tended to continuously decrease as the duty cycle increased from 0 to 0.9. It can be seen that the larger the duty cycle, the larger the proportion of the area of the holes in the metal layer, which caused reflection in the top metal layer due to more enhanced transmission of light. Thus, the larger incomplete reflection losses of the cavity can be obtained, which resulted in a reduction in the absorption coefficient of the detector. Taking the curve for 400 µm as an example, when the duty cycle of the hole array was increased from 0 to 0.9, the detector absorption coefficient correspondingly decreased from 0.9788 to 0. It can be inferred that the absorption coefficient can be different for different wavelength in the same variation range of the duty cycle, and the trend of the short-wavelength curve clearly changed. When the duty cycle was increased from 0.2 to 0.6, the absorption coefficient at 400 µm wavelength was reduced from 0.7250 to 0.1841, with a reduction value of 0.5413. At 500 µm wavelength, within the same variation range of the duty cycle, the absorption coefficient decreased from 0.3015 to 0.0751, with a reduction value of 0.2267. At 600 µm wavelength, the detector absorption coefficient decreased from 0.1454 to 0.0366, with a value of 0.1092. The above results confirm that the duty cycle of the top metal grating layer had a substantial influence on the absorption coefficient, where it decreased as the duty cycle increased. Therefore, the structural parameters of the resonant cavity have a substantial influence on the performance of the detector with the MSM structure. In practical application, a suitable detector can be chosen by selecting the appropriate structural parameters according to the requirements.
Besides the effect of the duty cycle of the metal layer (the effect of square hole transmission) on the absorption of the detector shown in Figure 9, the reflectivity below the top metal grating itself also has a great influence on the performance of the detector, which is the same as that of the bottom metal layer. In order to avoid duplication, only the influence of the different reflectivity of the bottom on the absorption coefficient of the detector is given here. Figure 10 shows the influence of the reflectivity of the bottom metal layer (precisely, which is the reflectivity upon the bottom metal layer) on the absorption coefficient. In this figure, the absorption coefficient shows the increased tends. For example, the absorption coefficient increases from 0.0096 to 0.5955 when the reflectivity of the bottom metal layer is changed from 0.1 to 0.9 at wavelength of 400 µm. Within the same changed range of the reflectivity of the bottom metal layer, the reflectivity at 500 µm and 600 µm show the similar increase from 0.0044 to 0.2472 and from 0.0019 to 0.1195, respectively. The increase of the absorption coefficient should be ascribed as the increase of the repeated absorption led by the increase of the reflectivity of the bottom metal layer.
In fact, there is the reflectivity upon the top metal grating layer which has a big influence on the quantum efficiency of the detector. Figure 11 shows the influence of the reflectivity upon the top metal layer on the quantum efficiency of the detector. Compared with these curves, it is found that the quantum efficiency decreases with the increase of the reflectivity upon the top metal grating. Take the quantum efficiency on the 400 µm as an example, the quantum efficiency of the detector with MSM structure is decreased from 0.4653 to 0.0517 when the reflectivity upon the top metal grating is changed from 0.1 to 0.9. The quantum efficiency at 500 µm and 600 µm also show a decreased tendency within the same range of the reflectivity upon the top metal grating. The decreased tends can be explained as follows. With the increase of reflectivity upon the top metal grating, the light entering the detector becomes less, which will make less light be absorbed and converted; furthermore, a smaller quantum efficiency is obtained.

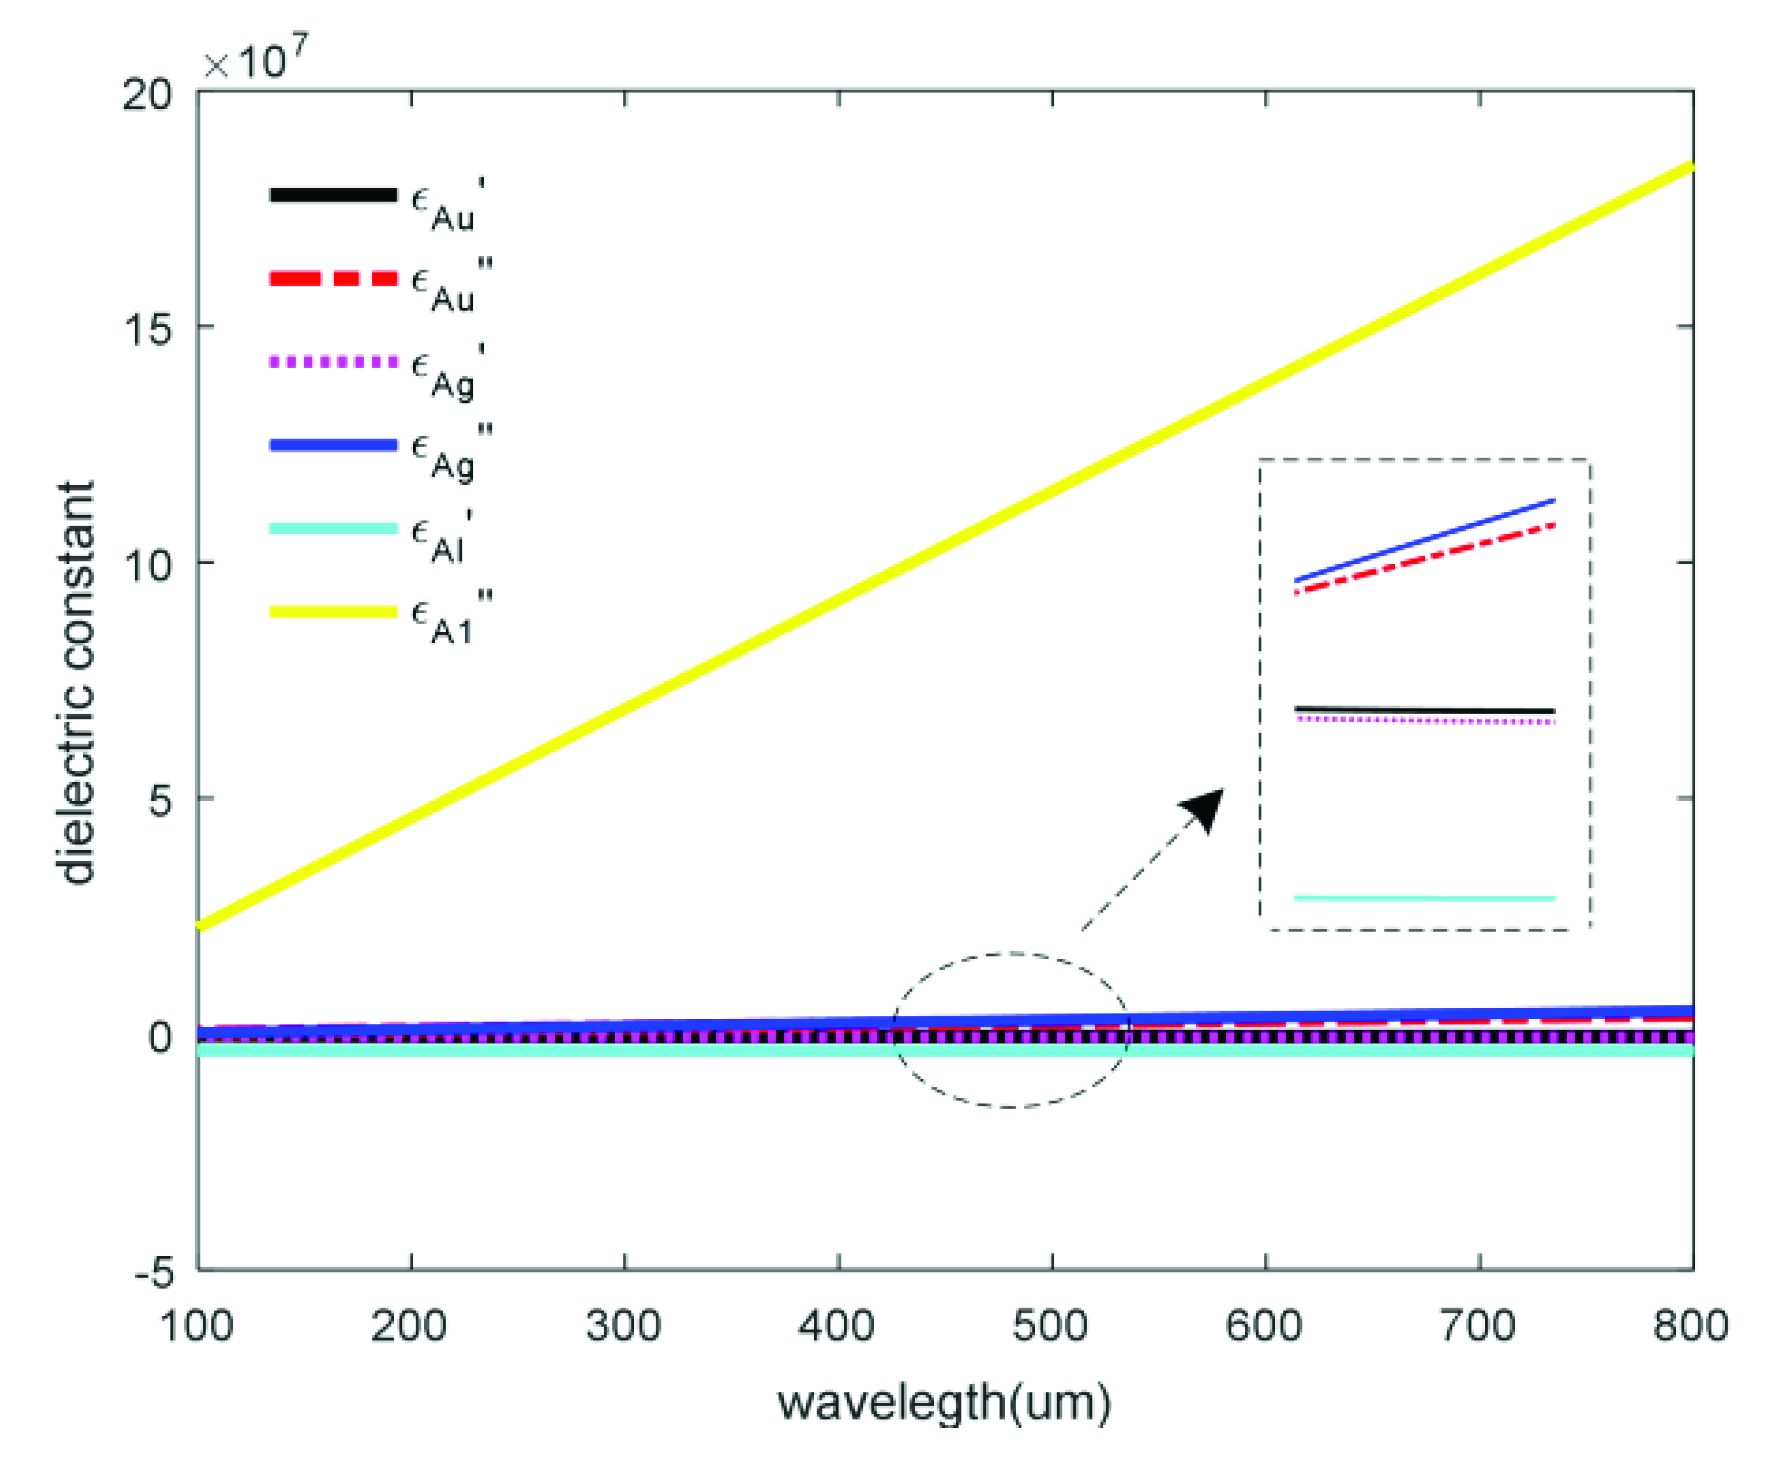
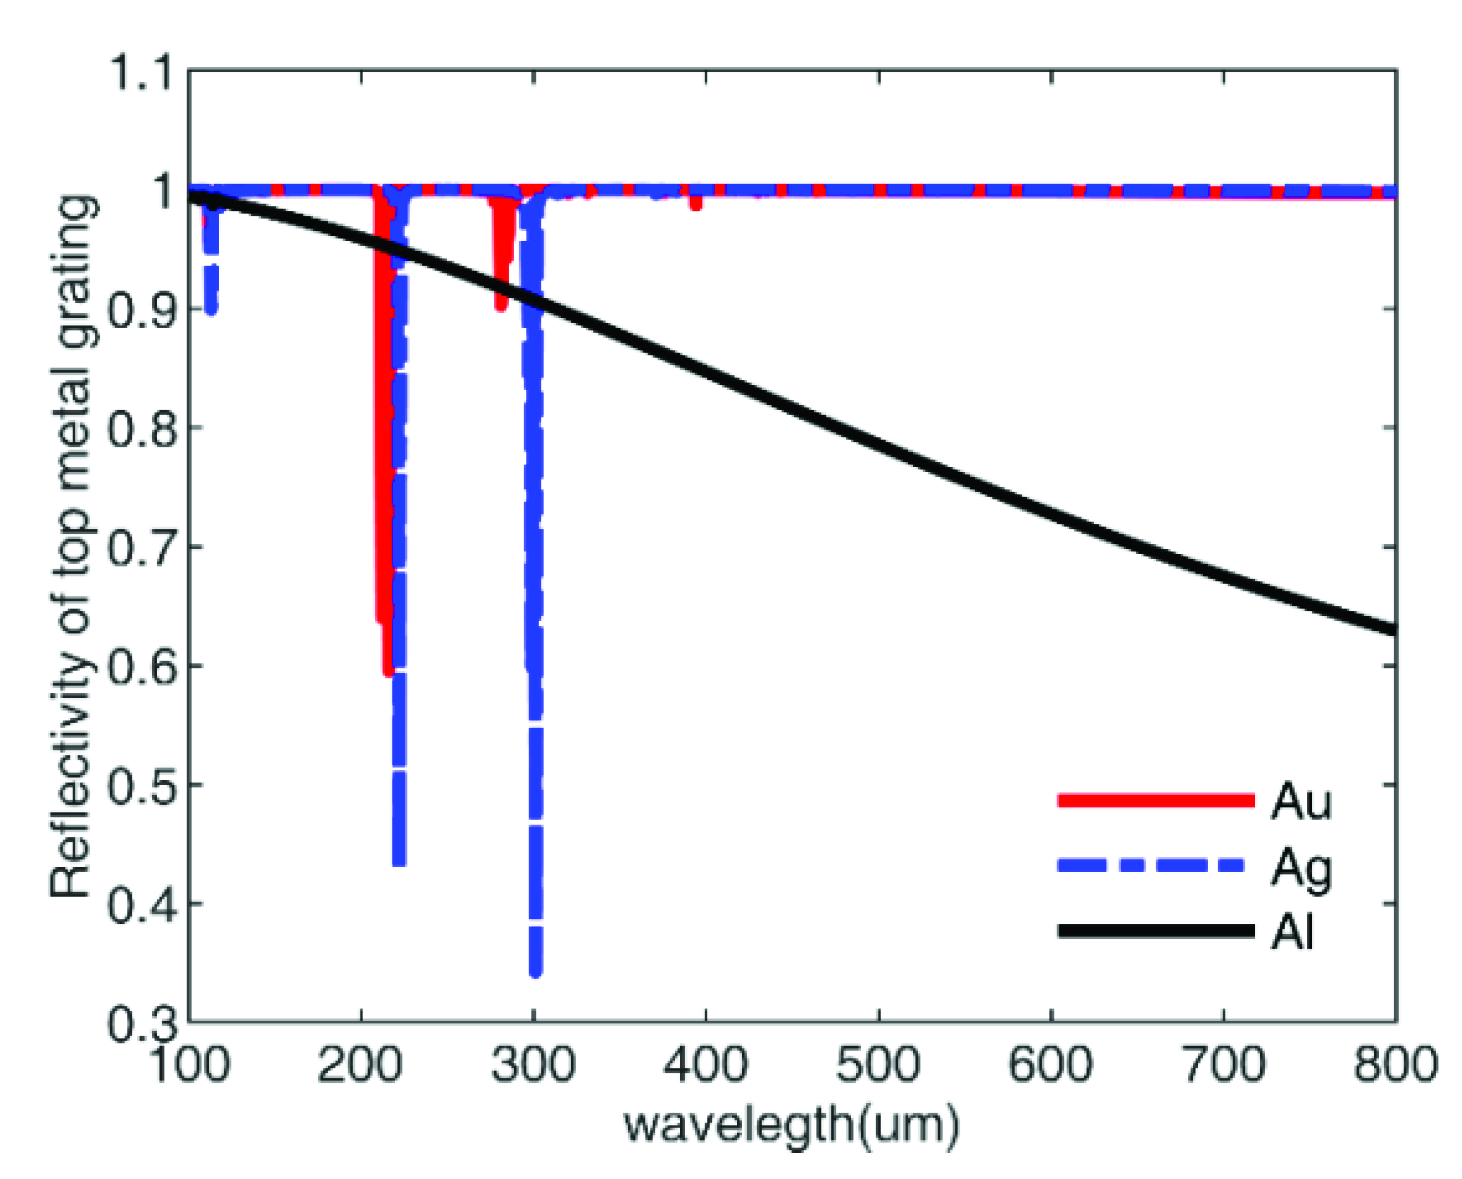
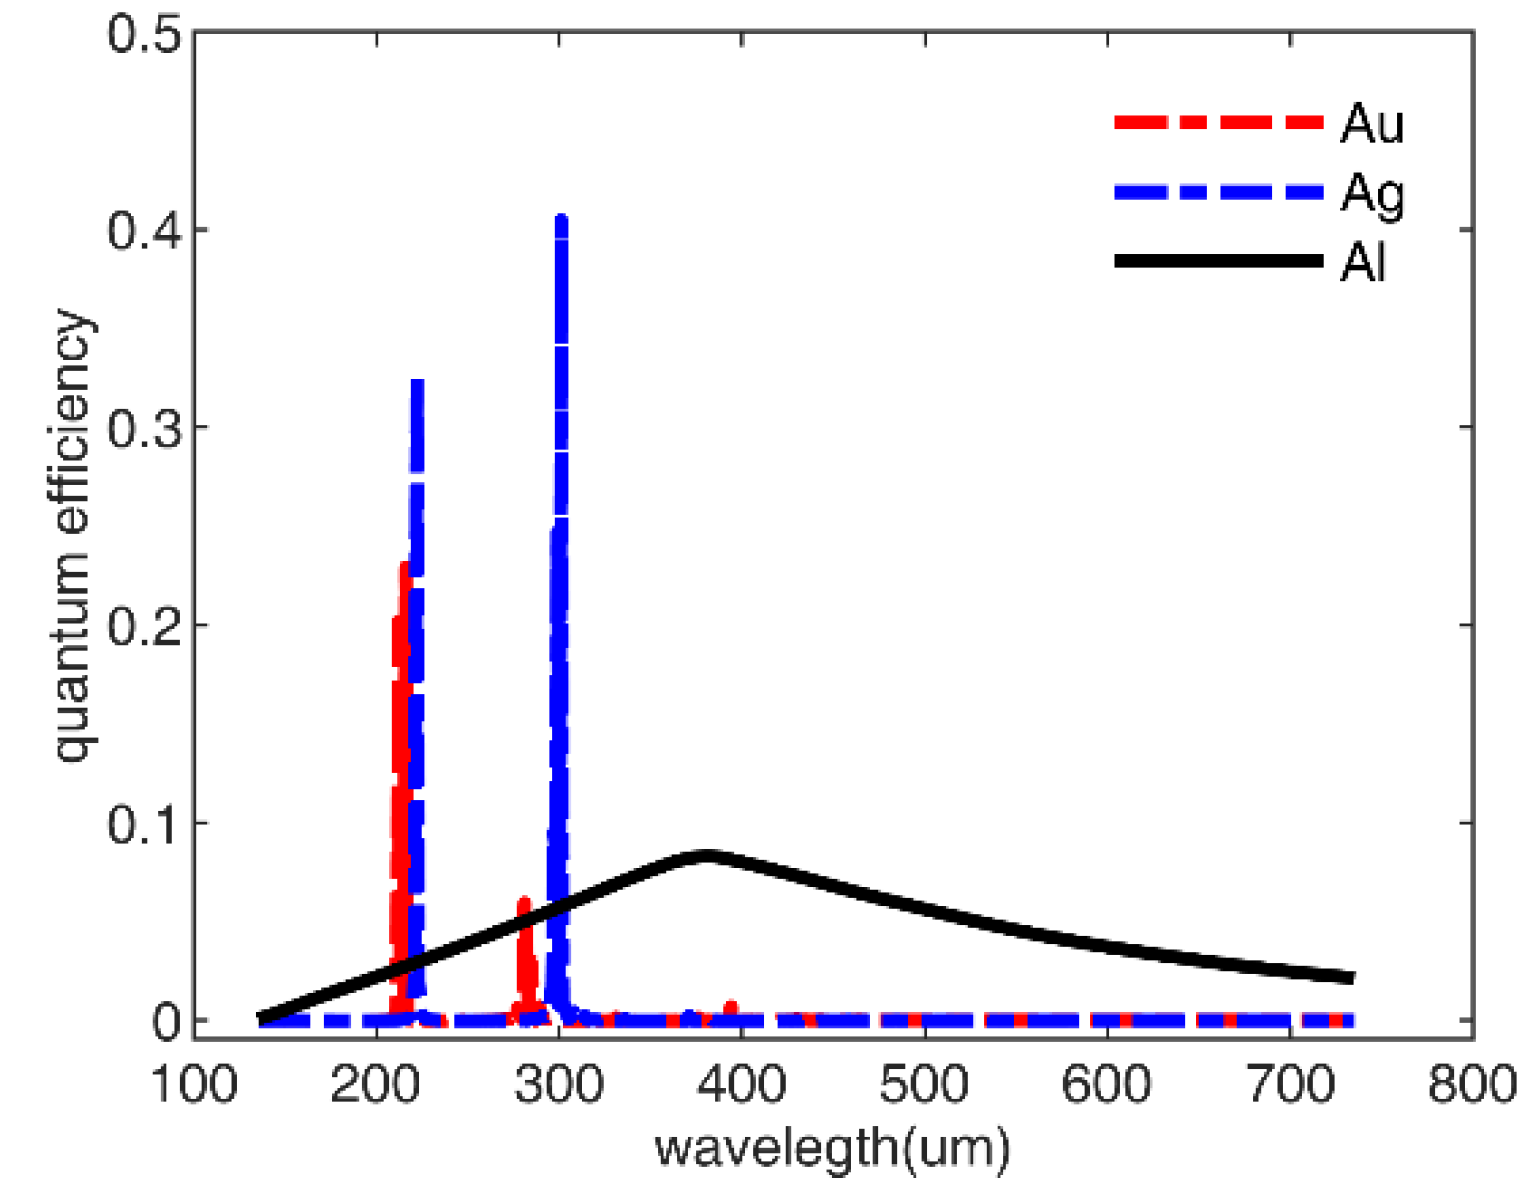
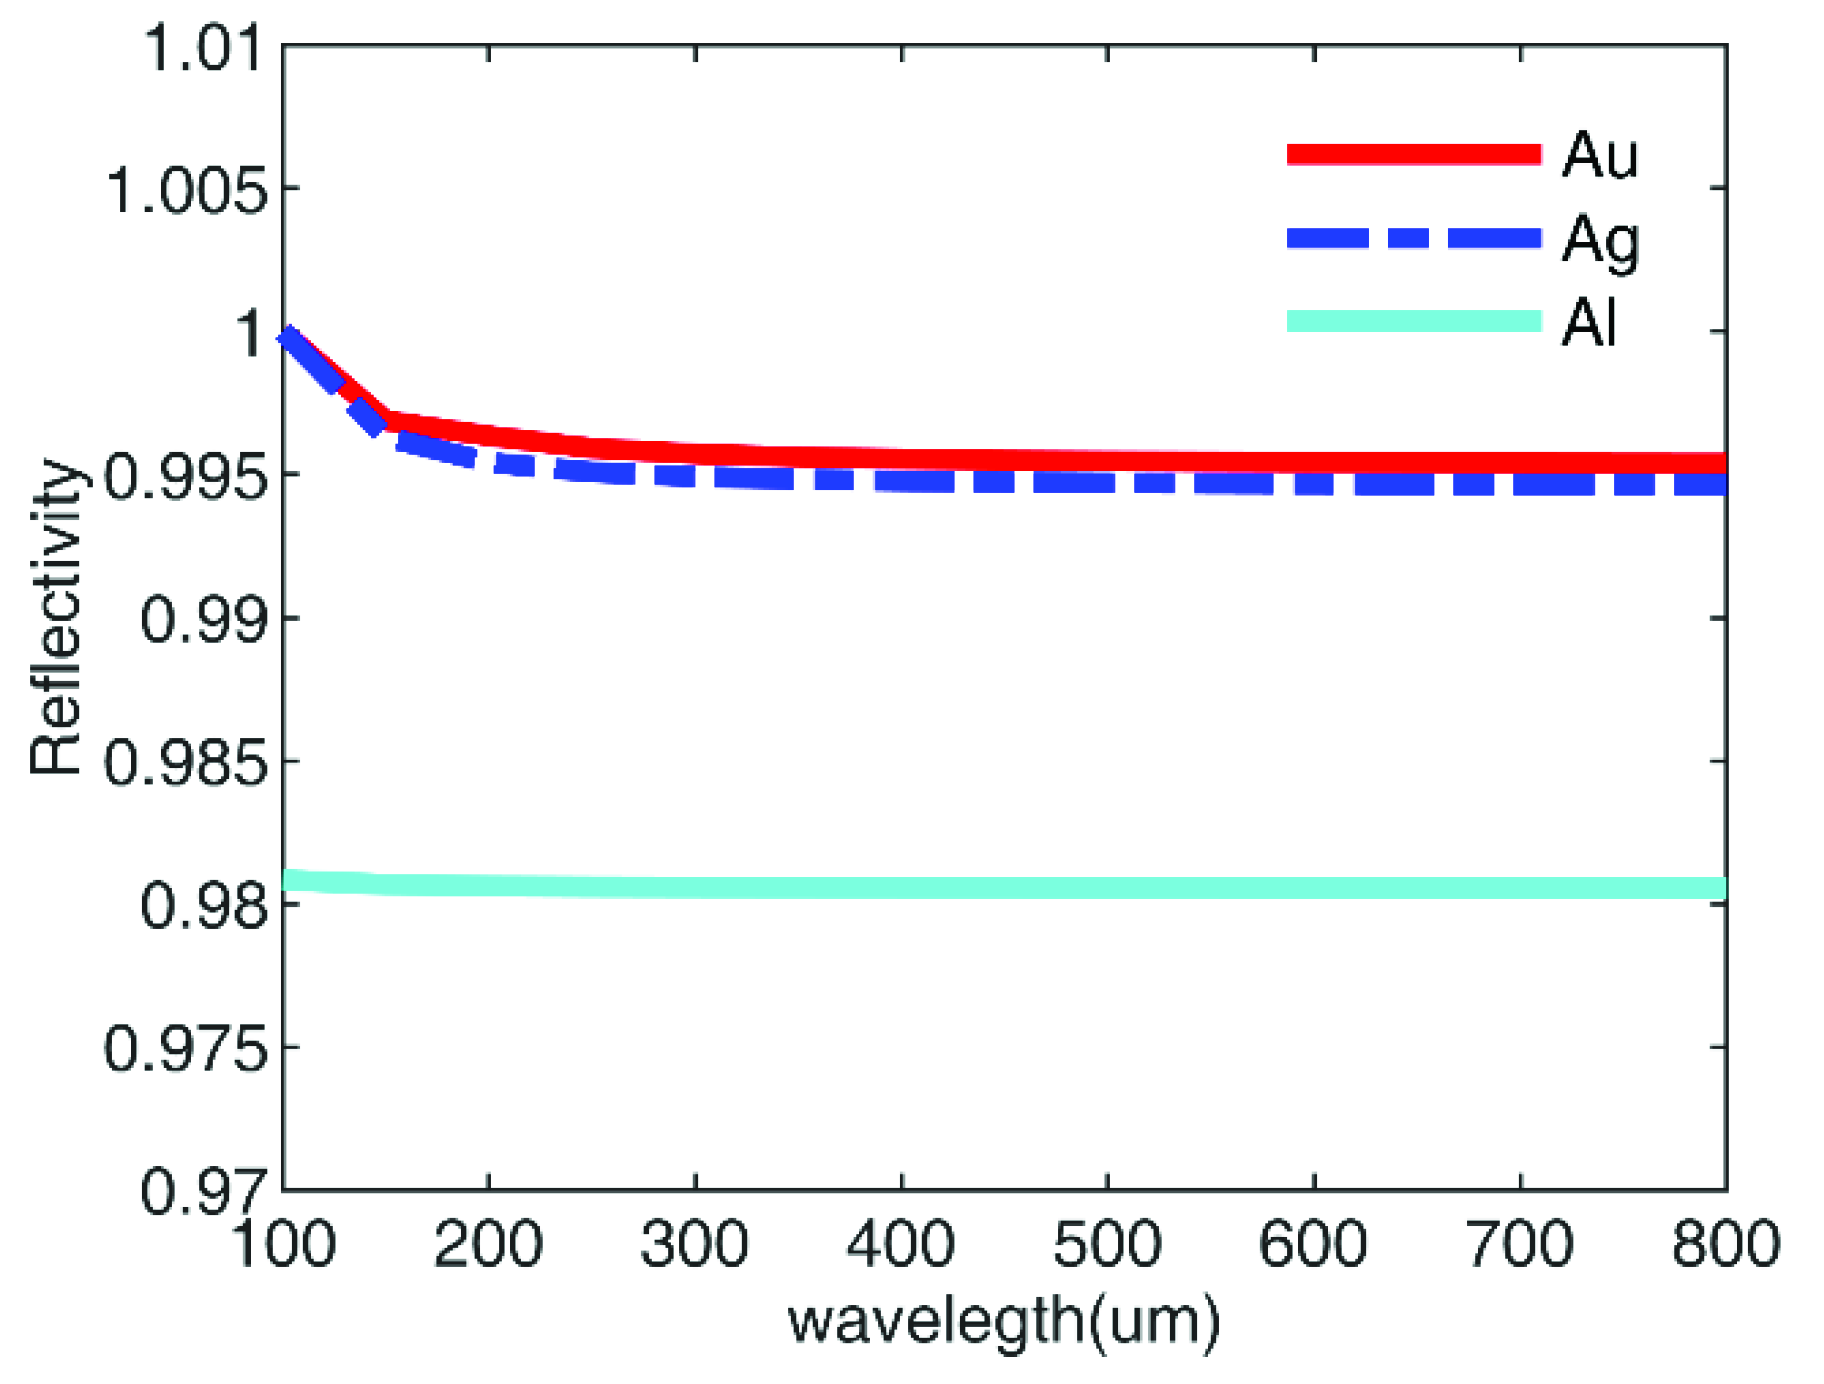
3.4. Influence of the Metal Material

In practice, the performance of the detector with MSM structure is not only influenced by the structure parameters, is but also influenced by the dielectric constant of the metal materials. Since the top metal grating is designed as the structure of the periodic square holes in our paper, which belongs to the two-dimensional grating structure, and literature [26,27] indicates the calculated results of the dielectric constant of the metal material by the “Drude model” are the same as that of “Drude-Lorentz model” above the wavelength of 600 nm, hence in our paper, the dielectric constant of the metal material used for top metal grating and the bottom metal layer is supposed that approximately satisfied the “Drude model”, and that of GaAs material below the top metal layer is 12.9 [28]. Here, the periodic structure of the top metal grating with the square holes is 88.8 µm, the thickness of the top metal grating is 20 nm and that of the bottom metal layer is 60 nm. Based on these parameters, the dielectric constant of Au, Ag, and Al is firstly calculated; secondly, the reflectivity upon the top metal grating is analyzed; finally, the quantum efficiency is further calculated and given. Figure 12 shows the dielectric constant of Au, Ag, and Al. In this figure, it is clear that the real parts of the dielectric constants of the material Au and Ag are very close, and their imaginary part also shows a similar trend of closeness (see the enlarged view of these curves at the bottom right of Figure 12). However, the dielectric constant of the Al shows a big difference from that of Au and Ag, especially the imaginary part of the dielectric constant of Al, which is much higher than that of the Au material and Ag material.
Figure 13 gives the reflectivity of the top metal grating manufactured by the different materials. In this figure, the Al grating layer shows the decreased reflectivity with the increase of the wavelength, Au and Ag grating layers show the very big reflectivity in the total, but they have some minimum values. To be concreted, the minimum values of reflectivity of the Ag grating layer are 0.8994, 0.4294, and 0.3428 at 113 µm, 222 µm, and 301 µm, respectively, and that of the Au grating layer is respectively 0.9572, 0.6404, 0.5956, 0.9026 at 112 µm, 212 µm, 216 µm, and 281 µm. Why do these minimum values occur? They should be ascribed to the surface plasmon resonance effect on the surface between the metal grating and the GaAs contact layer.
Combing these minimum values of the reflectivity with the absorption of the detector (see Figure 4), a high quantum efficiency will be obtained. Figure 14 shows the quantum efficiency values under the different metal materials. In this figure, the detector with the Ag grating has very high quantum efficiency, the maximum of which is up to 0.4048, and it is 1.77 times and 5.04 times as high as that of the detector with the Au grating (0.2292 at 216 µm) and that of the detector with the A1 grating (0.0803 at 382 µm), respectively. The maximum quantum efficiency of the Ag metal grating structure is the highest, which means that the surface plasmon effect induced Ag grating is the strongest. Hence combined Figure 12, Figure 13 and Figure 14, it is initially considered that the Ag materials are more suitable for our designed quantum dot detector with MSM structure.
Figure 15 gives the reflectivity of the bottom metal layer under the different metal materials. In this figure, it is clear seen from this figure that the Au layer and the Ag layer have very close trends in the total, and they are almost equal to one. The A1 layer shows the lightly smaller reflectivity than that of the Au layer and Ag layer. As well, it is known that the bottom metal layer is introduced to form the repeated absorption, and the high reflectivity is more beneficial to enhance absorption, so the Ag and Au material is the ideal material used to make the bottom metal layer. Combined with Figure 11, Figure 12, Figure 13 and Figure 14, the conclusion is obtained that the metal material used for the top metal grating and the bottom metal layer should be chosen as Ag material, which has the best enhanced, great impact on the performance of the detector.

3.5. Performance Comparision

To make clear the improvement of the detector with MSM structure, it is compared with the conventional detector and shown in Table 1. As shown in Table 1, the electrodes of the conventional detector are generally set as the ring shape, which they serve only as the link under only ignoring the other loss. In our designed detector with MSM structure, the top metal grating and the bottom metal layer not only play the role of electrode connection, but also enhance the performance of the detector. Thus the optical transmission of the top metal grating and the bottom metal layer is given in Table 1. In this table, the duty cycle of the top metal grating is 0.2, the maximum the reflectivity upon the top grating metal layer (corresponding to Ag material) is 0.3428, the reflectivity of the bottom metal layer is 1, and the corresponding values of the conventional detector are seen as zero because the connection of the ring electrodes is only considered in our paper. In addition, the maximum of the absorption coefficient and that of the quantum efficiency of our detector with MSM structure is 0.966 and 0.4048, respectively, and the conventional detector is respectively 0.1 and 0.0952, which is 0.866 times and 3.252 times smaller than that of our detector.

4. Conclusions

In this study, the enhancement effect of the MSM structure on the quantum dot detector was achieved with a maximum absorption coefficient of 8.666 times higher than the conventional quantum dot detector, which is without the MSM structure. The finite-element transfer matrix method, eigenvector method, Kirchhoff’s diffraction theory, and the related light field mode distribution were used to verify the enhancement. Furthermore, the influences of the MSM structural parameters and metal material used MSM structure on the performance of the quantum dot detector were analyzed. The results showed that the absorption coefficient of the detector initially increased, and then decreased as the resonant cavity line width and length increased under fixed wavelengths. Furthermore, the adsorption coefficient and quantum efficiency of the detector were up to 0.97 and 0.4, respectively. This provides theoretical support and technical guidance in the application of the detectors.

Author Contributions

Conceptualization, H.L.; methodology, R.Z.; validation, Y.K.; investigation, T.M.; writing—original draft preparation, H.L.; writing—review and editing, W.H. and G.Z. All authors have read and agreed to the published version of the manuscript.

Funding

This research was funded by the National Natural Science Foundation of China(Grant Nos. 11874245 and 11875032); National Key R&D Program of China (Grant No. 2021YFB3200100); the Key R&D Project of Datong City (Grant No. 2020019), Research Project Supported by Shanxi Scholarship Council of China (No. 2020-135), and Special project of Shanxi Datong University (Nos. 2020YCZX002, 2020YCZX004 and 2020YCZX007).

Institutional Review Board Statement

Not applicable.

Informed Consent Statement

Not applicable.

Data Availability Statement

The data that support the findings of this study are available within the article.

Conflicts of Interest

The authors declare no conflict of interest.

References

  1. Leyman, R.R.; Gorodetsky, A.; Bazieva, N.; Molis, G.; Krotkus, A.; Clarke, E.; Rafailov, E.U. Quantum dot materials for terahertz generation applications. Laser Photonics Rev. 2016, 10, 772–779. [Google Scholar] [CrossRef] [Green Version]
  2. Asgari, M.; Coquillat, D.; Menichetti, G.; Zannier, V.; Diakonova, N.; Knap, W.; Sorba, L.; Viti, L.; Vitiello, M.S. Quantum-dot single-electron transistors as thermoelectric quantum detectors at terahertz frequencies. Nano Lett. 2021, 21, 8587–8594. [Google Scholar] [CrossRef]
  3. Martyniuk, P.; Rogalski, A. Quantum-dot infrared photodetectors: Status and outlook. Prog. Quantum Electron. 2008, 32, 89–120. [Google Scholar] [CrossRef]
  4. Stiff-Roberts, A.D. Quantum-dot infrared photodetectors: A review. J. Nanophotonics 2009, 3, 031607. [Google Scholar] [CrossRef]
  5. Liu, H.; Tong, Q.; Liu, G.; Yang, C.; Shi, Y. Performance characteristics of quantum dot infrared photodetectors under illumination condition. Opt. Quantum. Electron. 2015, 47, 721–733. [Google Scholar] [CrossRef]
  6. Kim, J.O.; Ku, Z.; Kazemi, A.; Urbas, A.; Kang, S.W.; Noh, S.K.; Lee, S.J.; Krishna, S. Effect of barrier on the performance of sub-monolayer quantum dot infrared photodetectors. Opt. Mater. Express 2014, 4, 198–205. [Google Scholar] [CrossRef]
  7. Gao, L.; Chen, C.; Zeng, K.; Ge, C.; Yang, D.; Song, H.; Tang, J. Broadband, sensitive and spectrally distinctive SnS2 nanosheet/PbS colloidal quantum dot hybrid photodetector. Light Sci. Appl. 2016, 5, e16126. [Google Scholar] [CrossRef] [PubMed] [Green Version]
  8. Lu, X.; Armiento, C.; Li, J.; Goodhue, W. A Longwave Infrared (LWIR) Photodetector Based on Nonlinear Absorption in InAs/GaAs Quantum Dots; IEEE International Symposium on Biophotonics: Hangzhou, China, 2006; pp. 16–18. [Google Scholar]
  9. Wang, W.W.; Guo, F.M.; Li, Y.Q. Modeling and simulation of a resonant-cavity-enhanced InGaAs/GaAs quantum dot photodetector. Adv. Condens. Matter Phys. 2015, 1, 847510. [Google Scholar] [CrossRef] [Green Version]
  10. Attaluri, R.S.; Shao, J.; Posani, K.T.; Lee, S.J.; Brown, J.S.; Stintz, A.; Krishna, S. Resonant cavity enhanced In As In 0.15 Ga 0.85 As dots-in-a-well quantum dot infrared Photodetector. J. Vac. Sci. Technol. B 2017, 25, 1186–1190. [Google Scholar] [CrossRef]
  11. Negi, C.M.S.; Kumar, D.; Gupta, S.K.; Kumar, J. Theoretical analysis of resonant cavity of p-type quantum dot infrared photodetector. IEEE J. Quantum Electron. 2013, 49, 839–845. [Google Scholar] [CrossRef]
  12. Wang, H.; Jing, Y.; Li, M.; Zhen, H. Optimal design of resonant enhanced quantum dot photodetector based on metal-insulator-metal microcavity. In New Detection Technology and Application Seminar Defense Photonics Forum, Proceedings of the Photoelectronic Technology Committee Conferences, Hefei, Suzhou, and Harbin, China, June–July, 2015; Society of Photo-Optical Instrumentation Engineers: Changchun, China, 2015. [Google Scholar]
  13. Choi, K.K.; Allen, S.C.; Sun, J.G.; Wei, Y.; Olver, K.A.; Fu, R.X. Resonant structure for infrared detection. Appl. Opt. 2017, 56, B26–B36. [Google Scholar] [CrossRef] [PubMed]
  14. Chen, W.; Roelli, P.; Hu, H.; Verlekar, S.; Amirtharaj, S.P.; Barreda, A.I.; Kippenberg, T.J.; Kovylina, M.; Verhagen, E.; Martínez, A.; et al. Continuous-wave frequency upconversion with a molecular optomechanical nanocavity. Science 2021, 374, 1264–1267. [Google Scholar] [CrossRef] [PubMed]
  15. Roelli, P.; Martin-Cano, D.; Kippenberg, T.J.; Galland, C. Molecular platform for frequency upconversion at the single-photon level. Phys. Rev. X 2020, 10, 031057. [Google Scholar] [CrossRef]
  16. Li, J.S. Terahertz wave dielectric properties of GaAs. Spectrosc. Spect. Anal. 2019, 29, 577–579. [Google Scholar]
  17. Hebling, J.; Hoffmann, M.C.; Hwang, H.Y.; Yeh, K.L.; Nelson, K.A. Observation of nanequilibrium carrier distribution inGe, Si and GaAs by terahertz probe measurements. Phys. Rev. B 2010, 81, 035201. [Google Scholar] [CrossRef]
  18. Martyniuk, P.; Rogalski, A. Insight into performance of quantum dot infrared photodetectors. Bull. Polish Acad. Sci. Tech. Sci. 2009, 57, 103–116. [Google Scholar] [CrossRef] [Green Version]
  19. Lepage, D.; Dubowski, J.J. Surface plasmon assisted photoluminescence in GaAs–AlGaAs quantum well microstructures. Appl. Phys. Lett. 2007, 91, 79. [Google Scholar] [CrossRef] [Green Version]
  20. Chen, X.; Fan, W.H.; Chao, S. Multiple plasmonic resonance excitations on graphene metamaterials for ultrasensitive terahertz sensing. Carbon 2018, 133, 416–422. [Google Scholar] [CrossRef]
  21. Cheng, Y.Y.; Wang, Y.Q.; Hu, J.; Li, J.R. A novel eigenvector method for calculation of optical resonator modes and beam propagation. Acta Phys. Sin. 2004, 8, 2576–2582. [Google Scholar] [CrossRef]
  22. Li, J.S.; Tang, Y.; Li, Z.T.; Cao, K.; Yan, C.M.; Ding, X.R. Full spectral optical modeling of quantum-dot-converted elements for light-emitting diodes considering reabsorption and reemission effect. Nanotechnology 2018, 29, 295707. [Google Scholar] [CrossRef]
  23. Kongsuwan, N.; Demetriadou, A.; Chikkaraddy, R.; Benz, F.; Turek, V.A.; Keyser, U.F.; Baumberg, J.J.; Hess, O. Suppressed quenching and strong-coupling of Purcell-enhanced single-molecule emission in plasmonic nanocavities. ACS Photonics 2018, 5, 186–191. [Google Scholar] [CrossRef] [Green Version]
  24. Zhou, B.K.; Chen, T.R.; Gao, Y.Z. The Principle of Laser, 7th ed.; Defense Industry Press: Beijing, China, 2015; pp. 33–38. [Google Scholar]
  25. Levine, B.F. Quantum well infrared photodetectors. J. Appl. Phys. 1993, 74, R1–R81. [Google Scholar] [CrossRef]
  26. Vial, A.; Grimault, A.S.; Macías, D.; Barchiesi, D.; De La Chapelle, M.L. Improved analytical fit of gold dispersion: Application to the modeling of extinction spectra with a finite-difference time-domain method. Phys. Rev. B 2005, 71, 085416. [Google Scholar] [CrossRef]
  27. Rakić, A.D.; Djurišić, A.B.; Elazar, J.M.; Majewski, M.L. Optical properties of metallic films for vertical-cavity optoelectronic devices. Appl. Opt. 1998, 37, 5271–5283. [Google Scholar] [CrossRef]
  28. Moore, W.J.; Holm, R.T. Infrared dielectric constant of gallium arsenide. J. Appl. Phys. 1996, 80, 6939–6942. [Google Scholar] [CrossRef]
Figure 1. Quantum dot detector with the MSM cavity structure.
Coatings 12 00874 g001
Figure 2. Side schematic diagram of quantum dot photodetector with MSM structure.
Coatings 12 00874 g002
Figure 3. Energy loss and absorption coefficient.
Coatings 12 00874 g003
Figure 4. Absorption comparison of the two detectors.
Coatings 12 00874 g004
Figure 5. Optical intensity distribution of the different modes.
Coatings 12 00874 g005
Figure 6. Amplitude distribution of the different modes. (a) TEM00 amplitude distribution; (b) TEM10 amplitude distribution; (c) TEM20 amplitude distribution; (d) TEM30 amplitude distribution; (e) TEM40 amplitude distribution; (f) TEM50 amplitude distribution.
Coatings 12 00874 g006
Figure 7. Influence of line width of cavity on absorption.
Coatings 12 00874 g007
Figure 8. Influence of cavity length on absorption.
Coatings 12 00874 g008
Figure 9. Influence of duty cycle on absorption.
Coatings 12 00874 g009
Figure 10. Absorption coefficient under the different reflectivity of the bottom metal layer.
Coatings 12 00874 g010
Figure 11. Quantum efficiency under the different reflectivity upon top metal grating.
Coatings 12 00874 g011
Figure 12. Dielectric constant of metal material.
Coatings 12 00874 g012
Figure 13. Reflectivity of the top grating under different metal.
Coatings 12 00874 g013
Figure 14. Quantum efficiency under different metals.
Coatings 12 00874 g014
Figure 15. Reflectivity of the bottom metal layer under the different metal.
Coatings 12 00874 g015
Table 1. Comparisons between the two detectors.
-Electrodes StructureDuty Cycle of the Top Metal GratingMaximum Reflectivity upon the Metal Grating (Ag)Reflectivity of the Bottom Metal LayerMaximum of Adsorption CoefficientMaximum of Quantum Efficiency
Detector with MSM structureTop metal grating with square holes and bottom film metal layer0.20.342810.96660.4048
Convetional detectorTop ring electrode and bottom ring electrode0000.10.0952
Publisher’s Note: MDPI stays neutral with regard to jurisdictional claims in published maps and institutional affiliations.

