Article

Thermal Swing Evaluation of Thermal Spray Coatings for Internal Combustion Engines

by
Wellington Uczak de Goes
*,
Nicolaie Markocsan
and
Mohit Gupta
Department of Engineering Science, Division of Subtractive and Additive Manufacturing, University West, 46186 Trollhättan, Sweden
*
Author to whom correspondence should be addressed.
Coatings 2022, 12(6), 830; https://doi.org/10.3390/coatings12060830
Submission received: 19 April 2022 / Revised: 8 June 2022 / Accepted: 10 June 2022 / Published: 13 June 2022

Abstract

:
The efficiency of internal combustion engines is gaining increased interest due to the impact of fuel consumption on greenhouse gas emissions and the goals of countries to minimize emissions. Thermal barrier coatings (TBCs) have shown great potential in improving the efficiency of internal combustion engines. The TBCs, applied on the surface of the piston, apart from thermal isolation, should also follow the surface temperature variations in the combustion chamber, reducing the energy loss and not affecting volumetric efficiency, and thus accomplish a raise in fuel efficiency. This characteristic of the TBC can be associated with the thermal properties, but the best performance test for TBCs is the single cylinder engine test. The single cylinder engine test is an expensive and time demanding procedure, making it not easily accessible. The purpose of this work was to develop a thermal swing test method to evaluate the applicability of TBCs in the combustion chamber of an internal combustion engine. This was carried out by measuring the temperature variation on the surface of the coating (thermal swing response) exposed to heat pulses from a high velocity air fuel (HVAF) spray torch. The TBCs were tested as sprayed (AS) and after grinding them to reduce roughness (RR) in order to ensure similar thickness and roughness along the different TBCs. Characterization of the coating microstructure was carried by scanning electron microscopy (SEM) together with image analysis techniques, and the thermal properties were measured by laser flash analysis (LFA). By correlating the thermal swing response with the microstructure and thermal properties of the coatings, it was determined that the coatings with large open pores exhibited the highest thermal swing response, which was as high as 200 °C.

1. Introduction

The commitment of the European Union to global climate action defined by the Paris agreement has led the EU countries to set impressive targets for reaching net-zero greenhouse gas emissions by 2050 [1]. Hence, improvements in the efficiency of internal combustion engines (ICE) are gaining momentum, especially utilizing the combustion energy more efficiently [2,3]. If the combustion energy is not dissipated into the engine e.g., heat losses to the cylinder, cooling fluid, and exhaust, more energy can be converted to the power transmitted to the wheels which results in lower fuel consumption. Therefore, better use of combustion energy may contribute to achieving the net-zero emission targets because lower fuel consumption correlates directly with lower emissions levels.
In recent years, to achieve lower combustion-energy losses thermal barrier coatings (TBCs) have been extensively studied for ICE applications. TBCs are multi-layered coatings applied to the material surface with the primary purpose of providing thermal insulation to the substrate [4]. The first layer of the TBC is the bond coat, functioning as a transition layer between the metallic substrate and the next layer comprising ceramic [5]. The bond coat possesses high oxidation resistance and improves the adherence of the coatings. The second layer is the top coat. This coating serves as the high temperature resistance layer and consists of a low thermal conductivity ceramic material [6].
TBCs have demonstrated good results when designed either as a low heat rejection coating [7,8,9,10,11] or as a fast heat response coating [3,12,13,14]. The low heat rejection coatings cause the combustion energy to be retained inside the engine’s combustion chamber because they have low thermal conductivity. This combined with a reduction in cooling because of the low heat transfer has led to higher engine efficiency. However, past research works has revealed that due to fuel entrapment in the pores of the TBCs, and an increase in the heat of the walls resulting in lower volumetric efficiency, the engine efficiency was negatively affected. In the case of the fast heat response coating or as introduced by Kosaka et al. [12] thermal swing insulation, improved engine efficiency was associated with low thermal conductivity, and low thermal effusivity coatings that have a large change in surface temperature across the whole engine cycle (intake, compression, power, and exhaust). A lower surface temperature on the intake improved the volumetric efficiency in comparison to the low heat rejection coating because the lower surface temperature admitted more air into the combustion chamber leading to a rise in volumetric efficiency. Furthermore, during combustion the rapid-temperature increase on the surface provided similar insulation benefits as the low heat rejection coating, allowing the combustion energy to be retained inside the engine’s combustion chamber.
Utilizing the concept established by Kosaka et al. [12], a porous alumina coating with columnar structure, anodized in an aluminum alloy piston was employed by Kawaguchi et al. [13]. With the use of this porous columnar structure, an improvement of around 2% in fuel consumption was experimentally validated. Andruskiewicz et al. [14] expanded upon this study by developing a thermal wall temperature swing model to investigate the effects of various coatings on the temperature swing values. From this study, it was observed that if a coating possesses an elevated thermal swing temperature, around 30% of the combustion energy that was previously lost to the environment could be recovered and improved volumetric efficiency could be achieved. Under these conditions, improvements in the net specific fuel consumption of up to 2.5% were observed.
To achieve the thermal swing, insulated porous coatings using Gadolinium Zirconate (GZO) feedstock were produced with Suspension Plasma Spray (SPS), as previously identified by the authors [3]. To expand the investigation, highly porous coatings that would withstand the harsh ICE environment were produced, using porous former feedstock sprayed by an Atmospheric Plasma Spray (APS). These coatings were previously explored for aerospace applications and demonstrated good cohesion and an elevated number of large open pores [15,16]. The large open pores allow fuel to quickly penetrate and leave the coating pores, avoiding the fuel entrapment issue identified in the low heat rejection coating.
To evaluate these coatings the TBCs should be applied to the piston surface and investigated in a single cylinder engine test. However, running engine tests for each coating combination with interesting characteristics for the application is not a possibility at the research level. Therefore, to simulate the actual operating conditions, the thermal swing test was introduced by Saputo et al. [17]. In this test, the coating surface temperature variation (thermal swing response) due to the cooling in the back of the sample and the rapid heat pulse in the front using a high velocity oxy fuel (HVOF) spray torch, was evaluated. The surface temperature was measured with an infrared thermal camera and after the stabilization of the temperature fluctuation on the surface, the difference between the maximum and minimum average temperature was assumed to be the thermal swing response of the coating.
In this study, a similar test to the thermal swing test determined by Saputo et al. [17] was developed to assess the applicability of the coating in the combustion chamber of an internal combustion engine, using the measurement of the coating’s thermal swing response. However, in the present study the rapid heat pulse was generated by an HVAF spray torch which had a different flame temperature and velocity than the HVOF gun used in [17]. Three TBCs were utilized in this work, two were produced using Atmospheric Plasma Spraying (APS) with a feedstock that consisted of YSZ or GZO together with polyester to achieve high porosity coatings with large open pores. Such coatings have not previously been explored for automotive application. The third TBC was produced by a Suspension Plasma Spray (SPS) using a feedstock of GZO suspended in ethanol with a solid load of 25 wt.%. To validate the tests the coatings were tested with different samples, multiple times, as sprayed (AS), and with reduced roughness (RR). According to the testing of the different materials, the coatings with large open pores presented the best thermal swing performance, and exhibited great applicability in the next phase of experiments, the single cylinder engine tests.

2. Experimental

2.1. Feedstock Materials and Coating Production

The feedstock materials investigated in this study were all produced by Oerlikon Metco (Wohlen, Switzerland) and are listed in Table 1. Different material routes were undertaken to obtain a porous microstructure. The feedstocks were commercially available except for the GZO ethanol suspension 25 wt.% (AE 12413).
Two TBC types were used in this work. The APS process was applied to produce the first TBC type with a lamellar coating microstructure using the F4-MB gun from Oerlikon Metco. The bond coat was produced using a feedstock of NiCrAlY (Amdry 365-4). Two different top coats were produced for this TBC type; the first, APS Poly/YSZ used the commercially available Metco 2460 NS, an agglomerated feedstock of YSZ and polyester particles. The second top coat for the first TBC type was the APS Poly/GZO which used a blended feedstock made inhouse (mechanical blending) of two commercially available feedstocks, the Metco 6042, a GZO feedstock, and the Metco 600 NS-1, a polyester feedstock. To ensure comparable results the quantity of polyester added to the APS Poly/GZO was 4 wt.%, the same as in the APS Poly/YSZ.
The second TBC type had an HVAF bond coat and an SPS top coat. The M3 gun from Uniquecoat Technologies was utilized to produce the bond coat with a feedstock of NiCoCrAlY (Amdry 386). The top coat was produced with an Axial III gun from Northwest Mettech Corp (Surrey, Canada) utilizing a GZO suspension in ethanol with a solid load of 25 wt.% (AE 12413).
Low carbon steel was used as a substrate as round coupons with 25.4 mm in diameter and 6 mm in thickness for microstructure evaluation, and plates with 75 mm × 75 mm × 2.5 mm for the thermal swing test. Plates of Hastelloy-X with 25 mm × 25 mm × 1.54 mm were also produced for the thermal property evaluation by Laser Flash Analysis.
The coupons were sprayed using a rotating fixture. Before the spraying, the substrates were grit blasted with alumina grit to a surface roughness (Ra) of around 3 µm. Following the grit blasting, the bond coat was sprayed and then the top coat.
For some samples, an additional step was defined to reduce the thickness and roughness. This was carried out because thickness and surface roughness differences can significantly affect the measurements [17,18]. An iterative procedure to achieve similar thicknesses and roughness along the different coatings was defined. This procedure used a carbimet grit 360 (Buehler Ltd., Lake Bluff, IL, USA) grinding paper followed by the measurement of the thickness with a micrometer (Mitutoyo Europe GmbH, Neuss, Germany), and the measurement of the roughness was carried out with a Surftest SJ-301 (Mitutoyo Europe GmbH, Neuss, Germany) surface profilometer.

2.2. Coating Characterization

To preserve the integrity of the coatings, two epoxy mountings under vacuum were performed for the metallographic preparation. The first mounting used a low-viscosity epoxy resin Logitech 2-part Epoxy Pack 301 (Logitech Materials Technologists and Engineers, Glasgow, UK). Following this, the samples were cut using the Struers Secotom 10 (Struers Ltd., Ballerup, Denmark) precision cutting machine. After the samples were sectioned, the second mounting employing a high-viscosity resin Buehler EpoThin 2 Epoxy (Buehler Ltd., Lake Bluff, IL, USA) was performed to ensure adequate handling of the sample. The final procedure was the successive grinding and polishing steps employing the Buehler Power Pro 5000 (Buehler Ltd., Lake Bluff, IL, USA).
The presence of open pores in the surface of the coating was measured using the software ImageJ, and the result was the average of ten 500x magnification images along different areas of the surface of the coating. The thickness measurements of the as-sprayed and with-reduced-roughness coatings were performed on the cross-sectioned micrographs of one of each type of coupon using an SEM TM 3000 (HITACHI Ltd., Tokyo, Japan). Along the cross-section of the sample 20 measurements were performed on five 300× magnification images, and the average was calculated.
The porosity of the coating was measured on the cross section with the two-magnification step image analysis procedure, as presented in [19]. For the coarse porosity, with pores larger than 2 µm2, a 500× magnification was employed. For the fine porosity with pores smaller than 2 µm2 a 5000× magnification was employed. Each coating was measured ten times along different areas of the coating cross section for the lower and the higher magnifications, the total porosity was the sum of the fine and coarse porosity.
The surface roughness of the as-sprayed coating and with-reduced-roughness was performed with the Surftest SJ-301 (Mitutoyo Europe GmbH, Neuss, Germany) using a stylus-based surface profilometer, in accordance with ISO 4288. To ensure the reliability of the results, ten measurements were carried out on each sample.

2.3. Thermal Properties

Laser Flash Analysis (LFA) was used to evaluate the thermal properties of the coatings with a Netzsch Laser Flash Apparatus, LFA 427 (Netzsch, Selb, Germany). First, the samples were cut with a water jet to round coupons of 10 mm in diameter. The reduced samples were subsequently coated with a carbon paint and placed in the LFA equipment where a laser pulse irradiated the sample’s rear side. This heat pulse created a heat flux through the sample that was detected on the front side of the sample with an IR detector. Based on the IR detector information the thermal diffusivity was defined. The detailed procedure was presented in [20].
Based on the thermal diffusivity results, the thermal conductivity was calculated according to Equation (1):
λ = α C p ρ
where ‘λ’ is the thermal conductivity (W/(mK)), ‘α’ is the thermal diffusivity (m2/s), ‘Cp’ is the specific heat capacity (J/(gK)) and ‘ρ’ is the coating density (g/m3).
Due to the application of these coatings in ICE, the dissipation of the heat is a fundamental property to be considered. Thus, the thermal effusivity, the thermal property that defines the heat dissipation was calculated [3]. Based on the thermal conductivity values, the thermal effusivity was calculated according to Equation (2).
e = λ ρ C p
where ‘e’ is the thermal effusivity (J/(s1/2m2K)).
The coating density used in the previous formulations was calculated with Equation (3), based on the density of bulk material and the measured porosity of the coatings.
ρ = ( 100 total   porosity   ( % ) 100 ) ( density   of   the   fully   dense   coating )
The density of the fully dense coating was taken from the literature as 6.1 g/cm3 for the YSZ and 6.32 g/cm3 for the GZO coating [21]. The specific heat capacity value here was used from previous differential scanning calorimetry measurements reported in [21].

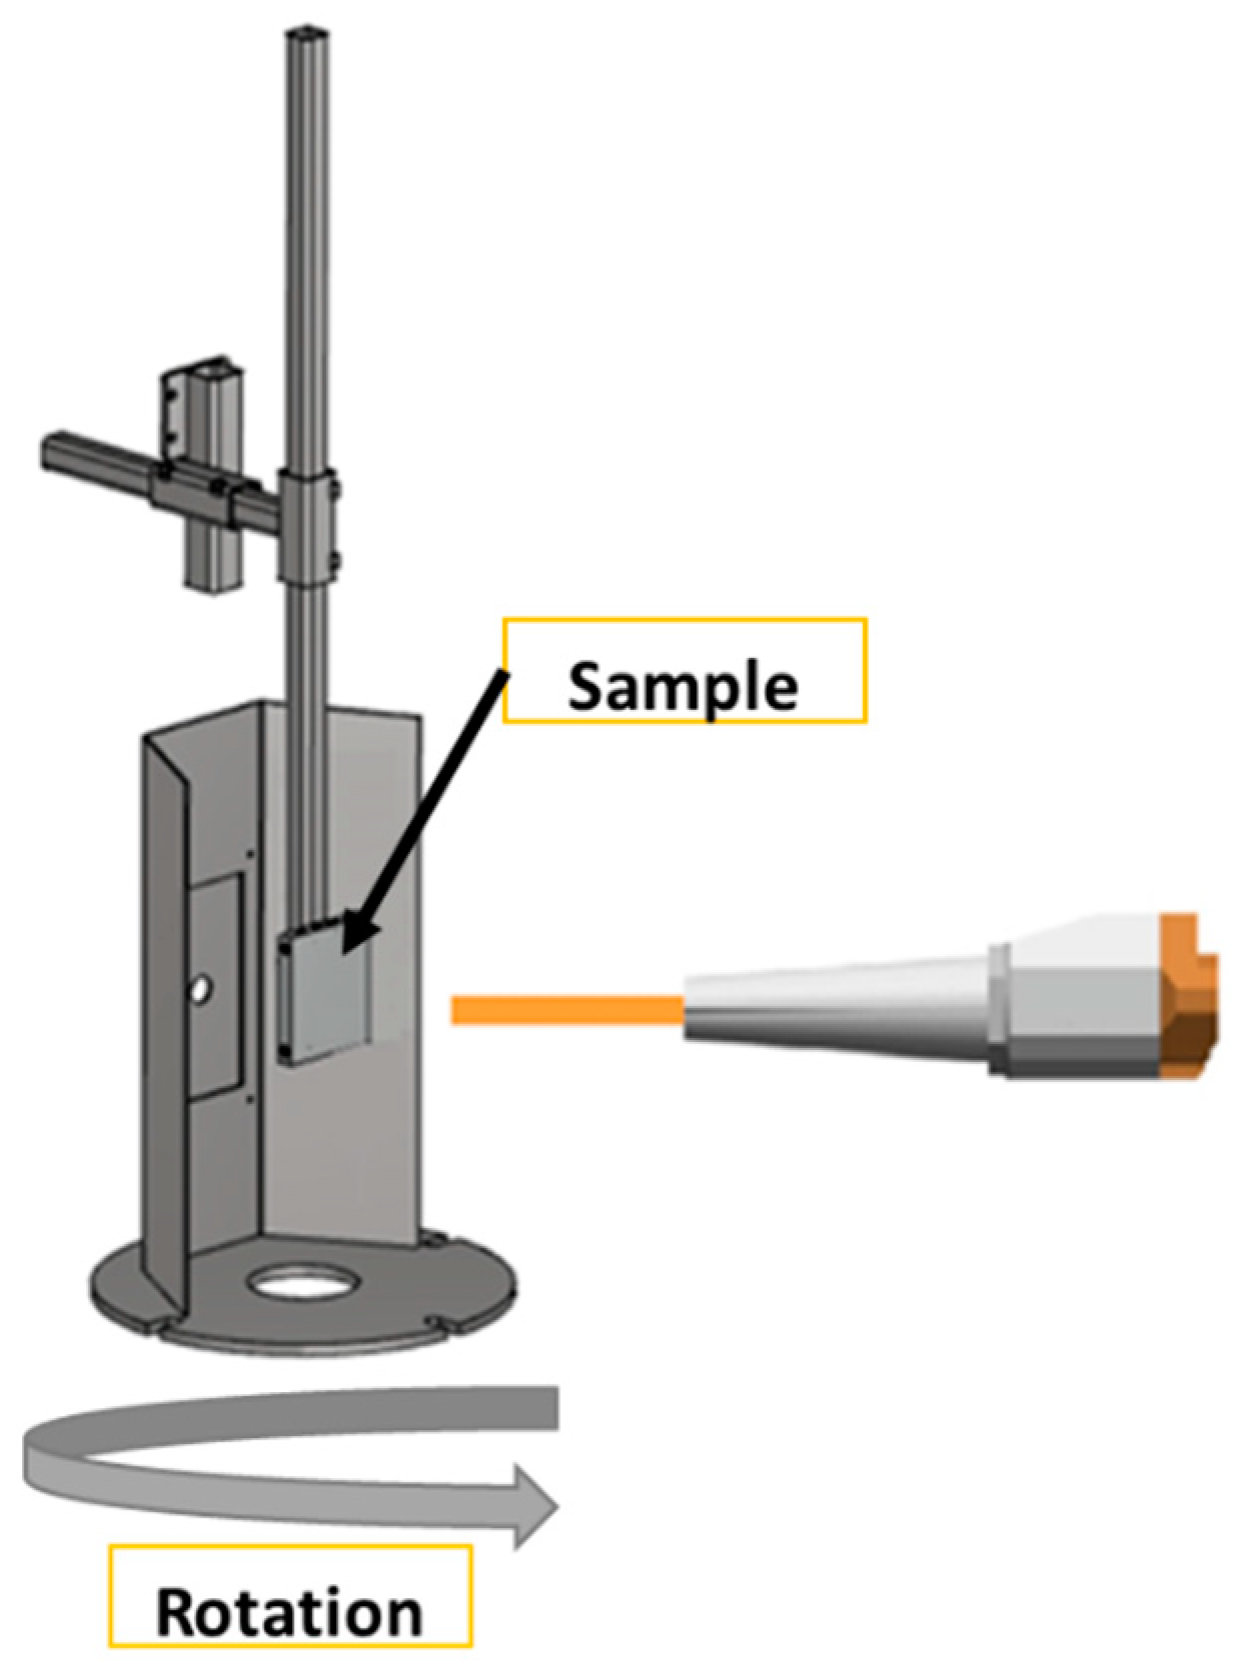
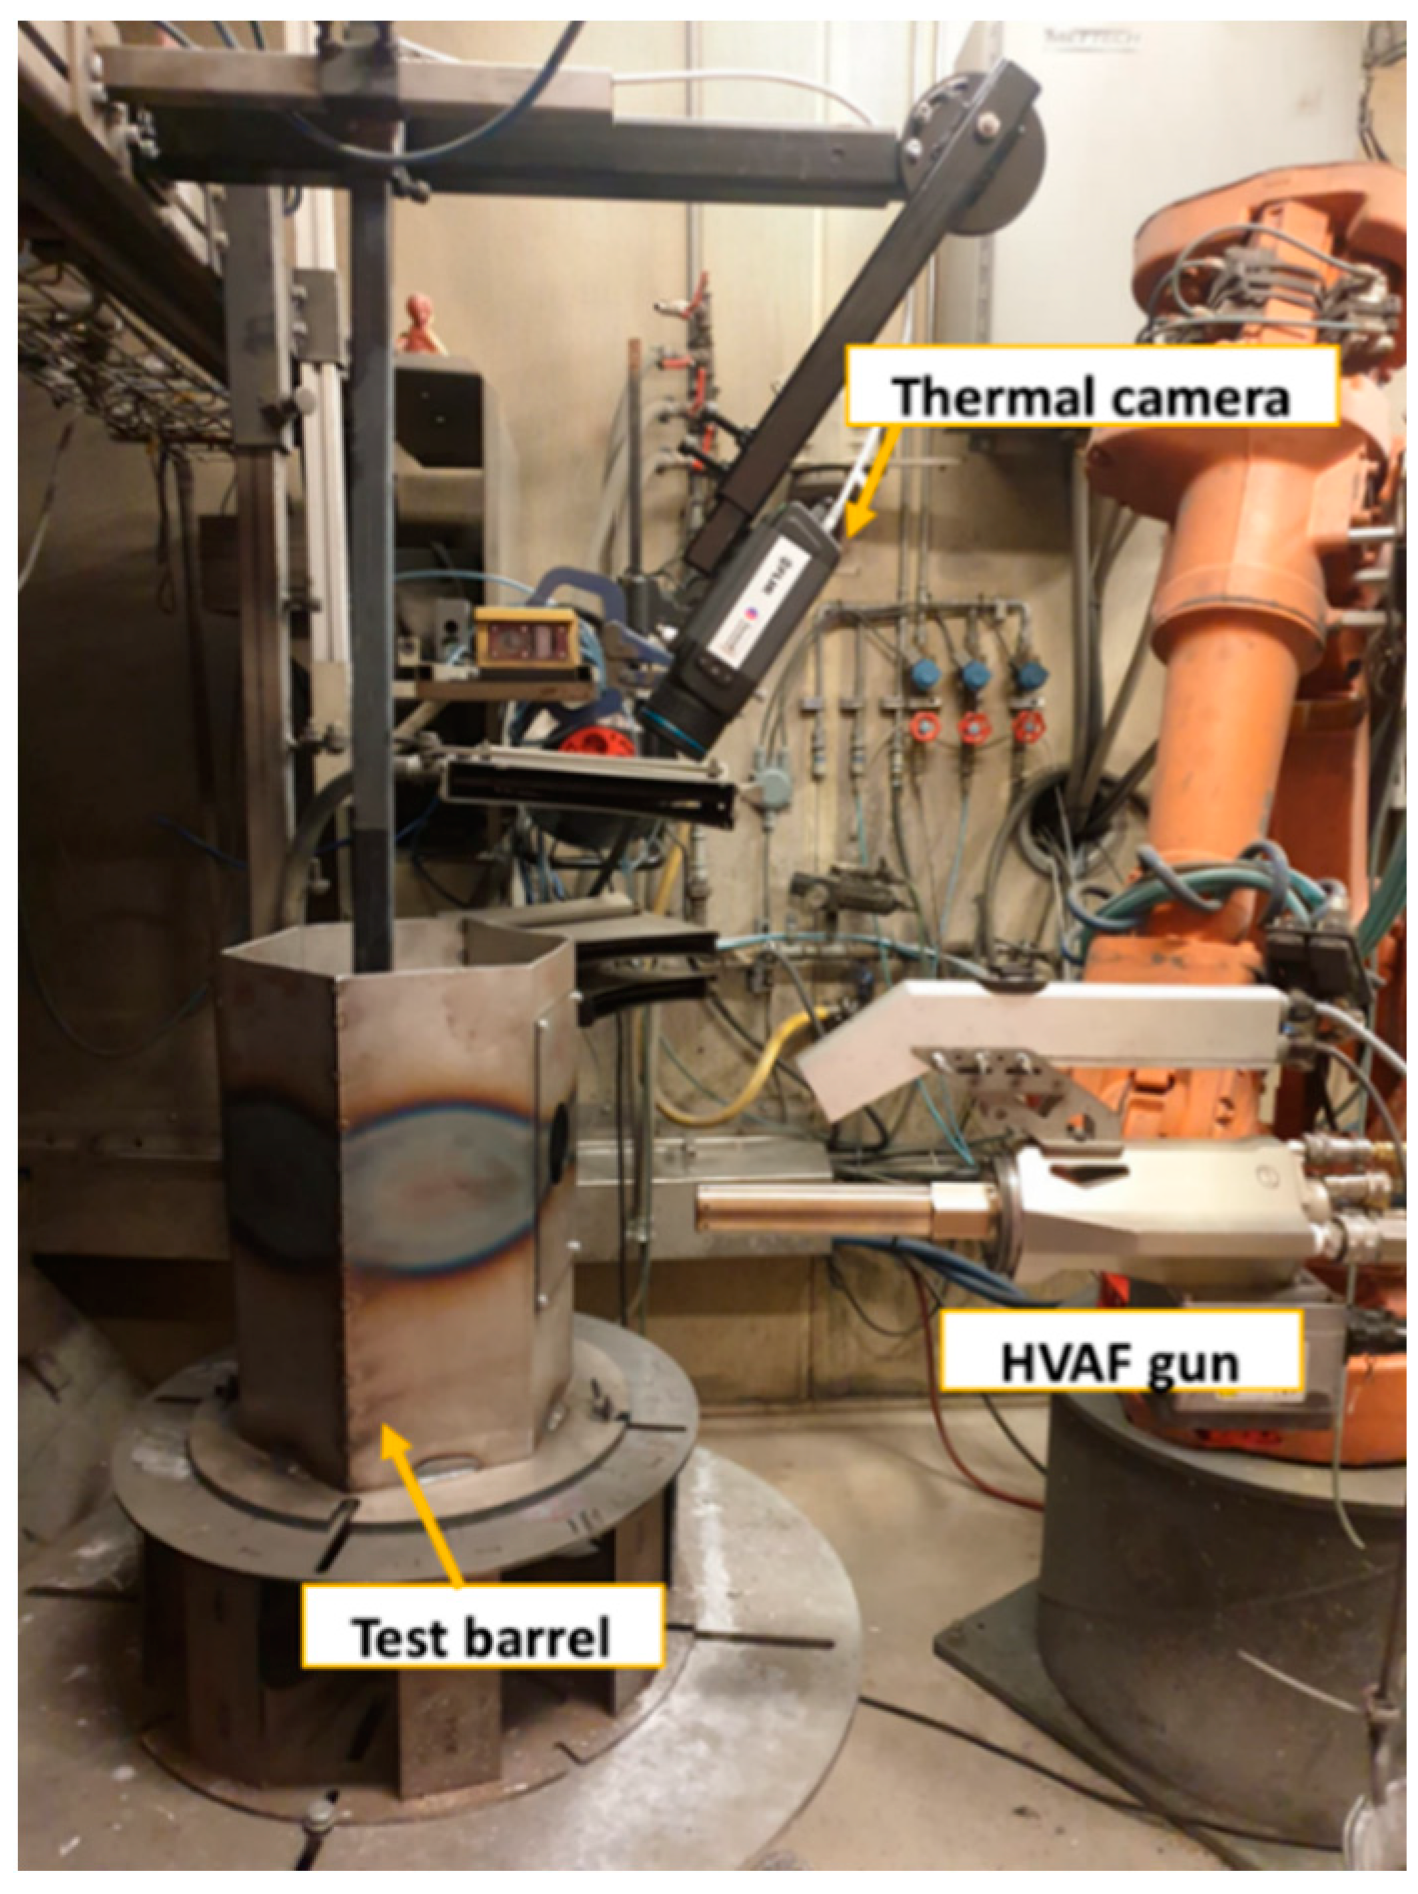
2.4. Thermal Swing Test

Due to the difficulties in preparing and testing coatings inside the combustion chamber of ICE, an experimental test method was developed to evaluate the coating’s behavior in working conditions similar to a combustion chamber. The experimental setting is illustrated in Figure 1 and an image of the test setting with the components is in Figure 2. The test was based on the concept introduced by Saputo et al. [17].
The test is based on a short exposure of the sample surface to the high temperatures of a flame produced by an HVAF torch, positioned 200 mm away from the barrel, through a 25 mm diameter hole in a barrel rotating at 100 RPM. The barrel has a hexagonal shape with a 300 mm long diagonal, its main role is to protect the sample from the flame along with a complete rotation and to allow only a short heat pulse through the hole when it passes the flame. During the test the sample is cooled from the back side with a forced air-cooled aluminum plate, reproducing the cooling conditions of the oil channels inside of a piston. The variation of the temperature during the fast heating and cooling process was measured with a FLIR A655SC infrared (IR) thermal camera as shown in Figure 2.
Stabilization of the surface temperature fluctuation i.e., minimum and maximum temperature, was reached after around 3 min of the test for all the investigated samples. For the coatings tested in this work, the maximum surface temperature was up to 500 °C. After the stabilization, using the software provided by FLIR ResearchIR (Version 4.40.11.359), the average temperature was measured on the surface of the sample, during each rotation for a period of 30 s. The thermal swing response was found as the difference between the maximum and the minimum recorded temperature in each heating and cooling cycle (rotation). To ensure the reliability of the test, the same sample was tested twice at the beginning of the test and the end of the test, and two samples with identical coatings were tested. The average of all test campaigns is presented in the results section.

3. Results and Discussion

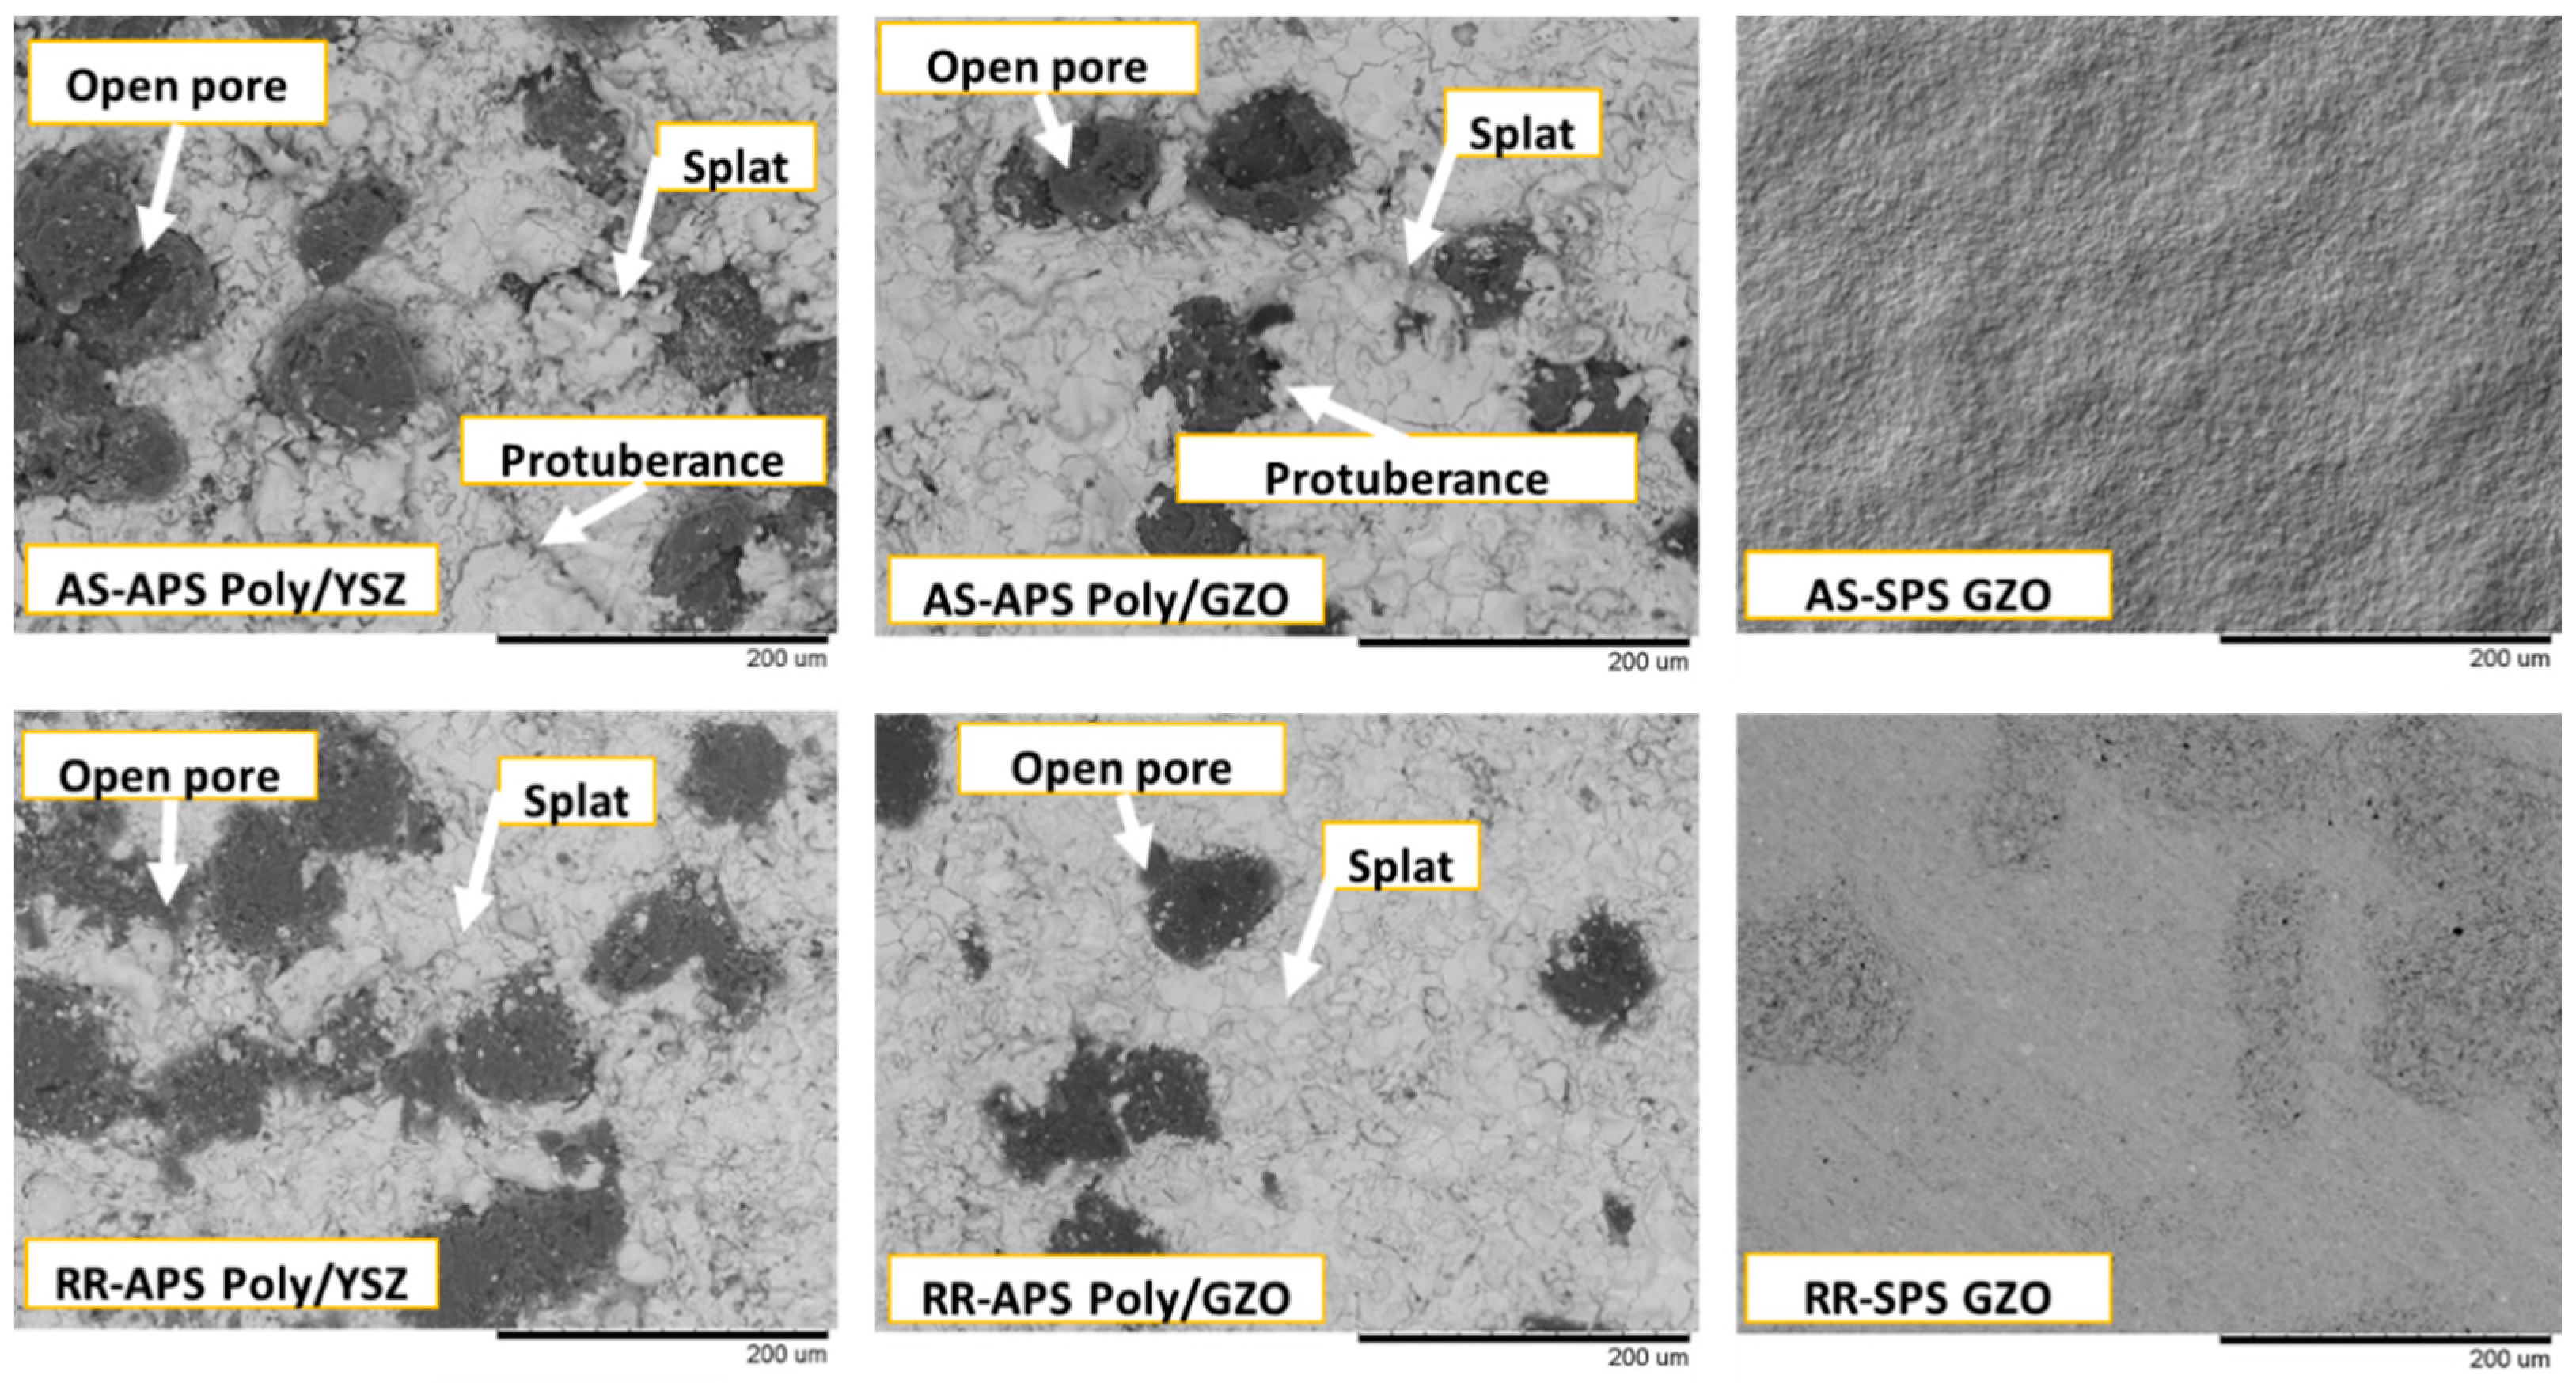
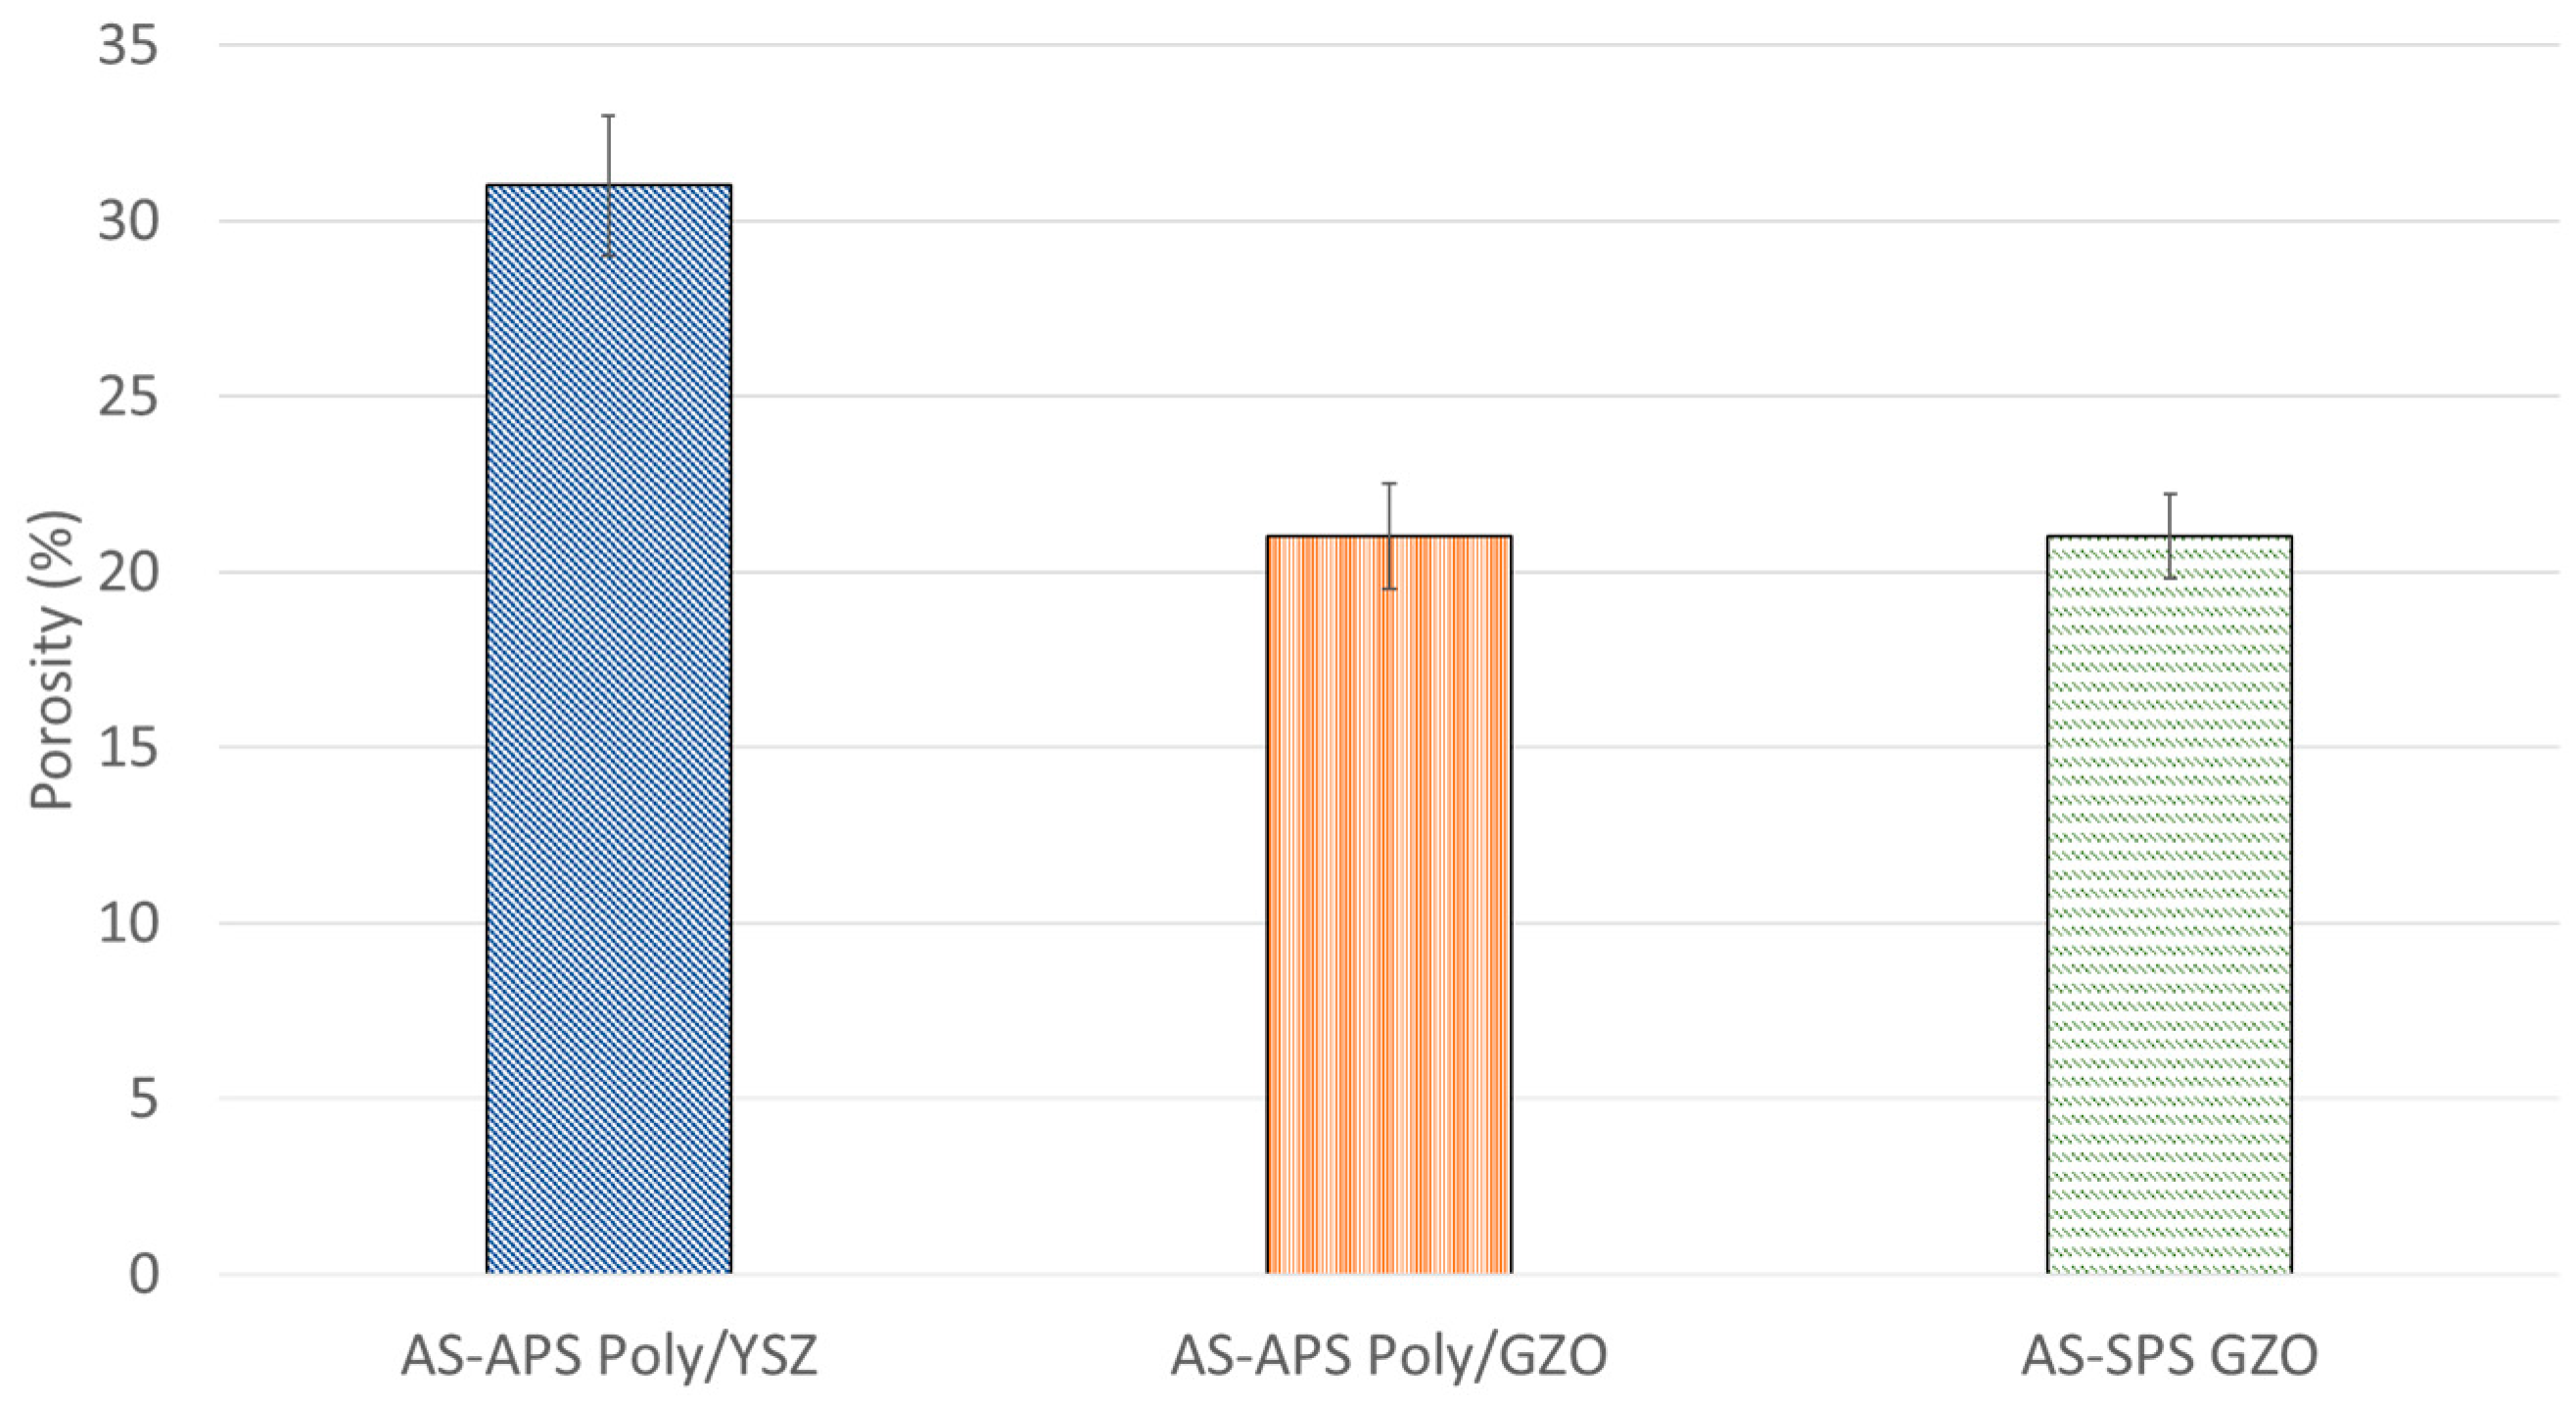
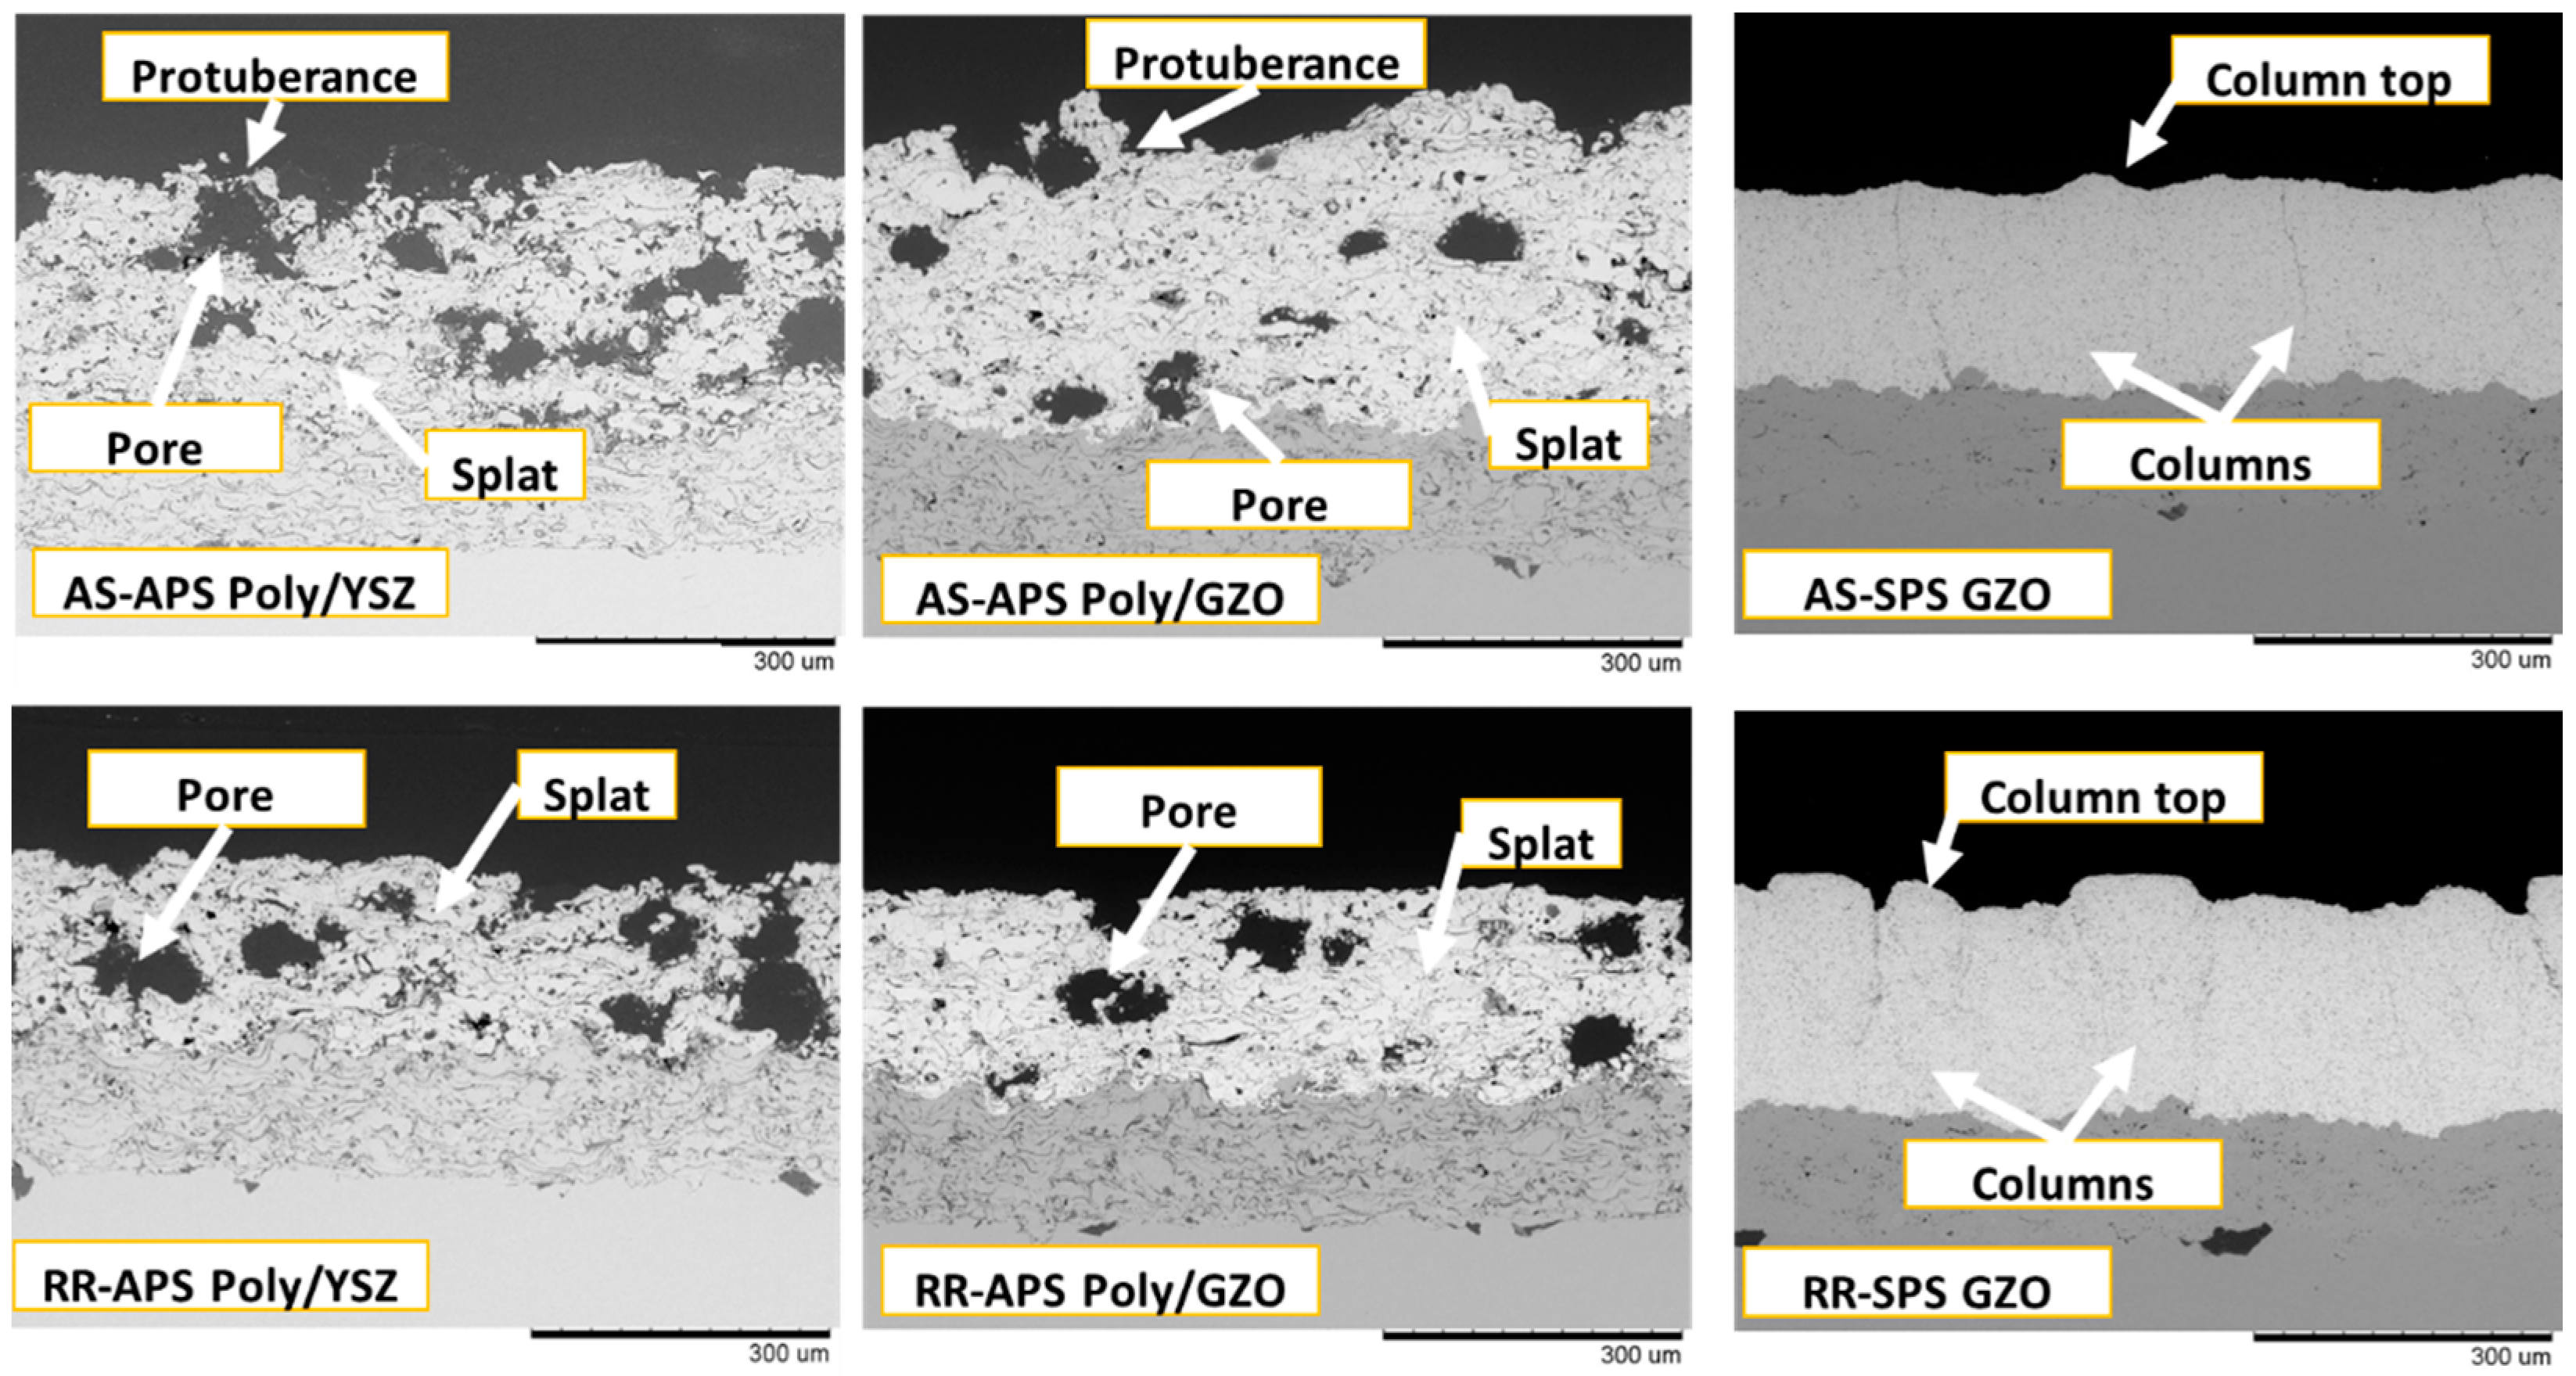
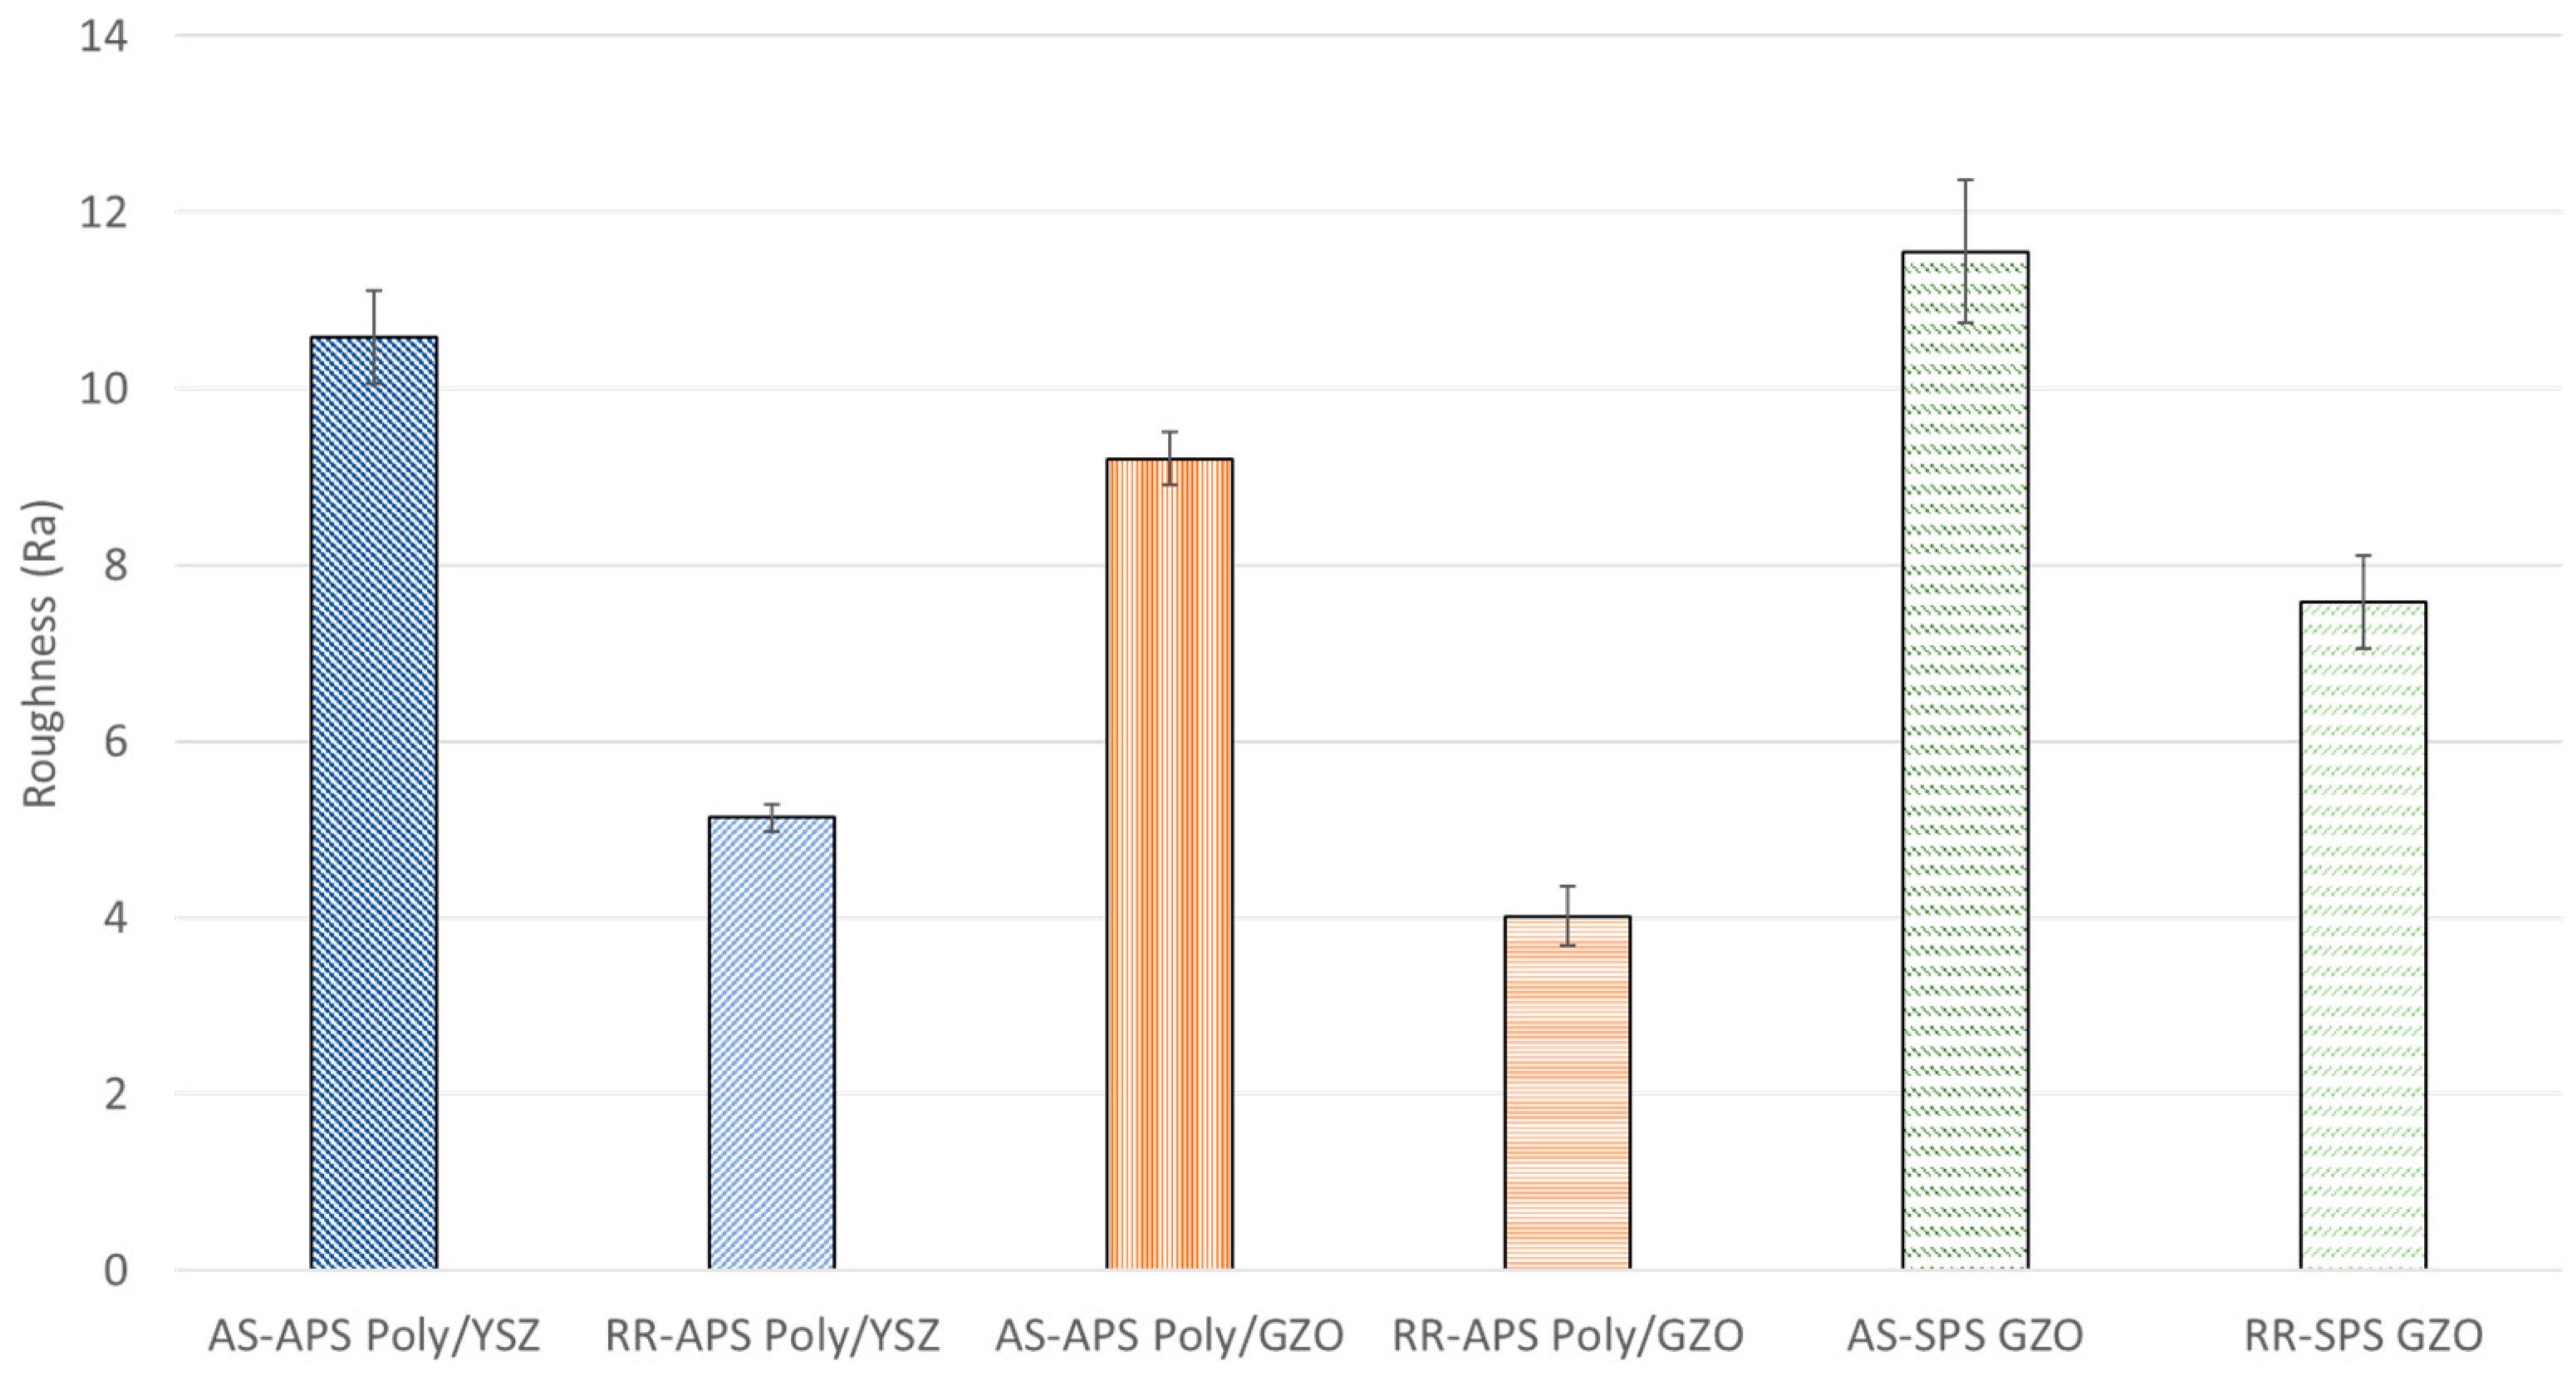
3.1. Coating Characterization

The surface of all coatings, as sprayed (AS) in the top row and with reduced roughness (RR) in the bottom row, were investigated and are shown in Figure 3.
The APS coatings (Figure 3), reveal characteristic features of these coatings. Larger particles/splats i.e., molten particles deformed on impact into a pancake shape, were observed. Large open pores (formed from the polyester particles) were also be observed. For the samples with reduced roughness, the splats and large open pores were also visible, but the splats were less contoured, as evidence of the removal of the less deformed splats (protuberances) from the top of the coatings during the grinding of the surface of the coatings. Comparing the different compositions of the APS coatings, the APS Poly/YSZ revealed a greater amount of large open pores in the coating compared to the APS Poly/GZO. This was also confirmed by the measurement of the large open pores (large black spots) on the surface with the ImageJ software. For the APS Poly/YSZ 37 ± 3% of the coating surface was composed of large open pores, and 23 ± 2% for the APS Poly/GZO. This difference could be attributed to the different morphology of the powder particles that resulted from different the manufacturing routines of the feedstock. As presented in Section 2.1, the APS Poly/YSZ was manufactured via agglomeration and the APS Poly/GZO was mechanically blended. With the agglomerated powder it was difficult to burn out the polyester completely from the coating as it might be surrounded by YSZ particles, and in the blended powder, the non-homogenous mixing allowed the polyester to burn off more easily. Gupta et al. [22] also observed that agglomerated coatings with polyester resulted in a porous microstructure with the large open pores retained in a homogenous distribution.
The SPS characteristics were also observed on the coating surface of the SPS samples. The SPS process used a feedstock that was composed of much smaller particles, of nanometric or submicrometric size, thus fine features (small particles/splats) were mostly present on the top of the SPS samples along with a waviness of the surface, indicating the top of the columns that form in the SPS process.
To continue the microstructure analysis, in Figure 4 the cross-section microstructures of the coatings are shown, as previously in Figure 3, with AS coatings on the top row and RR coatings on the bottom row.
The APS coatings presented in Figure 4, revealed a typical microstructure of a YSZ+ porosity former coating with lamellar splats and the presence of pores distributed evenly along the whole cross-section [16,22]. A smooth surface was observed on the RR coatings as an effect of the lack of protuberances on the surface due to the grinding procedure. As seen in Figure 3, the APS Poly/YSZ presents a larger number of open pores in the coating compared to the APS Poly/GZO, confirming the observations carried out on the surface images of the samples and revealing the effect of the powder morphology on the amount of large open pores retained in the coatings.
In the SPS coatings, as in the AS coating, the characteristic columns, small sized porosity, and the column tops were observed. However, after the procedure to reduce the roughness, broken column tops could be seen in the RR coatings. This may be due to the nature of GZO which is a brittle ceramic material, i.e., as the grit from the grinding paper plows through the column top, a crack can be formed leading to the removal of the column top, as can be seen in Figure 4.
The porosity results of the AS coatings are presented in Figure 5.
From Figure 5, the highest porosity was observed in the APS Poly/YSZ coating followed by the APS Poly/GZO coating, and the lowest porosity in the SPS GZO coating. As expected, the highest porosity was observed for the coatings produced with porosity former, due to the formation of large globular pores as shown in Figure 3 and Figure 4. In this study, the lowest porosity was measured in the SPS GZO coatings although the SPS process is capable of producing high porosity coatings. These values are rather modest in comparison with the porosity that the porosity former feedstock generated. Efforts to increase the porosity in the SPS coatings might result in weakening the cohesion strength of the coatings and thus to a premature failure of the coating in engine tests.
The roughness values measured on the AS and RR coatings are displayed in Figure 6.
As can be seen in Figure 6, the APS Poly/YSZ and APS Poly/GZO coatings showed more than half of the surface roughness reduction after grinding i.e., AS vs. RR. Although there was no large difference between all three AS coatings, the highest roughness was measured on the SPS GZO coating. This could be related to the columnar structure, specifically to the column tops that were seen in Figure 3 and Figure 4. The least roughness was seen in the APS coatings. The low roughness of these coatings may be due to the presence of splats, and the reduction of the roughness after grinding due to the removal of the less deformed splats (protuberances) from the top of the coatings.

3.2. Thermal Properties

The thermal properties of the as-sprayed coatings are shown in Table 2. The thermal conductivity and thermal effusivity values follow the same trend, with the highest thermal properties for the SPS GZO, followed by the APS Poly/YSZ, and with the lowest thermal conductivity and effusivity in the APS Poly/GZO.
The lower thermal properties of the APS coatings are related to the lamellar microstructure comprised of stacked splats combined with the large pores, as shown previously in Section 3.1. The inter-splat boundaries (parallel to the coating’s surface) together with the large pores create a barrier of high resistance to the heat flow that tends to traverse the coating (perpendicularly to the coating’s surface) [16,23,24]. Among the APS coatings, the APS Poly/GZO showed the lowest thermal properties. This may be related to the lower thermal conductivity in bulk of the GZO compared to the YSZ [21,25,26]. The SPS GZO presented the highest thermal properties, and this is related to the different microstructure as seen previously in Section 3.1, in which there is the presence of small pores and a lack of lamellar porosities. The total porosity influences the thermal properties of the coatings due to the volume of a lower thermal conductivity gas inside the coating, and due to the intrinsic increase of phonon scattering within the porosities [27,28].
The thermal properties were measured in the as-sprayed coatings and assumed the same for the reduced-roughness samples, as thermal conductivity and thermal effusivity are properties dependent on the coating microstructure [20]. Since the samples were sprayed at the same time and only the thickness and surface roughness were changed it was presumed that there would be no change in the coating thermal properties.

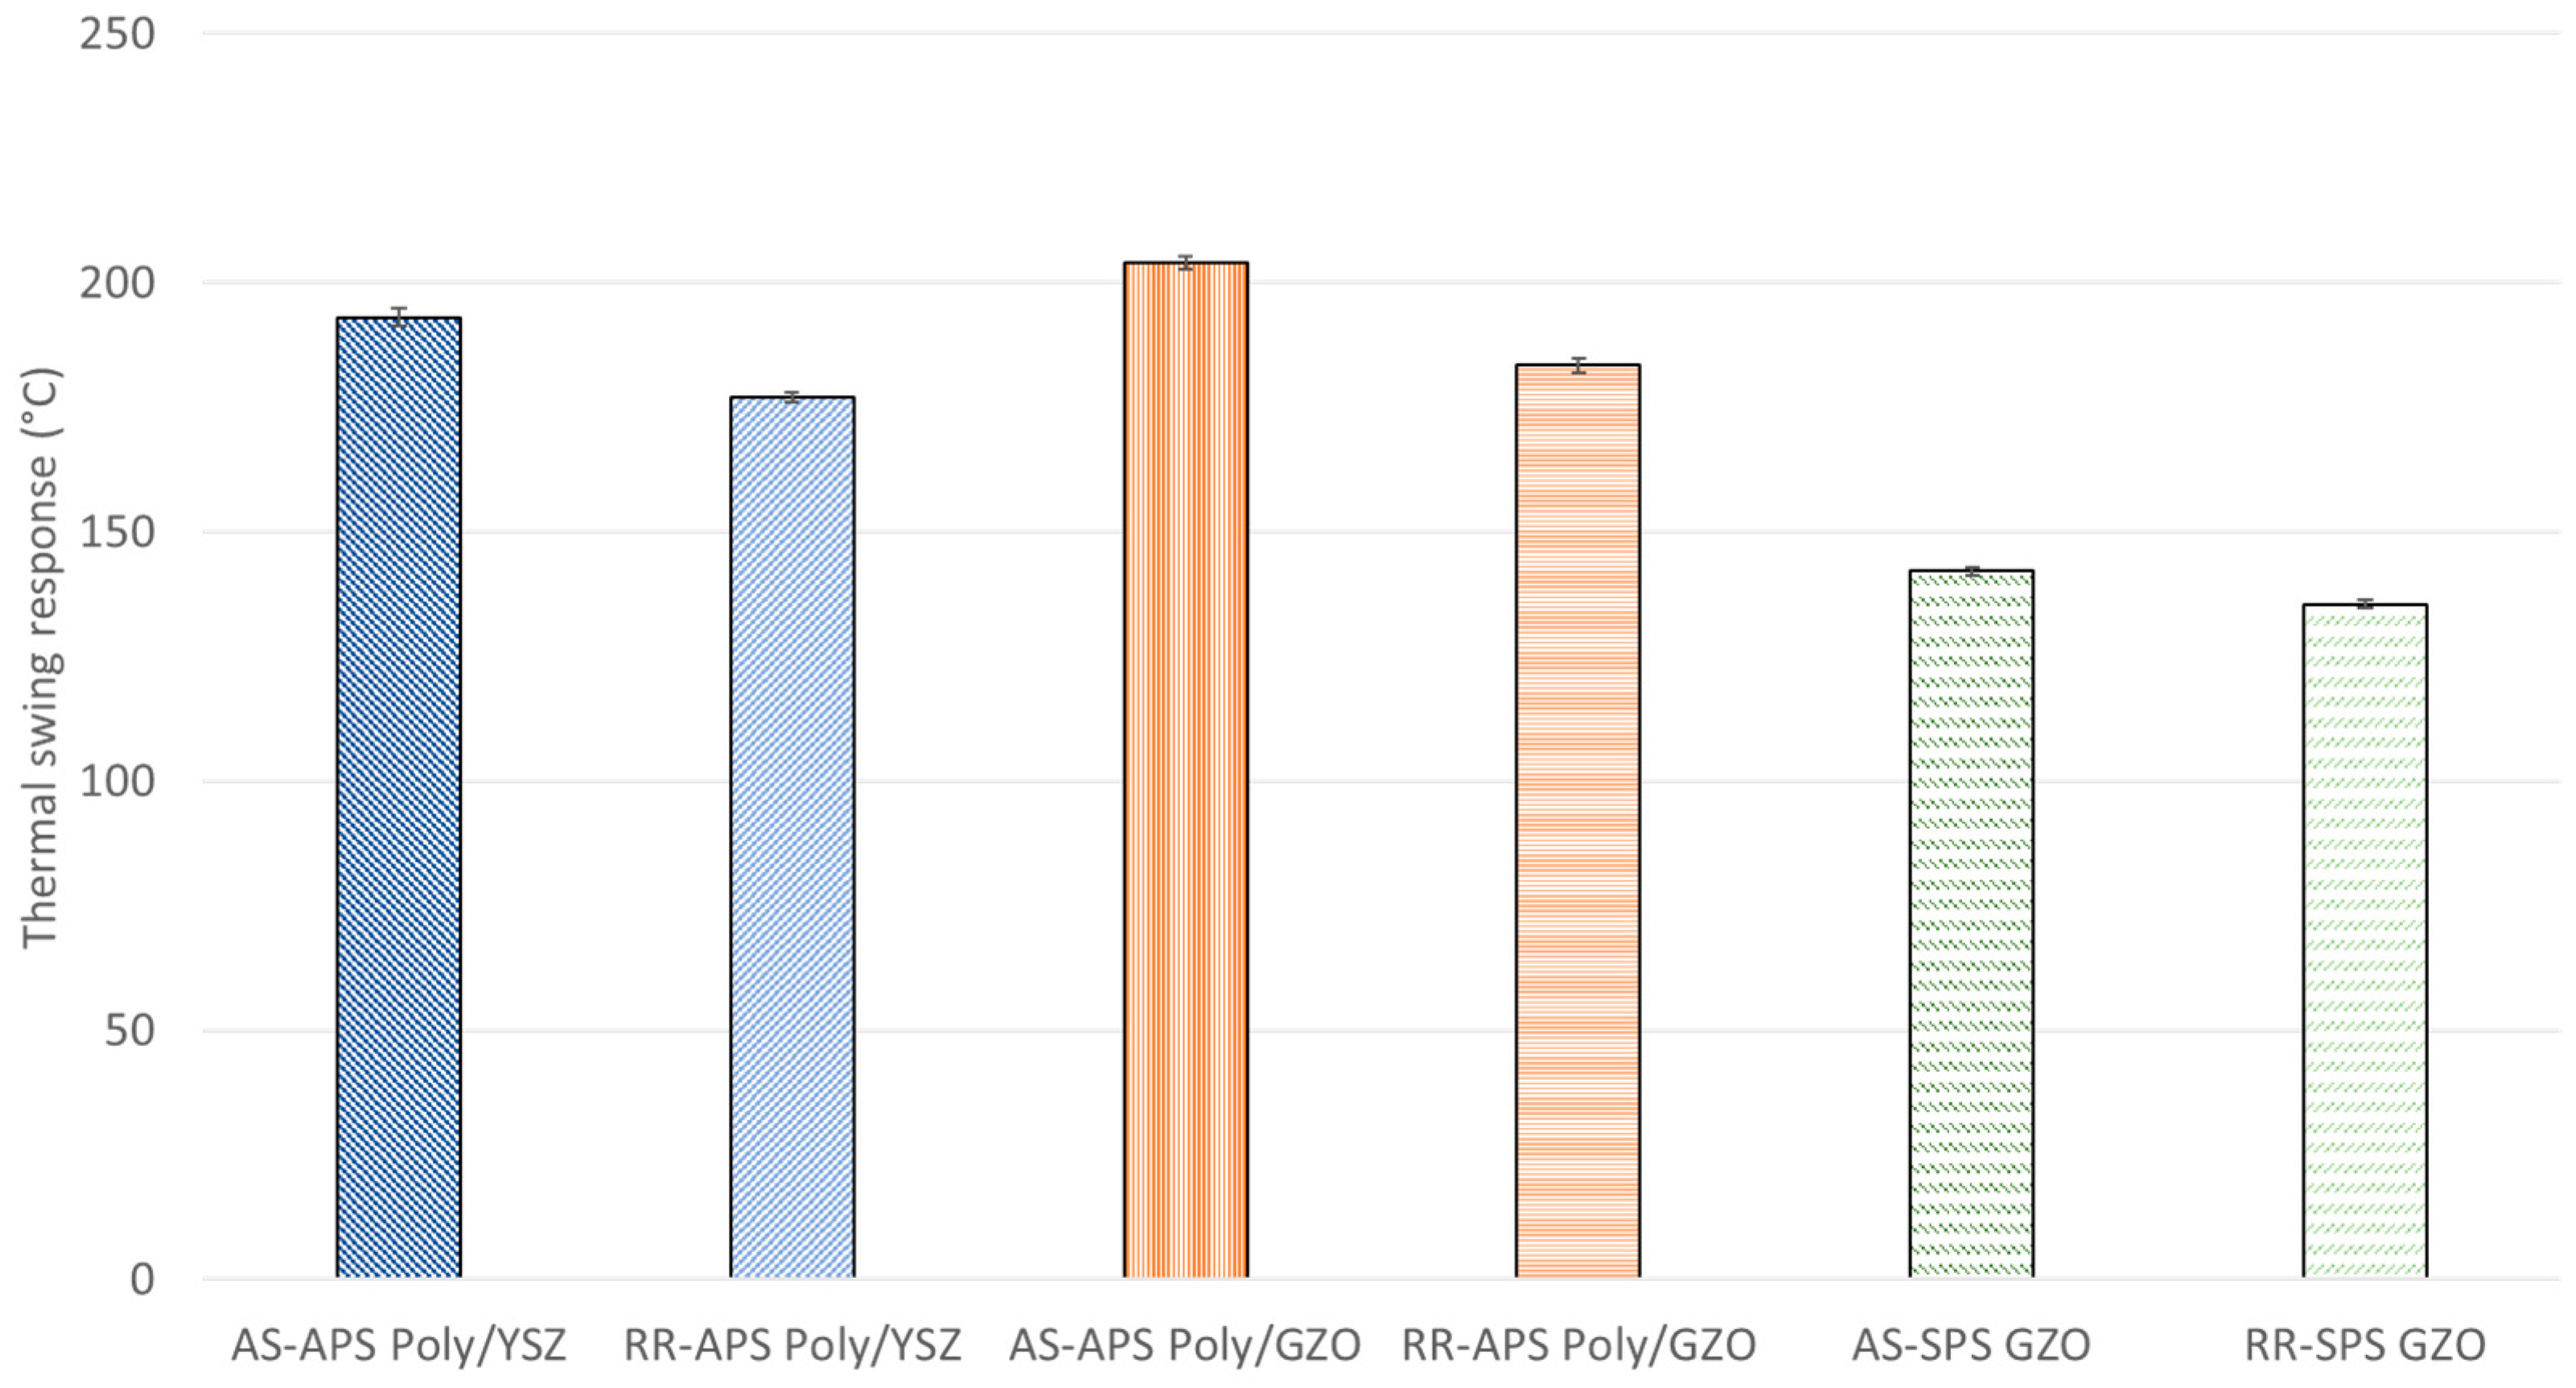
3.3. Thermal Swing Test

The results from thermal swing test are shown in Figure 7, along with the different coatings, as sprayed and with the reduced roughness.
As shown in Figure 7, superior thermal swing responses were obtained by the APS coatings, with the highest being the APS Poly/GZO followed by the APS Poly/YSZ. The lowest thermal swing results were seen in the SPS GZO coatings. The differences between the as sprayed and reduced roughness together with the influence of the different materials are further discussed in the following sections.

3.3.1. Effect of Sample Preparation

The influence of the sample preparation process is shown by thermal swing response plotted against thickness, as shown in Figure 8, along with the different coatings, as sprayed and with reduced roughness. The thickness measurements, as shown in Section 2.2, were performed on the cross-sectioned micrographs using an SEM TM 3000.
As shown by the trendline in Figure 8, a tendency for a higher thermal swing can be observed with the increase of thickness of the coatings. Small increases in thickness have also been seen as effective in raising the temperature swing by other authors [14,17]. Andruskiewicz et al. [14] found with the thermal wall temperature swing model, that small increases in temperature swing with the increase of thickness could be observed until the additional thickness reached the point of contributing to the thermal resistance of the coating. Comparable behavior was observed previously by Saputo et al. [17] who produced coatings with different thicknesses and detected a rapid increase in the thermal swing with the increase of the thickness.
The difference in the thermal swing response between AS and RR could also be attributed to the variation in surface roughness and the influence of the surface roughness in the measured signals of an IR thermal camera. These signals are a function of the emissivity of the surface to be measured. This optical property describes the surface’s ability to emit thermal radiation and among other factors depends on the surface roughness [29].

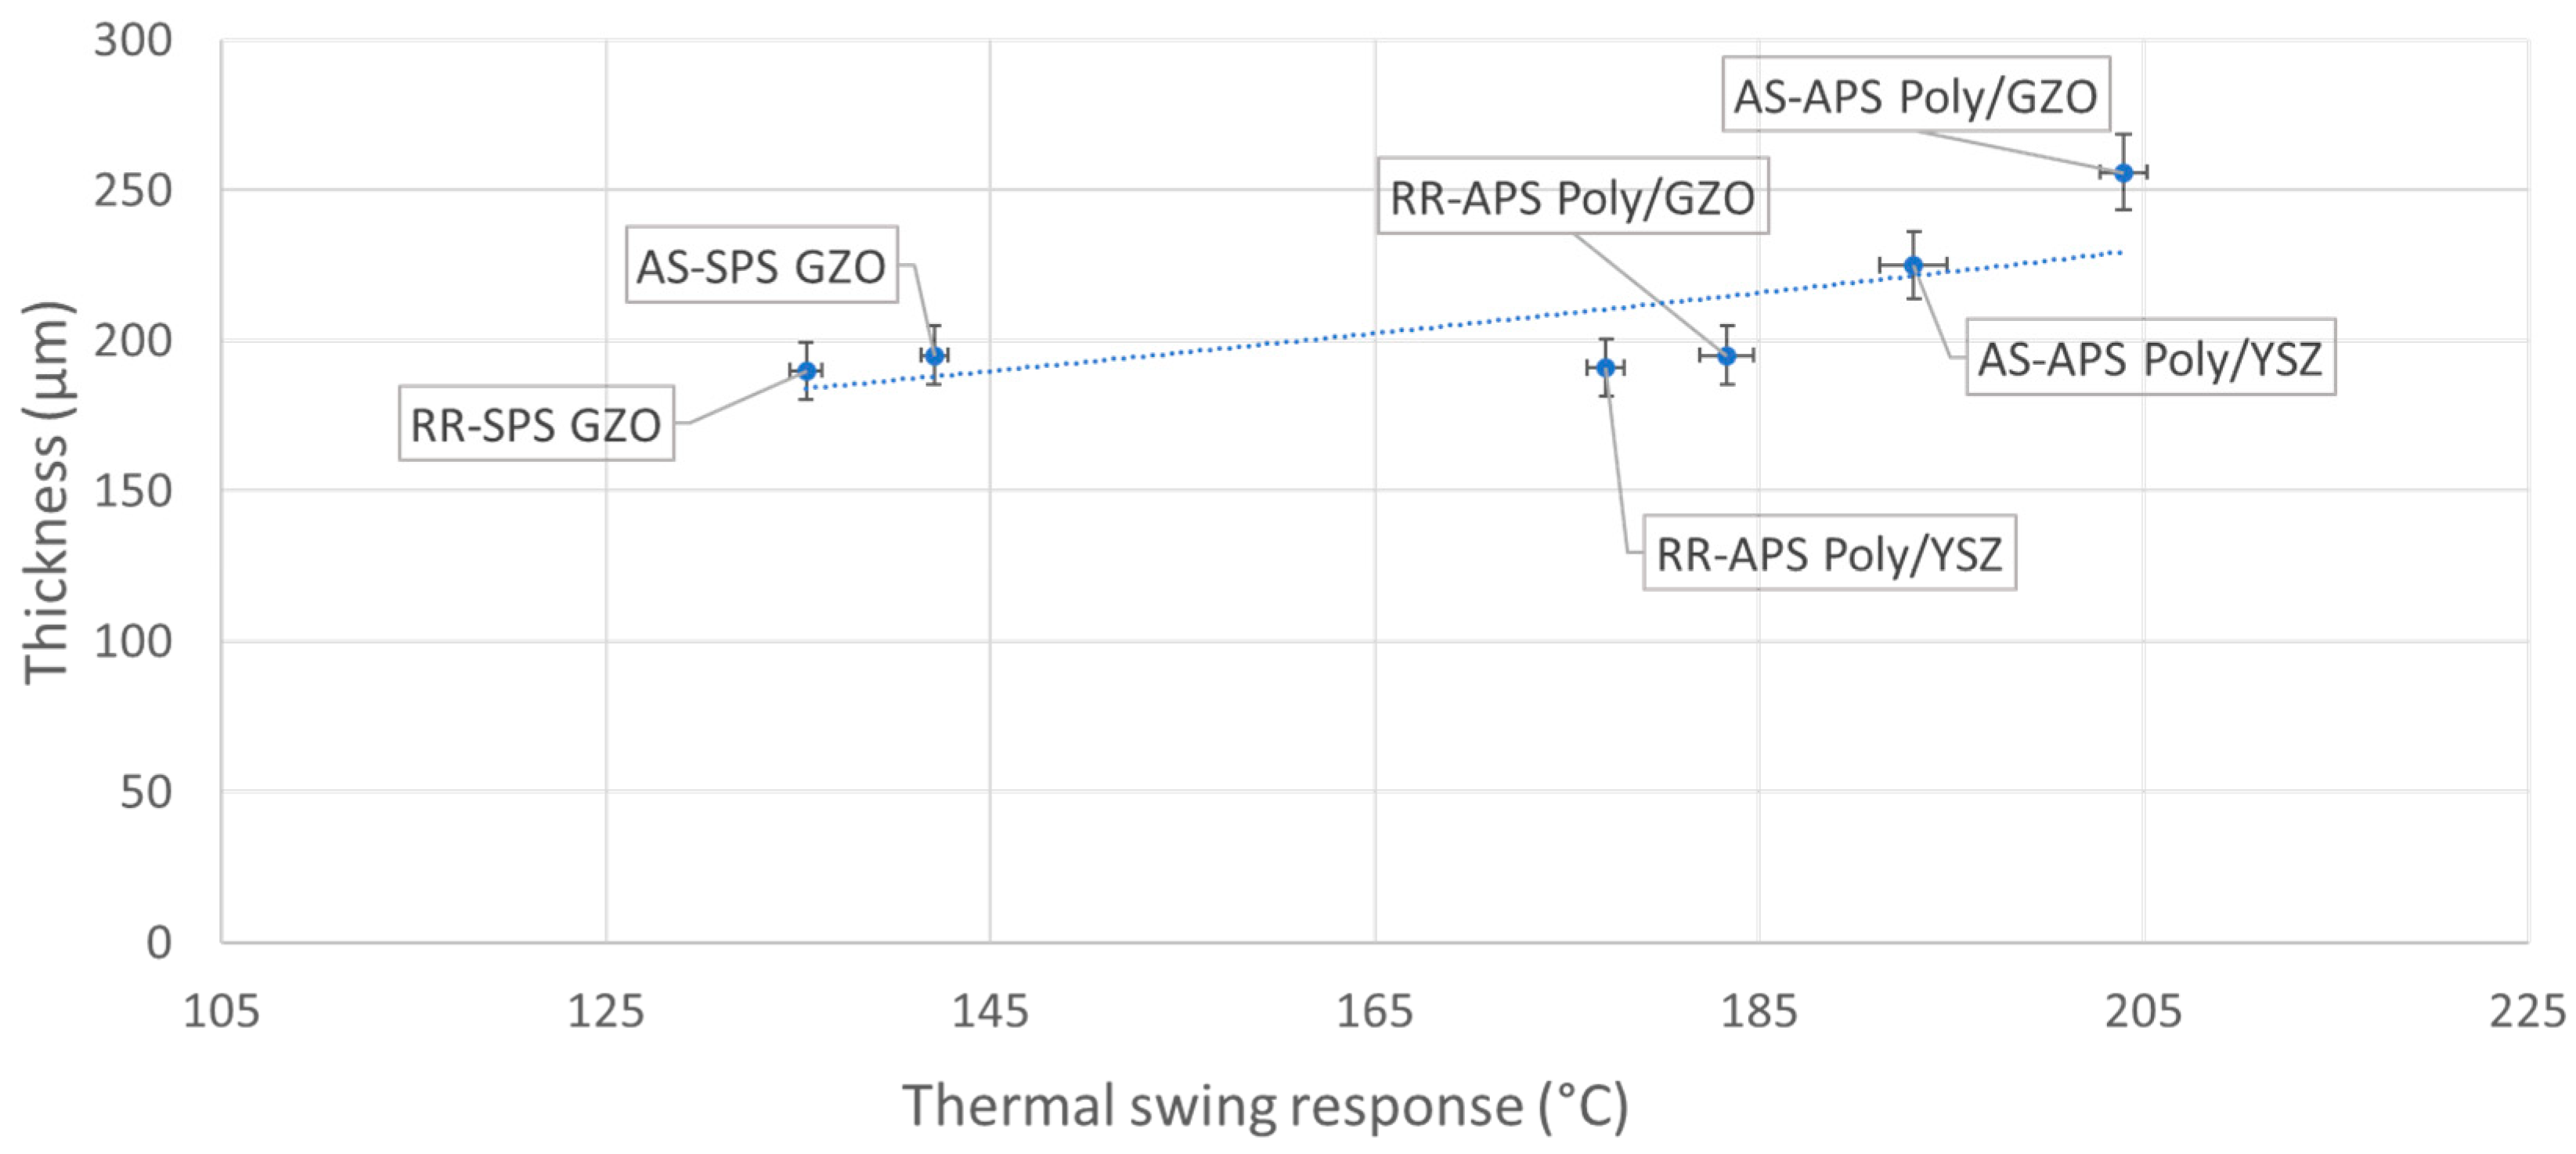
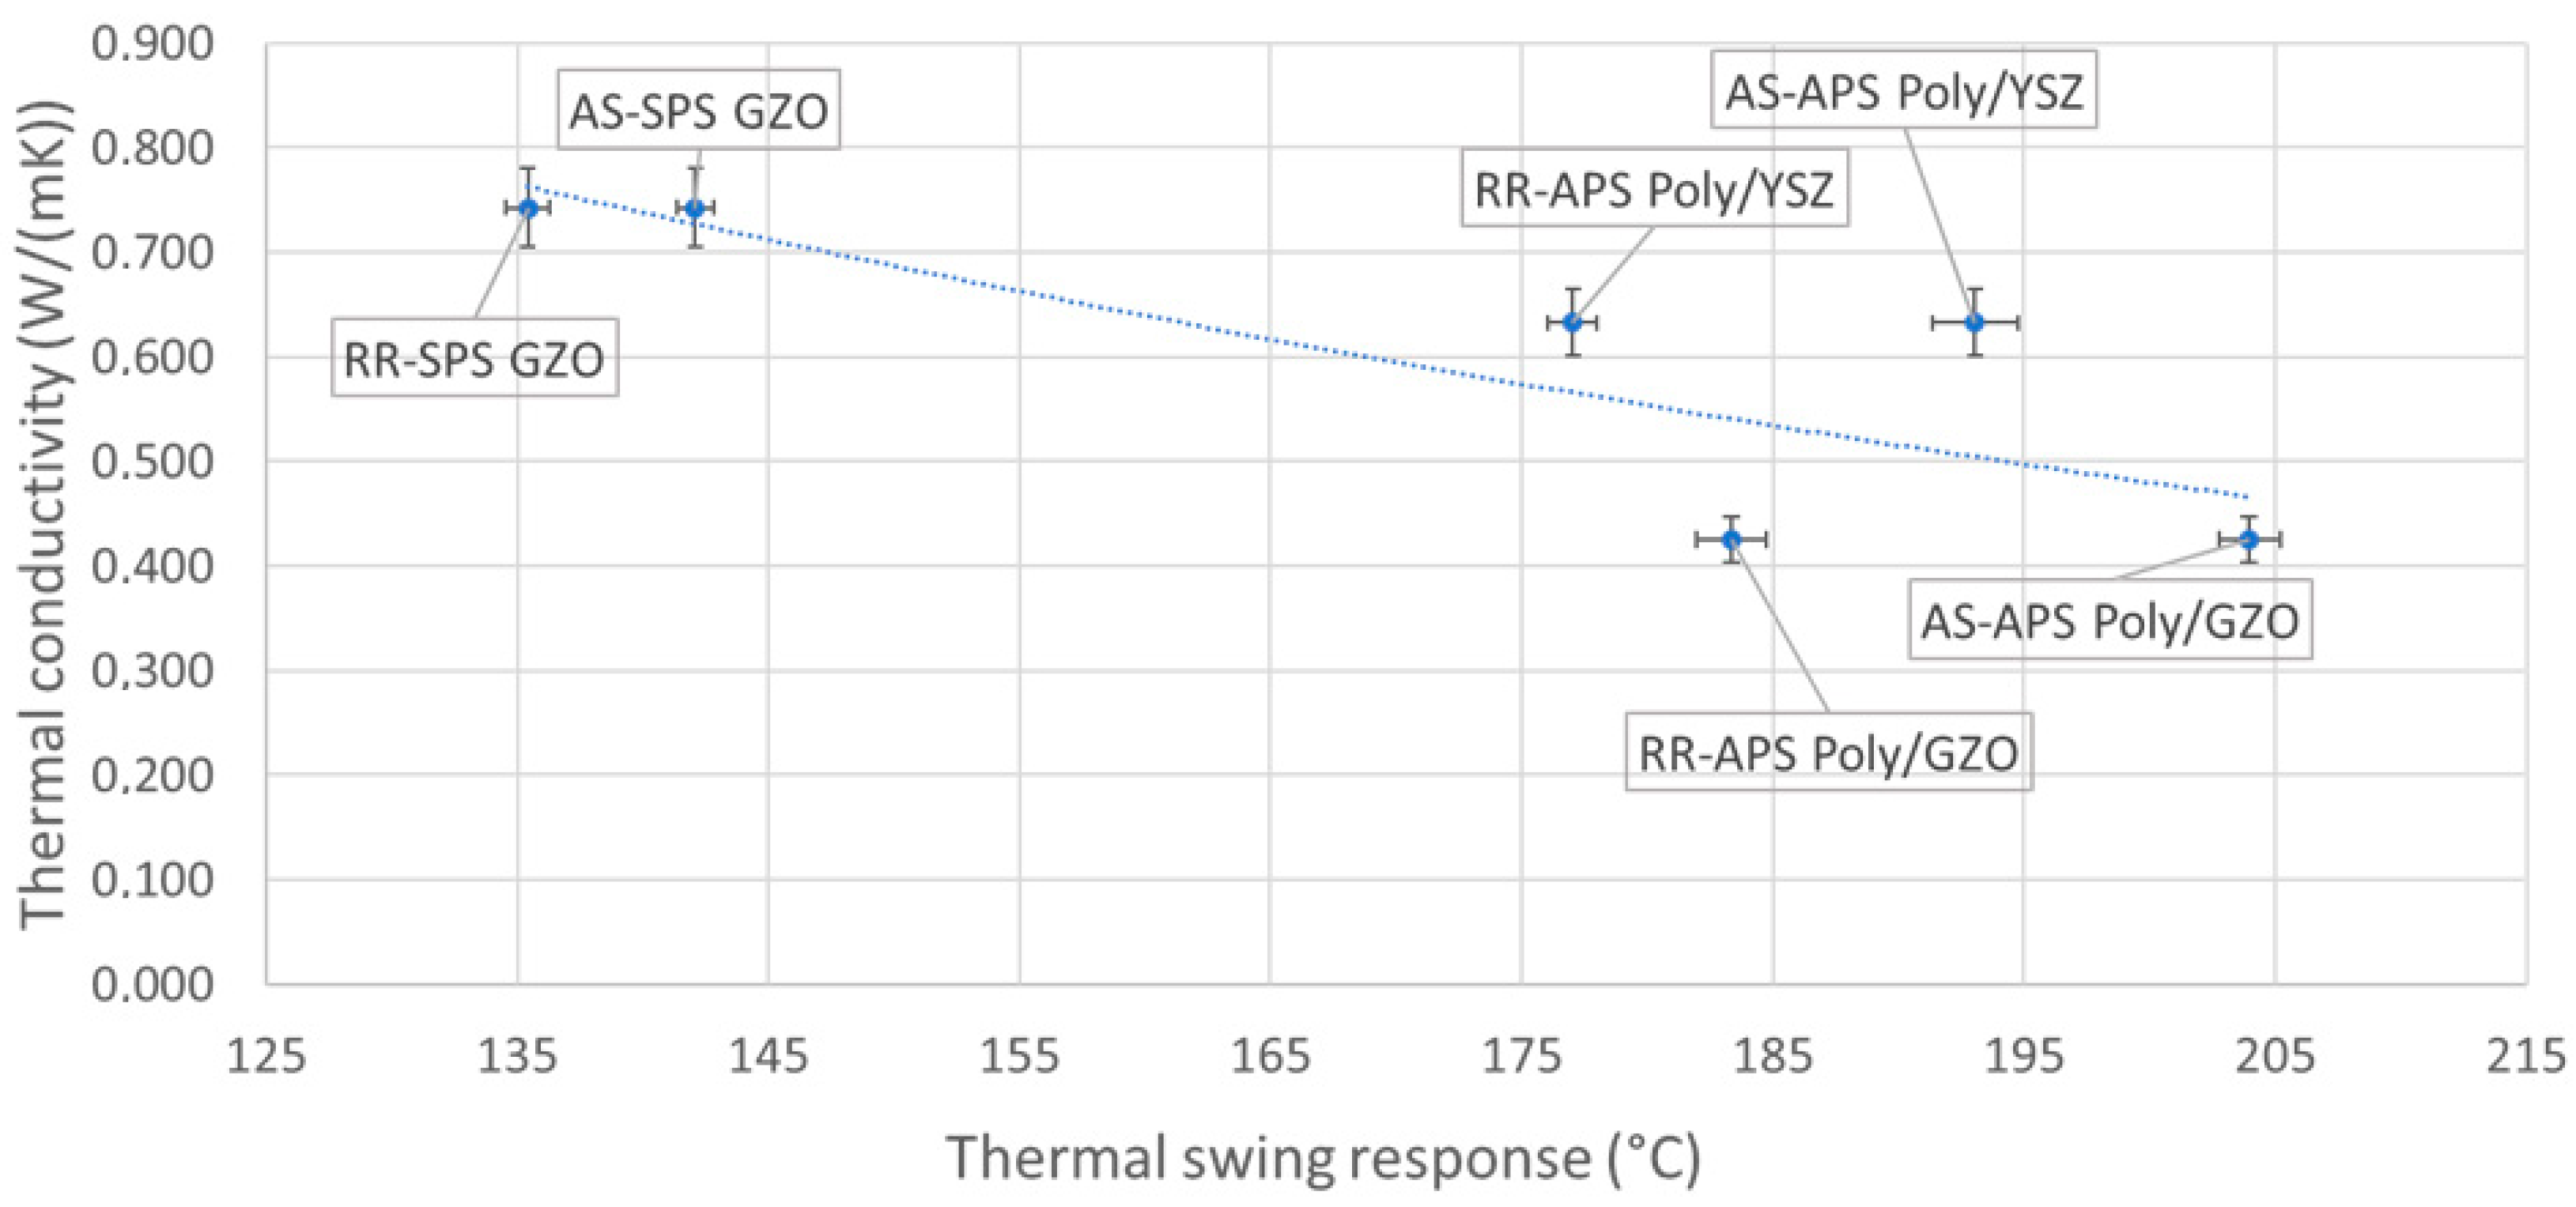
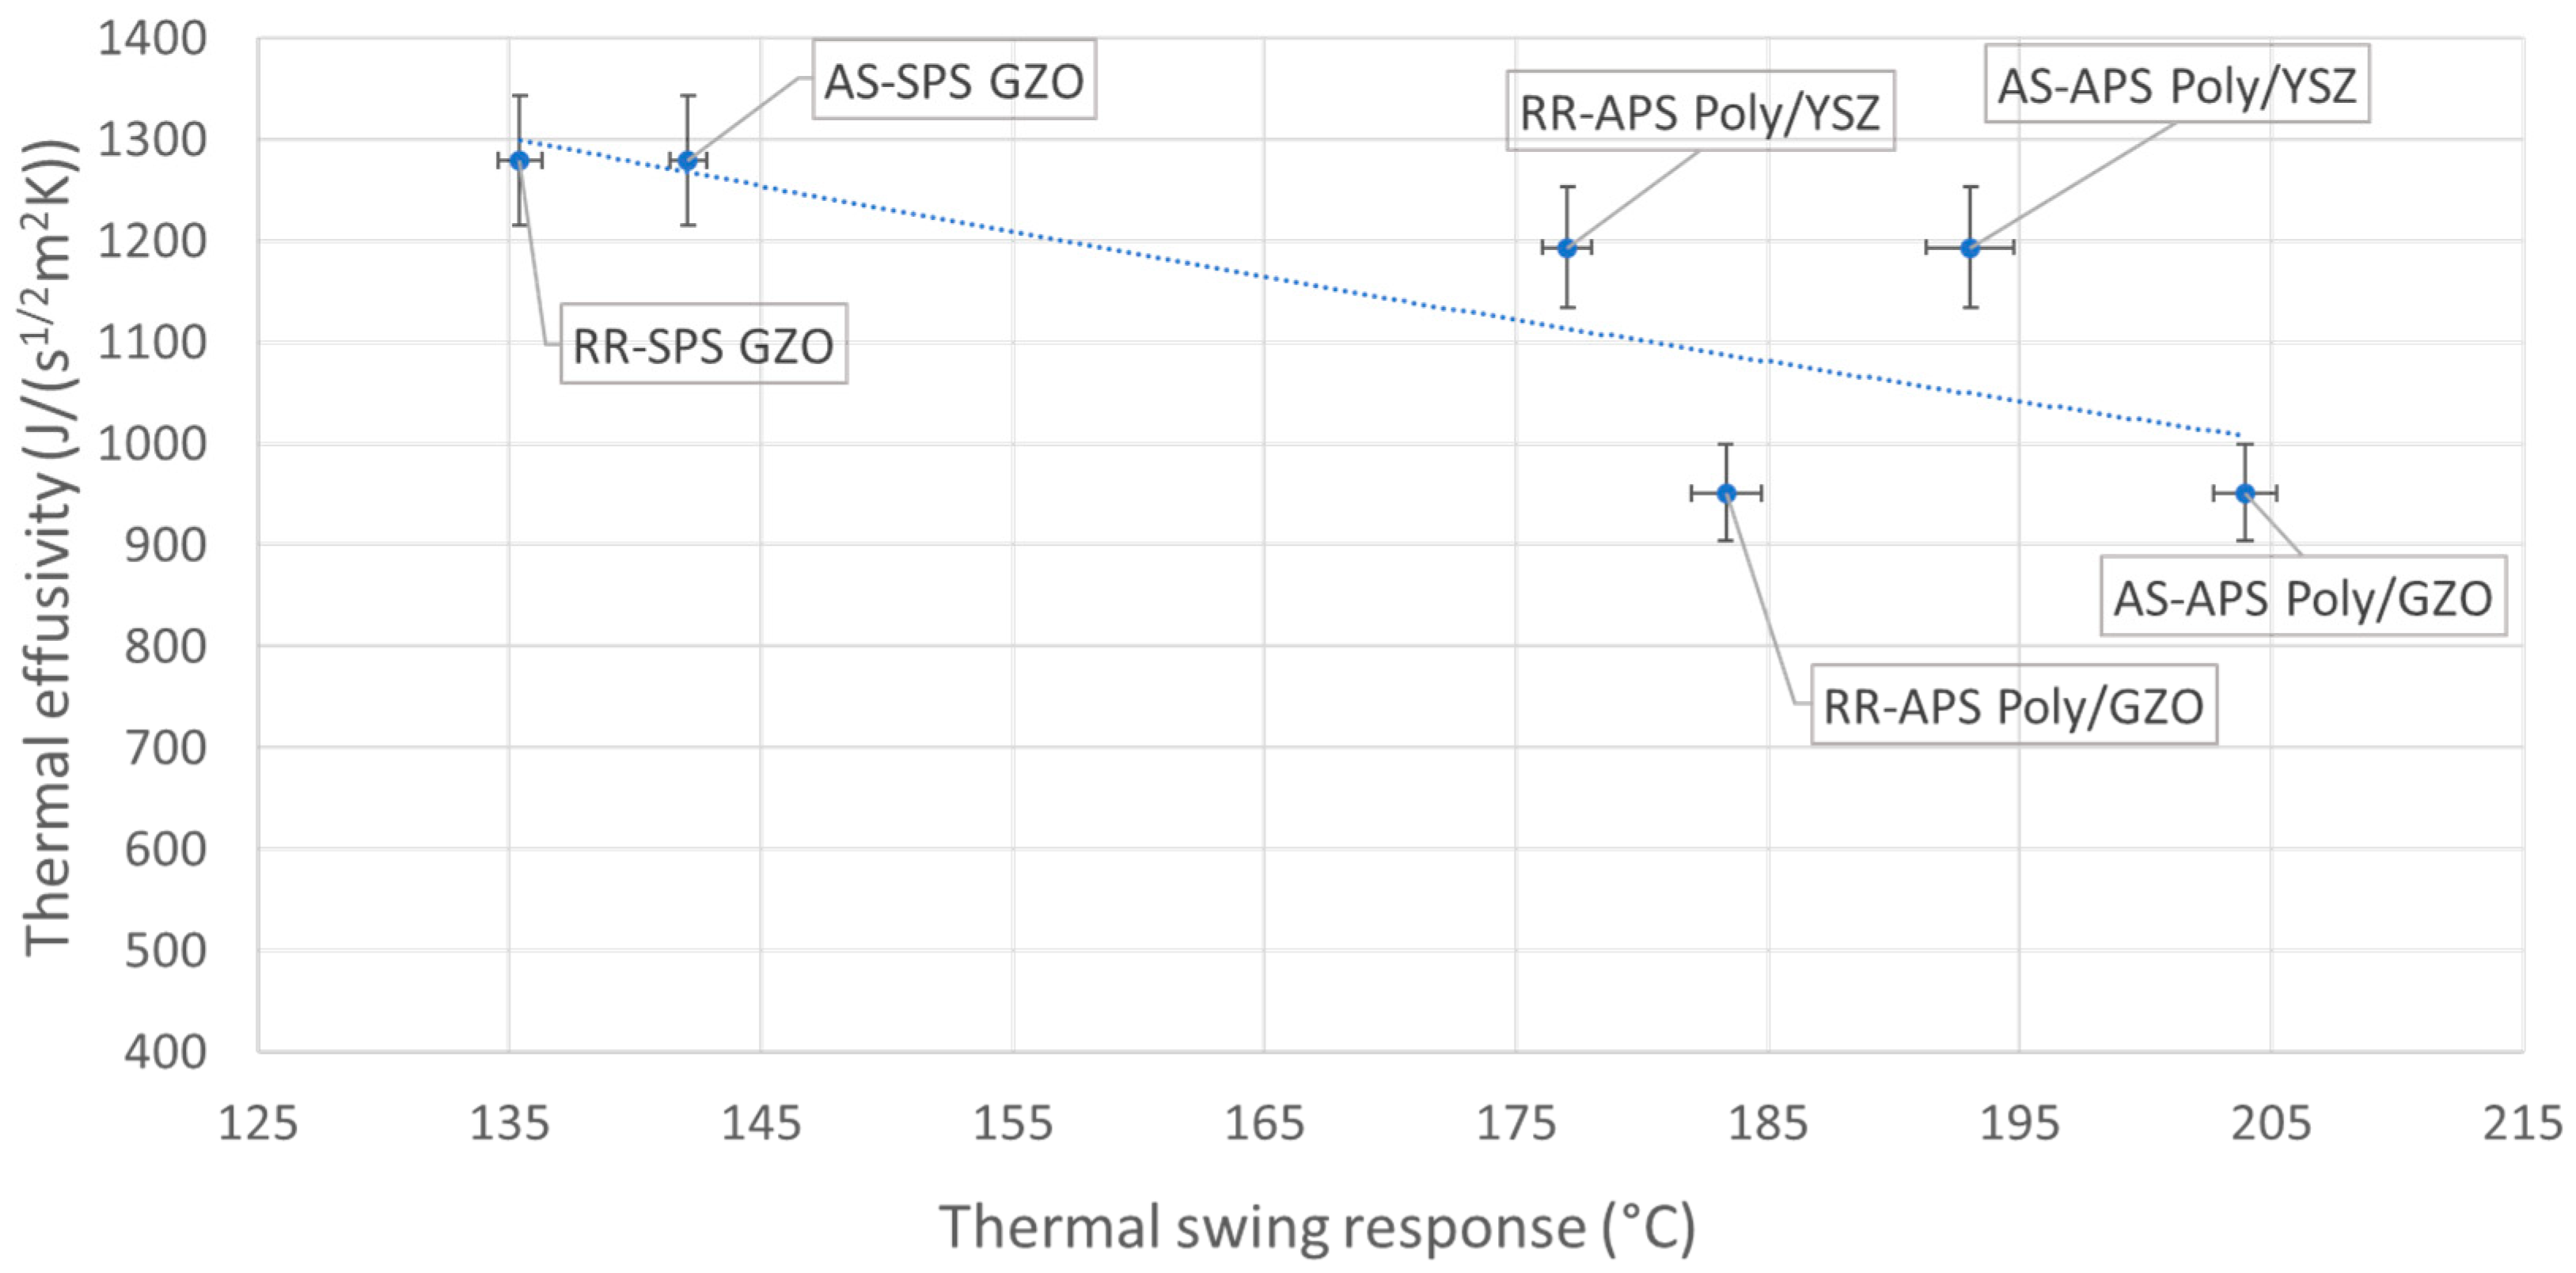
3.3.2. Effect of Thermal Properties

The correlation between the thermal properties of the coatings and the thermal swing response can be seen in Figure 9 and Figure 10, respectively, for thermal conductivity and thermal effusivity. As mentioned in the previous section, within the same coating the thermal properties were presumed constant; with this the difference in the thermal swing response between AS and RR coatings is assumed to be directly related to the effect of the thickness and the roughness [14,17].
Figure 9 shows that the thermal swing response had an increase when the thermal conductivity decreased, as confirmed by the trendline. This behavior aligns with previous work [13,17,30] and can be connected to Equation (4), which indicates that the surface temperature variation is inversely proportional to the thermal effusivity, as proposed by Assanis et al. [30].
Δ T · α 1 λ ρ C p
where ‘ Δ T   ’ is the surface temperature variation (°C), ‘λ’ is the thermal conductivity (W/(mK)), ‘ ρ ’ is the coating density (g/m3), and ‘Cp’ is the specific heat capacity (J/(gK)). With Equation (4) the extent of the influence of the big pores presented in the APS coatings is shown because these features largely influenced the thermal properties, as shown in Section 3.2.
In Figure 10, following the same trend as the thermal conductivity in Figure 9, the thermal swing response shows an increase with the reduction of the thermal effusivity, as validated by the trendline in Figure 10.
The increase of the thermal swing response with the decrease of thermal effusivity, shown in Figure 10, was observed previously by Saputo et al. [17], and by using Equation (2) in Equation (4) it can be seen that the effusivity is inversely proportional to the surface temperature swing.
As shown in Figure 9 and Figure 10, the APS Poly/YSZ, even with higher thermal conductivity and thermal effusivity than the APS Poly/GZO and close to the values for SPS GZO, showed an elevated thermal swing response. This can be attributed to the large open pores having a greater influence and going beyond the impact on the thermal properties. The APS Poly/YSZ coating presents more large open pores on the surface compared to the APS Poly/GZO, as seen in Figure 3 and Section 3.1. The evenly distributed large and open pores on the surface of the coating expand the area of contact with the gases therefore the coating is expected to respond faster to temperature changes.

4. Conclusions

This study presented an investigation into different TBC types produced with APS and SPS, and the correlation between the microstructure and thermal swing response of the coatings. The microstructure of the coatings were analyzed by SEM and the thermal properties (thermal conductivity and thermal effusivity) were measured by laser flash analysis.
-
The thermal swing test was introduced in this study to subject the coatings to similar conditions as the combustion chamber of internal combustion engines.
-
The influence of the microstructure was seen with an increase in the thermal swing response with the increase of thickness, along with the different coatings.
-
The influence of the thermal properties was observed with an increased thermal swing response with the decrease in thermal conductivity and thermal effusivity.
-
The agreement between the results from this test and the previous works ensures the validity of the test, allowing it to be further explored.
-
The large open pores formed due to the polyester used in the feedstock presented a greater influence, beyond than the impact of total porosity, on the thermal properties.
From the conclusions of this study, future work is required to expand the types of coatings evaluated by the thermal swing test and further deepen the understanding of the thermal swing coatings’ performance. Due to the impact of large open pores on the results, the influence of different sizes and morphologies of pores will also be further investigated, together with engine tests.

Author Contributions

Conceptualization, W.U.d.G., N.M. and M.G.; methodology, W.U.d.G., N.M. and M.G.; software, W.U.d.G.; formal analysis, W.U.d.G., N.M. and M.G.; investigation, W.U.d.G.; resources, N.M. and M.G.; writing—original draft preparation, W.U.d.G.; writing—review and editing, W.U.d.G., N.M. and M.G.; supervision, N.M. and M.G.; funding acquisition, N.M. All authors have read and agreed to the published version of the manuscript.

Funding

This research was funded by the Knowledge Foundation (KK-stiftelsen), Sweden (Grant No. 20210092).

Institutional Review Board Statement

Not applicable.

Informed Consent Statement

Not applicable.

Data Availability Statement

Not applicable.

Acknowledgments

The authors would like to acknowledge Stefan Björklund and Magnus Sandberg from University West, Trollhättan, for their help in the spraying of the samples.

Conflicts of Interest

The authors declare no conflict of interest.

References

  1. Bouckaert, S.; Pales, A.F.; McGlade, C.; Remme, U.; Wanner, B.; Varro, L.; D’Ambrosio, D.; Spencer, T. Net Zero by 2050: A Roadmap for the Global Energy Sector. 2021. Available online: https://www.iea.org/events/net-zero-by-2050-a-roadmap-for-the-global-energy-system (accessed on 12 June 2022).
  2. Somhorst, J.; Uczak De Goes, W.; Oevermann, M.; Bovo, M. (Eds.) Experimental Evaluation of Novel Thermal Barrier Coatings in a Single Cylinder Light Duty Diesel Engine; SAE International: Warrendale, PA, USA, 2019. [Google Scholar]
  3. Uczak de Goes, W.; Somhorst, J.; Markocsan, N.; Gupta, M.; Illkova, K. Suspension plasma-sprayed thermal barrier coatings for light-duty diesel engines. J. Therm. Spray Technol. 2019, 28, 1674–1687. [Google Scholar] [CrossRef] [Green Version]
  4. Tucker, R.C.J. (Ed.) Thermal spray processes. In Thermal Spray Technology; Tucker, R.C.J. (Ed.) ASM International: Almere, The Netherlands, 2013; Volume 5A, ISBN 978-1-62708-171-9. [Google Scholar]
  5. Evans, A.G.; Mumm, D.R.; Hutchinson, J.W.; Meier, G.H.; Pettit, F.S. Mechanisms controlling the durability of thermal barrier coatings. Prog. Mater. Sci. 2001, 46, 505–553. [Google Scholar] [CrossRef]
  6. Somhorst, J. Reduction of Heat Transfer and Heat Load in Internal Combustion Engines. Licentiate Thesis, Chalmers University of Technology, Göteborg, Sweden, 2019. [Google Scholar]
  7. Tree, D.R.; Oren, D.C.; Yonushonis, T.M.; Wiczynski, P.D. (Eds.) Experimental Measurements on the Effect of Insulated Pistons on Engine Performance and Heat Transfer; SAE International: Warrendale, PA, USA, 1996. [Google Scholar]
  8. Kamo, R.; Mavinahally, N.S.; Kamo, L.; Bryzik, W.; Schwartz, E.E. (Eds.) Injection Characteristics That Improve Performance of Ceramic Coated Diesel Engines; SAE International: Warrendale, PA, USA, 1999. [Google Scholar]
  9. Hejwowski, T.; Weroński, A. The effect of thermal barrier coatings on diesel engine performance. Vacuum 2002, 65, 427–432. [Google Scholar] [CrossRef]
  10. Taymaz, I. The effect of thermal barrier coatings on diesel engine performance. Surf. Coat. Technol. 2007, 201, 5249–5252. [Google Scholar] [CrossRef]
  11. Modi, A.J. (Ed.) Experimental Study of Energy Balance in Thermal Barrier Coated Diesel Engine; SAE International: Warrendale, PA, USA, 2012. [Google Scholar]
  12. Kosaka, H.; Wakisaka, Y.; Nomura, Y.; Hotta, Y.; Koike, M.; Nakakita, K.; Kawaguchi, A. Concept of “temperature swing heat insulation” in combustion chamber walls, and appropriate thermo-physical properties for heat insulation coat. SAE Int. J. Engines 2013, 6, 142–149. [Google Scholar] [CrossRef]
  13. Kawaguchi, A.; Iguma, H.; Yamashita, H.; Takada, N.; Nishikawa, N.; Yamashita, C.; Wakisaka, Y.; Fukui, K. (Eds.) Thermo-Swing Wall Insulation Technology;-A Novel Heat Loss Reduction Approach on Engine Combustion Chamber; SAE International: Warrendale, PA, USA, 2016. [Google Scholar]
  14. Andruskiewicz, P.; Najt, P.; Durrett, R.; Biesboer, S.; Schaedler, T.; Payri, R. Analysis of the effects of wall temperature swing on reciprocating internal combustion engine processes. Int. J. Engine Res. 2018, 19, 461–473. [Google Scholar] [CrossRef]
  15. Gupta, M.; Curry, N.; Nylén, P.; Markocsan, N.; Vaßen, R. Design of next generation thermal barrier coatings—Experiments and modelling. Surf. Coat. Technol. 2013, 220, 20–26. [Google Scholar] [CrossRef]
  16. Curry, N.; Markocsan, N.; Li, X.-H.; Tricoire, A.; Dorfman, M. Next generation thermal barrier coatings for the gas turbine industry. J. Therm. Spray Technol. 2011, 20, 108–115. [Google Scholar] [CrossRef]
  17. Saputo, J.C.; Smith, G.M.; Lee, H.; Sampath, S.; Gingrich, E.; Tess, M. Thermal swing evaluation of thermal barrier coatings for diesel engines. J. Therm. Spray Technol. 2020, 29, 1943–1957. [Google Scholar] [CrossRef]
  18. Somhorst, J.; Oevermann, M.; Bovo, M.; Denbratt, I. Evaluation of thermal barrier coatings and surface roughness in a single-cylinder light-duty diesel engine. Int. J. Engine Res. 2021, 22, 890–910. [Google Scholar] [CrossRef] [Green Version]
  19. Ganvir, A.; Curry, N.; Björklund, S.; Markocsan, N.; Nylén, P. Characterization of microstructure and thermal properties of ysz coatings obtained by axial suspension plasma spraying (ASPS). J. Therm. Spray Technol. 2015, 24, 1195–1204. [Google Scholar] [CrossRef]
  20. Mahade, S.; Curry, N.; Björklund, S.; Markocsan, N.; Nylén, P. Thermal conductivity and thermal cyclic fatigue of multilayered Gd2Zr2O7/YSZ thermal barrier coatings processed by suspension plasma spray. Surf. Coat. Technol. 2015, 283, 329–336. [Google Scholar] [CrossRef] [Green Version]
  21. Mahade, S.; Curry, N.; Björklund, S.; Markocsan, N.; Nylén, P.; Vaßen, R. Functional performance of Gd2Zr2O7/YSZ multi-Layered thermal barrier coatings deposited by suspension plasma spray. Surf. Coat. Technol. 2017, 318, 208–216. [Google Scholar] [CrossRef]
  22. Gupta, M.; Weber, A.; Markocsan, N.; Heiden, N. Development of plasma sprayed Ni/YSZ Anodes for metal supported solid oxide fuel cells. Surf. Coat. Technol. 2017, 318, 178–189. [Google Scholar] [CrossRef]
  23. Wang, Y.; Liu, H.; Ling, X.; Weng, Y. Effects of pore microstructure on the effective thermal conductivity of thermal barrier coatings. Appl. Therm. Eng. 2016, 102, 234–242. [Google Scholar] [CrossRef]
  24. Carpio, P.; Blochet, Q.; Pateyron, B.; Pawłowski, L.; Salvador, M.D.; Borrell, A.; Sánchez, E. Correlation of thermal conductivity of suspension plasma sprayed yttria stabilized zirconia coatings with some microstructural effects. Mater. Lett. 2013, 107, 370–373. [Google Scholar] [CrossRef]
  25. Mahade, S.; Curry, N.; Jonnalagadda, K.P.; Peng, R.L.; Markocsan, N.; Nylén, P. Influence of YSZ layer thickness on the durability of gadolinium Zirconate/YSZ double-layered thermal barrier coatings produced by suspension plasma spray. Surf. Coat. Technol. 2019, 357, 456–465. [Google Scholar] [CrossRef]
  26. Wu, J.; Wei, X.; Padture, N.P.; Klemens, P.G.; Gell, M.; García, E.; Miranzo, P.; Osendi, M.I. Low-thermal-conductivity rare-earth zirconates for potential thermal-barrier-coating applications. J. Am. Ceram. Soc. 2002, 85, 3031–3035. [Google Scholar] [CrossRef]
  27. Kulkarni, A.; Vaidya, A.; Goland, A.; Sampath, S.; Herman, H. Processing effects on porosity-property correlations in plasma sprayed Yttria-stabilized Zirconia coatings. Mater. Sci. Eng. A 2003, 359, 100–111. [Google Scholar] [CrossRef]
  28. Golosnoy, I.O.; Cipitria, A.; Clyne, T.W. Heat transfer through plasma-sprayed thermal barrier coatings in gas turbines: A review of recent work. J. Therm. Spray Technol. 2009, 18, 809–821. [Google Scholar] [CrossRef] [Green Version]
  29. Bergman, T.L.; Bergman, T.L.; Incropera, F.P.; DeWitt, D.P.; Lavine, A.S. (Eds.) Fundamentals of Heat and Mass Transfer; Wiley: Hoboken, NJ, USA, 2011; ISBN 978-0-470-50197-9. [Google Scholar]
  30. Assanis, D.N.; Badillo, E. (Eds.) Transient Heat Conduction in Low-Heat-Rejection Engine Combustion Chambers; SAE International: Warrendale, PA, USA, 1987. [Google Scholar]
Figure 1. Section of the thermal swing test, showing the position of the sample. The figure is merely a representation of the HVAF torch and is not presented to scale.
Coatings 12 00830 g001
Figure 2. Thermal swing test.
Coatings 12 00830 g002
Figure 3. SEM images of the surface of as-sprayed and reduced-roughness coatings.
Coatings 12 00830 g003
Figure 4. SEM cross-section images of as-sprayed and reduced-roughness coatings.
Coatings 12 00830 g004
Figure 5. Porosity variation of the as-sprayed coatings.
Coatings 12 00830 g005
Figure 6. Roughness variation of the as-sprayed and with reduced-roughness coatings.
Coatings 12 00830 g006
Figure 7. Thermal swing response along different coatings, as sprayed and with reduced roughness.
Coatings 12 00830 g007
Figure 8. Thermal swing response vs. thickness, along with different coatings, as sprayed and with reduced roughness.
Coatings 12 00830 g008
Figure 9. Thermal swing response vs. thermal conductivity along with different coatings, as sprayed and with reduced roughness.
Coatings 12 00830 g009
Figure 10. Thermal swing response vs. thermal effusivity along with different coatings, as sprayed and with reduced roughness.
Coatings 12 00830 g010
Table 1. Feedstock material used for the different coatings.
NomenclatureBond CoatTop Coat
APS Poly/YSZAmdry 365-4Metco 2460NS
APS Poly/GZOAmdry 365-4Metco 6042 + Metco 600 NS-1
SPS GZOAMDRY 386AE 12413
Table 2. Thermal properties of the as-sprayed coatings.
APS Poly/YSZAPS Poly/GZOSPS GZO
Thermal conductivity (W/(mK))0.63 ± 0.030.43 ± 0.020.74 ± 0.04
Thermal effusivity (J/(s1/2m2K))1193 ± 60951 ± 471279.36 ± 63
Publisher’s Note: MDPI stays neutral with regard to jurisdictional claims in published maps and institutional affiliations.

