Article

Surface Investigation of Physella Acuta Snail Shell Particle Reinforced Aluminium Matrix Composites

by
Catalin Iulian Pruncu
1,*,
Alina Vladescu
2,3,
N. Rajesh Jesudoss Hynes
4,* and
Ramakrishnan Sankaranarayanan
4
1
Departimento di Meccanica, Matematica e Management, Politecnico di Bari, 70125 Bari, Italy
2
National Institute of Research and Development for Optoelectronics-INOE 2000, 409 Atomistilor St., 077125 Bucharest, Romania
3
Physical Materials Science and Composite Materials Centre, Research School of Chemistry & Applied Biomedical Sciences, National Research Tomsk Polytechnic University, Lenin Avenue 43, 634050 Tomsk, Russia
4
Department of Mechanical Engineering, Mepco Schlenk Engineering College (Autonomous), Sivakasi 626005, Tamil Nadu, India
*
Authors to whom correspondence should be addressed.
Coatings 2022, 12(6), 794; https://doi.org/10.3390/coatings12060794
Submission received: 8 April 2022 / Revised: 20 May 2022 / Accepted: 31 May 2022 / Published: 8 June 2022

Abstract

:
Aluminium-matrix composite is one of the most preferred engineering materials and is known for its potential benefits, such as lightweight nature, high specific stiffness, superior strength, machinability, etc. The metal–matrix composites are very attractive for critical applications: Aerospace field, defense deployments, automotive sector, marine industry. In the present work, novel Physella Acuta Snail Shell particle reinforced aluminium metal–matrix composites are developed to facilitate cost-effective and sustainable manufacturing. These green composites are developed by stir-casting with LM0 as matrix material and snail shell as reinforcement with a distinct percentage (by weight) of inclusion. The influence of snail shells is analyzed through tribological, morphological, and corrosion studies. Aluminium–matrix composite Al98SNS2 with 98% (by weight) aluminium matrix and 2% (by weight) snail shell reinforcement exhibits superior performance in all investigations. Al98SNS2 composite exhibits the least wear rate in the atmosphere of deionized water and 3.5% NaCl. Corrosion deteriorates the surface roughness irrespective of the percentage of incorporation of snail shell reinforcement. However, the deterioration is minimal in Al98SNS2. The current research findings indicate that the incorporation of snail shell in aluminum metal–matrix composites promotes cost-effective, sustainable, and eco-friendly manufacturing.

1. Introduction

Metal–matrix composites are made with the combination of at least two distinct materials, namely matrix and reinforcement. The combination of distinct materials offers several advantages in terms of material properties and characteristics [1]. Various applications rely on metal–matrix composites for their superior properties, such as high specific strength, good modulus, stiffness, etc. Especially, aluminum-based metal–matrix composites contribute more to the development of metal–matrix composites. Apart from oxygen, nitrogen, and silicon, the most commonly available element on Earth’s crust is aluminum, so this is very beneficial for composite fabrication. It is the most applied non-ferrous metal for various applications due to its manufacturing and fabrication-friendly properties and characteristics [2]. Aluminum binds to the reinforcing material as matrix and develops the targeted shape.
Aluminum, along with different reinforcements, increases the mechanical as well as structural properties of composites. From aerospace to automotive sector, the deployment of aluminum-based metal–matrix composites is growing day by day. Lightweight nature, along with a high strength to weight ratio of these composites, enables obtaining the desired advantages to well manufacture the most modern products [3,4]. These composites are excellent alternative solutions for the monolithic alloys which exhibit weak mechanical properties [5,6]. Reinforcement offers mechanical strength and receives the loads transferred through matrix material. Different reinforcements are present in the form of fibers and particles where particle reinforcements are preferred more for economic production and process automation [7,8]. Several reinforcements, such as silicon–carbide [9], titanium–diboride, aluminum–nitride, titanium–carbide, aluminum–oxide [10], boron–carbide, nano CuO [11], Al3Ni intermetallic compound [12], and other compounds were used as lightweight reinforcement. In the present work, Physella Acuta Fresh water pond snail shells (SNS) in the particulate form are applied as reinforcement to develop aluminum-based metal–matrix composite. Snail shell itself can have reduced importance, but the gastropod’s shell that is present over the snail is very beneficial as a natural shield for external disturbances. Gastropod is preferred for its meat, and the shell portion is abandoned. Snail’s remnants lead to serious environmental disturbances as these bio-shells mix with garbage generated from eateries and restaurants and they also possess the least economic value. Thus, efficient utilization of shells provides both economic benefits and environmental advantages [13]. In the field of science and technology, snail shell is considered an effective engineering material, and various research activities have been carried out to deploy these bio-shells across different fields [14]. The incorporation of these waste bio-shells within metal–matrix composites as reinforcements supports the manufacturing of cost-effective composite materials. Snail shells in the particulate form exhibit superior refractoriness temperature, which turns it to be an effective reinforcement candidate. The contributions of hard oxides, such as SiO, MnO, Cr2O3, etc., increase the potential of high refractoriness to snail shells. These natural shells possess the maximum temperature withstanding capacity of up to 1400 °C without compromising the strength at no load conditions [13]. The lightweight nature of snail shells allows the reduction of composite weight, and therefore, it is possible to successfully meet the requirements for lightweight composite applications. Green metal–matrix composites are possible through proper reinforcement of snail shells, and requirements from automotive sector to other engineering industries can also be met through this cost-effective composite solution [13,15,16,17]. Mostly aluminum, titanium, and magnesium play a major role in forming the matrix part in the composite development. Especially, aluminum-based metal–matrix composites are used predominantly in several applications, which include aerospace, marine, automobiles, defense, etc. These novel composites can provide competitive solutions for modern requirements, such as energy efficiency, sustainability, cost-effectiveness, etc. [18,19,20,21].
In the present work, snail shells are deployed as reinforcing material in the particulate form to develop aluminum-based metal–matrix composites. SNS comprises about 95 to 99% calcium carbonate [22]. It is reported that calcium carbonate acts as a barrier and prevents corrosion due to the exposure of water over the pipe [23]. Calcium carbonate is also deployed as coating for corrosion prevention [24]. Hence, it is envisaged that snail shell reinforcement inhibits corrosion behavior. It is also reported that calcium carbonate could improve the anti-wear and friction-reducing capacities [25]. The significance of snail shells as reinforcement on aluminum metal–matrix composites was investigated to benefit the engineering requirements at a larger extent. Furthermore, the objective of the current work was to develop sustainable green metal–matrix composites by inspiring snail shell as an efficacious engineering material. Its performance was systematically studied using tribological, morphological, and corrosion experiments.

2. Materials and Methods

2.1. Materials

In the present study, pure aluminum (LM0) in the form of ingot was employed as a matrix material. Table 1 represents the chemical composition of this commercial ingot. Snail shells, as represented in Figure 1, were collected and thoroughly milled to obtain the powder form for the uniform dispersion of reinforcements.

2.2. Methods

2.2.1. Stir Casting

The development of metal–matrix composites can be accomplished by incorporating the reinforcement phase to the selected matrix material. Metal–matrix composite development methods, such as powder-metallurgy, plasma-spraying, stir-casting, spray automation, etc., are currently available techniques out of which the stir-casting process is considered here in the current work for its simple execution, cost-effective operation, and uniform dispersion of reinforcements [26,27,28,29]. The powder form of SNS is taken in 2, 4, and 6% (by weight) with respect to the capacity (1500 g) of the stir-casting die. The volume fractions of the SNS powder are given in Table 2.
Once commercially available pure aluminum contributes the remaining portion in terms of weight percentage, SNS powder is preheated to eliminate moisture content and volatile impurities. Further, preheating enhances the wettability of the SNS reinforcement particles. Aluminum ingot is weighed according to the inclusion of SNS reinforcement and kept inside the furnace of the stir-casting machine. This matrix material is melted at 820 °C to accomplish the molten form to mix the reinforcement particulates. Once aluminum reaches the molten state, stirring action is commenced with simultaneous and gradual inclusion of SNS reinforcements into the melt. The stirring process at elevated temperature avoids the agglomeration and ensures the uniform dispersion of reinforcements. Stir-casting possesses superior control over the evolution of matrix structure with greater flexibility in process handling at a competitive cost. Three distinct aluminum–matrix composites Al98SNS2, Al96SNS4, and Al94SNS6 are stir-casted with 2, 4 and 6% (by weight) of SNS reinforcements, respectively.

2.2.2. Sample Preparation for the Analyses

The samples were prepared similarly by cutting the discs from a stir-casted cylindrical aluminum–matrix composite specimen and subjected to different investigations. Two of the most important investigations: Morphology was investigated using a scanning electron microscope (SEM, Hitachi TM3030Plus, Tokyo, Japan) and elemental composition using the same device equipped with an energy dispersive spectrometry module (EDS, Bruker, Billerica, MA, USA).
Further, phase composition was verified with a SmartLab diffractometer (Rigaku, Tokyo, Japan) with CuKα radiation from 10° to 100° with a step size of 0.02°/min. To determine the surface roughness of the samples, a surface profiler (Dektak 150, Veeco Instruments Inc., New York, NY, USA) equipped with a stylus with a radius of 12.5 µm was used on 4000 µm surface length, with a resolution of 0.222 µm/sample and applied force of 5 mg. For each investigated surface, ten profiles were measured, and the obtained values were averaged. The electrochemical behavior of the investigated specimens was examined by electrochemical impedance spectroscopy (EIS) and polarization methods. The measurements were performed using a VersaStat 3 potentiostat/galvanostat (Princeton Applied Research) and the data were acquired using a VersaStudio software (version x). All the electrochemical tests were performed in 3.5% NaCl solution, at room temperature (22 ± 1 °C). A three standard electrode cell was used: a Pt counter electrode, a KCl saturated Ag/AgCl reference electrode (0.197 V), and Al94% + SNS6%, Al96% + SNS4% and Al98% + SNS2% as the working electrode. Prior to testing, the open circuit potential (Eoc) was recorded for 1 h. Impedance measurements were performed at open circuit potential with a constant perturbing a.c. signal amplitude of 10 mV over a frequency range extending from 0.5 mHz to 104 Hz. Analysis of the spectra was performed by equivalent circuit fitting using Zview software (version x). The quality of the fit is described by the average error of regression (χ2). Linear polarization, Tafel and potentiodynamic curves were performed by applying a potential of −20 to 20 mV vs. EOC, −250 to 250 mV vs. EOC and −1 V vs. Eoc to 2V vs. Ref, respectively, with a scanning rate of 1 mV/s, except for linear polarization where the scan rate was 0.167 mV/s. All tests were repeated several times to confirm data reliability (two or three times where it was needed). The corrosion tests were performed according to the protocol described in the standard ISO 16151:2018. Tribological performance was performed in dry atmosphere (22 ± 0.5 °C) using the pin on disc method. Tribocorrosion test was carried out in different media at room temperature (22 ± 0.5 °C) using pin on disc method: Deionized water, which is a neutral environment, 0.8 and 3.5% NaCl, which are low and highly corrosive solutions. For both tests, the friction coefficient in time and wear rate at the end of the test were determined and compared. The test conditions were: Contour piece—safire ball with 6 mm in diameter; applied load—1 N, rotating speed—10 cm/s, sliding distance—100 m. The wear rate (k) was calculated by normalizing the worn volume (V) over the normal load (F) and the sliding distance (d): k = V/F·d, in good agreement with EN 1071−13:2010 standard. The worn volume was calculated by determining the cross-sectional areas of the wear scar at 5 points on each wear track.

3. Results and Discussion

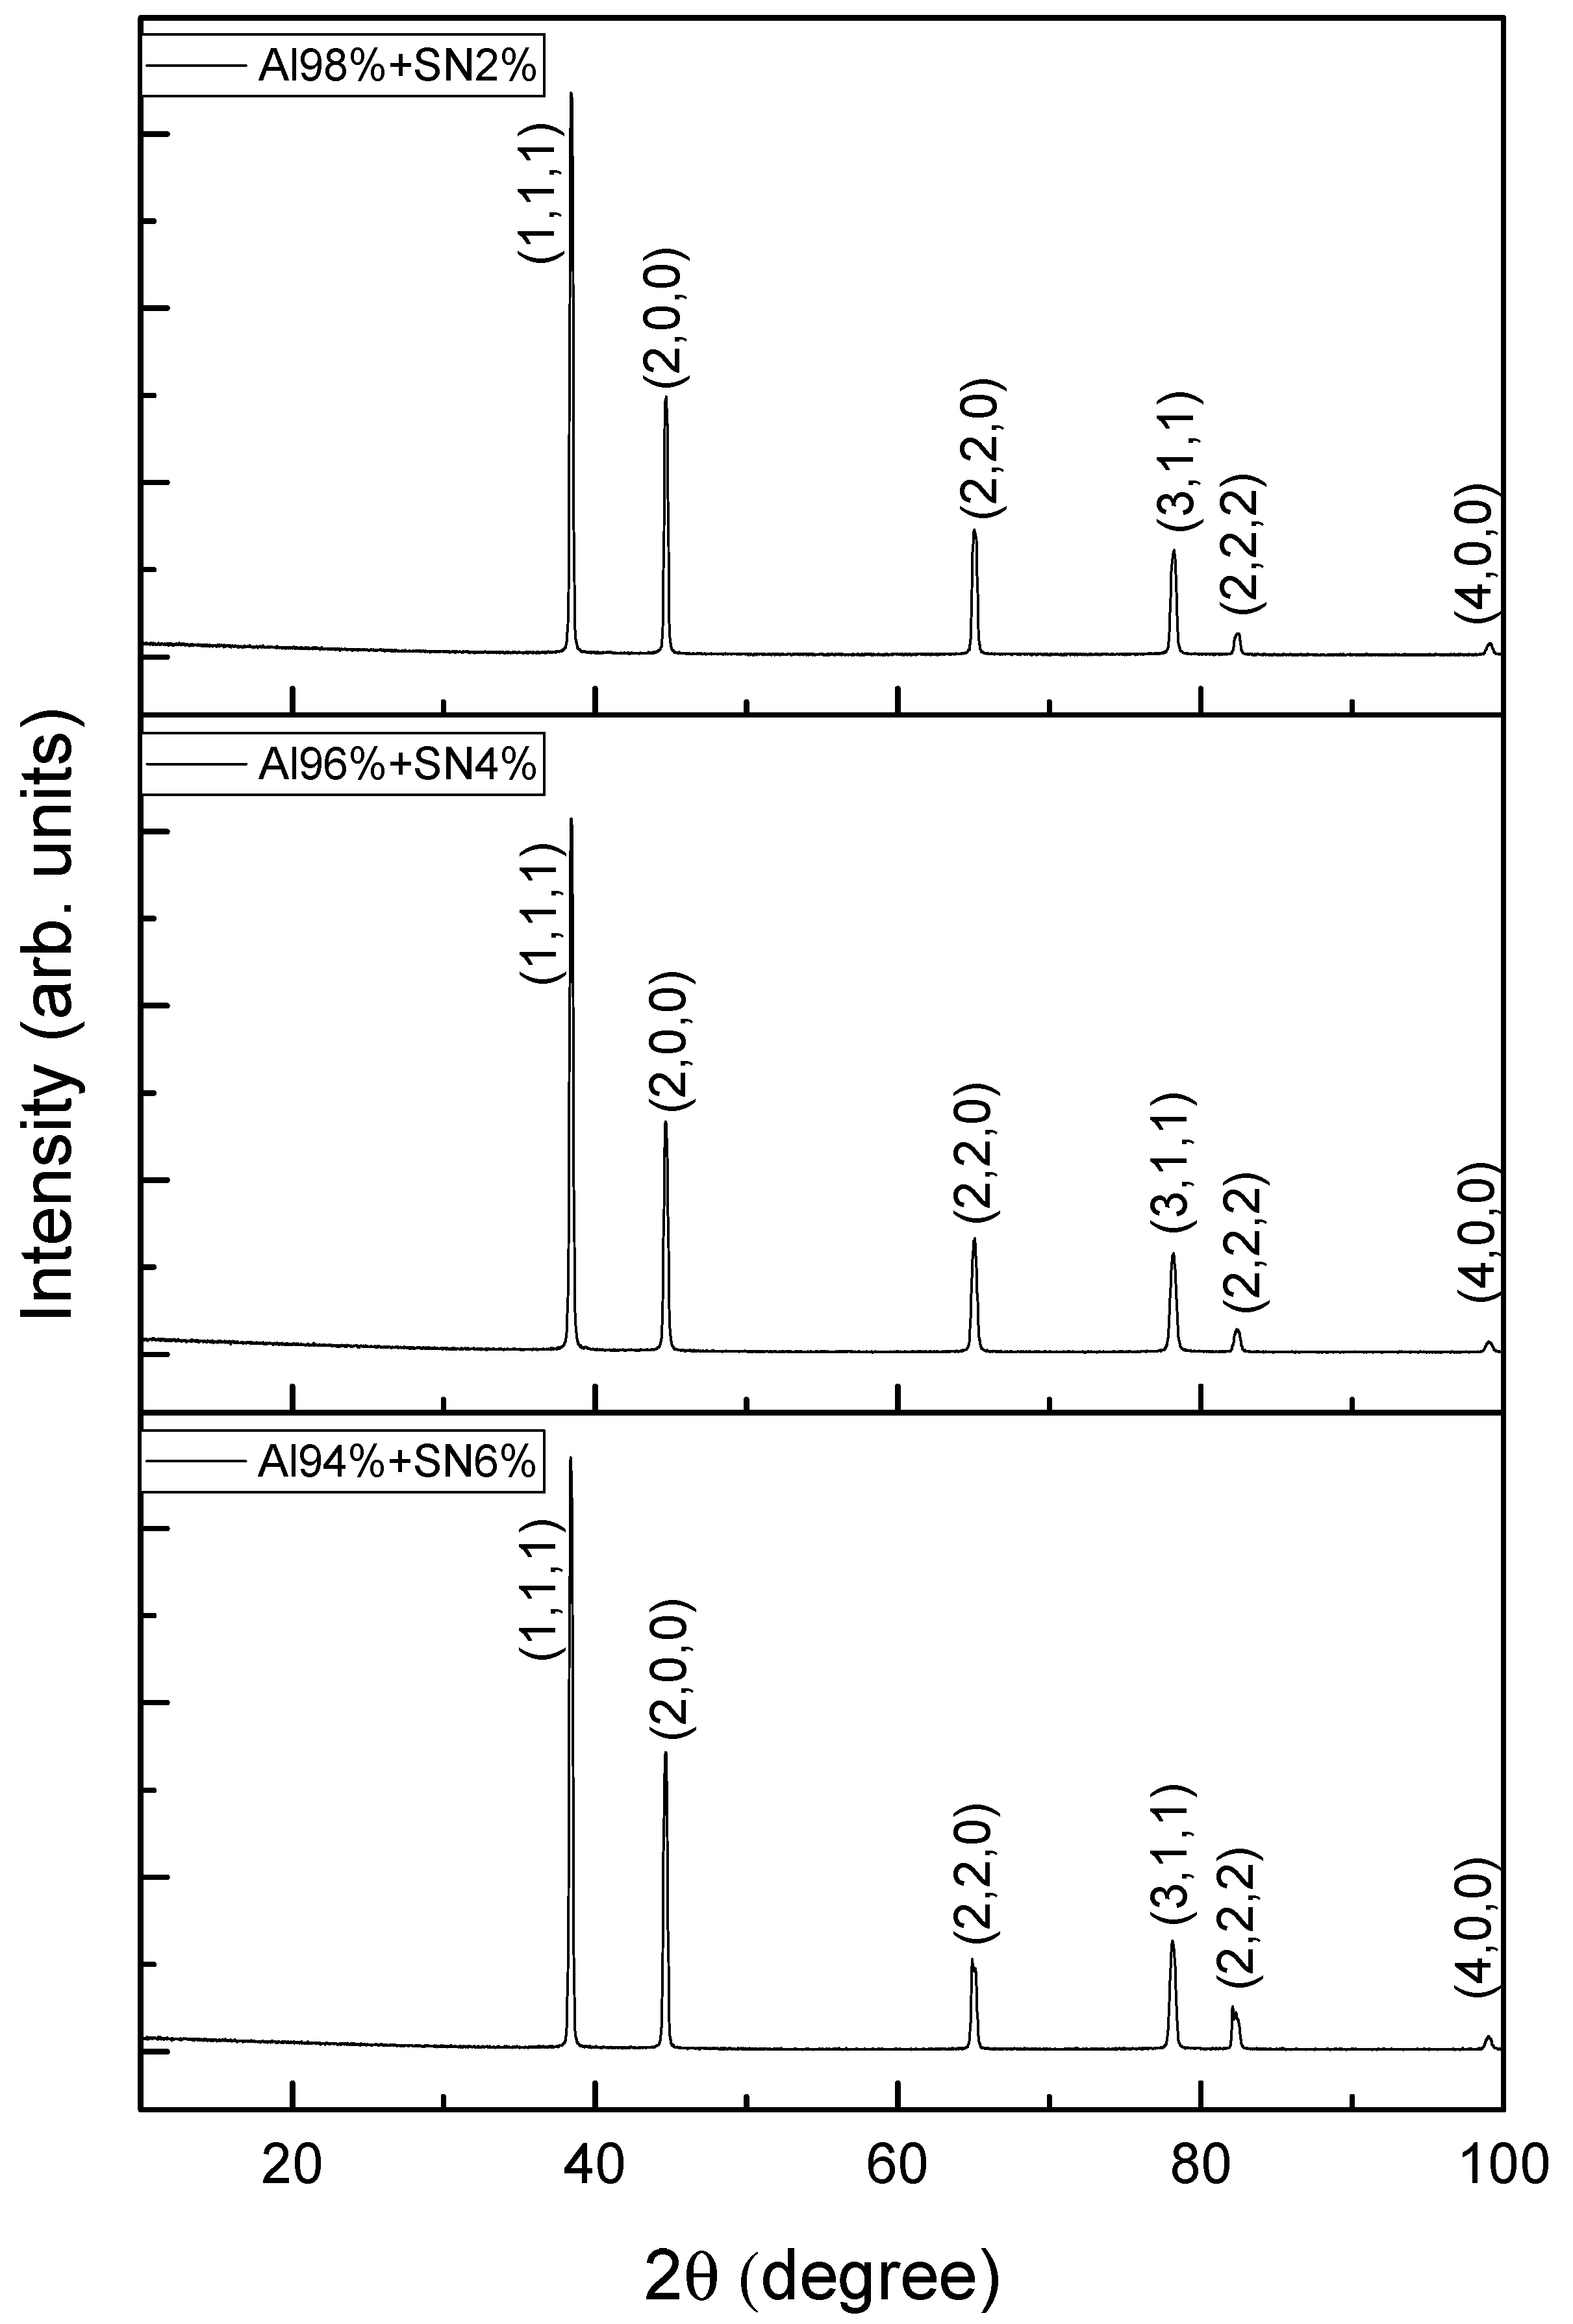
3.1. Elemental and Phase Composition

Using the EDS investigation technique, the elemental composition of the investigated samples was analyzed, as can be seen in Table 3. The exploration of calcium in the composition implies the presence of SNS inclusion in the matrix structure of metal–matrix composite.
In Figure 2, XRD diffraction pattern of investigated samples is presented. All samples exhibited (111) preferred orientation. To sustain this, the texture coefficients are calculated (Table 4). Note that the texture after (111) plan is higher than others, indicating a texture oriented after this plan. The grain size, determined by the Debye–Scherrer equation of the peak (111), is presented in Table 4. One may see that the grain size decreased by increasing % SNS.

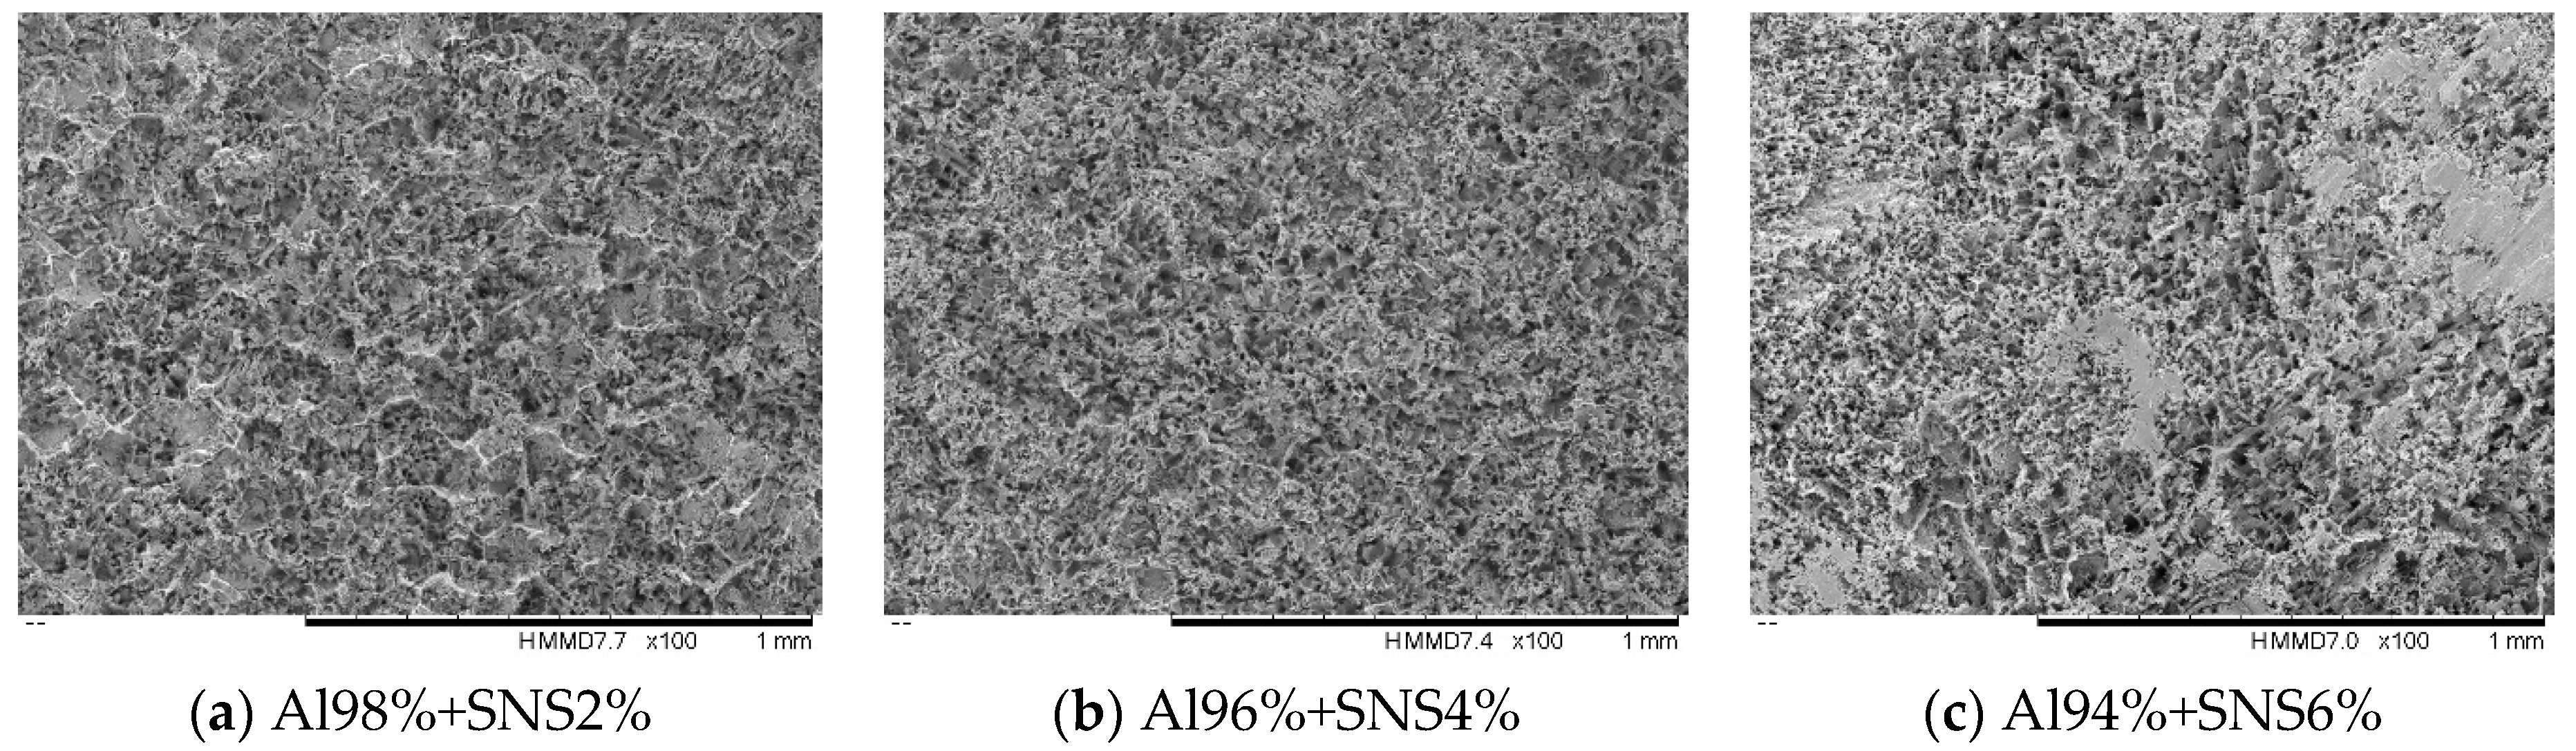
3.2. Morphology and Roughness as Received Surfaces

The morphology of samples manufactured in this research was investigated by the SEM method (Figure 3). The Al98SNS2 composite shows a continuous material pattern, as depicted in Figure 3a, that holds the least snail shell reinforcement. The samples Al96SNS4 and Al94SNS6 of composites containing more snail, as shown in Figure 3b,c, indicate a material morphology containing surfaces with delamination between the matrix and snail composition. Table 5 shows the main surface texture parameters of the investigated surfaces: Ra: The arithmetic average of the roughness profile, Rq: The root means square average of the roughness profile, Ssk: Skewness (according to the ISO 2517 standard). All investigated surfaces are rougher.
A negative value of Ssk shows that the surface consists of many valleys, while a surface with a positive Ssk contains mainly peaks and asperities. Therefore, a surface with negative Ssk has a good tribological performance in lubrication conditions. Surface roughness is found to be minimum in Al94SNS6 composite, as shown in Table 5. However, the standard deviation (STDEV) of the roughness profile of Al94SNS6 is the highest among the composites. Thus, Al98SNS2 exhibits the lowest Ra considering the magnitude of STDEV.

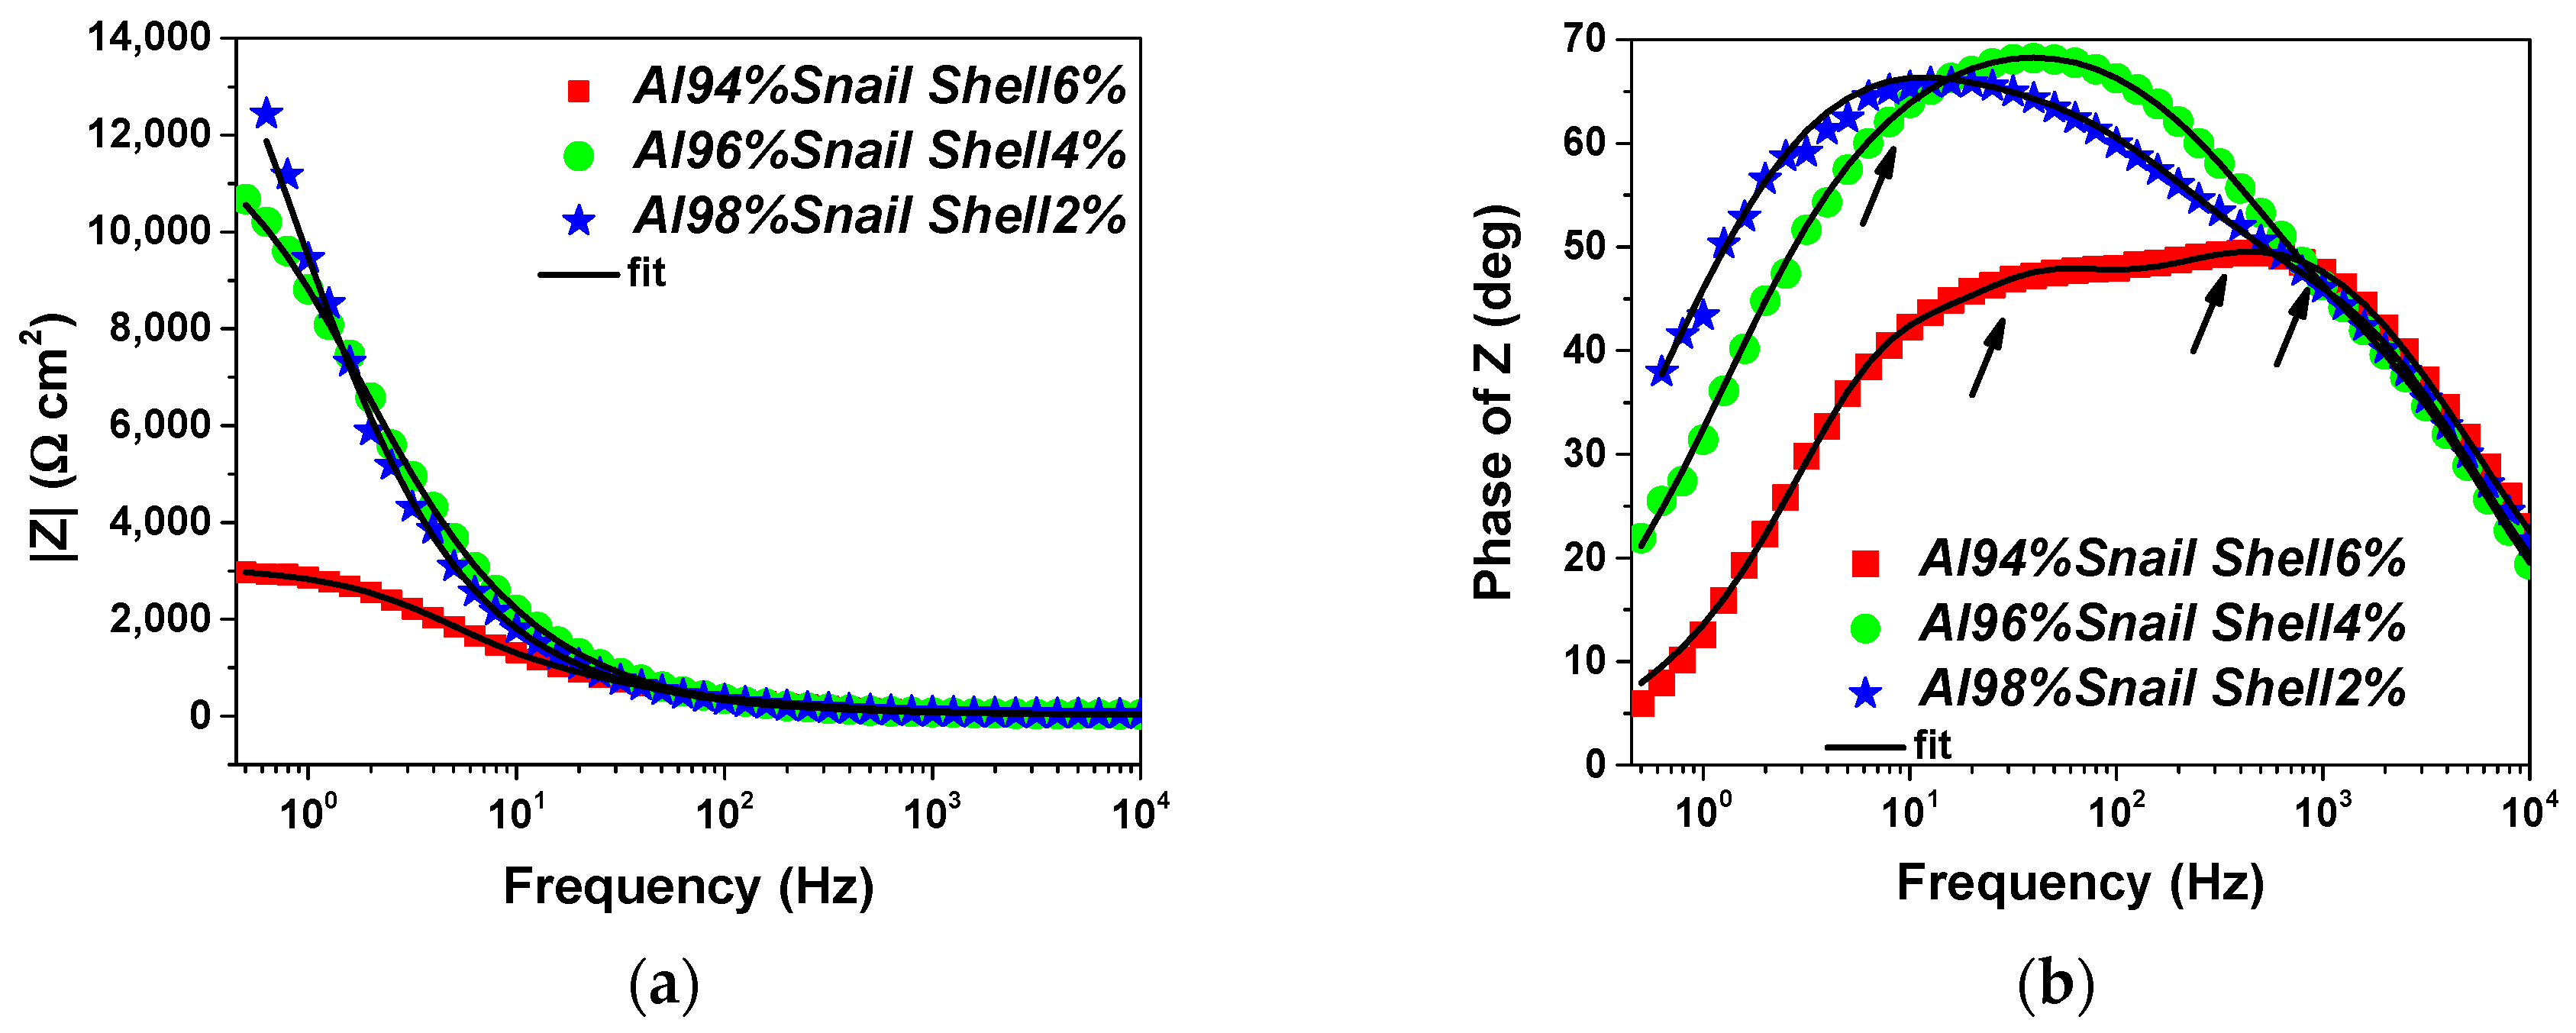
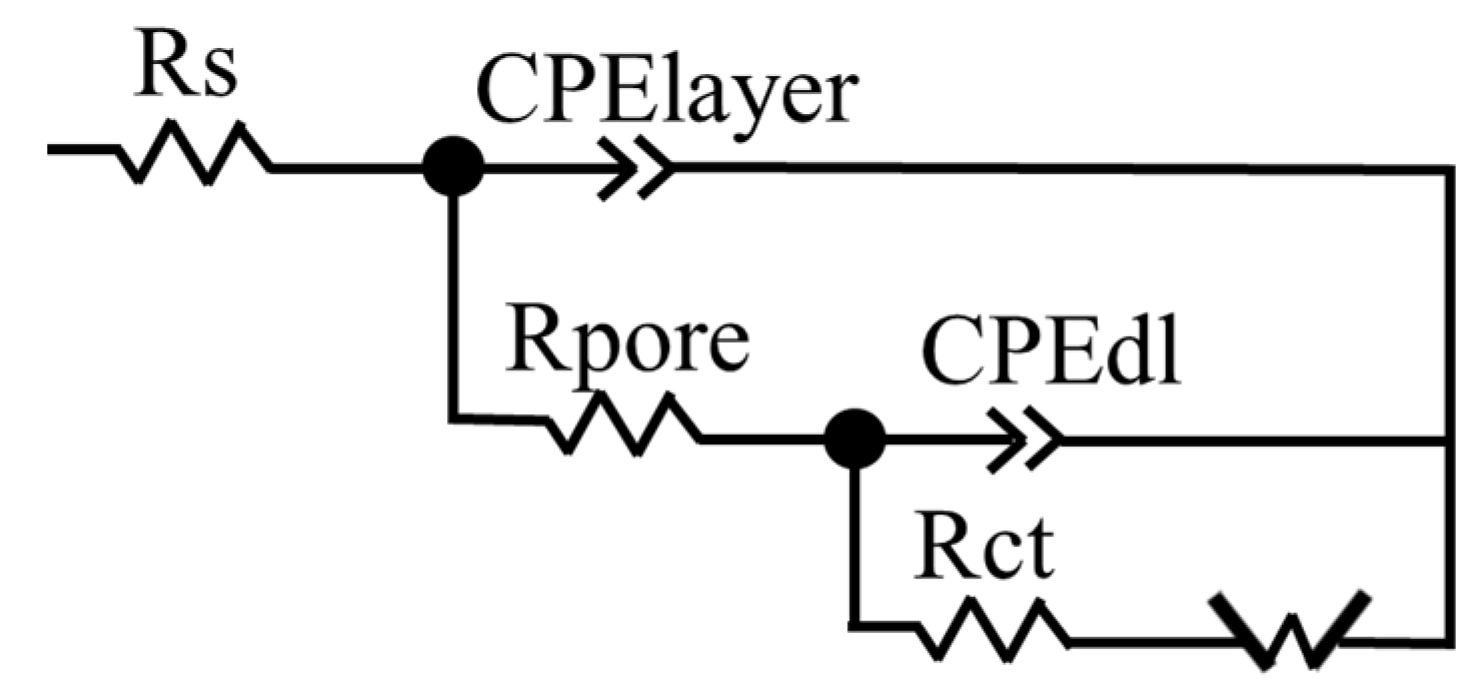
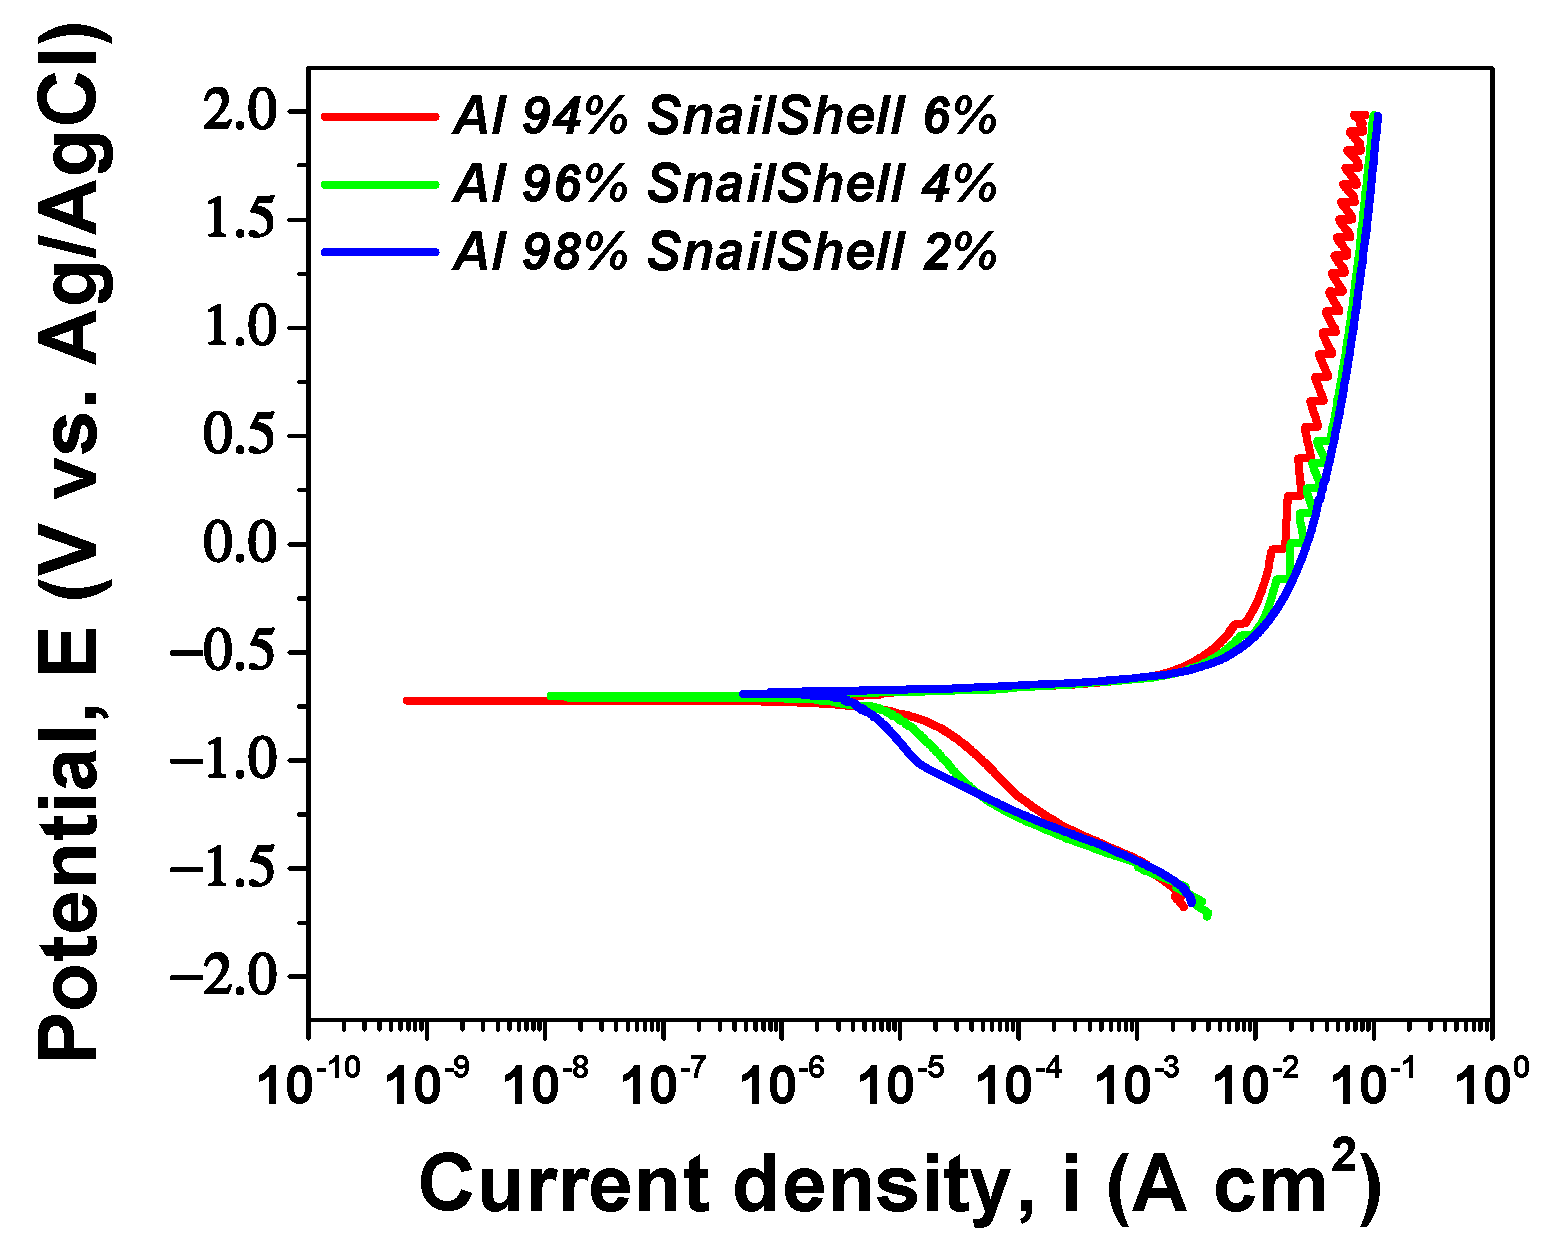
3.3. Electrochemical Performance

The evolution of the open circuit potential (EOC) is presented in Figure 4a. The initial values of the investigated specimens are similar, however, after 1 h immersion, an increasing tendency is observed according to Al content. Even though it has a noisy curve in time, Al98SNS2 demonstrates the most electropositive value at the end of the test. During the test, the EOC of Al96SNS4 shows a steady evolution, indicating a stable surface, with the formation of stable oxide. In the beginning, the sample Al98SNS2 is stable, but after 2000 s, it starts to have many fluctuations, indicating the formation/destruction of the formed oxides. This effect is more pronounced in the case of Al94SNS6 samples, the abrupt drop means the destruction of the oxide layer. EIS measured data, along with the fitted line, are presented in Figure 4 and Figure 5. It can be observed in the Nyquist plot that on the measured frequency range, the impedance spectra showed a depressed semicircle with the diameter directly proportional to the composition: The higher Al content, the higher the diameter. It can also be observed in the magnitude Bode plot that a higher percentage of Al and a decreasing content of SNS has a beneficial effect on the overall system impedance, the highest value was observed in the case of Al98SNS2.
The equivalent circuit used for fitting the impedance data is presented in Figure 6. Considering the depressed semicircles in the Nyquist plot, the two times constants present in the Bode diagram (shown by arrows), and the relatively low phase angle for each analyzed system, the equivalent circuit for fitting the EIS data also contained a Warburg impedance. This is typical in the corrosion process where diffusion of oxygen plays an important role, and it indicates the presence of a mass-transfer reaction [30]. Rs represents the solution resistance, Rpore and CPElayer represent the constant phase element and resistance associated with the current flow through the oxide’s pores, respectively. Considering the measured values, a constant phase element (CPE) is used in the circuit instead of an ideal capacitor, typically used for the rough surfaces which can cause a dispersion effect. CPEdl and Rct parameters are assigned to the interface formed between the used electrode and the solution, where a double layer is formed, thus CPEdl is used in parallel with a charge transfer resistance.
There is an excellent agreement between the experimental data and fittings since there is a low value of χ2 parameter, demonstrating that the selected circuit is statistically proved to be correct. The fitting results of EIS data for the investigated systems are presented in Table 6. The Rs parameter shows a slow decrease, giving an indication of the species depletion and the more intense reactions occurring at the electrode-electrolyte interface. The existence of Yo and Rpore gives an indication that oxides are formed at the surface of Al-SNS specimens, with high resistance in the case of Al94SNS6, which blocks the electrolyte ingress through pores, giving a higher Rct value for all the specimens, especially in the case of Al96SNS4, which also has the lowest value of Rpore (123 Ω cm2). Comparing the analyzed samples, the n1 parameter has the tendency of increasing, from n1Al94%SNSl6% = 0.75 to n1Al96%SNSl4% = 0.87, where an optimum is observed, and slowly decreasing towards n1Al98%SNS2% = 0.80. This gives an indication of the nature of oxides formed at the surface and their non-ideal character, the highest dispersion being observed in the case of Al94%SNSl6% (n1 = 0.75), but at the interface with the working electrode the highest value of n2 parameter is seen among all analysed samples. Taking into consideration the Warburg resistance parameter, it can be observed an increasing obtained value correlated with the increase of Al content.
Potentiodynamic curves of the investigated surfaces are presented in Figure 7. A shift of the curves towards more electropositive potential values is observed, even though there is also an increasing current density according to composition. The potentiodynamic curves presented in Figure 7 are overlapping, maintaining the same tendency of current density decreasing.
The main corrosion parameters of the investigated specimens are presented in Table 7. It is known that a corrosion potential with more electropositive values, a low value of corrosion current density, and a high polarization resistance gives an indication related to high corrosion resistance.
The most electropositive values of Eoc parameter are indicated in the case of Al98SNS (Eoc = −716 mV), followed by Al96SNS4 and Al94SNS6. Moreover, in this case, the higher the Al content, the better the Eoc parameter is. The same result is obtained in the case of corrosion potential (Ecorr), when the tendency is the same: Al98SNS2 > Al96SNS4 > Al94SNS6. The highest polarization resistance is also demonstrated by the investigated specimen with the highest Al content, i.e., Al98SNS2 (Rp = 38 kΩ cm2). However, the corrosion current density is lower in the case Al94SNS6. Ssk value may be indicative of localized corrosion. Taking into account this state, one may see that the surface of Al94SNS6 is less resistant to corrosion probably due to the high negative Ssk value.

3.4. Elemental Composition after Corrosion

Using the EDS investigation technique, the elemental composition of the investigated samples after corrosion is analyzed, as can be seen in Table 8. The corrosion phenomenon influences the chemical composition of the composite. Corrosion decreases the carbon content irrespective of the percentage of inclusion of SNS reinforcement. The decrement is recognized in zinc and calcium as well. However, the weight percentage of oxygen, silicon, iron, and manganese are increased as a consequence of corrosion.

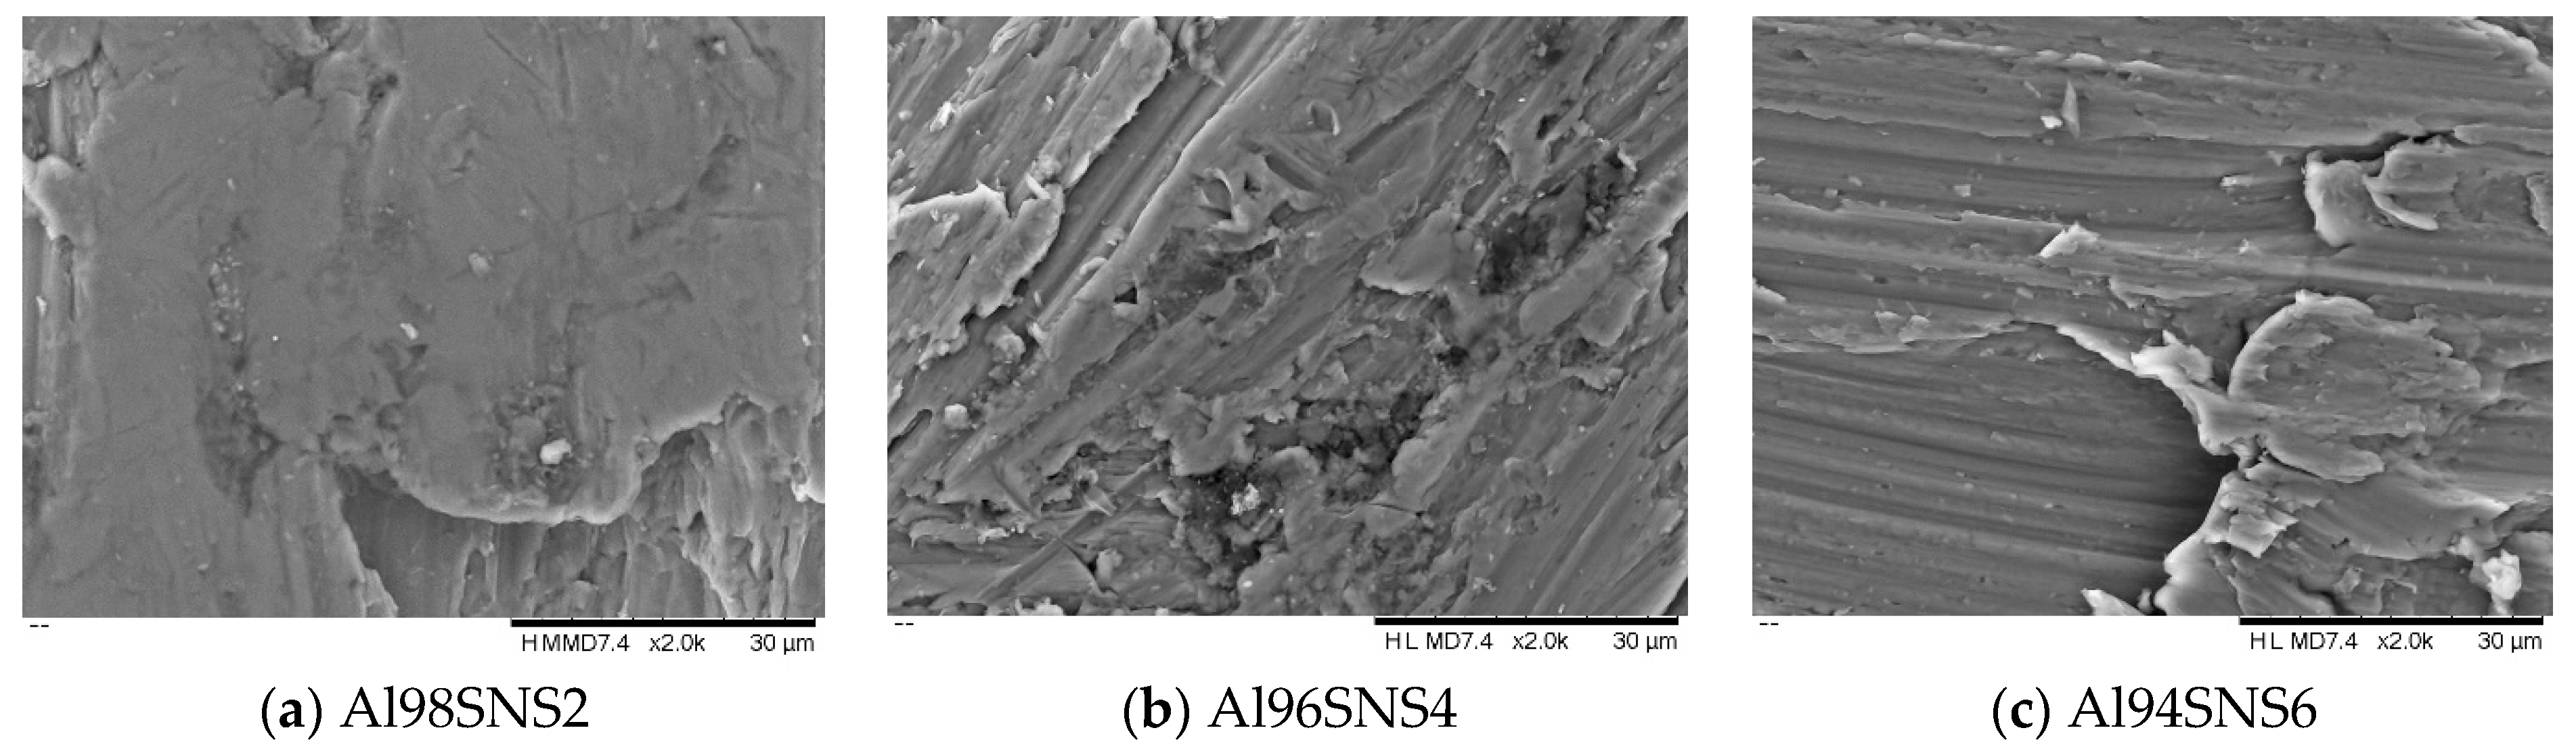
3.5. Morphology and Roughness after Corrosion

In Figure 8, SEM images of the surfaces after electrochemical corrosion are presented. It can be seen a modification of the surfaces after corrosion, indicating that the surface is affected by the corrosive solution. The influence of corrosion on the SNS-reinforced aluminum–matrix composites is clearly visible through morphological studies, which is reflected in the SEM images as well. The severity of corrosion is more when the percentage (by weight) of SNS increases in the aluminum–matrix composites, as represented in Figure 8.
Based on the SEM images of the surfaces after corrosion tests, one may see many corrosion products on all surfaces. On the sample of Al94% + SNS6%, some regions are similar to the surface before corrosion (Figure 3), meaning that this surface is more resistant to corrosion. The corrosion products found on the surface of Al94% + SNS6% exhibited low dimensions and a heterogeneous aspect. This morphology is typical for the corroded aluminum samples into 3% NaCl, as it is reported by various researchers [31].
In Table 9, the main surface texture parameters of the investigated surfaces after corrosion tests are presented.
Compared with the roughness values before corrosion (Table 5), all of the investigated surfaces are rougher after corrosion tests, demonstrating that each surface is affected by the corrosive solution in different ways. The influence of corrosion is more evident on the surface of Al98SNS2 composite, as given in Table 9. However, the magnitudes of STDEV are higher for Al96SNS4 and Al94SNS6 composites. Moreover, Ra and Rq values of Al96SNS4 and Al94SNS6 composites are very close to Al98SNS2 composite. Ssk is close to zero value for the Al96SNS4 sample, indicating that this surface has perfectly symmetrical valleys and holes. The Al94SNS6 has negative Ssk, indicating that the surface can greatly help to enhance the corrosion performance. Note that the Al94SNS6 composites exhibited a negative Ssk, indicating an increase in the corrosion process.

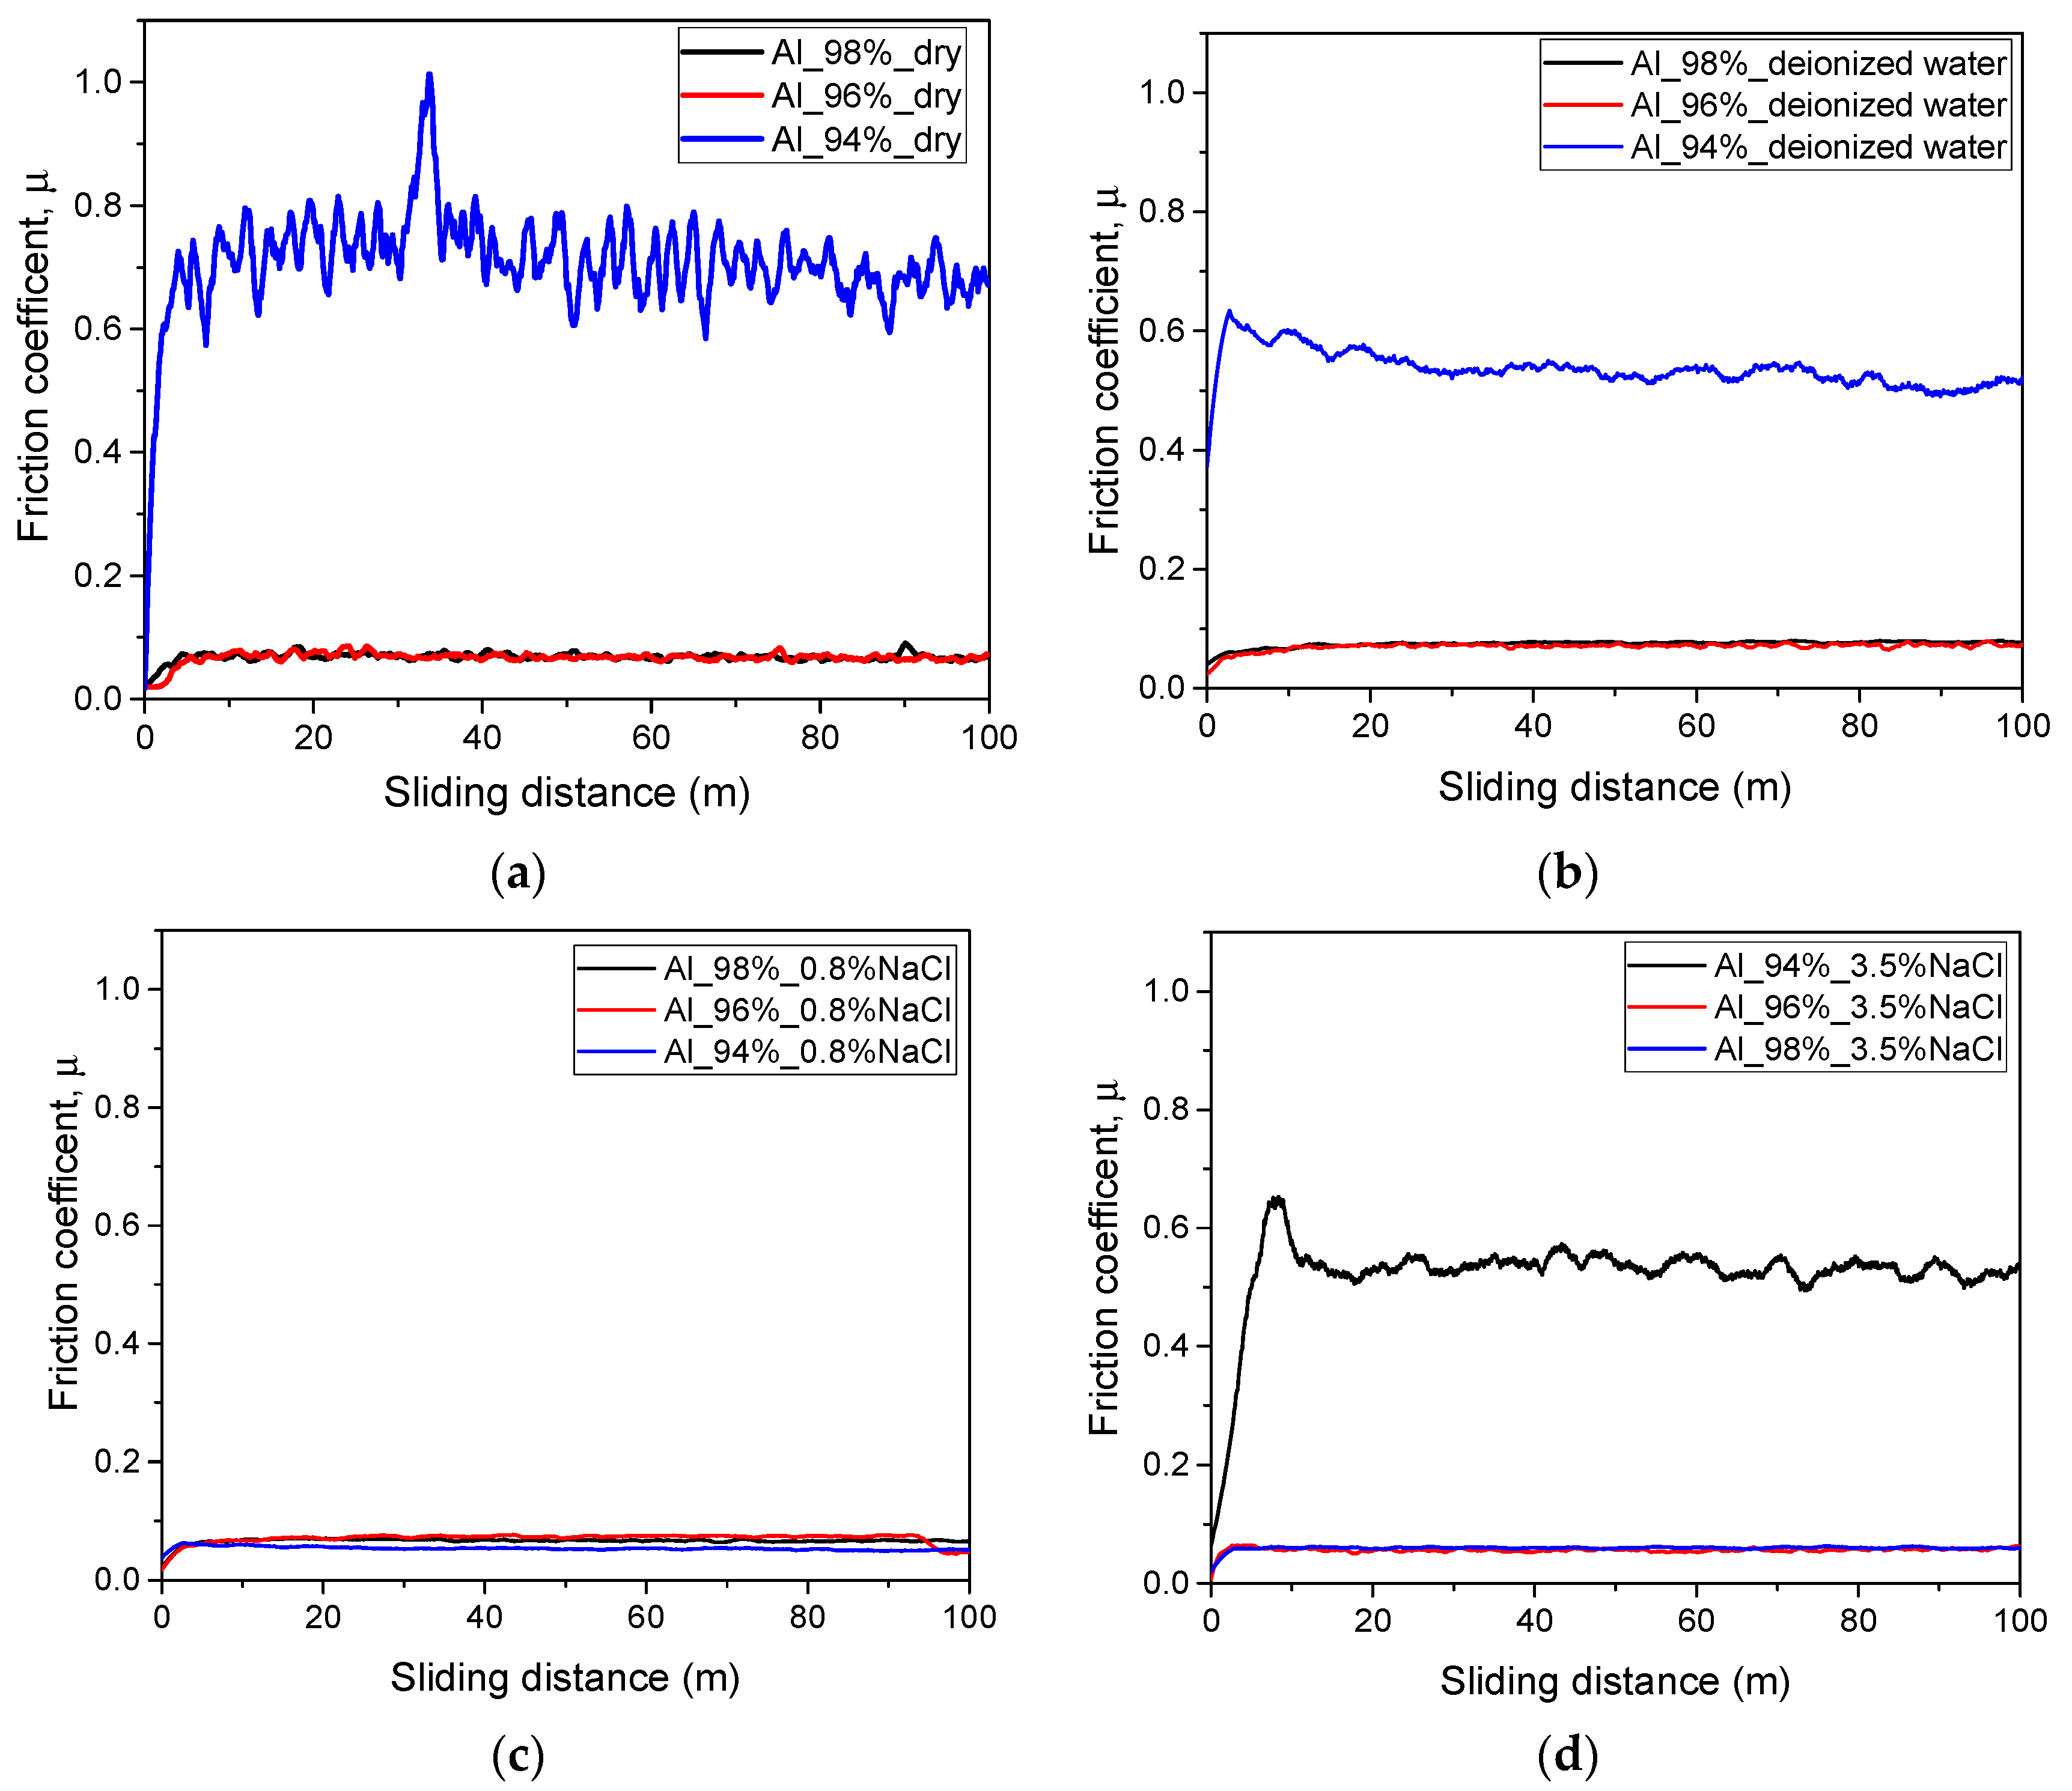
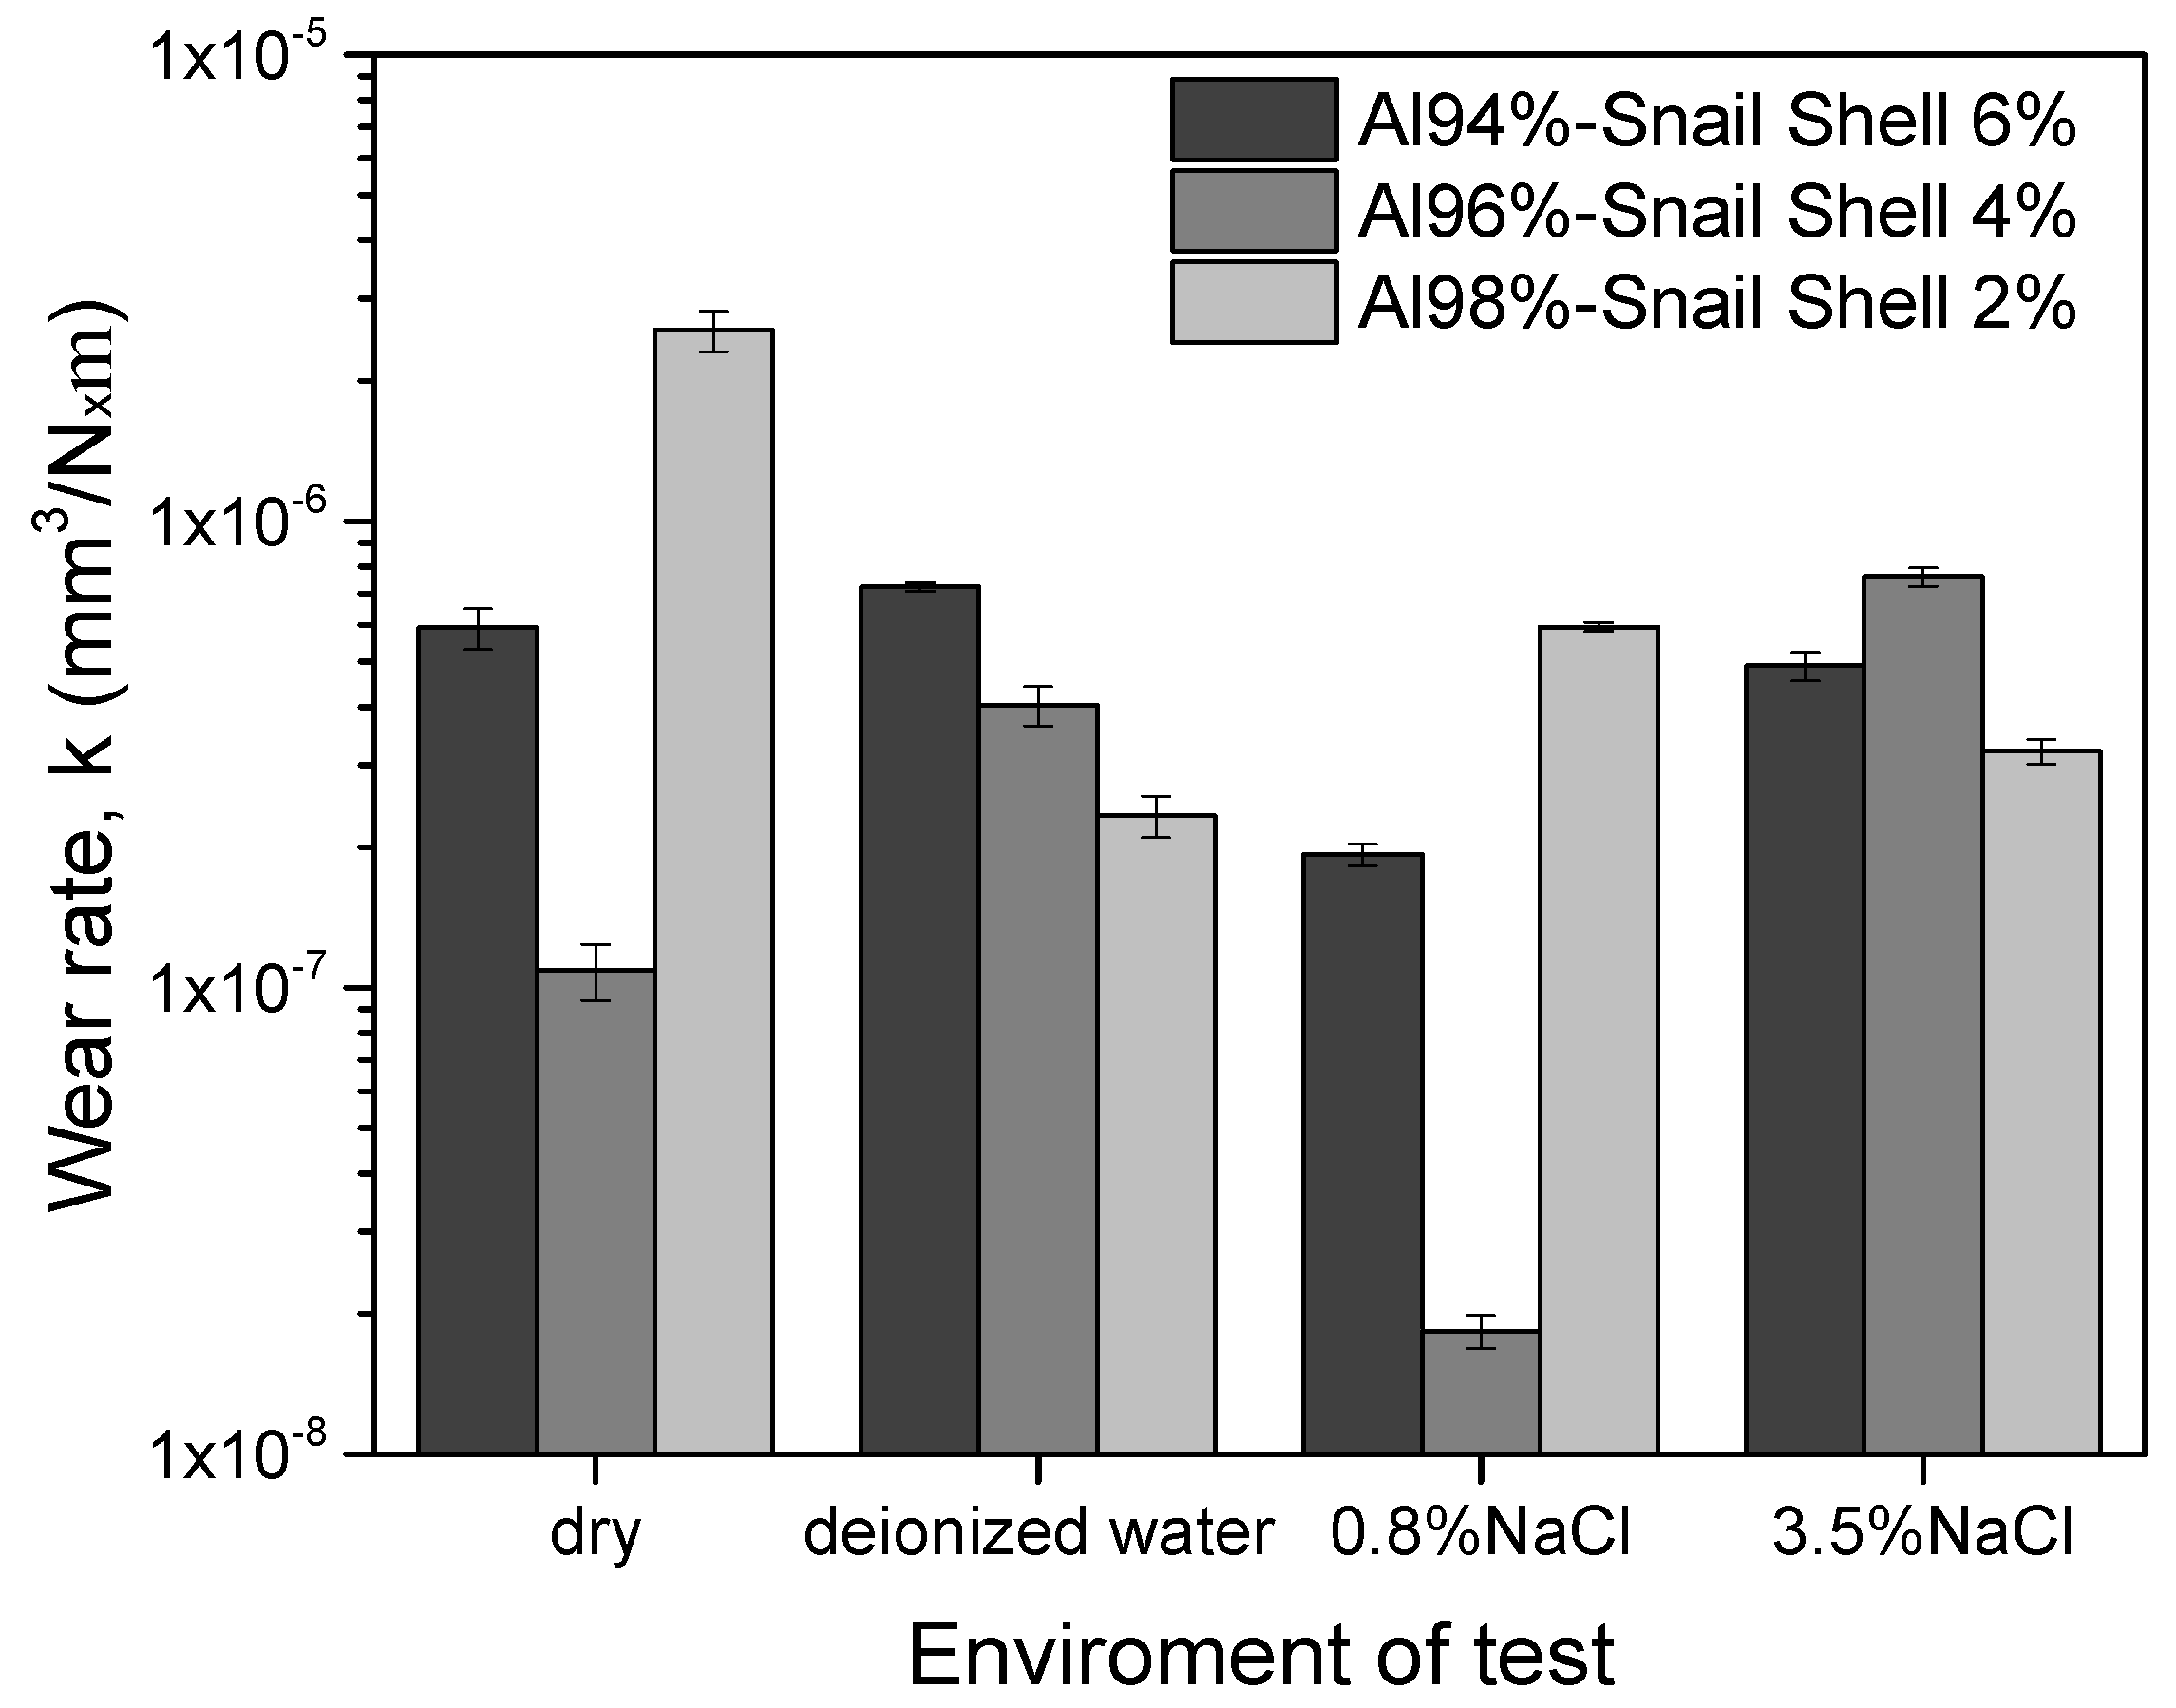
3.6. Tribological and Tribocorrosion Performance

Both tribological and tribocorrosive behaviors are expressed in terms of the change in the friction coefficient (µ) vs. sliding distance in the dry/corrosive solution and wear rate (k) at the end of the test. Figure 9 shows the evolution of the coefficients of friction as a function of sliding distance.
In dry atmosphere, Al98SNS2 and Al96SNS4 exhibit low friction coefficient, being very close. Al94SNS6 has high friction coefficient, indicating poor wear resistance. In deionized water, Al94SNS6 has a high value of friction coefficient, while for the other two, the values are similar. All samples tested in 0.8% NaCl exhibited a similar friction coefficient, of around 0.06. For the surface tested in 3.5% NaCl, the Al94SNS6 reveals high friction coefficient, while Al96SNS4 and Al98SNS2 have similar a value of around 0.06. It was reported that the negative skewness can help to improve the contact and lubrication conditions to further run-in the surfaces [32]. Taking into account this finding, the good tribological properties of Al98SNS2 ceramic can be attributed to its negative low Ssk (Table 5).
The experimental results also suggest that the rougher surfaces (Al96SNS4) may work in a severe environment of contact and lubrication, especially under excessive loading and high friction process. It seems that under the lubricant conditions, the surface with negative skewness is no longer effective in sufficiently bringing down the degree of friction. In conclusion, it seems that the Al96SNS4 exhibits a low friction coefficient whatever the environment is, while Al98SNS2 is good for working in dry, water, and 0.8% NaCl and Al94SNS6 are proper just for surfaces used work in corrosive media (0.8 or 3.5% NaCl).
Figure 10 presents the wear rate (k), calculated by the determination of the cross-sectional areas of the wear scar at 5 points on each wear track at the end of the test. For samples tested in dry atmosphere, Al96SNS4 exhibited a low wear rate, followed by Al94SNS6 and Al98SNS2. In the case of tests performed in water, a low wear rate is found for Al98SNS2. For the test carried out in 0.8% NaCl, Al96SNS4 has the lowest wear rate, while in 3.5% NaCl, Al98SNS2 has a low value. Note that the Al94SNS6 is more resistant in 0.8% NaCl than in 3.5% NaCl. In dry atmosphere and water, it can be seen to have a similar wear rate. The Al96SNS4 surface is more resistant in 0.8% NaCl and dry atmosphere, and it has low resistance to a highly corrosive solution of 3.5% NaCl. Al98SNS2 surface has a high wear rate in dry atmosphere, while in 3.5% NaCl and water, it is more resistant.

4. Conclusions

The present work concentrates on developing snail shell reinforced aluminum–matrix composites with distinct percentages (by weight) of snail shell reinforcements. These novel composites are involved in robust assessment for analyzing the morphology and tribological behavior of these green composite materials. The influence of snail shells as reinforcements is also investigated in the current work, and the following inferences are drawn.
The presence of carbon decreases in the range of 17.53% to 44.36% as a consequence of corrosion in SNS-reinforced aluminum–matrix composites, whereas Al98SNS2 composite decreases the carbon content of up to 18.60%.
It was found that the silicon content increased in the range of 12.50% to 76.92% as a result of corrosion in SNS-reinforced aluminum–matrix composites. Similar results are observed in oxygen, iron, and manganese content, which are increased due to corrosion in the composite.
The wear rate is very minimal, up to 2% (by weight) inclusion of SNS reinforcement in aluminum–matrix composites, beyond which considerable wear is witnessed in the SNS-reinforced aluminum–matrix composites.
Corrosion behavior deteriorates the surface roughness of the SNS-reinforced aluminum–matrix composites and the arithmetic average of the roughness profile (Ra) increases in the range of 47.69% to 57.99%. A similar tendency is observed in root means square average of the roughness profile (Rq) and increases in the range of 49.57% to 59.60%. Al98SNS2 composite inhibits the surface deterioration considerably more than Al96SNS4 and Al94SNS6 composites.

Author Contributions

Data curation, R.S.; Formal analysis, C.I.P. and A.V.; Methodology, A.V.; Resources, N.R.J.H.; Writing—original draft, A.V. and N.R.J.H.; Writing—review & editing, C.I.P. and R.S. All authors have read and agreed to the published version of the manuscript.

Funding

This work was partially funded by the Romanian Ministry of Research, Innovation and Digitization through the Core Program, Project No. 18N/2019.

Institutional Review Board Statement

Not applicable.

Informed Consent Statement

Not applicable.

Data Availability Statement

Not applicable.

Acknowledgments

The authors acknowledge the support and encouragement by S. Arivazhagan, Principal, P. Nagaraj. Author R. Sankaranarayanan is grateful for the award of fellowship by Mepco Schlenk Engineering College (Autonomous), Sivakasi-626005, Tamilnadu, India (Vide Letter No.: OF/GT/F01/5309/2017-2018, dated 13.03.2018). Alina Vladescu thanks to Tomsk Polytechnic University within the framework of the Tomsk Polytechnic University-Competitiveness Enhancement Program grant, as well as to European Regional Development Fund through Competitiveness Operational Programme 2014-2020, Action 1.1.3 Creating synergies with H2020 Programme, project H2020 Suport Center for European project management and European promotion, MYSMIS code 107874.

Conflicts of Interest

The authors declare no conflict of interest.

References

  1. Surappa, M.K. Aluminium matrix composites: Challenges and opportunities. Sadhana 2003, 28, 319–334. [Google Scholar] [CrossRef]
  2. Shaikh, M.B.N.; Arif, S.; Aziz, T.; Waseem, A.; Shaikh, M.A.N.; Ali, M. Microstructural, mechanical and tribological behaviour of powder metallurgy processed SiC and RHA reinforced Al-based composites. Surf. Interfaces 2019, 15, 166–179. [Google Scholar] [CrossRef]
  3. Mohapatra, J.; Nayak, S.; Mahapatra, M.M. Mechanical and tribology properties of Al-4.5%Cu-5%TiC metal matrix composites for light-weight structures. Int. J. Lightweight Mater. Manuf. 2020, 3, 120–126. [Google Scholar] [CrossRef]
  4. Hynes, N.R.J.; Sankaranarayanan, R.; Tharmaraj, R.; Pruncu, C.I.; Dispinar, D. A comparative study of the mechanical and tribological behaviours of different aluminium matrix-ceramic composites. J. Braz. Soc. Mech. Sci. Eng. 2019, 41, 330. [Google Scholar] [CrossRef]
  5. Panwar, N.; Chauhan, A. Fabrication methods of particulate reinforced aluminium metal matrix composite: A review. Mater. Today Proc. 2018, 5, 5933–5939. [Google Scholar] [CrossRef]
  6. Hynes, N.R.J.; Raja, S.; Tharmaraj, R.; Pruncu, C.I.; Dispinar, D. Mechanical and tribological characteristics of boron carbide reinforcement of AA6061 matrix composite. J. Braz. Soc. Mech. Sci. Eng. 2020, 42, 155. [Google Scholar] [CrossRef]
  7. Miracle, D. Metal matrix composites–from science to technological significance. Compos. Sci. Technol. 2005, 65, 2526–2540. [Google Scholar] [CrossRef]
  8. Bhoi, N.K.; Singh, H.; Pratap, S. Developments in the aluminum metal matrix composites reinforced by micro/nano particles–A review. J. Compos. Mater. 2019, 54, 813–833. [Google Scholar] [CrossRef]
  9. Kim, I.S.; Song, M.Y.; Kim, J.H. Effects of TieB and Si additions on microstructure and mechanical properties of Al-Cu-Mg based aluminum matrix composites. J. Alloys Compd. 2020, 832, 154827. [Google Scholar] [CrossRef]
  10. Selvam, J.D.R.; Dinaharan, I.; Philip, S.V.; Mashinini, P.M. Microstructure and mechanical characterization of in situ synthesized AA6061/(TiB2+Al2O3) hybrid aluminum matrix composites. J. Alloys Compd. 2018, 740, 529–535. [Google Scholar] [CrossRef]
  11. Gayathri, J.; Elansezhian, R. Influence of dual reinforcement (nano CuO þ reused spent alumina catalyst) on microstructure and mechanical properties of aluminium metal matrix composite. J. Alloys Compd. 2020, 829, 154538. [Google Scholar] [CrossRef]
  12. Gxowa-Penxa, Z.; Daswa, P.; Modiba, R.; Mathabathe, M.N.; Bolokang, A.S. Development and characterization of Al–Al3Ni–Sn metal matrix composite. Mater. Chem. Phys. 2021, 259, 124027. [Google Scholar] [CrossRef]
  13. Kolawole, M.Y.; Aweda, J.O.; Abdulkareem, S. Archachatina marginata bio-shells as reinforcement materials in metal matrix composites. Int. J. Automot. Mech. Eng. 2017, 14, 4068–4079. [Google Scholar] [CrossRef]
  14. Ferguson, H.T.; Oladiran, K.A.; Raseed, A.M.; Salawu, A.A. Snail Shell as an Inspiring Engineering Material in Science and Technology Development: A Review. Int. J. Contemp. Res. Rev. 2018, 9, 20408–20416. [Google Scholar] [CrossRef]
  15. Njoku, R.E.; Okon, A.E.; Ikpaki, T.C. Effects of Variation of Particle Size and Weight Fraction on the Tensile Strength and Modulus of Periwinkle Shell Reinforced Polyester Composite. Niger. J. Technol. 2011, 30, 87–93. [Google Scholar]
  16. Atuanya, C.U.; Aigbodion, V.S.; Obiorah, S.O.; Kchaou, M.; Elleuch, R. Emperical model for estimating the mechanical and morphological properties of recycled low density polyethylene/snail shell biocomposites. J. Assoc. Arab Univ. Basic Appl. Sci. 2016, 21, 45–52. [Google Scholar]
  17. Asafa, T.B.; Durowoju, M.O.; Oyewole, A.A.; Solomon, S.O.; Adegoke, R.M.; Aremu, O.J. Potentials of Snail Shell as a Reinforcement for Discarded Aluminum Based Materials. Int. J. Adv. Sci. Technol. 2015, 84, 1–8. [Google Scholar] [CrossRef]
  18. Idusuyi, N.; Olayinka, J.I. Dry sliding wear characteristics of aluminium metal matrix composites: A brief overview. J. Mater. Res. Technol. 2019, 8, 3338–3346. [Google Scholar] [CrossRef]
  19. Joseph, J.S.D.; Kumaragurubaran, B.; Sathish, S. Effect of MoS2 on the wear behavior of aluminium (AlMg0.5Si) composite. Silicon 2019, 12, 1481–1489. [Google Scholar] [CrossRef]
  20. Mistry, J.M.; Gohil, P.P. An overview of diversified reinforcement on aluminum metal matrix composites: Tribological aspects. Proc. Inst. Mech. Eng. Part J J. Eng. Tribol. 2017, 231, 399–421. [Google Scholar] [CrossRef]
  21. Mavhungu, S.T.; Akinlabi, E.T.; Onitiri, M.A.; Varachia, F.M. Aluminum matrix composites for industrial use: Advances and trends. Procedia Manuf. 2017, 7, 178–182. [Google Scholar] [CrossRef]
  22. White, M.M.; Chejlava, M.; Fried, B.; Sherma, J. The concentration of calcium carbonate in shells of freshwater snails. Am. Malacol. Bull. 2007, 22, 139–142. [Google Scholar] [CrossRef]
  23. Waterworld. CORROSION CONTROL: Using Caustic Soda to Control Corrosion and Calcium Carbonate Precipitation. 2022. Available online: https://www.waterworld.com/home/article/16191536/corrosion-control-using-caustic-soda-to-control-corrosion-and-calcium-carbonate-precipitation (accessed on 12 May 2022).
  24. Corrosionpedia. Corrosionpedia Explains Calcium Carbonate. 2022. Available online: https://www.corrosionpedia.com/definition/2032/calcium-carbonate#:~:text=Calcium%20cabonate%20is%20used%20to,white%20color%20to%20-a%20coating (accessed on 12 May 2022).
  25. Tianhua, C. Tribological properties of calcium carbonate powders modified with Tween 40 as lubricant additives. Funct. Mater. 2017, 24, 572–576. [Google Scholar] [CrossRef]
  26. Mahesh, V.P.; Praseeda, S.N.; Rajan, T.P.D.; Pai, B.C.; Hubli, R.C. Processing of surface-treated boron carbide-reinforced aluminum matrix composites by liquid–metal stir-casting technique. J. Compos. Mater. 2011, 45, 2371–2378. [Google Scholar] [CrossRef]
  27. Ali, M.; Mohsen, O. Investigation on mechanical properties of nano-Al2O3-reinforced aluminium matrix composites. J. Compos. Mater. 2011, 45, 2579–2586. [Google Scholar]
  28. Mahmoud, T.S. Tribological behaviour of A390/Grp metal–matrix composites fabricated using a combination of rheocasting and squeeze casting techniques. Proc. Inst. Mech. Eng. Part C J. Mech. Eng. Sci. 2008, 222, 257–265. [Google Scholar] [CrossRef]
  29. Kok, M. Production and mechanical properties of Al2O3 particle-reinforced 2024 aluminium alloy composites. J. Mater. Processing Technol. 2005, 161, 381–387. [Google Scholar] [CrossRef]
  30. Martin, F.J.; Cheek, G.T.; Grady, W.E.; Natishan, P.M. Impedance studies of the passive film on aluminum. Corros. Sci. 2005, 47, 3187–3201. [Google Scholar] [CrossRef]
  31. Hagioglu, P.; Gheorghies, C.; Cantaragiu, A.M.; Moisa, S. The accelerated corrosion behaviour in saline environments of some samples made of tombac, copper and aluminium. J. Sci. Arts 2010, 10, 153–160. [Google Scholar]
  32. Chang, L.; Jeng, Y.-R. Effects of negative skewness of surface roughness on the contact and lubrication of nominally flat metallic surfaces. Proc. IMechE Part J Eng. Tribol. 2012, 227, 559–569. [Google Scholar] [CrossRef]
Figure 1. Physella Acuta Fresh water pond snail shells.
Coatings 12 00794 g001
Figure 2. X-ray diffraction of the investigated samples.
Coatings 12 00794 g002
Figure 3. SEM images of the investigated samples.
Coatings 12 00794 g003
Figure 4. (a) Evolution of the open circuit potential and (b) Nyquist plot of the investigated specimens (Scatter line—measured data, continuous line—fitted data).
Coatings 12 00794 g004
Figure 5. (a) Magnitude and (b) phase Bode plot of the investigated specimens (Scatter line—measured data, continuous line—fitted data).
Coatings 12 00794 g005
Figure 6. Equivalent circuit used for fitting.
Coatings 12 00794 g006
Figure 7. Potentiodynamic curves of the investigated specimens.
Coatings 12 00794 g007
Figure 8. SEM images of the investigated samples after corrosion tests.
Coatings 12 00794 g008
Figure 9. Evolution of the friction coefficient (µ) vs. sliding distance. (a) dry condition, (b) deionized water, (c) 0.8 % NaCl, and (d) 3.5 % NaCl.
Coatings 12 00794 g009
Figure 10. Wear rate for investigated samples in dry atmosphere, deionized water, 0.8% and 3.5%NaCl (averaged values of 5 points on each wear track).
Coatings 12 00794 g010
Table 1. Chemical composition of commercially available pure aluminum (LM0).
MaterialsFeMnMgCu NiZnSiTiPbAl
Presence
in %
0.400.030.030.030.030.070.300.030.03Balance
Table 2. Volume fractions of the SNS powder.
SNS Wt. %SNS Wt. (g)LM0 Wt. %LM0 Wt. (g)SNS Volume FractionLM0 Volume Fraction
2309814704.1995.81
4609614408.2091.80
69094141012.0387.97
Table 3. EDS—elemental composition results before corrosion (at %); (the calculated SD is averaged from 10 measurements, 5 on each of the 2 replicates).
ElementAl98SNS2
(norm. at %)
Al96SNS4
(norm. at %)
Al94SNS6
(norm. at %)
Carbon2.15 ± 0.0632.75 ± 0.0851.94 ± 0.057
Oxygen0.75 ± 0.0170.76 ± 0.0170.74 ± 0.016
Silicon0.03 ± 0.0010.07 ± 0.0020.05 ± 0.002
Iron0.04 ± 0.0010.07 ± 0.0020.19 ± 0.004
Zinc0.01± 0.0010.04 ± 0.0010.04 ± 0.001
Calcium0.01 ± 0.0010.02 ± 0.0010.01 ± 0.001
Manganese0.01 ± 00.00 ± 00.00 ± 0
AluminumRemainingRemainingRemaining
Table 4. Texture coefficient T(hkl) and crystallite size d (calculated after (111) plan).
SampleT(hkl)
(1,1,1)(2,0,0)(2,2,0)(3,1,1,)(2,2,2)(4,0,0)d (nm)
Al98SNS20.3880.2070.1320.1240.0270.01835.17
Al96SNS40.3950.2010.1290.1290.0310.01831.85
Al94SNS60.4130.2520.1070.1420.0670.01830.37
Table 5. Roughness results of the as received surface (before corrosion or tribological tests) (averaged values of 10 profiles on each investigated sample).
SchemeRa, nmRq, nmSsk
AverageSTDEVAverageSTDEVAverageSTDEV
Al98SNS25187.42591.426331.80519.49−0.150.16
Al96SNS45875.75408.957059.99302.57−0.280.13
Al94SNS64794.64673.445805.84588.04−0.110.14
Table 6. The fitting results of EIS data for the investigated systems.
ParametersSample
Al98SNS2Al96SNS4Al94SNS6
Rs (Ω cm2)26.1227.1328.95
Y0 (Ω−1 cm−2 sn)1.13 × 10−55.88 × 10−61.52 × 10⁻⁵
n10.800.870.75
Rpor (Ω cm2)244123769
Y0’ (Ω−1 cm−2 sn)5.80 × 10−67.02 × 10−64.56 × 10⁻⁶
n20.850.820.99
Rct (Ω cm2)283.292001013
W (Ω cm2 sn)18,62730631325
χ20.00050.00010.0002
Table 7. Main corrosion parameters of the investigated specimens.
ParametersSample
Al98SNS2Al96SNS4Al94SNS6
Eoc (mV)−716−717−799
Rp (kΩ cm2)38315
Ecorr (mV)−673−703−832
icorr (nA cm−2)1214422.6
Table 8. EDS—elemental composition results after corrosion (Weight %); (the calculated SD is averaged from 10 measurements, 5 on each of the 2 replicates).
ElementAl98SNS2
(norm. at %)
Al96SNS4
(norm. at %)
Al94SNS6
(norm. at %)
Carbon1.75 ± 0.0521.53 ± 0.0471.60 ± 0.049
Oxygen1.70 ± 0.0462.02 ± 0.0602.26 ± 0.074
Silicon0.13 ± 0.0040.08 ± 0.0010.12 ± 0.001
Iron0.94 ± 0.0180.49 ± 0.0081.02 ± 0.042
Zinc0.01 ± 0.0010.000.00
Calcium0.00 0.000.01 ± 0.001
Manganese0.01 ± 0.0010.01 ± 0.0010.01 ± 0.001
AluminumRemainingRemainingRemaining
Table 9. Roughness results after corrosion (averaged values of 10 profiles on each investigated sample).
SampleRa, nmRq, nmSsk
AverageSTDEVAverageSTDEVAverageSTDEV
Al98SNS211,747.41573.3514,736.48406.480.510.34
Al96SNS411,232.341357.6314,000.861124.020.070.08
Al94SNS611,414.373132.2014,372.923663.33−0.120.65
Publisher’s Note: MDPI stays neutral with regard to jurisdictional claims in published maps and institutional affiliations.

