Abstract
As reinforcement material, geocells are widely used in various types of embankment reinforcement. A lot of practical experience shows that geocell reinforced embankment has good reinforcement effect, but the theoretical research lags behind the engineering practice, and the reinforcement mechanism under cyclic loading under various reinforcement conditions needs to be further studied. In this paper, the reasonable reinforcement condition of geocell reinforced embankment under static and cyclic loading is proposed by using a physical model and numerical simulation comparative analysis method. The research findings include: under cyclic loading, the inhibition effect of the number of reinforced layers on the vertical cumulative settlement is better than that under static loading, but the effect of two-layer reinforcement and three-layer reinforcement is relatively close, and both can reduce the vertical settlement by more than 40%. The inhibition effect of the increase of geocell height on the horizontal deformation of slope surface is better than that of the decrease of welding spacing under cyclic loading, and the reinforcement effect of the middle and upper part of embankment is better. Increasing the height of geocell and reducing the welding spacing can improve the limit bearing capacity of embankment, and the former is better. The optimal reinforcement condition of sandy soil embankment under cyclic loading obtained from the comparative analysis is case 3, that is, the reinforced layers is 2, the geocell height is 10 mm, and the welding distance is 50 mm.
1. Introduction
Geocell, a reinforcement material with optimal corrosion resistance, integrity, and aging resistance, has played a vital role in the construction engineering since one century ago, in particular in the reinforced embankment. The material has been adopted in numerous projects, achieving optimal economic effects and social benefits—due to the three-dimensional structure, the geocell results in side enclosure of the particles of soil inside the cells. In addition, geocell reinforcement causes the vertical enclosure of the soil within the geocells in two ways—firstly, through the friction between the soil-cellular materials formed by the walls of the cell. Secondly, the geocell reinforcement acts like a soil enclosure layer that prevents soil movement outside of the loading zone. The decorative effect of the geocell layer is also enhanced by the force of tensile strength in the geocell’s reinforcement due to resistance to vertical loads (Figure 1). Astaraki et al. [1] constructed six 1:20 scaled down railway embankments in the lab environment, by changing the number of reinforced layers of geocell. It is found that the bearing capacity of embankment is the largest and the settlement is the smallest when four layers of geocell are reinforced. Han et al. [2] concluded that the geocell can reduce the amount of soil loss by 20–40%, and can effectively play a role in preventing the slope erosion. After combining with the function of plants, the amount of soil loss can be reduced by more than 90%. Isik et al. [3] concluded that the pullout capacity of geocell reinforcement in cohesion less soils is limited to the seam peel strength at junctions of longitudinal and transverse of geocell strips. Ardakani et al. [4] conducted three-dimensional numerical simulation of the elastic-plastic behavior of soil and geocell, the results show that pocket size, thickness, and soil compactness have a considerable impact on the performance of geocell reinforced slope. Tiwari et al. [5] investigated the behavior of lime and silica fume treated coir geotextile reinforced expansive soil subgrade. They found that the upward swelling pressure decreased 52.19% in single-layer and 81.89% in double-layer with the lime treated coir geotextile. Sofiyev et al. [6] investigated the effect of heterogeneity on parametric instability of axially excited orthotropic conical shells, similar to the vertical stress distribution effect of the geocell, and stated that the area of the main instability regions decreases with increasing L/R1 (slant length/small mean radii) ratio. Mehdipour et al. [7] investigated the performance and efficiency of reinforced slope in the stability of geocell layers in unsaturated soil conditions; the results show that the geocell’s reinforcing efficiency depends on the number of layers and depth of its placement. Song et al. [8] proposed a new numerical approach to model geocell reinforced soils, and the study results show that reducing the geocell pocket size has a strong effect on improving the bearing capacity. Mehrjardi et al. [9] studied the application of geocell in granular soil and found that geocell can effectively improve the shear strength characteristics at the interface of granular soil. Hou et al. [10] analyzed the friction and hoop constraints encountered by the geocell on its sidewall by establishing the finite element model of a single high strength geocell reinforced and non-reinforced foundation. Zhou et al. [11] analyzed the impact imposed by the varying shapes of geocell and confined forms on the bearing and deformation features of individual geocell through constant velocity compression experiments. The above scholars have studied the reinforcement effect of geocell through different methods, but they have not studied the effect under dynamic loading. Venkateswarlu et al. [12] found that the lateral spreading of vibrations can be significantly controlled in the presence of geocell reinforcement. Zhu et al. [13] used the FLAC3D nonlinear, finite-difference method to study the failure mechanism of geocell-reinforced retaining walls under earthquake; the results show that the geocell can effectively reduce the horizontal displacement of the retaining wall, and the effect is better than the geogrid. Zadehmohamad et al. [14] performed eight physical model tests to investigate the effect of backfill soil reinforcement with geocell under a cyclic loading condition; the results of the tests show that soil reinforcement with geocell significantly decreased the peak lateral soil coefficient of the soil behind the wall. The above scholars have studied the performance of geocell reinforcement under dynamic loading, but they all use physical models or numerical models alone. Tafreshi et al. [15] established laboratory model tests; the results indicate that, for the same quantity of geotextile material, the geocell reinforcement system behaves much stiffer and carries greater loading and settles less than does the equivalent planar reinforcement system. Bathurst et al. [16] conducted a series of numerical simulations using a large strain nonlinear finite element model to study the load deformation response of span and eccentrically loaded steel conduits with and without reinforced geocell soil cover; the research shows that, compared with the traditional unreinforced method, this kind of reinforcement technology can make the soil cover thinner. Biabani et al. [17] presented the experimental and numerical studies of geocell-reinforced subballast subjected to cyclic loading; the research shows that geocell could effectively decrease the lateral and axial deformations of the reinforced subballast and the lateral displacement decreased further by increasing geocell stiffness, and geocell with a relatively low stiffness performs very well compared to the geocell with a higher stiffness. Leshchinsky et al. [18] constructed a series of embankment model tests and numerical simulations; the results show that geocell confinement effectively increased stiffness and strength of a gravel embankment while reducing vertical settlement and lateral spreading. Zheng et al. [19] verified the role played by the geocell in enhancing foundation bearing capacity and diminishing foundation settlement through multiple model experiments. Jin et al. [20] elaborated on the damage mode of geocell reinforced cushion embankment in extreme cases through conducting an extensive range of experiments and analyses, and put forward recommendations for stability assessment accordingly. Avesani Neto et al. [21] conducted experiments by reinforcing the embankments on soft soil with geocell through varying approaches and the proposed method considers the factor of safety of the unreinforced system calculated by two methods; the results thus obtained were compared with those from a three-dimensional finite element computer analysis for both unreinforced and reinforced cases. Zhao et al. [22] established nonlinear algebraic equations and an interaction model for “embankment-geocell-reinforced body-pile-soil reinforcement area” by introducing the proposed soil arch effect model, and a new method for calculating the pile–soil stress ratio, the settlement of embankment and the differential settlement of piles and soil is obtained. Lu et al. [23] conducted an experimental analysis on the geocell reinforced sand particle flow; the results show that the displacement direction of the soil particles in the geocell and its influence area are more concentrated and neater. It is basically along the principal stress direction, spreading outward in the geocell impact area outside the soil particles. The above scholars have studied various properties of geocell reinforced embankment through different research methods, but the research on different reinforcement conditions of geocell is not systematic.
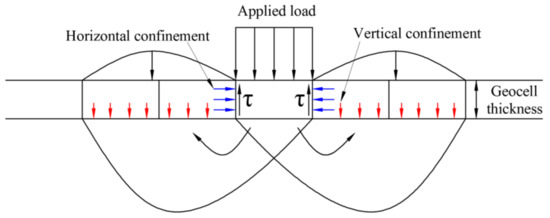
Figure 1.
Soil enclosure characteristic by geocell.
In this paper, series model experiments and three-dimensional numerical simulation are performed on geocell reinforced embankment by changing the number of reinforced layer, the height of the geocell, and the welding spacing of geocell. The deformation law and internal soil pressure variation characteristics of embankment under different geocell conditions are analyzed by physical model and numerical simulation, and then the optimal reinforcement conditions of sandy embankment under cyclic load are proposed.
2. Experimental Scheme
2.1. Model Experiment
2.1.1. Experimental Instrument
The loading device of GCTS dynamic triaxial system (Geotechnical Consulting & Testing Systems, Tempe, AZ, USA), which is capable of generating sinusoidal, rectangular, triangular, and self-defining waves, respectively, was adopted in the experiment for loading. Two vertical rods were used to fix the system to the model box with net length, width and height of 600 mm × 290 mm × 400 mm and high-strength tempered glass as the sidewall, as illustrated in Figure 2. The half sine wave is used to simulate the traffic load, the load amplitude is 76 kPa, the load frequency is 1 Hz, and the number of cycles of cyclic load is 5000.
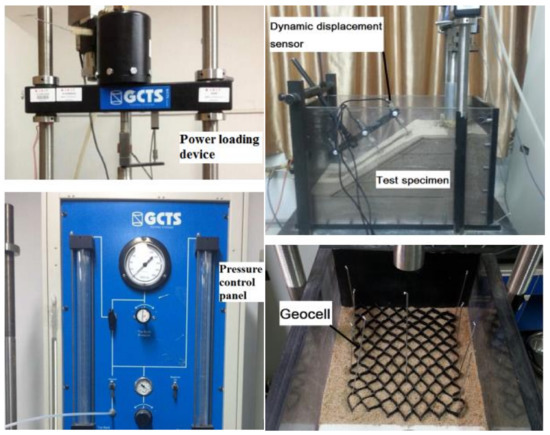
Figure 2.
Test equipment and specimen.
2.1.2. Experimental Material
Standard sand, with the particle size ranging between 0.5 and 2 mm, was selected as the sand sample of model experiment, whereas the indicators measuring its physical property are specified in Table 1. High strength geocell, with thickness of (0.45 ± 0.1) mm, was adopted as the reinforcement material, and the indicators measuring its performance are specified in Table 2. A Ctm8050 universal material testing machine (Xie Qiang Instrument Manufacturing (Shanghai) Co., Ltd., Shanghai, China) is used to conduct tensile tests on the geocell used for the test. The stress–strain curve of the geocell can be obtained through the sorting of test data, as shown in Figure 3.

Table 1.
Physical property indicators of sand.
Table 2.
Performance indicators of geocell.
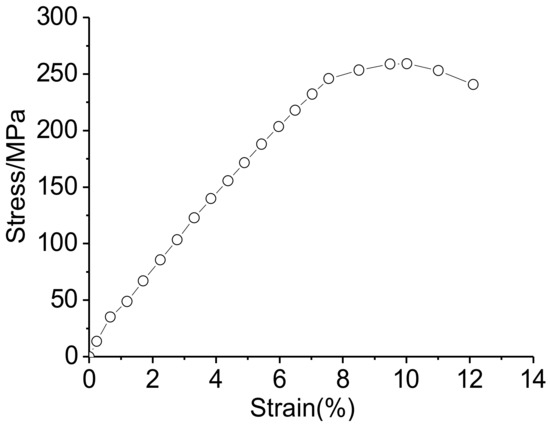
Figure 3.
Geocell stress–strain curve.
2.1.3. Experimental Model and Working Conditions
Considering the symmetry of the embankment in the actual project, the half width embankment model is built by the model box test; the width, height, and height ratio on slope of the model specimen are 600 mm, 300 mm, and 1:1.5, respectively. The embankment section and reinforcement conditions are illustrated in Figure 4 and Table 3.
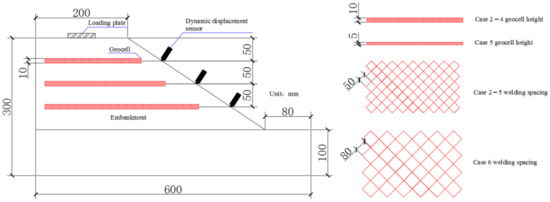
Figure 4.
Equipment and specimen.
Table 3.
Reinforcement test condition.
According to JTG D30-2015 specification for the design of highway subgrade, the compactness of highway embankment is ≥94%; therefore, the compactness and relative compactness of the embankment in the test are 97.23% and 0.849, respectively. In the process of model embankment filling, the filling quality of the embankment is mainly controlled by controlling the compactness of the embankment. Through the maximum dry density test of Fujian standard sand, the maximum dry density of sand is 1.876 g/cm3. Considering the control compactness of embankment, the dry density of the model is controlled to be 1.824 g/cm3. The calculation shows that the total mass of sand filling in the model is 70.9 kg.
2.2. Numerical Model
2.2.1. Identification of the Parameters of Numerical Model
The height of the simulated embankment is 300 mm, the width of the top of the embankment is 200 mm, the width of the bottom of the embankment is 500 mm, and the width of the foundation is 600 mm. The length of the strip load is 288 mm and the width is 60 mm. The load is applied in the middle of the embankment with a distance of 70 mm on both sides. The reinforcement position is from the top of the embankment downward, and a layer of reinforcement material is placed every 50 mm, which is divided into three layers. The dimensions of embankment section are illustrated in Figure 4. The width of the embankment amounted to 300 mm. In addition, the reinforcement conditions are specified in Table 3.
- (1)
- Soil model
The soil of the embankment, which was oftentimes merely subject to pressure, was simulated by the eight-node three-dimensional isoparametric element, i.e., C3D8R, and each node of the element has three translational degrees of freedom. C3D8R compared with the complete integration element, and the linear reduced integration element contains only one integration point in the center of the element, while the number of integration points of the quadratic reduced integration element is the same as that of the linear complete integration element. The linear reduced integral unit has the following advantages: (1) Shear self-locking is not easy to occur under bending load. (2) The solution of displacement is accurate. (3) When the mesh is distorted, the accuracy of the analysis will not be greatly affected. The elastoplastic properties of the embankment soil itself were simulated based on the extended Drucker–Prager criterion. The simulated parameters of soil are specified in Table 4. Drucker–Prager is also called generalized Mises yield criterion. The model overcomes the inherent defect that the Mohr–Coulomb model is not easy to converge in plastic analysis. The model is also conducive to numerical calculation and determination of the direction of plastic strain increment.
Table 4.
Simulated parameters of soil.
- (2)
- Geocell model
Geocell was simulated through the continuum-based shell elements, and the shell element has six degrees of freedom (three translational degrees of freedom and three rotational degrees of freedom) at each node. The simulated parameters of geocell are specified in Table 5. The continuum-based shell elements degraded from solid elements are able to reflect the changes of the material itself in higher precision, and to more effectively simulate the double-sided contact [24]. It can be seen from Figure 3 that, when the geocell strain is less than or equal to 8%, the stress–strain curve presents a linear distribution, and then the stress–strain curve has nonlinear deformation. It can be seen that, under the action of ultimate load, the stress variable before the geocell fracture in the nonlinear stage is about 5%, and the geocell material can be approximately considered as a linear elastic material. The constitutive equation of linear elastic materials is the generalized Hooke’s law.
Table 5.
Simulated parameters of geocell.
- (3)
- Contact simulation
In this study, the embedded constraint was adopted to simulate the interaction between soil and reinforcement material. It is found that the computation of friction units oftentimes failed to converge for numerous contact surfaces of the three-dimensional numerical model. Given the computational cost, it is thus feasible to simulate the geocell reinforced embankment using the embedded constraint when assuming no relative sliding between soil and reinforcement material, as evidenced by the study of Saad et al. [25].
- (4)
- Model meshing
The embankment is meshed. The pure sand embankment is divided into 5852 soil units. The three-layer reinforced units are divided into 1736, 2112, and 2486 units, respectively. The soil units and reinforced units are shown in Figure 5.
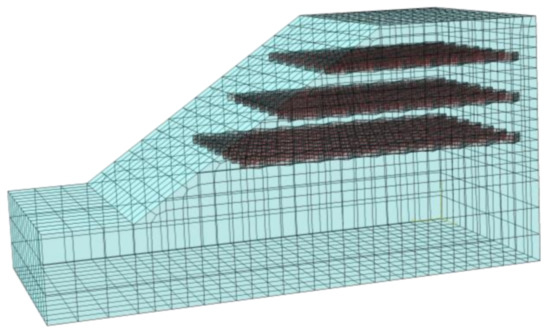
Figure 5.
Embankment and reinforced element mesh model.
2.2.2. Loading and Boundary Condition
- (1)
- Loading
The simulated loading, either the static or the dynamic one, was consistent with the experimental loading. The scheme of loading is specified in Table 6.
Table 6.
Loading scheme.
- (2)
- Boundary condition
Combined with the features of the box test of physical model, constraints in x, y, and z directions were adopted at the bottom of the numerical model, whereas merely normal constraints were adopted at the middle, left, and right boundaries of the numerical model.
3. Comparative Analysis and Application
3.1. Deformation Analysis
3.1.1. Vertical Settlement of the Embankment Top under Static Loading
The loading scheme under static loading is referred to as the experimental loading scheme, with a maximum amount of loading reaching 253 kPa, which is set as the limit bearing capacity of non-reinforced embankment. Such configuration would facilitate comparison and analysis of data at the same loading amount.
Figure 6 has illustrated that, under static loading, the changing law of the simulated values of vertical cumulative settlement at a specific load was consistent with that of the experimental values. In other words, as the number of reinforcement layers increased at a specific load, the vertical cumulative settlement experienced declines. In addition, with the same number of reinforcement layers, the geocell height grew larger and the vertical cumulative settlement experienced declines. With the same number of reinforcement layers and geocell height, both the welding spacing and the vertical embankment settlement experienced declines. The simulated values of the vertical cumulative settlement, which amounted to 0.66%, 10.9%, 20.9%, 59.8%, 8.2%, and 8.7% under working conditions one to six, respectively, all exceeded the experimental values. When the embankment was not reinforced, the simulated values of vertical cumulative settlement basically consisted with the experimental values. As the number of reinforcement layers increased, the increasing ratio of the simulated values exceeded that of the experimental values, indicating that the ratio of reinforcement could impose a huge impact on the simulated vertical cumulative settlement. The numerical simulation of the geocell reinforced embankment is able to effectively reflect the net isolation effect imposed by the geocell on soil, whereas the net isolation effect was more evident when the ratio of reinforcement grew larger. However, the numerical simulation is unable to reflect the frictional effect existing between reinforcement layers and upper and lower contact surfaces. Hence, though the numerical simulation could not reveal the reinforcement effect in a holistic manner, it has a good reference value while reflecting the overall regularity.
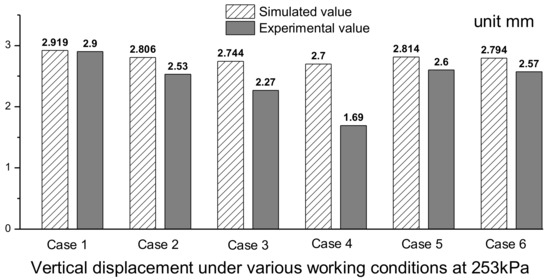
Figure 6.
Simulated values and experimental values of vertical cumulative settlement under different conditions.
Under the action of static loading, the number of reinforced layers has a great impact on the vertical settlement of the embankment. The vertical cumulative settlement of experimental values in case 2, case 3, and case 4 is 12.8%, 21.7%, and 41.7% lower than that in case 1, respectively, while the change of geocell height and welding spacing also has a certain impact on the vertical settlement of the embankment. The vertical cumulative settlement of experimental values in case 5 and case 6 is 14.5% and 13.2% higher than that in case 3, respectively. The control of settlement of reinforced embankment under static loading can mainly consider the number of reinforced layers of geocell, and the economy of reinforcement on the basis of meeting the settlement. In practical engineering, the control of embankment vertical settlement should also focus on the situation under cyclic loading, which will be studied in the subsequent sections.
3.1.2. Vertical Cumulative Settlement of the Embankment Top under Cyclic Loading
As shown by Figure 7a, the changing law of the simulated values of vertical cumulative settlement consisted with that of the experimental values. As the number of reinforced layers increased, the vertical cumulative settlement experienced declines accordingly. In addition, the simulated values of vertical cumulative settlement were similar to the experimental values under each reinforcement condition subsequent to 5000 vibrations. However, the simulated values during loading were smaller than the experimental values, whereas the simulated values under the non-reinforcement condition were smaller than the experimental values. As shown by Figure 7b,c, after altering the geocell height and welding spacing, the changing law of the simulated values of vertical cumulative settlement basically consisted of that of the experimental values. Nevertheless, the amount of settlement after vibration varied to a significant extent. Therefore, since the relative sliding between soil and reinforcement material derived from friction was not taken into account, the simulated values of vertical cumulative settlement were smaller than the experimental values.
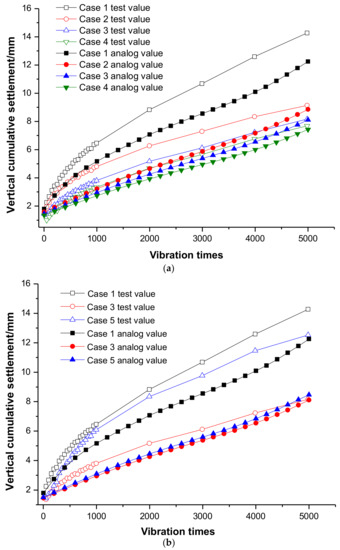
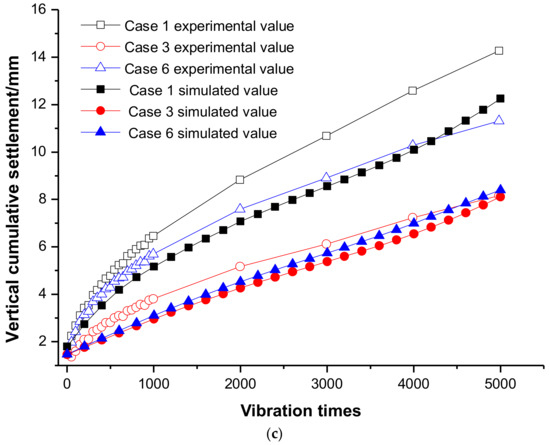
Figure 7.
Settlement changing with vibration times under cyclic loading under different conditions. (a) different reinforcement layers; (b) different geocell heights; (c) different welding spacing.
The number of reinforced layers of geocell plays a very important role in the vertical cumulative settlement of embankment under cyclic loading. At 5000 vibrations, the vertical cumulative settlement of experimental values in case 2, case 3, and case 4 is reduced by 36%, 42.8%, and 46.2%, respectively, compared with case 1. It can be seen that the inhibition effect of the number of reinforced layers on the vertical cumulative settlement under cyclic loading is better than that under static loading, but the effect of two-layer reinforcement and three-layer reinforcement is relatively close, and the reinforcement effect of the upper part of the embankment is more significant. Under the action of cyclic loading, reducing the geocell heights and increasing the welding spacing have a significant impact on the reinforced embankment. At 5000 vibrations, the vertical cumulative settlement of the experimental value in case 5 increases by 53.4% compared with case 3, and the vertical cumulative settlement of the experimental value in case 6 increases by 38.6% compared with case 3. Both conditions significantly reduce the inhibition effect on the vertical cumulative settlement of embankment, and this weakening effect is more obvious than that under static loading. The optimal reinforcement condition considering economy is condition 3, that is, the reinforced layers is 2, the geocell height is 10 mm, and the welding distance is 50 mm. In practical engineering, the load of road embankment is mostly cyclic loading. According to the research results of this paper, when studying the vertical cumulative settlement of road embankment under cyclic loading, we should focus on the selection of embankment geocell height and welding spacing on the basis of considering the economy of the number of reinforced layers.
The comparison between the test value and simulation value of static load and cyclic load has been analyzed in the previous section, respectively. This part mainly compares and analyzes the difference percentage (test value and analog value) between static load and cyclic load. As shown by Table 7, the difference percentage under cyclic load is positive and under static load is negative. The main reason is that the middle and upper parts of sandy embankment will become relatively loose under cyclic load and compacted under static load in the model test; however, the numerical simulation is relatively less affected.
Table 7.
Percentage difference between test and analog value of vertical settlement.
3.1.3. Horizontal Displacement of Embankment Slope under Cyclic Loading
As shown by Figure 8a, under cyclic loading, the horizontal deformation of embankment slope under all working conditions increases with the increase of vibration times. With the increase of the number of reinforced layers, the inhibition effect on slope deformation is better. This effect becomes more significant with the increase of load vibration times and is more obvious at the place closest to the slope top. By analyzing the data of the observation surfaces I (as illustrated in Figure 8) closest to the slope top, at 5000 vibrations, the horizontal deformation of case 3 is reduced by 10.4% compared with case 2, and the horizontal deformation of case 4 is reduced by 4.0% compared with case 3. It can be seen that the effect of two-layer reinforcement is better, and the middle and upper part of embankment should be preferentially reinforced if conditions permit. Because the soil in the upper part of the embankment is disturbed more obviously than that in the lower part of the embankment under cyclic loading, resulting in the maximum horizontal deformation of the upper slope of the embankment, the effect of reinforcement in the upper part of the embankment is better. Judging from Figure 8b,c, when the number of reinforcement layers is the same, the increase of geocell height and the decrease of welding spacing can also inhibit the slope deformation, and it is more obvious at the place closest to the slope top. At 5000 vibrations, the horizontal deformation of case 3 at the observation surfaces I is reduced by 10.0% and 3.1%, respectively, compared with case 5 and case 6. It can be seen that the inhibition effect of the increase of geocell height on the horizontal deformation of slope surface is better than that of the decrease of welding spacing. The increase of geocell height improves the reinforcement rate of embankment, while the smaller geocell welding distance can only improve the reinforcement effect of embankment reinforcement layer, but cannot improve the reinforcement rate of embankment, so the effect of restraining horizontal displacement of slope is worse.
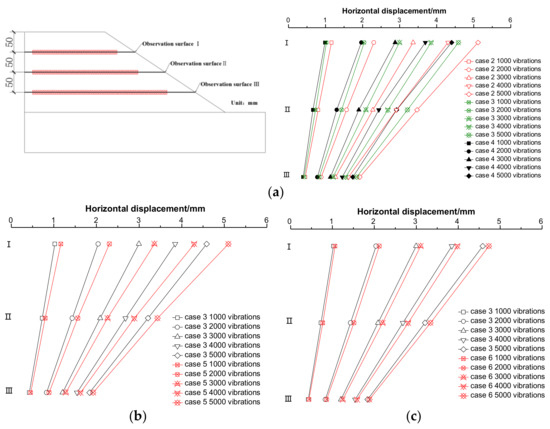
Figure 8.
Horizontal displacement of slope changing with vibration times under cyclic loading under different conditions. (a) different reinforcement layers; (b) different geocell heights; (c) different welding spacing.
Geocell reinforcement has a significant inhibitory effect on the horizontal displacement of the embankment, especially in the middle and upper part of the embankment. The optimal reinforcement condition considering economy is condition 3, that is, the reinforced layers is 2, the geocell height is 10 mm, and the welding distance is 50 mm. In practical engineering, the load on the middle and upper part of the embankment is more direct, and it is easier to produce large horizontal displacement. Therefore, geocell is a very ideal reinforcement material to inhibit the horizontal displacement of the embankment.
3.2. Soil Pressure Analysis
3.2.1. Vertical Soil Pressure and Limit Bearing Capacity of the Embankment under Static Loading
Judging from Figure 9, the distribution curve of soil pressure at the three observation surfaces reached the peak level at the loading axis and experienced gradual declines to both sides. As the depth increased, the soil pressure adjacent to the peak became smaller, whereas the distribution curve of soil pressure became gentler. In addition, the distribution curve of soil pressure at the three observation surfaces under the 4th working condition was found to be gentler than that under the 1st working condition, whereas the soil pressure of the same observation surface under the 4th working condition was found to be smaller than that under the 1st working condition. The geocell reinforced embankment is able to convert the vertical stress in the soil into the strip tension borne by the geocell, thereby lowering the vertical soil pressure of embankment at each observation surface. In addition, the reinforcement layers of geocell could be leveraged as a flexible raft foundation to further disperse the soil pressure, enabling the distribution curve of the deep soil pressure for reinforced embankment to become gentler.
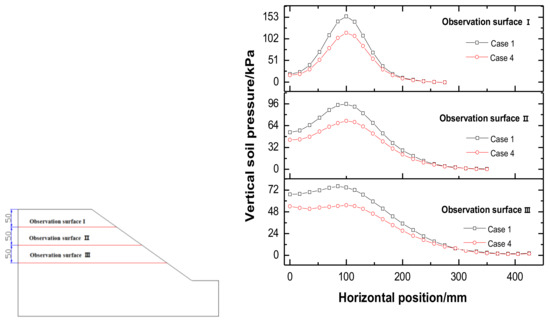
Figure 9.
Vertical soil pressure of embankment under different conditions.
Under static loading, the number of reinforced layers of geocell has a significant effect on improving the limit bearing capacity of embankment (as illustrated in Figure 10). The limit bearing capacity of experimental values in case 2, case 3, and case 4 is 12.7%, 36.4% and 44.4% higher than that in case 1, respectively. The change of geocell heights and welding spacing also has a significant impact on the ultimate bearing capacity of embankment (as illustrated in Figure 10). The limit bearing capacity of experimental values in case 3 is increased by 29.3% and 23.0%, respectively, compared with case 5 and case 6. According to the above research results, in practical engineering, the limit bearing capacity of the embankment under static loading can be improved by increasing the number of reinforcement layers, and the reinforcement effect of the upper part of the embankment is more significant. Increasing the geocell height and reducing the welding spacing can also improve the limit bearing capacity of the embankment, and the effect of the former is better.
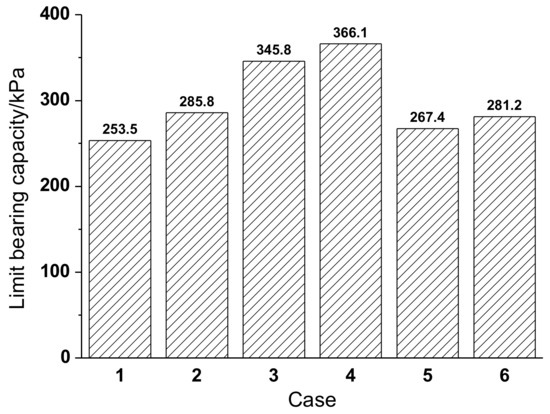
Figure 10.
Experimental values of limit bearing capacity under different conditions.
3.2.2. Vertical Soil Pressure of the Embankment under Cyclic Loading
As shown by Figure 11, the vertical soil pressure at the three observation surfaces reached the peak level at the loading axis and experienced gradual declines to both sides. As the loading times multiplied, the vertical stress of the soil also experienced increases accordingly. In addition, the distribution curve of vertical soil pressure at the three observation surfaces was gentler under the 4th working condition than under the 1st working condition. As the depth increased, the vertical soil pressure of the three observation surfaces experienced gradual declines at the loading axis, and the distribution curve of soil pressure became gentler accordingly. Judging from the analysis, as the vibration of cyclic loading increased, the embankment also became more compact, thus contributing to greater soil pressure of the embankment adjacent to the loading axis. Furthermore, the confined action of geocell is able to convert the vertical stress in the soil into the strip tension. As a result, the embankment would feature the enhanced ultimate bearing capacity, whereas the vertical soil pressure of reinforced embankment at the same position would grow smaller than that of non-reinforced embankment. After the cyclic loading of geocell reinforced embankment in case 4, it has a certain pre tension effect on the reinforcement, which improves the action effect of reinforcement. At the same time, the reinforced layer has a dispersive effect on the vertical loading, resulting in the vertical soil pressure at the same position after reinforcement being less than that in case 1.
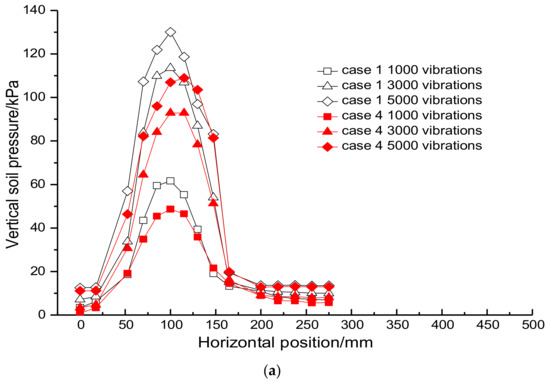
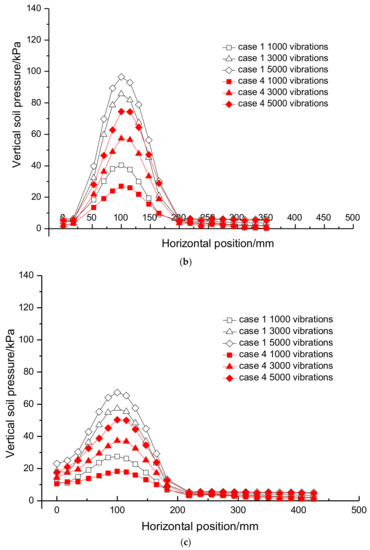
Figure 11.
Vertical soil pressure in embankment under different conditions. (a) observation surfaces I; (b) observation surfaces II; (c) observation surfaces III.
Under different loading times, the internal soil pressure of geocell reinforced embankment is significantly lower than that of unreinforced embankment, which reflects that the excavated geocell can still disperse the soil pressure well under cyclic loading. This also provides a theoretical basis for the application of Engineering geocell reinforced embankment.
4. Conclusions
- (1)
- Under static loading, the changing law of the simulated values of vertical cumulative settlement at a specific load was consistent with that of the experimental values under each of the working conditions. The numerical simulation is unable to reflect the frictional effect existing between reinforcement layers and upper and lower contact surfaces, while in the physical model experiment, the friction effect between the reinforced layer and the upper and lower contact surfaces has a great impact on the vertical settlement; as a result, the percentage difference between the simulated value and the test value under different reinforcement conditions of the embankment reaches 59.8%.
- (2)
- Under cyclic loading, the inhibition effect of the number of reinforced layers on the vertical cumulative settlement under cyclic loading is better than that under static loading, but the effect of two-layer reinforcement and three-layer reinforcement is relatively close, and the vertical cumulative settlement of experimental values in case 4 is reduced by 5.9% compared with case 3. At the same time, reducing the height of geocell and increasing the welding spacing weakened the inhibition of embankment settlement by 53.4% and 38.6%, respectively. The optimal reinforcement condition considering economy is condition 3, that is, the reinforced layers is 2, the geocell height is 10 mm, and the welding distance is 50 mm.
- (3)
- Under cyclic loading, the horizontal deformation of embankment slope under all working conditions increases with the increase of vibration times. With the increase of the number of reinforced layers, the inhibition effect on slope deformation is better. This effect becomes more significant with the increase of load vibration times; at 5000 vibrations, the horizontal deformation of case 3 is reduced by 10.4% compared with case 2, and the horizontal deformation of case 4 is reduced by 4.0% compared with case 3. The optimal reinforcement condition considering economy is condition 3, that is, the reinforced layers is 2, the geocell height is 10 mm, and the welding distance is 50 mm.
- (4)
- Under static loading, as the depth increased, the vertical soil pressure reached the peak level at the loading axis and experienced gradual declines to both sides, and the maximum soil pressure reached 154.31 kPa. Furthermore, the vertical soil pressure adjacent to the peak became smaller, and the distribution curve of soil pressure became gentler accordingly. The reinforcement layers of geocell could be leveraged as a flexible raft foundation to further disperse the soil pressure, enabling the distribution curve of the deep soil pressure for reinforced embankment to become gentler. The limit bearing capacity of experimental values is increased by 29.3% and 23.0%, respectively, through increasing the height of geocell and reducing the welding spacing.
- (5)
- Under cyclic loading, the vertical soil pressure reached the peak level at the loading axis. As the loading times multiplied, the vertical soil pressure also experienced increases at the loading axis correspondingly, the maximum soil pressure reached 130.12 kPa. The embankment also became more compact, thus contributing to greater soil pressure of the embankment adjacent to the loading axis. With the increase of depth, the confined action of geocell is able to convert the vertical stress in the soil into the strip tension, resulting in the vertical soil pressure of the three observation surfaces experiencing gradual declines at the loading axis, and the distribution curve of soil pressure became gentler.
Author Contributions
Conceptualization, A.G. and M.Z.; Data curation, A.G. and M.Z.; Formal analysis, A.G. and M.Z.; Writing—original draft, A.G.; Writing—review & editing, A.G. All authors have read and agreed to the published version of the manuscript.
Funding
The work was financially supported by the National Natural Science Foundation of China (Grant No. 41372280).
Institutional Review Board Statement
Not applicable.
Informed Consent Statement
Not applicable.
Data Availability Statement
Data is contained within the article.
Conflicts of Interest
The authors declare that there is no conflict of interest regarding the publication of this paper.
References
- Astaraki, F.; Esmaeili, M.; Reza, R.M. Influence of geocell on bearing capacity and settlement of railway embankments: An experimental study. J. Geomech. Geoengin. 2022, 17, 630–646. [Google Scholar] [CrossRef]
- Han, Y.K.; Lu, Z.; Yao, H.L.; Liu, B.; Fan, Y.F.; Lu, Q.; Zhao, D.Q. Study on erosion resistance of geocell reinforced slope. J. Chin. J. Rock Mech. Eng. 2021, 40, 3425–3433. [Google Scholar]
- Isik, A.; Gurbuz, A. Pullout behavior of geocell reinforcement in cohesionless soils. J. Geotext. Geomembr. 2020, 48, 71–81. [Google Scholar] [CrossRef]
- Ardakani, A.; Namaei, A. Numerical investigation of geocell reinforced slopes behavior by considering geocell geometry effect. J. Geomech. Eng. 2021, 24, 589–597. [Google Scholar]
- Tiwari, N.; Satyam, N. An experimental study on the behavior of lime and silica fume treated coir geotextile reinforced expansive soil subgrade. J. Eng. Sci. Technol. 2020, 23, 1214–1222. [Google Scholar] [CrossRef]
- Sofiyev, A.H.; Pancar, E.B. The effect of heterogeneity on the parametric instability of axially excited orthotropic conical shells. J. Thin-Walled Struct. 2017, 115, 240–246. [Google Scholar] [CrossRef]
- Mehdipour, B.; Hashemolhosseini, H.; Nadi, B.; Mirmohamadsadeghi, M. Investigating the effect of geocell changes on slope stability in unsaturated soil. J. Teh. Glas. 2020, 14, 66–75. [Google Scholar] [CrossRef]
- Song, F.; Tian, Y.H. Three-dimensional numerical modelling of geocell reinforced soils and its practical application. J. Geomech. Eng. 2019, 17, 1–9. [Google Scholar]
- Mehrjardi, G.T.; Motarjemi, F. Interfacial properties of Geocell-reinforced granular soils. J. Geotext. Geomembr. 2018, 46, 384–395. [Google Scholar] [CrossRef]
- Hou, J.; Zhang, M.X.; Han, X.; Li, R. Mechanism of a high-strength geocell using FEM. Chin. J. Geotech. Eng. 2015, 37, 26–30. [Google Scholar]
- Zhou, Y.M.; Zhang, M.X.; Wu, Y. Factors influencing the behavior of single geocell-reinforced sand. J. Shanghai Jiaotong Univ. 2015, 49, 983–987. [Google Scholar]
- Venkateswarlu, H.; Ujjawal, K.N.; Hegde, A. Laboratory and numerical investigation of machine foundations reinforced with geogrids and geocells. J. Geotext. Geomembr. 2018, 46, 882–896. [Google Scholar] [CrossRef]
- Zhu, Y.L.; Tan, K.; Hong, Y.; Tan, T.; Song, M.R.; Wang, Y.X. Nimbalkar sanjay. Deformation of the geocell flexible reinforced retaining wall under earthquake. J. Adv. Civil. Eng. 2021, 4, 8897009. [Google Scholar]
- Zadehmohamad, M.; Bolouri, B. Cyclic behaviour of geocell-reinforced backfill behind integral bridge abutment. Int. J. Geotech. Eng. 2019, 13, 438–450. [Google Scholar] [CrossRef]
- Tafreshi, S.N.M.; Dawson, A.R. Comparison of bearing capacity of a strip footing on sand with geocell and with planar forms of geotextile reinforcement. J. Geotext. Geomembr. 2010, 28, 72–84. [Google Scholar] [CrossRef]
- Bathurst, R.J.; Knight, M.A. Analysis of geocell reinforced-soil covers over large span conduits. J. Comput. Geotech. 1998, 22, 205–219. [Google Scholar] [CrossRef]
- Biabani, M.M.; Indraratna, B.; Ngo, N.T. Modelling of geocell-reinforced subballast subjected to cyclic loading. J. Geotext. Geomembr. 2016, 44, 489–503. [Google Scholar] [CrossRef] [Green Version]
- Leshchinsky, B.; Ling, H. Effects of geocell confinement on strength and deformation behavior of gravel. J. Geotech. Geoenvironmental Eng. 2013, 139, 340–352. [Google Scholar] [CrossRef]
- Zheng, C.Y.; Zhang, M.X.; Jiang, S.W.; Han, X.; Sun, Z. Deformation analysis of model test of sand foundation reinforced with high strength geocell. J. Shanghai Univ. 2015, 21, 606–616. [Google Scholar]
- Jin, J.Q.; Xu, C.; Liang, C.; Liu, R.T. Failure mode and stability evaluation of geocell-reinforced cushion embankment. Hydrogeol. Eng. Geol. 2019, 46, 86–94. [Google Scholar]
- Avesani Neto, J.O.; Bueno, B.S.; Futai, M.M. Evaluation of a calculation method for embankments reinforced with geocells over soft soils using finite-element analysis. Geosynth. Int. 2015, 22, 439–451. [Google Scholar] [CrossRef]
- Zhao, M.H.; Zhen, D.X.; Liu, M.; Ou, Q. Deformation analysis of geocell-reinforced body under embankment load considering soil arch effect. Chin. J. Geotech. Eng. 2020, 42, 601–609. [Google Scholar]
- Lu, S.K.; Xia, X.H.; Zhang, M.X.; Yang, J.M. Triaxial analysis of particle flow in geocell reinforced sand samples. J. Shanghai Univ. 2019, 25, 132–140. [Google Scholar]
- Wang, J.; Jiang, Z.J. Application of ABAQUS shell element in roll forming. Manuf. Informatiz. 2008, 2, 118–120. [Google Scholar]
- Saad, B.; Mitri, H.; Poorooshasb, H. 3D FE analysis of flexible pavement with geosynthetic reinforcement. J. Transp. Eng. 2006, 132, 402–415. [Google Scholar] [CrossRef]
Publisher’s Note: MDPI stays neutral with regard to jurisdictional claims in published maps and institutional affiliations. |
© 2022 by the authors. Licensee MDPI, Basel, Switzerland. This article is an open access article distributed under the terms and conditions of the Creative Commons Attribution (CC BY) license (https://creativecommons.org/licenses/by/4.0/).