Article

Application of SiON Coatings in Sandstone Artifacts Conservation

1
School of Materials and Energy, Yunnan University, Kunming 650091, China
2
School of History and Archives, Yunnan University, Kunming 650091, China
*
Author to whom correspondence should be addressed.
Coatings 2022, 12(6), 748; https://doi.org/10.3390/coatings12060748
Submission received: 5 March 2022 / Revised: 4 May 2022 / Accepted: 19 May 2022 / Published: 29 May 2022
(This article belongs to the Topic Inorganic Thin Film Materials)

Abstract

:
For a long time, a large number of sandstone cultural relics have been exposed to the outdoors, and they are facing unprecedented threats. Curing perhydropolysilazane at varied pyrolysis times results in a series of SiON solids. Fourier transform infrared absorption spectroscopy (FTIR) results show that the Si−H bond disappears at 2163 cm−1, and that the Si−O peaks at 460 cm−1, becoming stronger during the pyrolysis of Perhydropolysilazane (PHPS) to SiON solids. X-ray photoelectron spectroscopy (XPS) results indicate a decrease in the proportion of N atoms from 22.71% to 3.38% and an increase in the proportion of O atoms from 59.74% to 69.1%, indicating a gradual production of SiO2 from perhydropolysilazane. To protect the sandstone, the SiON protective layer and the commonly used protective materials—acrylic resin and polydimethylsiloxane—are applied. When compared to sandstone treated with acrylic resin B72 and polydimethylsiloxane coatings, SiON-coated sandstone effectively reduces porosity and water absorption. Ageing tests have shown that the SiON-coated sandstone is effective in resisting crystalline damage from sodium sulfate. These thenardites can change shape during formation, allowing their widespread distribution in different locations in the sandstone. The surface thenardite of the SiON-treated samples was smaller than that of the polydimethylsiloxane and acrylic resin B72-treated samples, while the untreated samples were flaky with obvious dehydration characteristics.

1. Introduction

Stone cultural relics account for a relatively high proportion of cultural relics overall, and their reinforcement and protection have become important in the current preventive protection measures for immovable cultural relics [1,2,3]. For thousands of years, sandstone has been used as a building material for local houses, churches, and famous monuments [4]. With the growing recognition that the outdoor environment accelerates the decay of stone [5], attention is being directed to the performance and protection strategies of sandstone as a building material [6]. For sandstone with large porosity and a large surface area that reacts with water, minerals with a weak binding flow with water and repeated crystallization will cause great damage [7]. Therefore, the protection of sandstone cultural relics is mainly focused on preventing the crystallization of salt inside the stone after the loss of water.
The physical sulfate erosion of rocks is currently of increasing interest and is increasingly reported in the literature [8,9,10,11]. Much research is currently focused on improving the water resistance of rock surfaces to reduce the potential for salt solutions to enter the rock interior. The main materials used in recent decades have been epoxy resin [12], silicone resin [13,14], acrylic resin [15,16], and fluoropolymers [17,18]. These materials, with different characteristics, exhibit different advantages and disadvantages. The main characteristic of fluoropolymers is the presence of a large number of c-f bonds in their structure, which leads to a reduction in surface energy and thus increases the hydrophobicity of the stone. However, organic fluoropolymer coatings exhibit an excessively high static hydrophobic angle and tend to form a “hydrophilic/hydrophobic” interface on the stone surface, which exacerbates salt damage to the stone [19,20]. Studies have shown that the average pore size and porosity of porous sandstone were reduced after treatment with siloxane materials, leading to less crystalline damage caused by salt entry into the rock [12,21].
Siloxane coating may play a significant role in heritage conservation, in terms of salt resistance and high hydrophobicity. The biggest shortcoming is that the siloxane forms a silica gel during the drying process, producing strong stress damage to the micropores of the sandstone [22,23]. In addition, siloxane consolidation agents are usually not effective for building materials that are rich in calcium carbonate, because the combination of the consolidation agent and the calcite substrate is only a mechanical action.
Acrylic resins, with their high viscosity, fast curing speed, and low molecular weight, can be a promising material for stone protection. However, acrylic resins with low permeability, which tend to form crusts on the rock surface, are often used in combination with different concentrations of nanoparticles to improve the high hydrophobicity and salt resistance of the rock [12,24]. In past decades, the protection of commercial acrylic resins obtained through acrylic and methacrylic monomers has been satisfactory [22,25,26], which makes such acrylic resins very suitable as a reference when testing or researching new products.
In general, the consolidated treatment of inorganic materials is durable and stable, as the properties of inorganic materials do not change significantly as a result of ageing and weathering [27]. However, traditional inorganic materials, such as barium hydroxide [28] or calcium hydroxide [29,30], can easily produce a hard crust on the surface of the stone and change its appearance, so they are not commonly used now. Although organic polymers offer good protection, they also suffer from many problems, such as weather resistance, permeability, and salt crystal weathering. People are paying increasing attention to the protection of cultural relics, and researchers are paying greater attention in studying new protective materials.
Perhydropolysilazane (PHPS) is an inorganic polymer composed of N–H and Si–H bonds [31]. In recent years, the hydrolysis of the precursor PHPS to silicon oxynitride (SiON) coatings has attracted considerable attention in many fields [32,33,34,35]. PHPS removes the hydrogen and nitrogen atoms and introduces oxygen atoms during the curing process, eventually forming SiON. The precursor structure is rich in nitrogen atoms, which almost disappear when oxidized. However, there are few reports of changes in nitrogen atoms during the curing process. Inorganic materials can be applied without fear of ageing, so SiON coatings are effective in protecting sandstone from external contaminants over the long term. This new material may provide an effective method for sandstone conservation.
The aim of this paper is to compare the performance of SiON coatings as stone protection materials with the traditional coating protection materials, acrylic resin B72 (B72) and polydimethylsiloxane (PDMS). We investigated the formation and disappearance of three chemical states of N atoms during the curing of PHPS and were able to cure PHPS into a SiON coating at low temperatures. The protective effect of the SiON coating can be assessed by comparing the water vapor permeability, the free water absorption, and the weathering resistance of the sandstone before and after treatment. This research will contribute to the advancement of knowledge to further develop the protection of stone in support of the architectural cultural heritage.

2. Materials and Methods

2.1. Materials

Brown−yellow artificial sandstone (Wukexin Stone Co., Ltd., Kunming, China) with uniform material and a size of 5 cm × 5 cm × 3 cm was selected as the substrate. According to XRD and optical microscopy, the main mineral components of sandstone are quartz, feldspar, and rock fragments, with filler content, auxiliary minerals, and secondary minerals as the other minor minerals (see Figures S1 and S2, as well as Table S1). The stone used in the test was fine−grained clastic feldspathic sandstone. Previous research revealed that the porosity of untreated sandstone tested with the mercury intrusion method was 12.48 percent, with an average pore diameter of 1272.68 nm [36].
PHPS was purchased as an 8 wt% solution in N−butyl ether from Guangzhou Honghai Chemical Technology Co., Ltd. (Guangzhou, China). B72 white powder was provided by the Dow Chemical Company in Midland, MI, USA. The 10% PDMS solution was supplied by Shenzhen Ausbond Co., Ltd. (Shenzhen, China). Acetone (A.R. Grade, ≥99.5%) was chosen as the solvent to prepare a 6% solution of B72. Polished single−crystal silicon wafers (Si100, with a thickness of about 0.72 mm) were purchased from the Chongqing Tianying Photovoltaic Energy Co., Ltd. (Chongqing, China). Kunshan Jiulimei Electronic Materials Co., Ltd. (Kunshan, China) provided the epoxy resin (MO1−A) and the curing agent (W93).
An appropriate amount of PHPS solution was dropped onto a silicon wafer and heated in an oven at a constant temperature (70 °C) for various amounts of time to obtain a series of SiON solids. After cleaning and drying all the stones to a constant weight, the different polymer solutions were applied to the surface of the stone by the dip−coating method. In this article, sample SiON, sample B72, and sample PDMS represent sandstone that was treated with the materials SiON, B72, and PDMS, respectively.

2.2. Characterization

The composition of sandstone surface particles was analyzed by an X−ray diffractometer (XRD). The Rigaku Utima IV X−ray diffractometer was manufactured by Rigaku in Tokyo, Japan. The test conditions of the powder samples were a voltage of 40 kV, a current of 100 mA, a scan speed of 5°/min, and a step size of 0.02°/step (2θ). The optical properties of rocks were analyzed using an optical microscope (OLYMPUS, BX53, Tokyo, Japan). Sandstone was mounted on glass slides using epoxy (epoxy resin: curing agent = 100:20) and ground to a thickness of 33 um. Images of the sections were observed under orthogonal and polarized light with a microscope. Fourier transform infrared absorption spectroscopy (FTIR) was used to analyze the structure of SiON films. After fully grinding 20 mg of SiON solid and 3300 mg of potassium bromide powder, 240 mg of the mixture was weighed and dried for 8 min under a UV lamp. The dried powder was then poured into the mold, and a tablet press was used to press it at 27 MPa. Particles were analyzed in transmission mode using FTIR (8400S, Shimadzu, Suzhou, China) in the range of 4000 to 400 cm−1 with a resolution of 6 cm−1 and 100 scans. Scanning electron microscopy (FEI, Nova Nano SEM 450, Hillsboro, OR, USA) was used to observe the micro−morphology of the sample surface. SEM analysis was performed under 20 kV voltage and vacuum conditions (10−3 pressure). The sandstone surface was coated with a layer of gold (about 5 nm) using a high−resolution sputter coating prior to SEM testing. An XPS spectrometer (K−Alpha+; Thermo Fisher Scientific, Inc., Waltham, MA, USA) was operated at a constant band pass energy of 50 eV. An optical contact angle measuring device (Leao, Shanghai, China) was used to measure the contact angle of sandstone with 6 μL of deionized water. A spectrophotometer (NR20XE, Shenzhen Sanenshi Technology Co., Ltd., Shenzhen, China) was used to test the chromaticity values before and after the sandstone surface treatment, and each test point was required to correspond one−by−one during the test to reduce errors. A CIE−LAB standard color space was used to analyze the change in the appearance of the stone caused by the protective material. The calculation formula for the chromaticity change Δ E a b value is shown in the following equation:
Δ E a b   =   L 1     L 0 2 + a 1     a 0 2   +   b 1     b 0 2   =   Δ L 2   +   Δ a 2   +   Δ b 2

2.3. Protection Performance Tests

2.3.1. Porosity Test

First, we put the prepared sample in an 80° drying oven for 24 h, and weighed its initial mass M0 after cooling. The sample was placed in the dry box and the vacuum pump was turned on for 27 min (the degree of vacuum was about 0.1 MPa), then deionization water was slowly injected (i.e., when the liquid level exceeded about 2 cm of the sample, water injection was stopped), and air was continuously pumped until no bubbles emerged from the surface of the sample. After taking out the sample, it was put into a container with deionized water and it was left to stand for 2.5 h. The moisture on the surface of the sample was wiped off, weighed, and recorded as M1. According to Equation (1), the forced water absorption W0 of the sample was obtained (Figure S3). When the shape of the stone does not change when exposed to water, the forced water absorption rate W0 of the stone is equivalent to the open porosity P:
P   =   M 1     M 0 M 0   ×   100

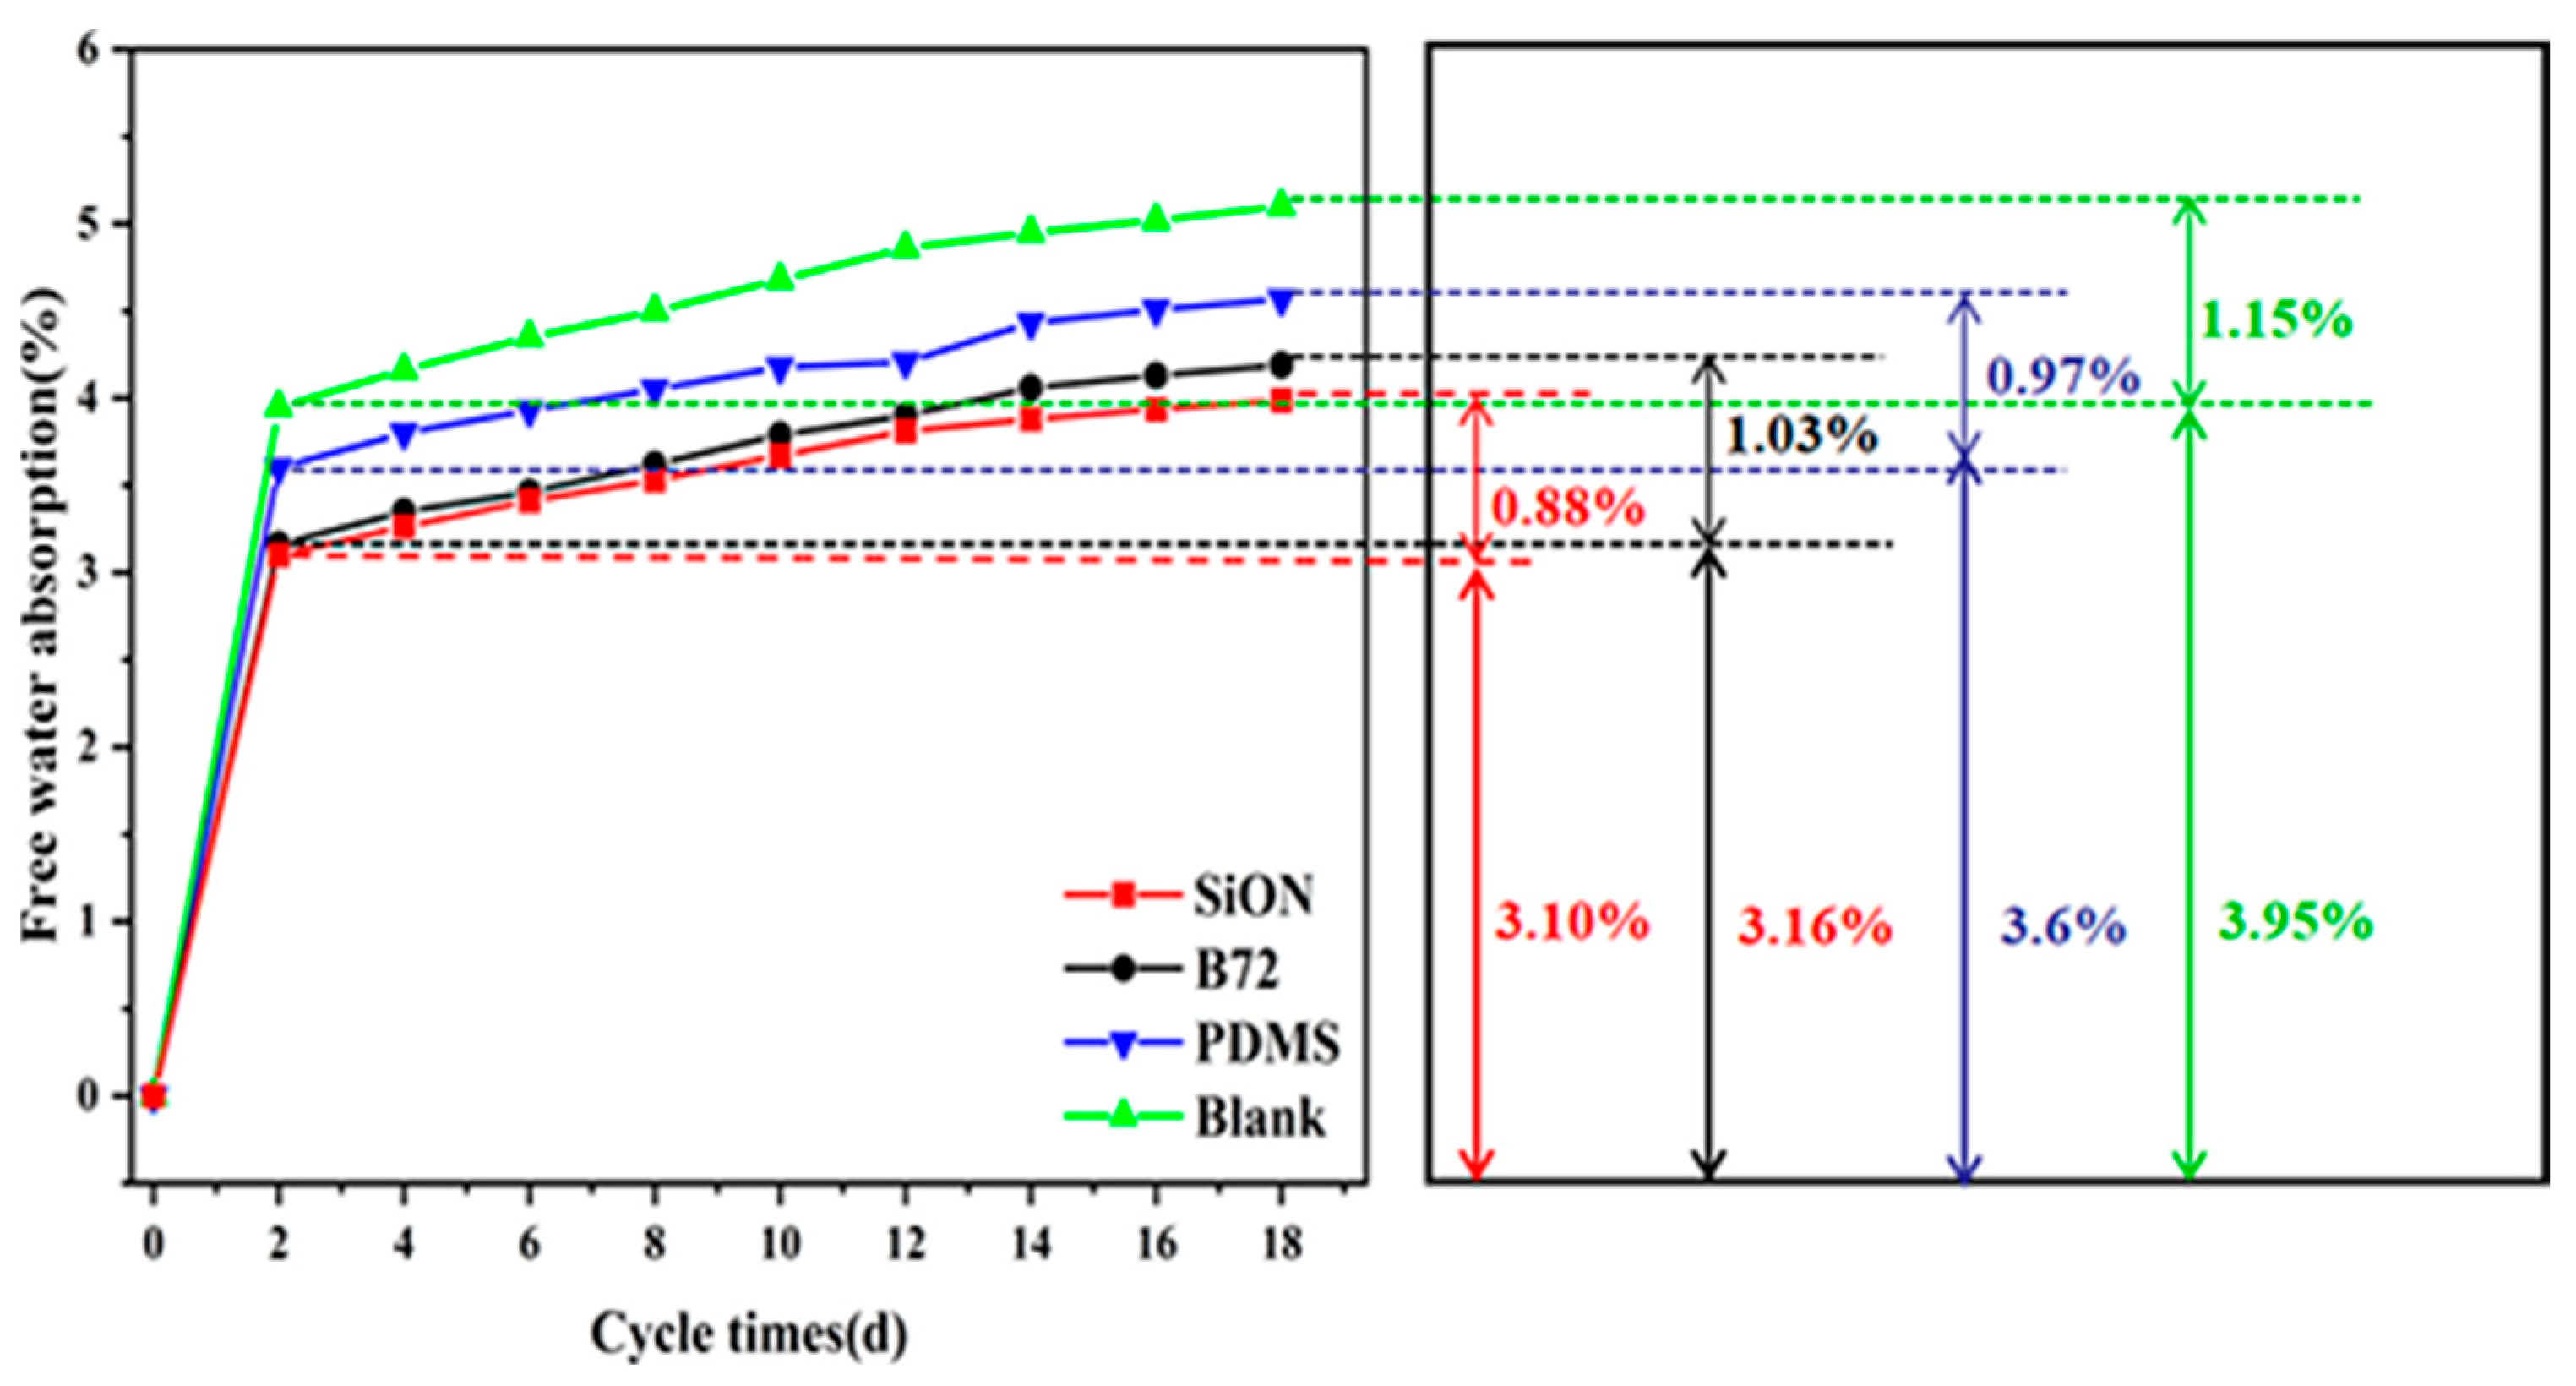
2.3.2. Waterproofing Test

The effectiveness of the resulting polymer dispersions as water repellents was tested by the static contact angle and free water absorption. In order to have a good average evaluation, five measurements were made on the surface of each sample. Water absorption refers to the weight change of sandstone samples after 8 h of immersion in distilled water. In the specific experimental operation, the sandstone samples were first dried in an oven at 80 °C for 22 h and then cooled at room temperature. The weight was recorded as M0 (g). After weighing, the stone was soaked in distilled water for 8 h, and the weight was taken out and recorded as M1 (g). The calculation results of the water absorption coefficient ∆M (%) were determined by the following equation:
Δ M   =   M 1     M 0 M 0   ×   100
The calculation of sample data was repeated to obtain a series of data.

2.3.3. Test of Water Vapor Permeability

Water vapor permeability (WAP) is a property that expresses the ability of porous material to allow water vapor to pass through its pores under the influence of a difference in water vapor concentration. A quantity of distilled water was poured into a glass bottle. The mouth of the bottle was covered with sandstone, then the rim of the glass was sealed with waterproof silicone rubber. The initial weight of the glass bottle assembly (i.e., the glass bottle and the attached sample) was recorded as M1. During the whole experiment, the water level in the bottle was within 20 ± 6 mm from the sample. The samples were weighed every 24 h and the weight changes were recorded. The WAP test of sandstone was characterized by mass loss, as follows:
∆M = M1 − Mi
where i represents the number of cycles.

2.3.4. Test of Weather Resistance

First, the sample was placed in a 70 ± 0.5 °C drying oven to dry for 24 h. After cooling, the initial mass M1 was weighed and tested, according to the following steps: the sample stone was first soaked in a 0.5 mol/L−1 Na2SO4 solution for 24 h, then frozen for 4 h (−15 °C) and finally heated at 70 ± 0.5 °C for 22 h; the weight was recorded, and these steps counted as one cycle.
Δ Mi   =   M i     M 1 M 1
where the i represents the number of cycles.

3. Results and Discussion

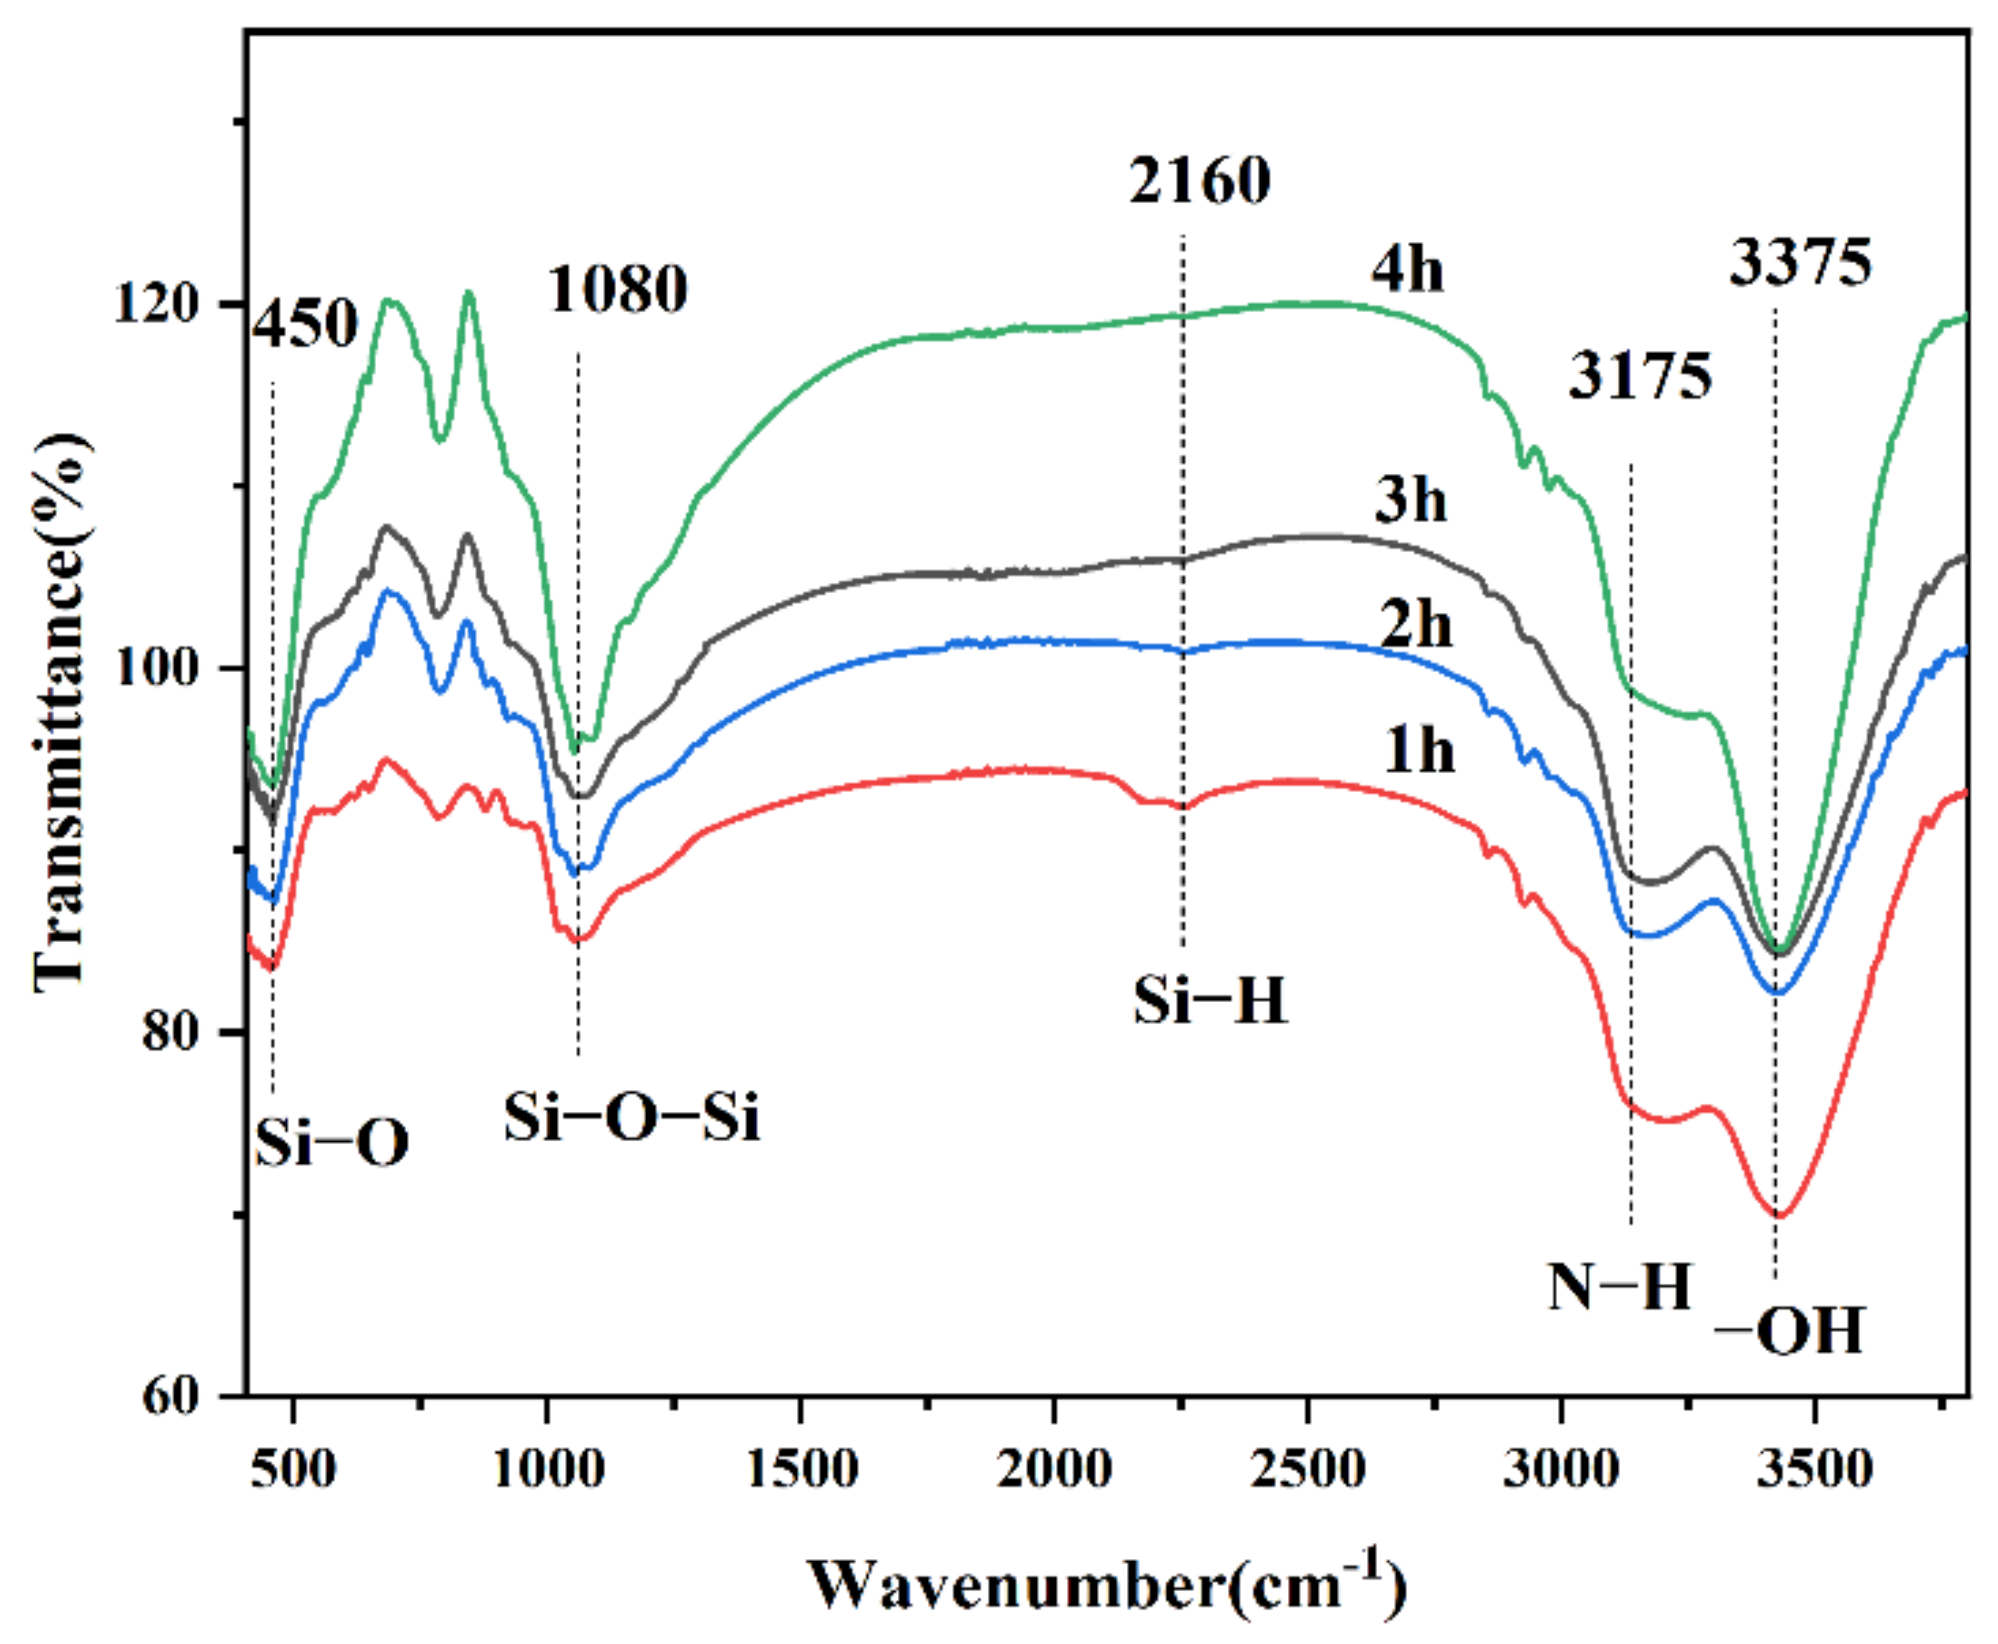
3.1. Fourier Transform Infrared Absorption Spectrum Analysis

The chemical bonds in the spectrum reflect the effect of curing PHPS on the formation of SiON under different pyrolysis times. Figure 1 shows that the peak shapes were the same for almost all solids. The biggest difference was that the sample with a pyrolysis time of 1 h had a broader Si−H absorption peak, which was a characteristic of the functional group of the precursor, indicating that the sample retained a good deal of PHPS information at this point. With the extension of curing time, the peak intensity of Si−H and N−H gradually weakened [37,38], and the strength of Si−O−Si at 460 and 1080 cm−1 gradually increased, indicating that the degree of conversion of PHPS increased [39]. After 4 h of heat treatment, the absorption peak of the Si−H bond disappeared, but the N−H bond still existed, indicating that the product still retained a certain amount of N element. According to the results of the IR spectrum, the final product after pyrolysis of PHPS was silica. The hydrolysis reaction of PHPS on the sandstone surface can be explained by the binding mechanism diagram shown in Figure S4 [40]. Due to the presence of a large number of Si−N and Si−H bonds, PHPS was very reactive, especially with the hydroxyl groups, so hydroxyl−rich sandstone on the surface was able to form good adhesion with PHPS by forming chemical bonds.

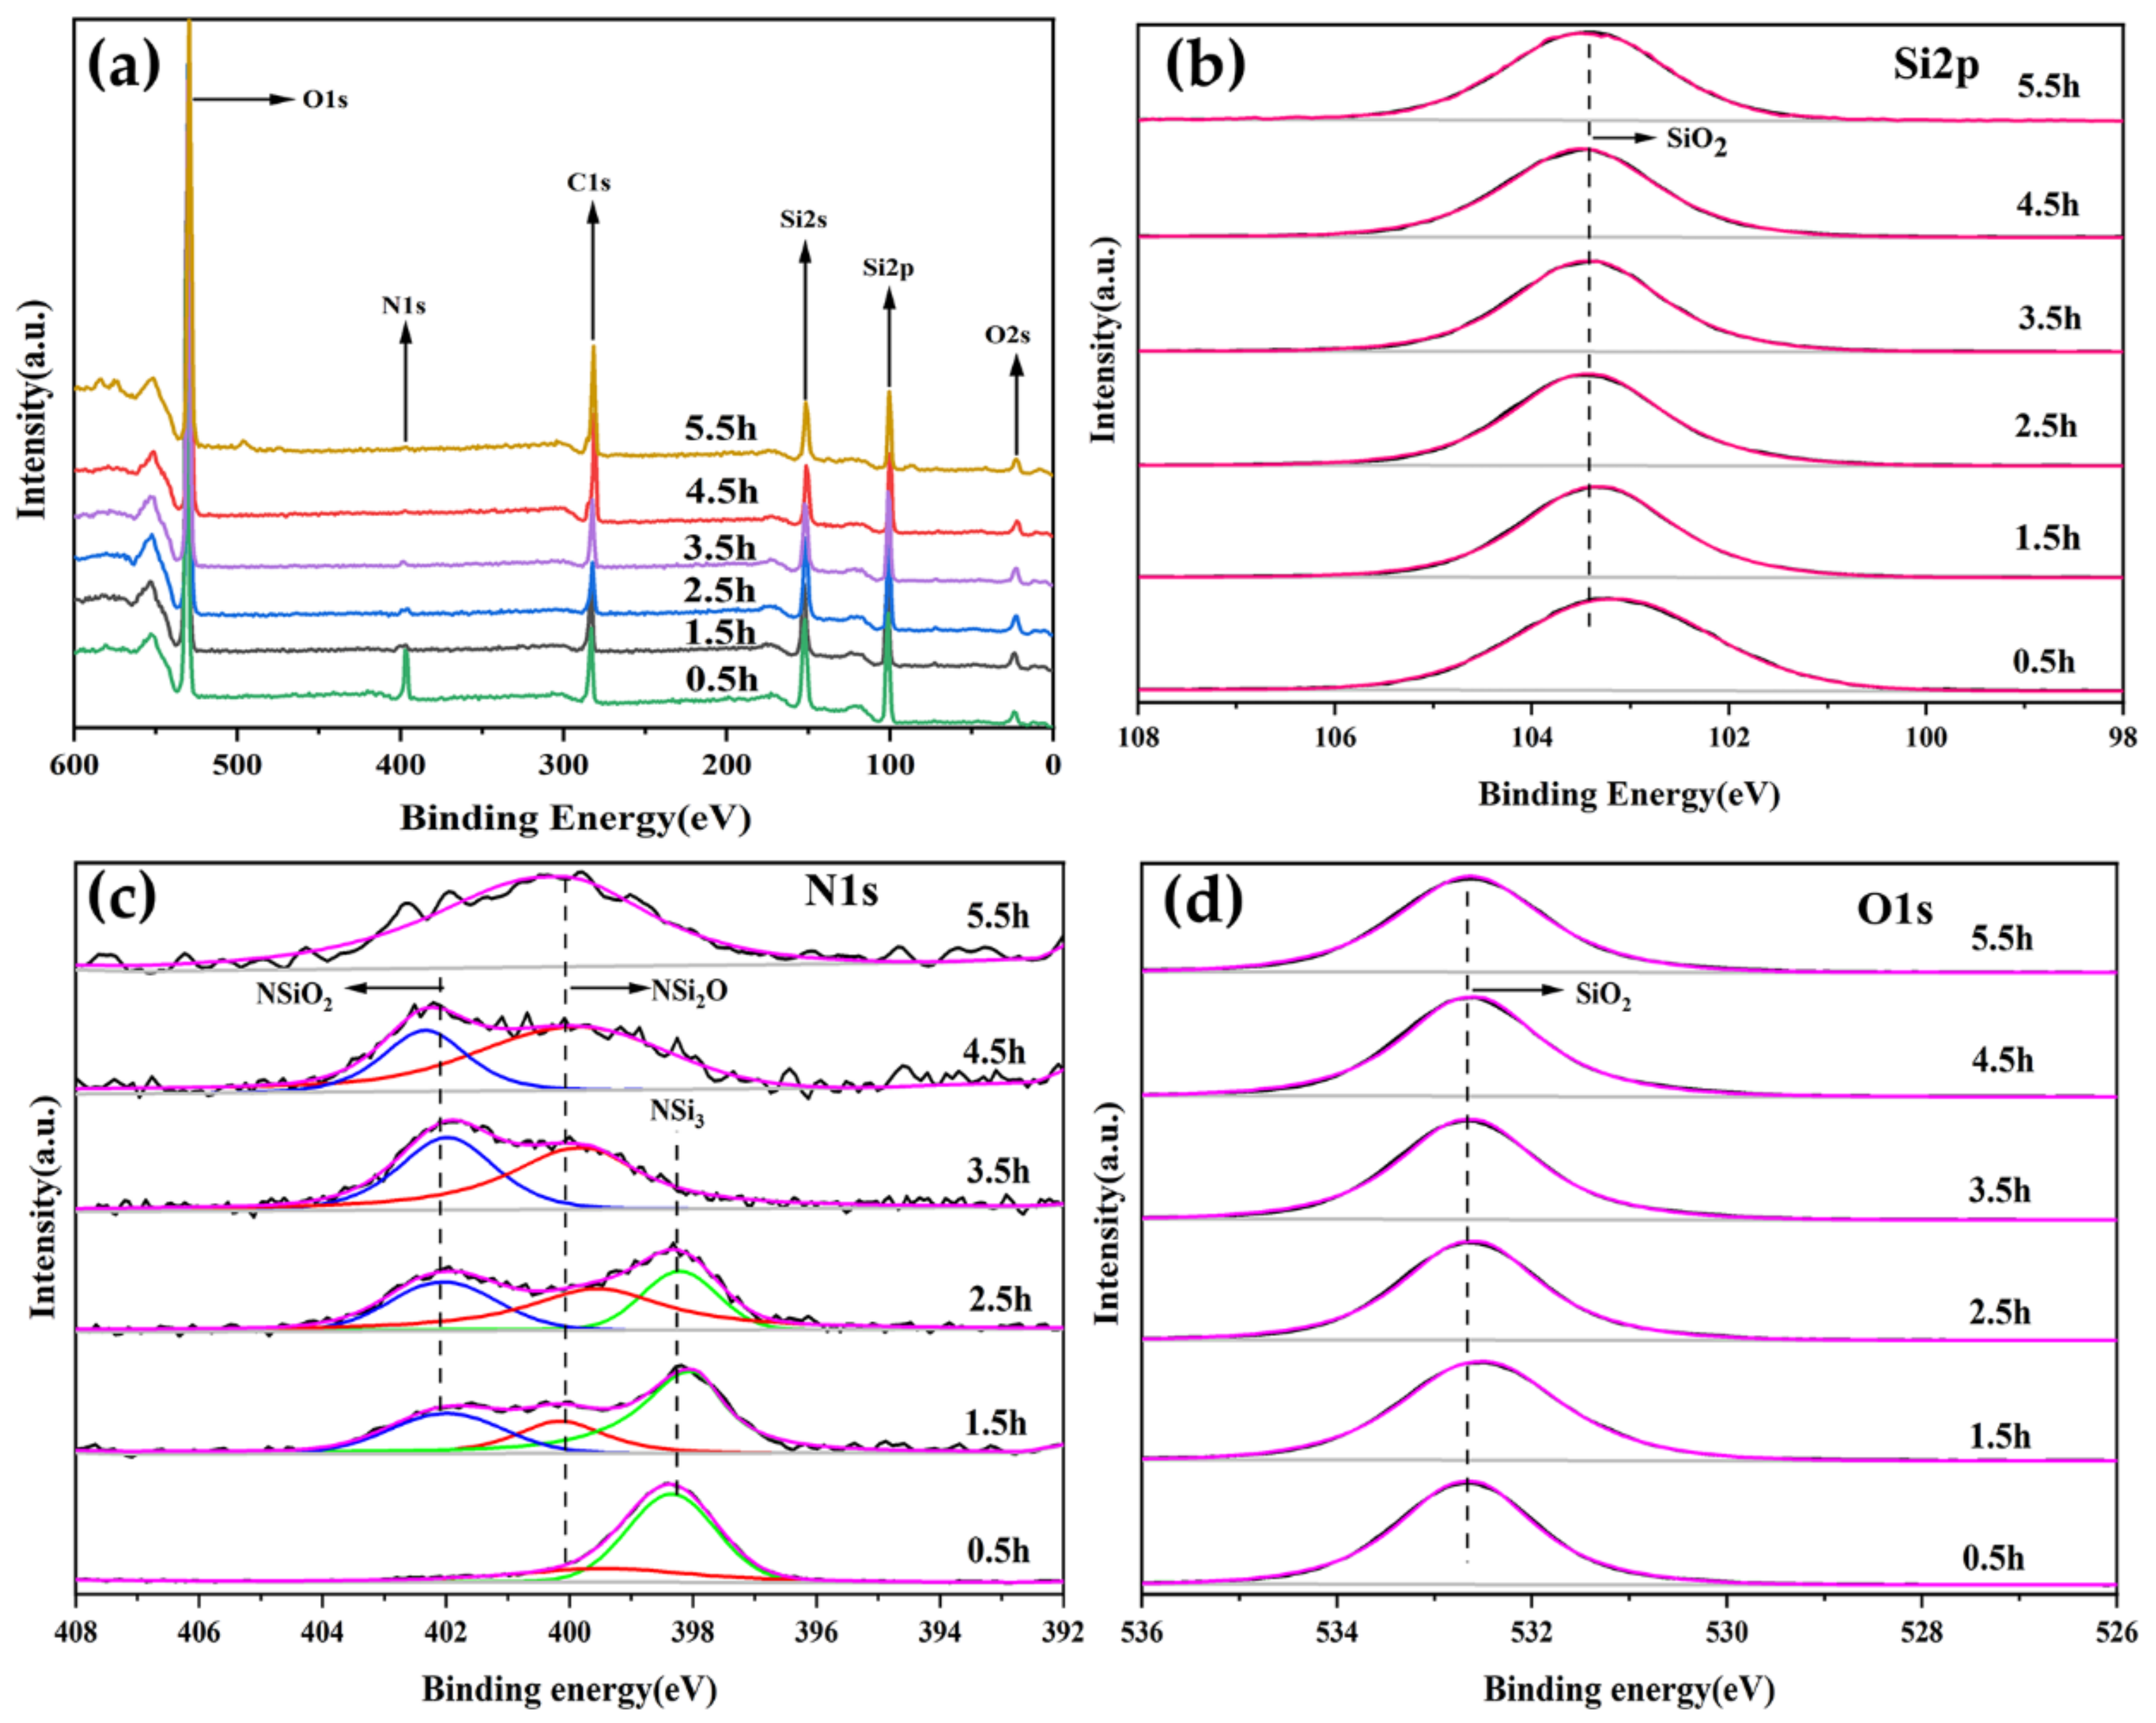
3.2. XPS Survey and Core Level Studies

The X−ray photoelectron spectra of PHPS at different pyrolysis times are shown in Figure 2. The Si (2p) spectrum shows that the peak positions and peak shapes of SiON solids in six different states were consistent (Figure 2b), and the Si element was not easily brought in by the form of surface contamination, so the amount of silicon element before and after curing was unchanged. Therefore, the intensity of N (1s) and O (1s) peaks was normalized using the Si (2p) peak as a reference. During the curing process, the intensity of the N (1s) peak (Figure 2c) continued to decrease within 0.5−5.5 h, the peak began to blur at 1.5 h, and the half−peak width at 4.5 h became significantly wider, indicating that a large number of nitrogen atoms participated in the pyrolysis reaction. The analysis O (1s) spectra (Figure 2d) were of interest because of the presence in such consistent amounts of oxygen even for PHPS that did not contain oxygen in the structural formula. With the further conversion of PHPS to SiON, the O (1s) peak intensity was further enhanced, and the proportion of oxygen increased from 59.74% to 70.93% (Table 1), which indicated the continuous incorporation of oxygen atoms into the PHPS material.
The deconvolution of N (1s) core level spectrum revealed three components with binding energies at 398, 400, and 402 ev. According to the peak shape and the peak position of N (1S), the pyrolysis process was divided into three stages. The pyrolysis time was 0.5−2.5 h and belonged to the first stage. At this time, nitrogen mainly existed in the form of the NSi3 chemical state, and the complete disappearance of the NSi3 chemical state after 2.5 h indicated that the reaction process in the first stage was very rapid. The pyrolysis time was 3.5−4.5 h and was classified as the second stage (the NSiO2 chemical state gradually disappeared). At this time, nitrogen mainly existed in the chemical state of NSi2O. The pyrolysis time after 5.5 h was classified as the third stage, and a trace amount of nitrogen existed in the chemical state of NSi2O.
For determining structural changes related to the achievement of new solid forms, the analysis of N (1S) photoelectrons appeared to be more important. From the analysis of the change in the quantity of the N element only, the total proportion of the N element decreased from 22.71% to 3.38%, and the change in the proportion of the NSi3 chemical state from 16.77% to 0% was the most obvious (Table 1). After curing for 1.5 h, the proportion of N element decreased from 22.71% to 8.26%, and the proportion of NSi3 plummeted from 16.77% to 2.28%. The proportion of NSi2O was also reduced from 5.94% to 3.62%. Although a new NSiO2 peak was generated at 402.2 ev, its proportion was only 2.36%. This revealed that the chemical state of NSi3 could not be transformed into the chemical state of NSi2O or NSiO2. At this time, the proportion of oxygen was as high as 67.85%, but the precursor PHPS structure did not have oxygen atoms, which proved that the chemical state of NSi3 at this stage directly removed the nitrogen and introduced oxygen to form silica. What was interesting was that when the curing time was 1.5 h, the peak of NSiO2 appeared at 402.2 ev, and the ratio increased from 0 to 2.36% to reach the peak. At this time, the proportion of the chemical state of NSi2O decreased from 5.94% to 3.62%, and the loss rate was 2.32%, which was almost the same as the increase rate of NSiO2 at 2.36%. It can be concluded that NSi2O transfers to the NSiO2 chemical state during the curing process, which is different from the direct oxidation of NSi3 to SiO2. The final SiON solid only retained a small amount of nitrogen in the chemical state of NSi2O.
In general, the chemical state of NSi3 in the early pyrolysis stage was rapidly oxidized to form silica, and the NSi2O peak was constantly weakened during the pyrolysis process but did not completely disappear. The trace nitrogen of the final product was in the form of NSi2O chemical state. The NSiO2 peak was obtained from the chemical state transition of NSi2O and existed in the 1.5−4.5 h pyrolysis process, and finally removed nitrogen to form silica.

3.3. Color Changes

Before applying proper protection techniques to the sandstone, we ensured that the protective agent was not altering the appearance of the specimen. The global chromatic aberration of the samples SiON and PDMS were both lower than 3 (Table 2), and the color difference change did not exceed the limit that the human eye can perceive [41,42], indicating that SiON and PDMS coatings produced acceptable changes in the optical appearance of the specimens. Due to the good film−forming property of B72 polymer, it was easy to produce visible appearance changes on the yellow sandstone surface, and the final B72−treated sandstone ΔEab = 4.93 was in the “tolerable” range (ΔEab ≤ 5) [27,42]. These color changes were primarily due to a decrease in L−value and an increase in b−value, indicating that B72 products tend to have a tendency to be darker and more yellowish. The effect of rock color difference was primarily determined by the amount of protective material used when applying these non−colorless and transparent coatings, so B72 materials were applied in controlled concentrations.

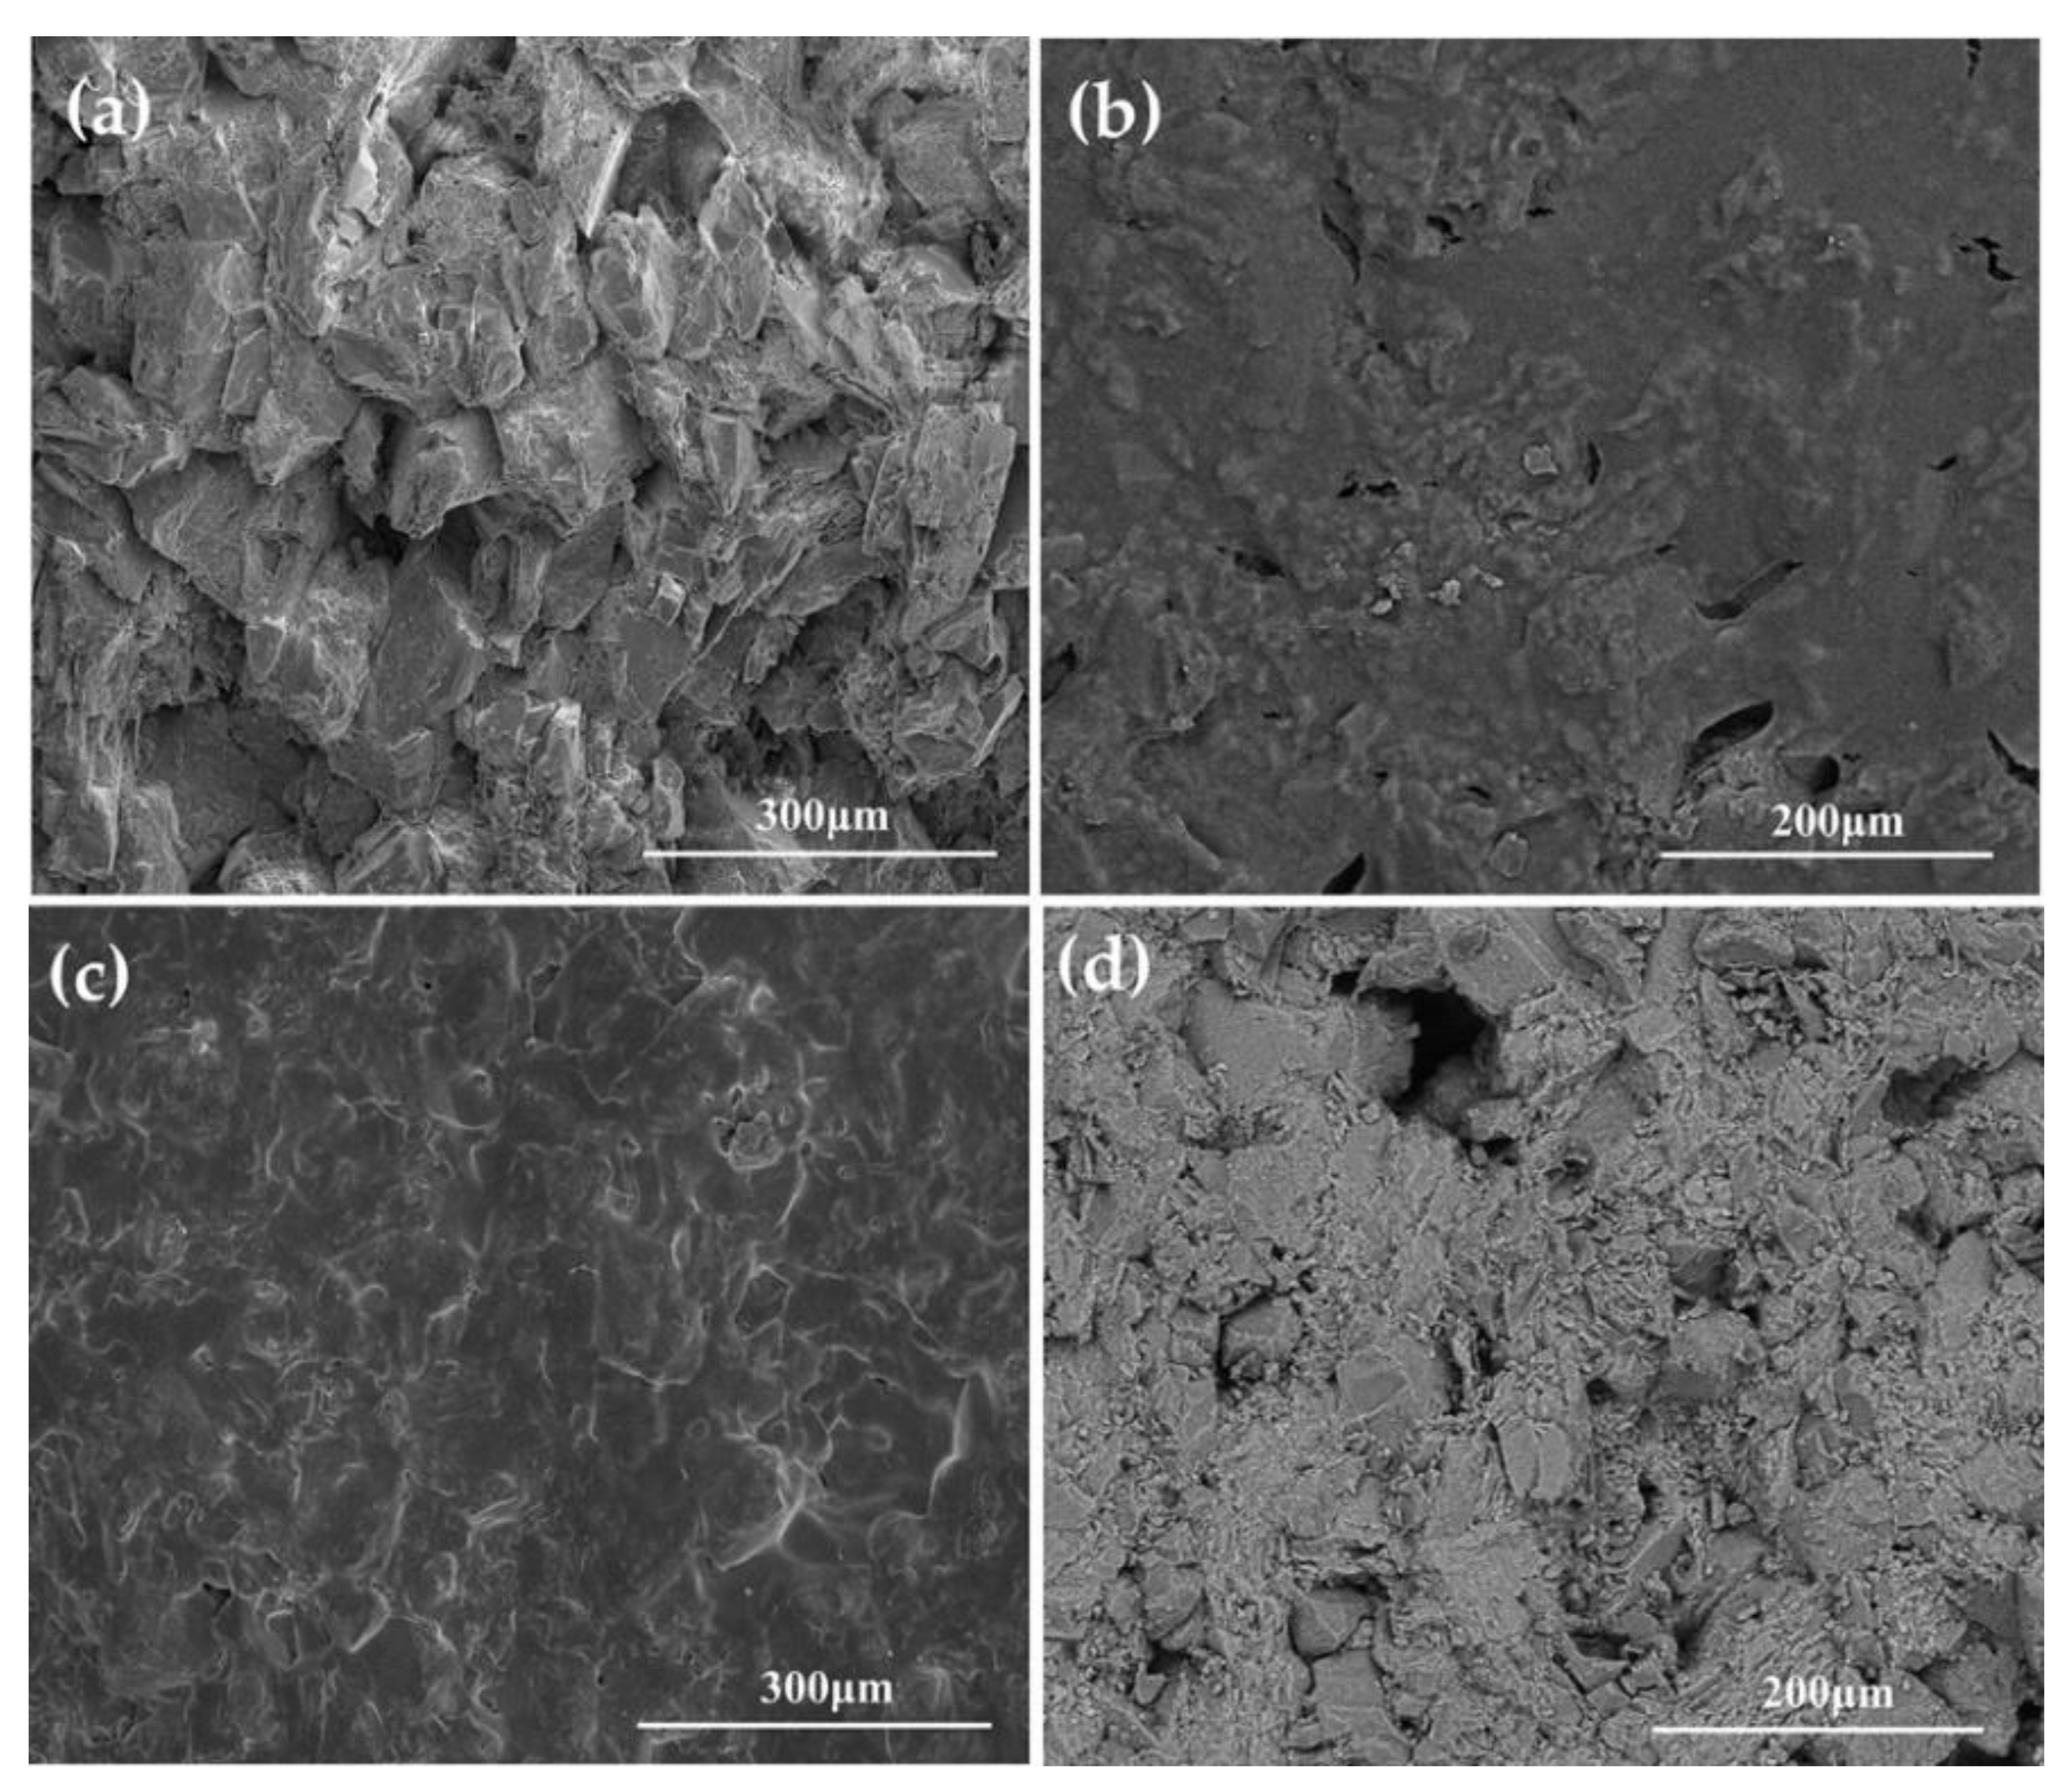
3.4. Micromorphological Analysis

Sandstone covered by different coatings has different surface roughness and uniformity under high magnification. Untreated sandstone has a rough surface and large pores (Figure 3a). Sample SiON showed a dense coating with small cracks (Figure 3b). For sample B72 (Figure 3c), it was observed that the coating completely enveloped the surface of the stone and it looked smooth without cracks. Compared with samples SiON and B72, the results of sample PDMS (Figure 3d) showed that the material PDMS could not fill the large pores on the sandstone surface to form a complete coating. In general, SiON and B72 materials were effective as sandstone protection materials because they formed a uniform and complete coating on the surface of the sandstone.

3.5. Water Vapor Permeability Results

The stone matrix itself has a certain “breathability” to ensure that the internal trace water can be discharged. Therefore, the protective material must also maintain a certain degree of air permeability. The WVP experiment was characterized by mass loss (g). The higher the mass loss, the greater the WVP of the stone. The water vapor loss of the test samples SiON, B72, PDMS, and Blank were 1.391 g, 1.22 g, 1.47 g, and 1.64 g, respectively (Figure 4). First, it was observed that the sample Blank had the highest WVP. The mass loss of samples SiON, B72, and PDMS were 84.75%, 73.17%, and 89.63%, respectively, of the Blank sample, which indicated that the WVP of the sandstone protected by the coating was reduced to varying degrees. A hard crust was formed into the surface of sample B72 [16], resulting in poor WVP of sandstone. Two protective agents with better WVP were SiON and PDMS, which could be used as sandstone protection materials.

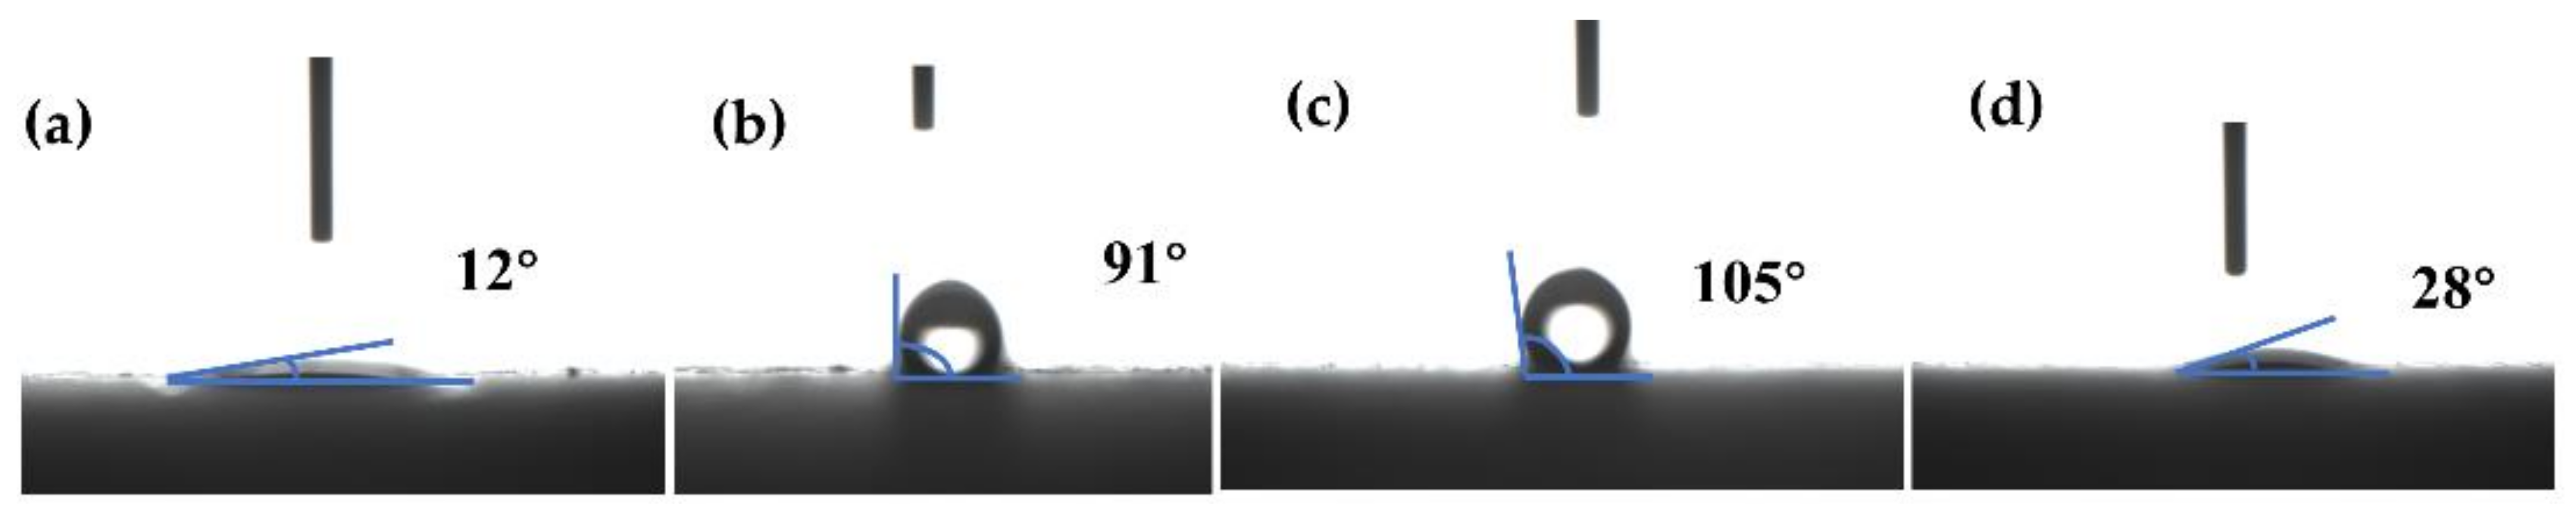
3.6. Water Repellency Analysis

As shown in Figure 5, the contact angles of stone samples SiON, B72, PDMS, and Blank were 12°, 91°, 105°, and 28°, respectively. The super hydrophilic interface helped in the rapid spread of water; the flow of water was easily removed from the surface dust, improving the ability of the treated stone to clean the surface dust. Compared with the higher contact angle values of PDMS and B72, the hydrophilic of SiON better improved the self−cleaning ability of stone.
The free water absorption test is shown in Figure 6; the water absorption process of all stone samples was divided into two stages. The free water absorption rate increased rapidly in the first stage, and slowly increased in the second stage. The final water absorption rates of the stone samples SiON, B72, PDMS, and Blank were 3.98%, 4.57%, 4.19%, and 5.1%, respectively. Compared with sample Blank, the water absorption of samples SiON, B72, and PDMS decreased by 21.96%,10.39%, and 17.84%, respectively. Although the static contact angles of sample B72 and PDMS were hydrophobic, the free water absorption rate of sample PDMS was significantly lower than that of sample B72, indicating that the short−term water repellency and long−term wettability of the stone were two independent results. The static contact angle reflected the wettability of the sandstone surface coating, while the free water absorption result reflected the compactness of the coating and the internal structure of the sandstone [43]. The porosities of the samples Blank, SiON, B72, and PDMS were 10.06%, 7.12%, 8.96%, and 7.64%, respectively (Figure S5). On the whole, the porosity of the processed sandstone sample was lower than that of the Blank sample, and the porosity of samples B72 and SiON was lower than that of PDMS. Silica coatings applied to sandstones with a silica composition showed better compatibility and stability. Therefore, the open porosity and free water absorption of the sandstone after PDMS and SiON treatment decreased. B72 materials with poor permeability and high brittleness were usually more susceptible to water erosion [16].

3.7. Evaluation of Anti−Salt Damage for Sandstone

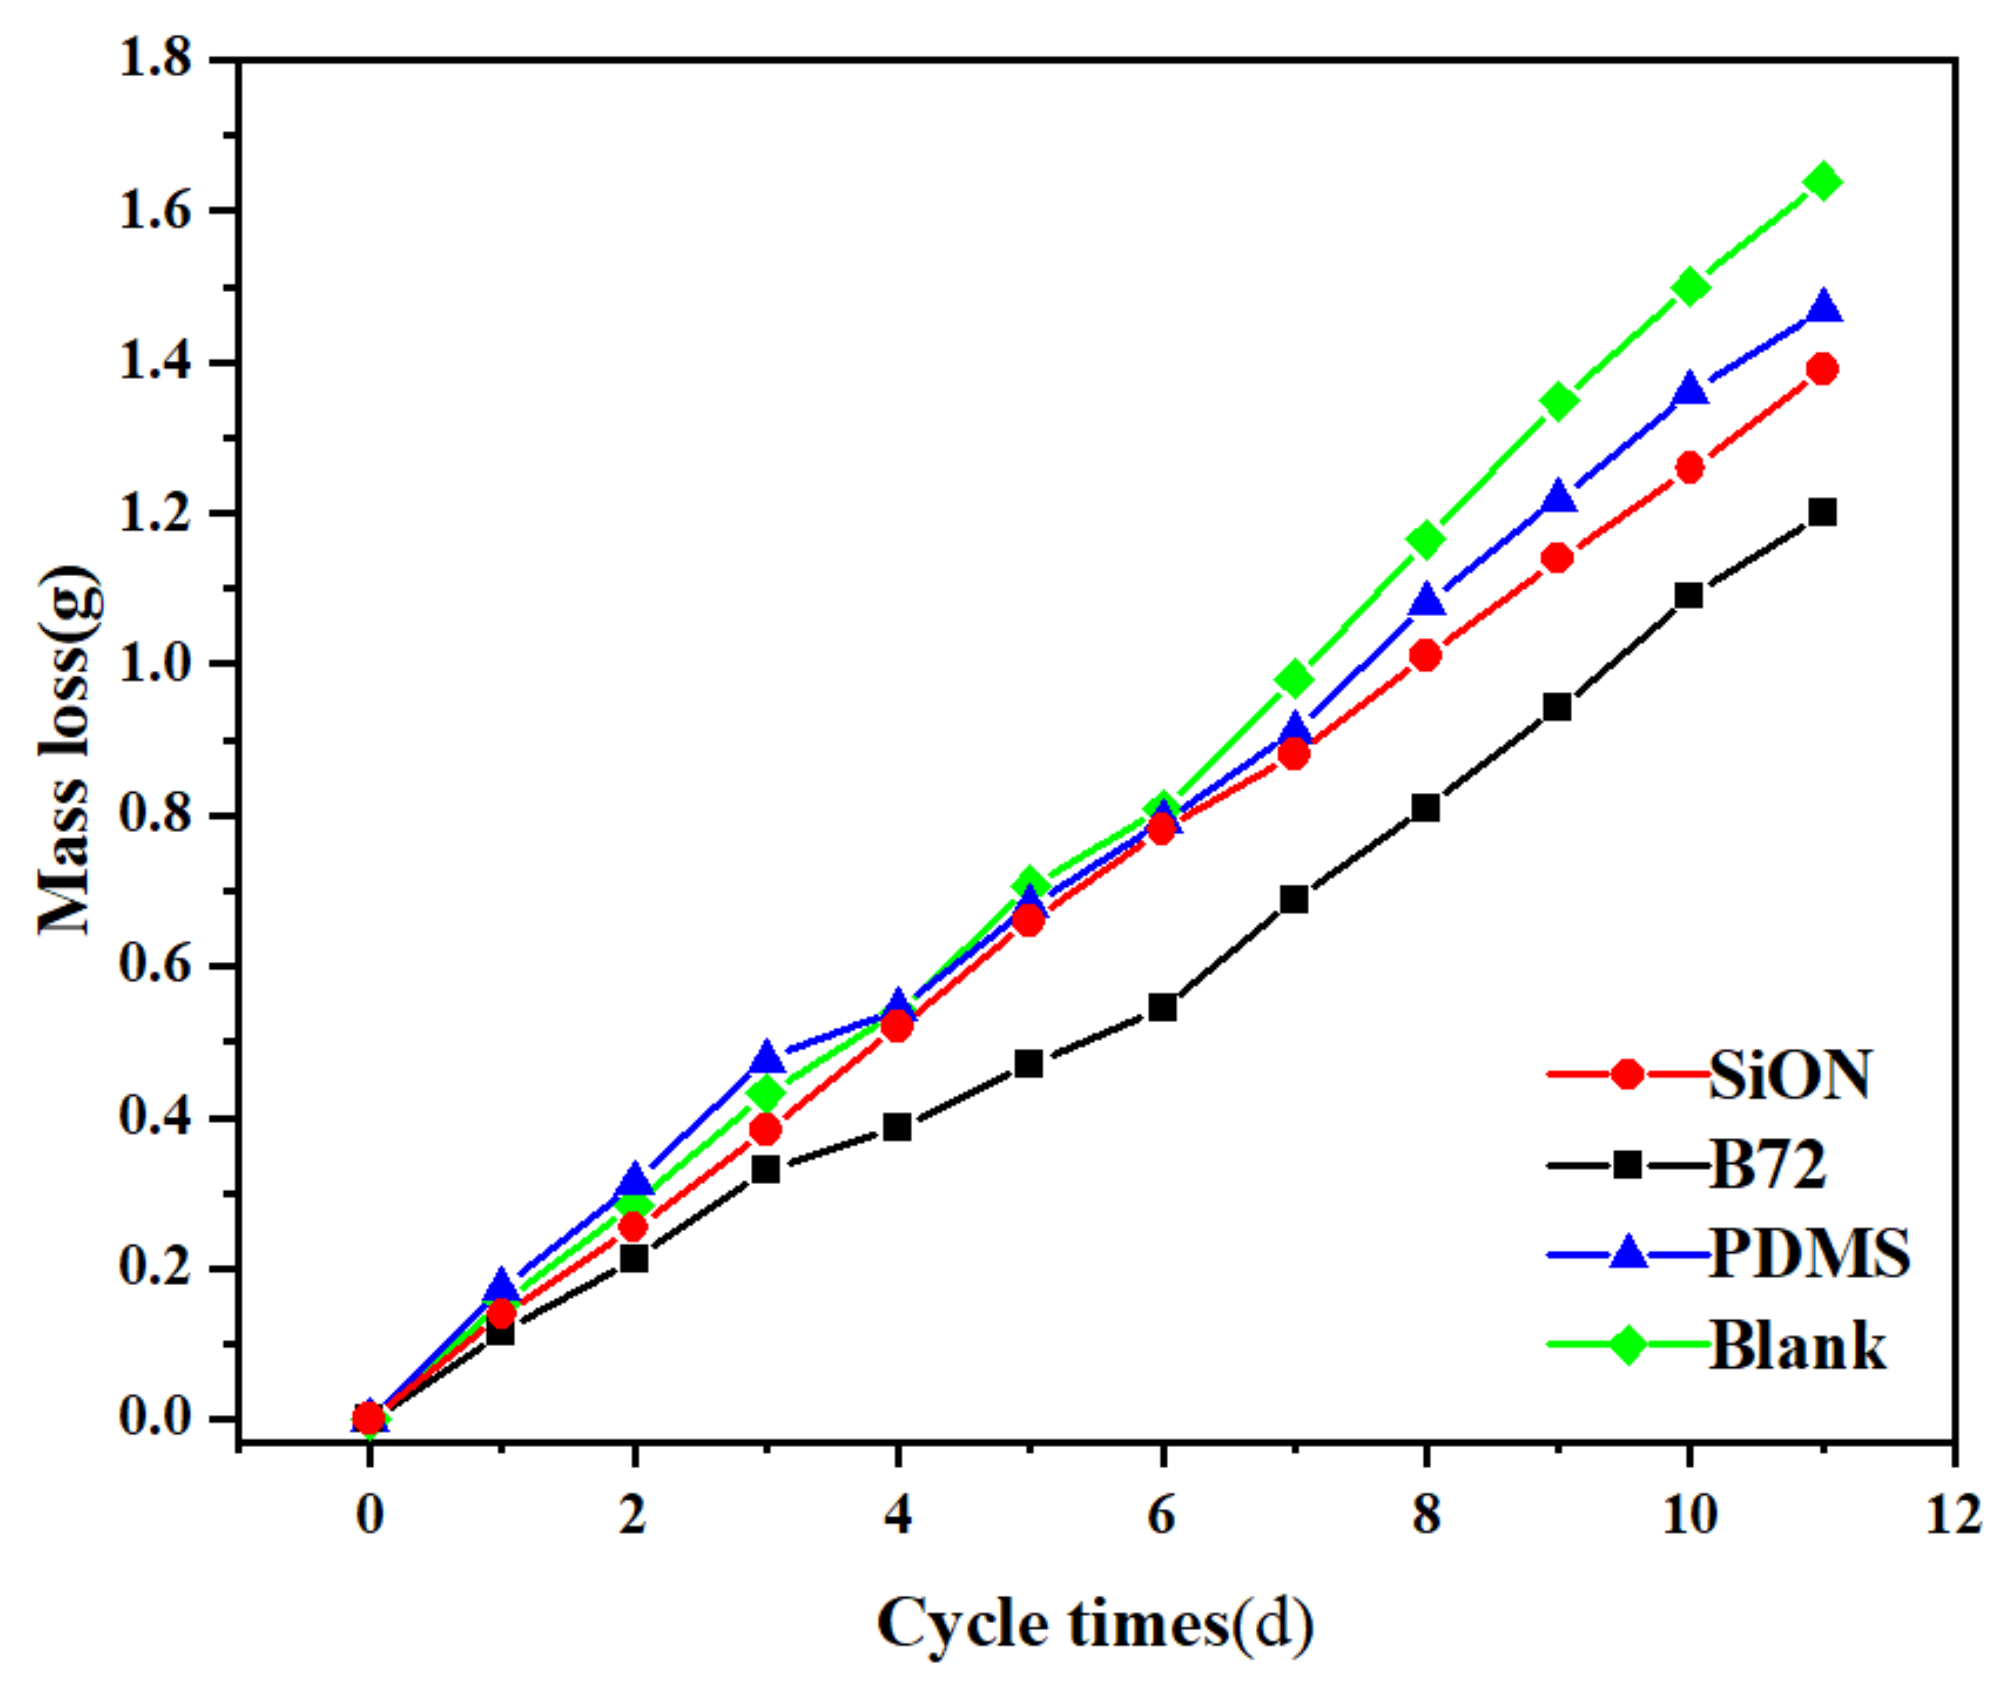
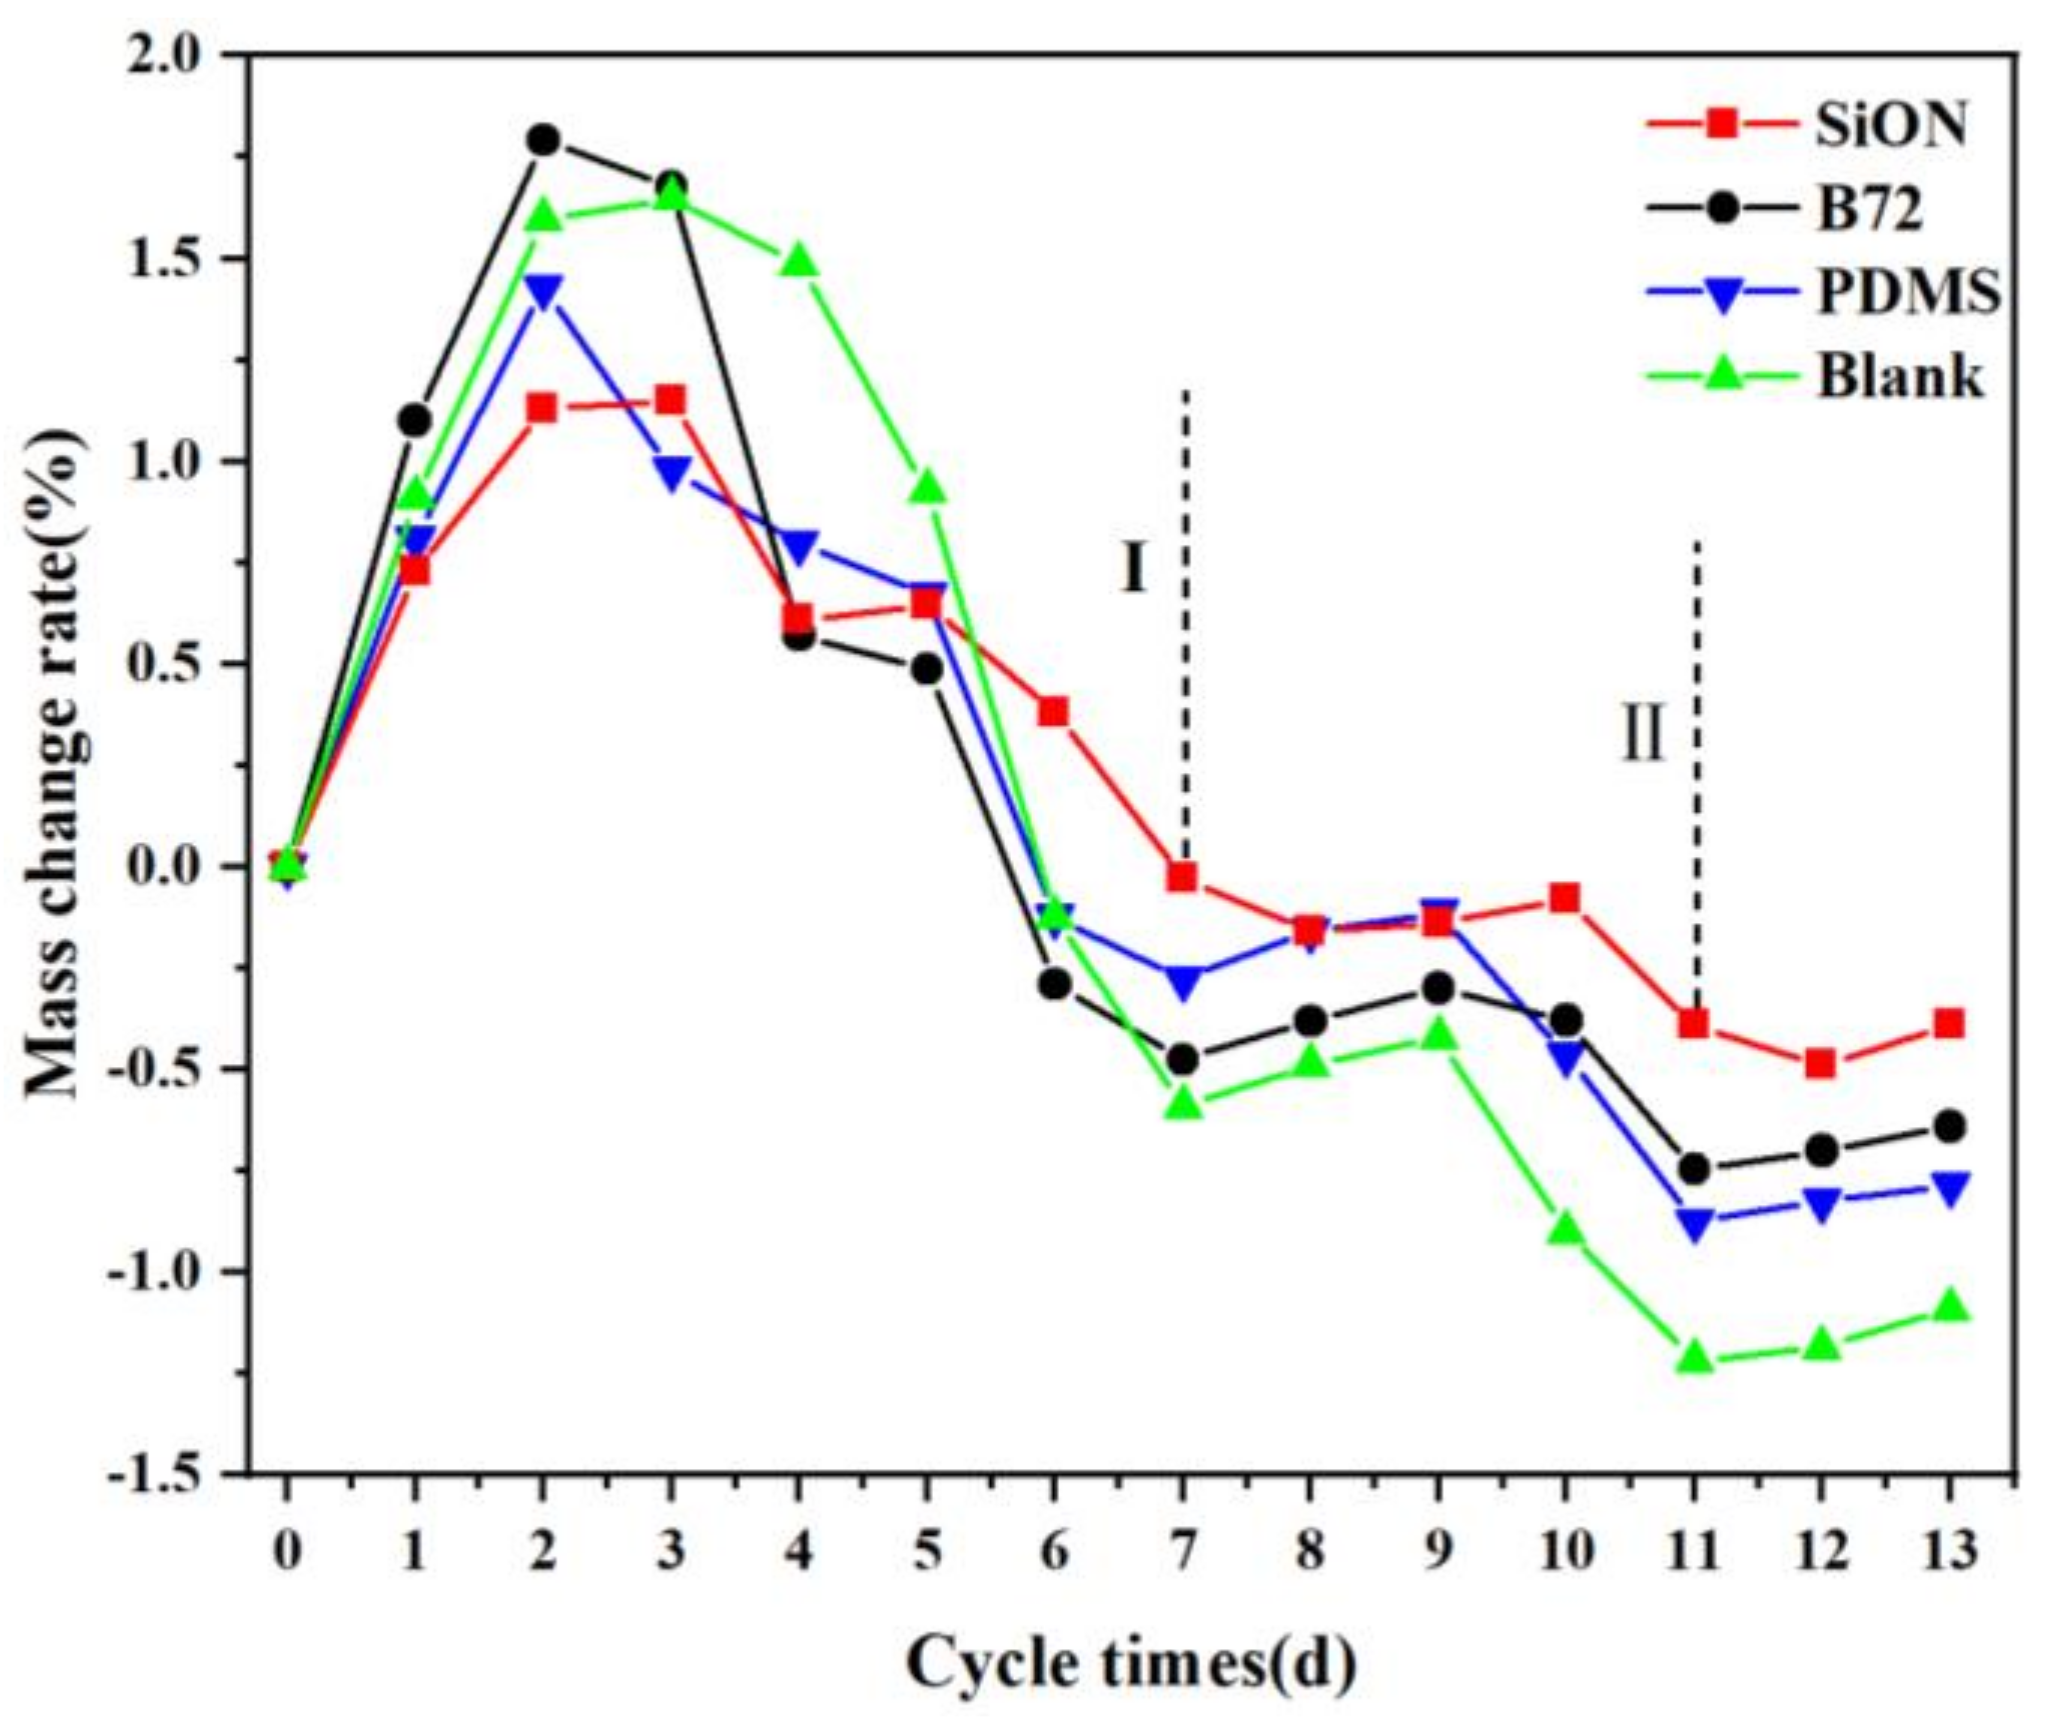
3.7.1. Mass Change in Salt Weathering Test

The relationship between the rate of weight change of the stone samples and the period of time is shown in Figure 7. The salt weathering damage was divided into two stages. The first stage had a total of seven cycles, reflecting the destruction of the outermost layer of the sample. As the porous sandstone was immersed in the sodium sulfate solution to absorb salt, the weight of the stone increased in the first two cycles, and the weight of the stone decreased after the seventh cycle, indicating that the sandstone was significantly damaged. At the beginning of the second stage, the weight of the sample increased slightly. The main component of the sandstone was silica, which is insoluble in water. The increase in the weight of the sample indicated that the salt had accumulated on the surface again and a new corrosion cycle had started.
After the salt weathering cycle experiment, the mass loss rates of samples SiON, B72, PDMS, and Blank were 0.392%, 0.642%, 0.781%, and 1.09%, respectively. The small change in mass gain/loss rate of the sample SiON during the experiments was attributed to the highly cross−linked network structure formed by the Si and O atoms in the SiON coating, and the coating imparted excellent barrier properties to the sandstone. Although samples PDMS and B72 showed some resistance to salt weathering, they were less stable in terms of quality change than sample SiON, which could be attributed to the poor compatibility between organic polymers and inorganic stones.
Sandstone bedding structures, such as parallel structures, wavy structures, plate-like structures, and staggered structures, are remarkable [44,45]. This layered structure can prevent the sodium sulfate solution from entering the sandstone and cause a large number of crystals to be deposited on the sandstone surface or enter the sub−outer layer along the pores. The repeated dissolution of sodium sulfate recrystallisation between the second and outermost layers of sandstone causes the second outer layer to deform downwards and create pores, allowing more sodium sulfate solution to enter the next layer. The original tight sandstone underwent salt weathering to produce pores and to allow more sodium sulfate to be deposited in the interior, which explains the increase in the quality of sandstone samples in the 8−9 cycles.

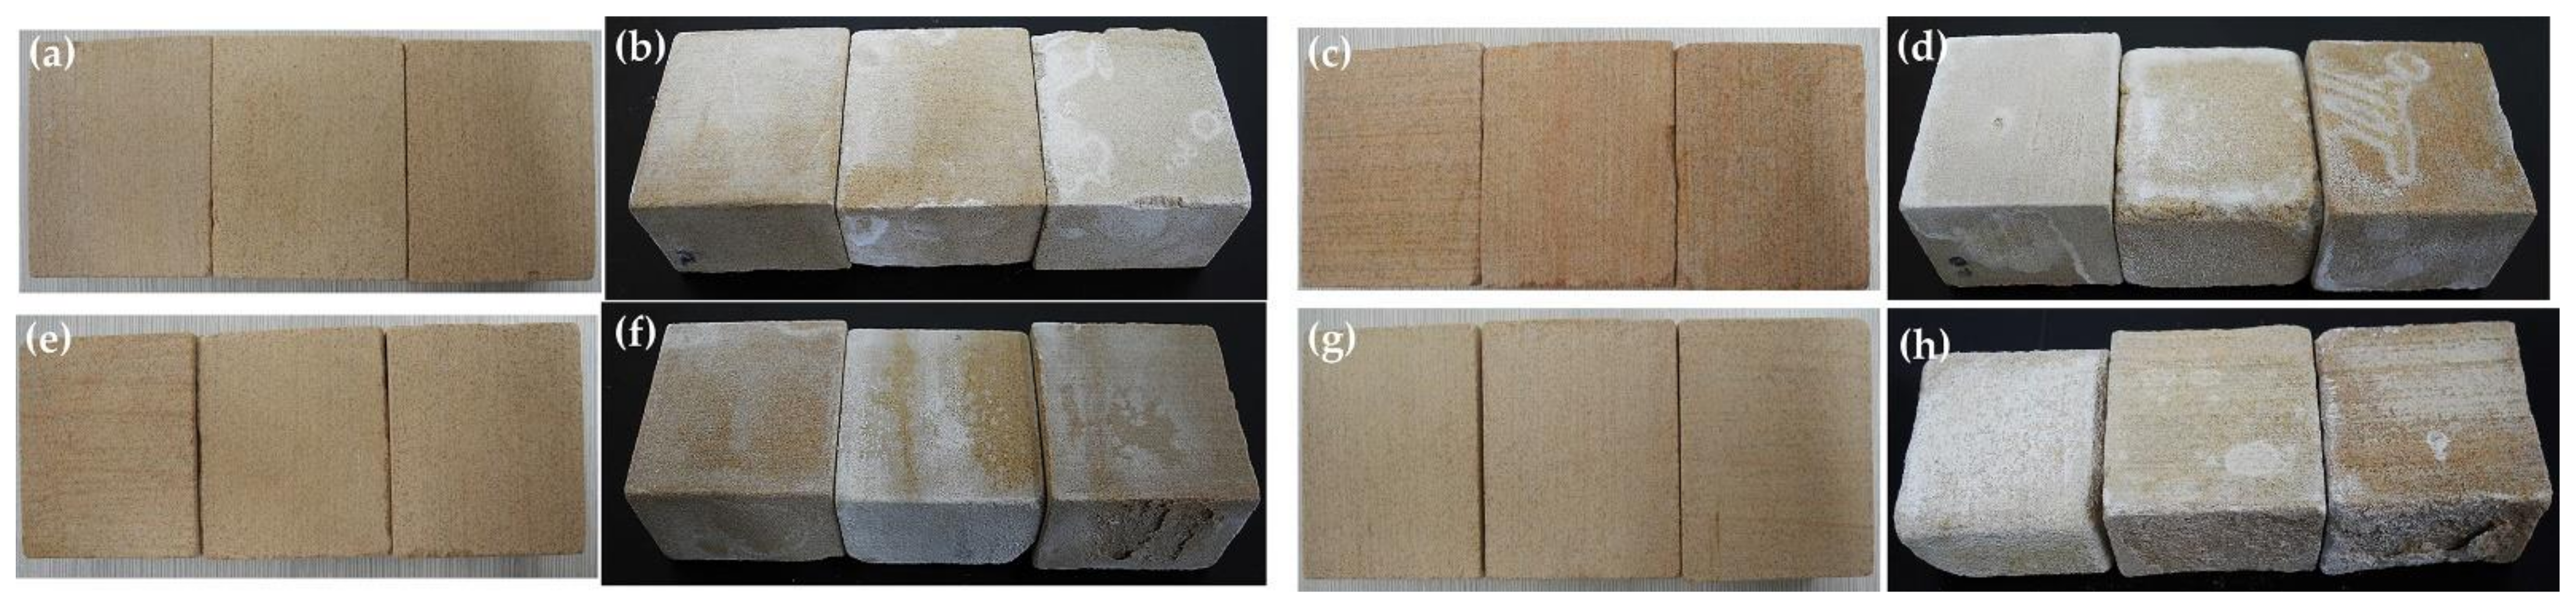
3.7.2. Appearance of Sandstone

The surface of specimen SiON was slightly damaged, and the original appearance of the sandstone was vaguely visible (see Figure 8b). However, the appearance of a few white crystals on the surface of the stone was an indication that salt crystal destruction had begun. The surface of sample B72 and PDMS (Figure 8d,f) showed obvious weathering characteristics (rough surface and particle peeling), the weight loss rate reached 0.642% and 0.781%, respectively, and the protection effect was not as good as that of SiON material. The contour of sample Blank (Figure 8h) was fuzzy and the surface peeled off obviously and was covered with a thick layer of crystalline powder. The weight loss rate of 1.09% indicated that sample Blank had the most severe weathering. In summary, the untreated stone samples were the most severely damaged, samples PDMS and B72 were moderately damaged, and sample SiON was slightly damaged. This showed that SiON can protect stone samples from damage caused by environmental factors.

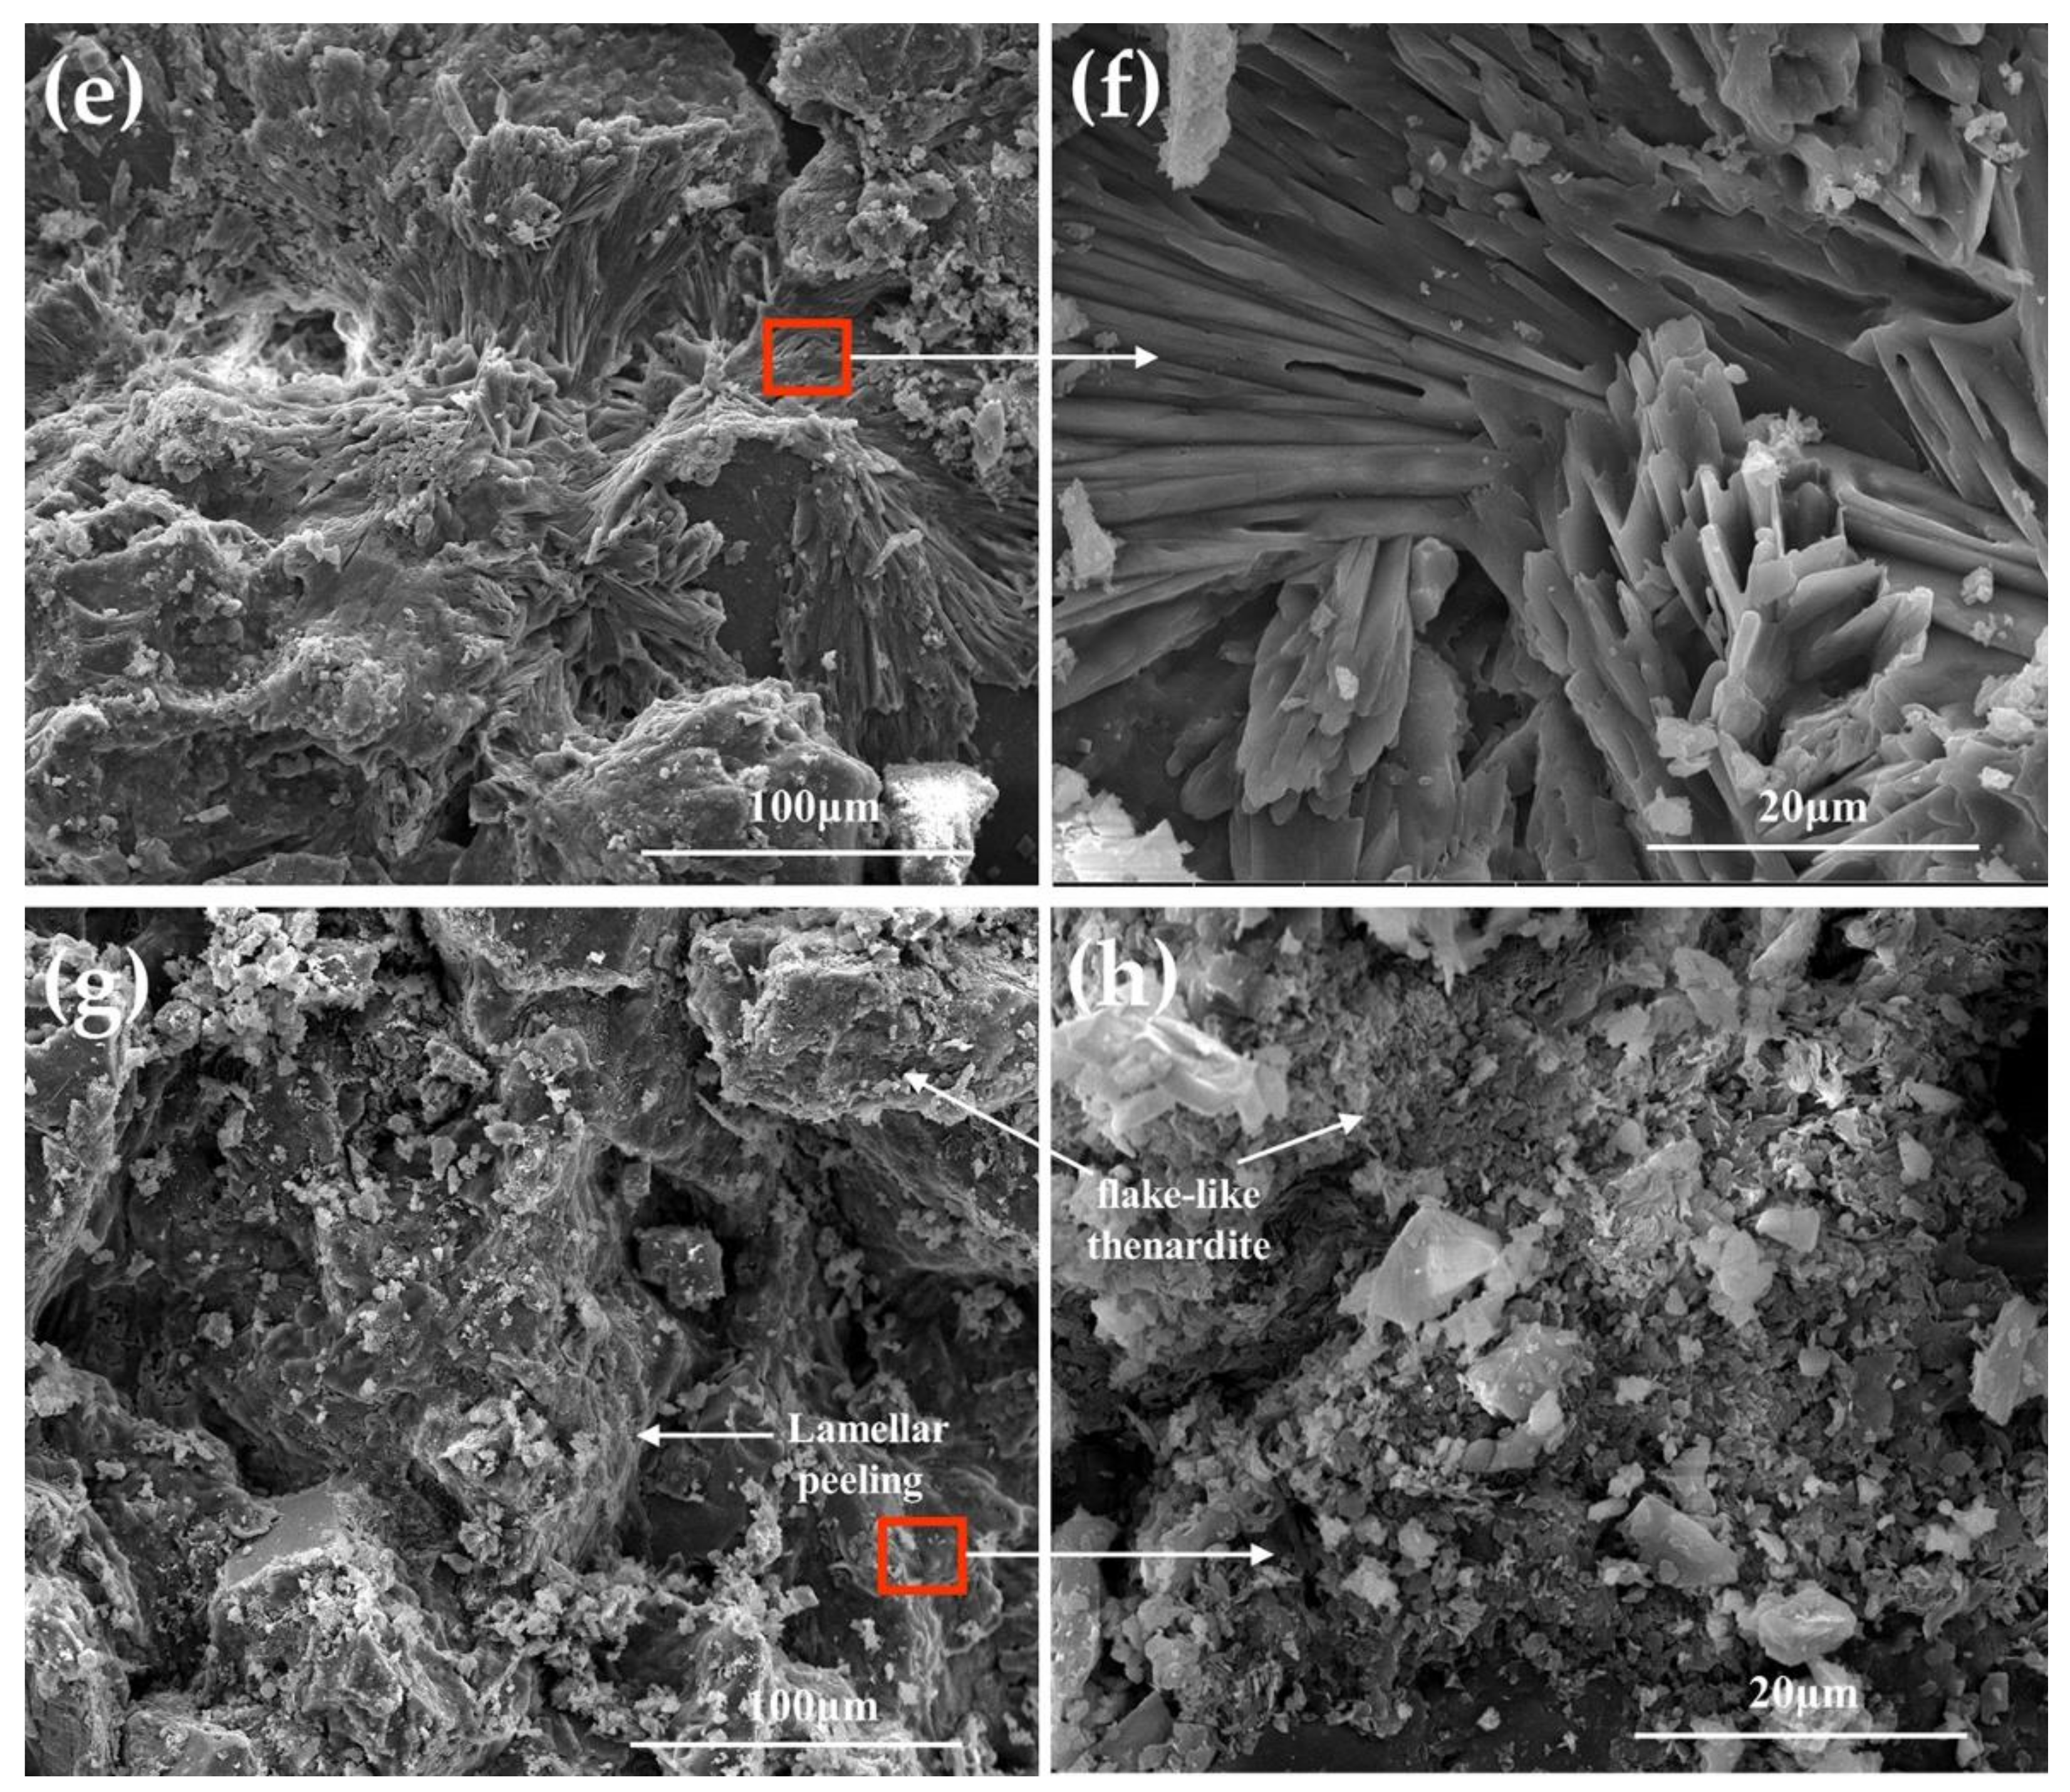
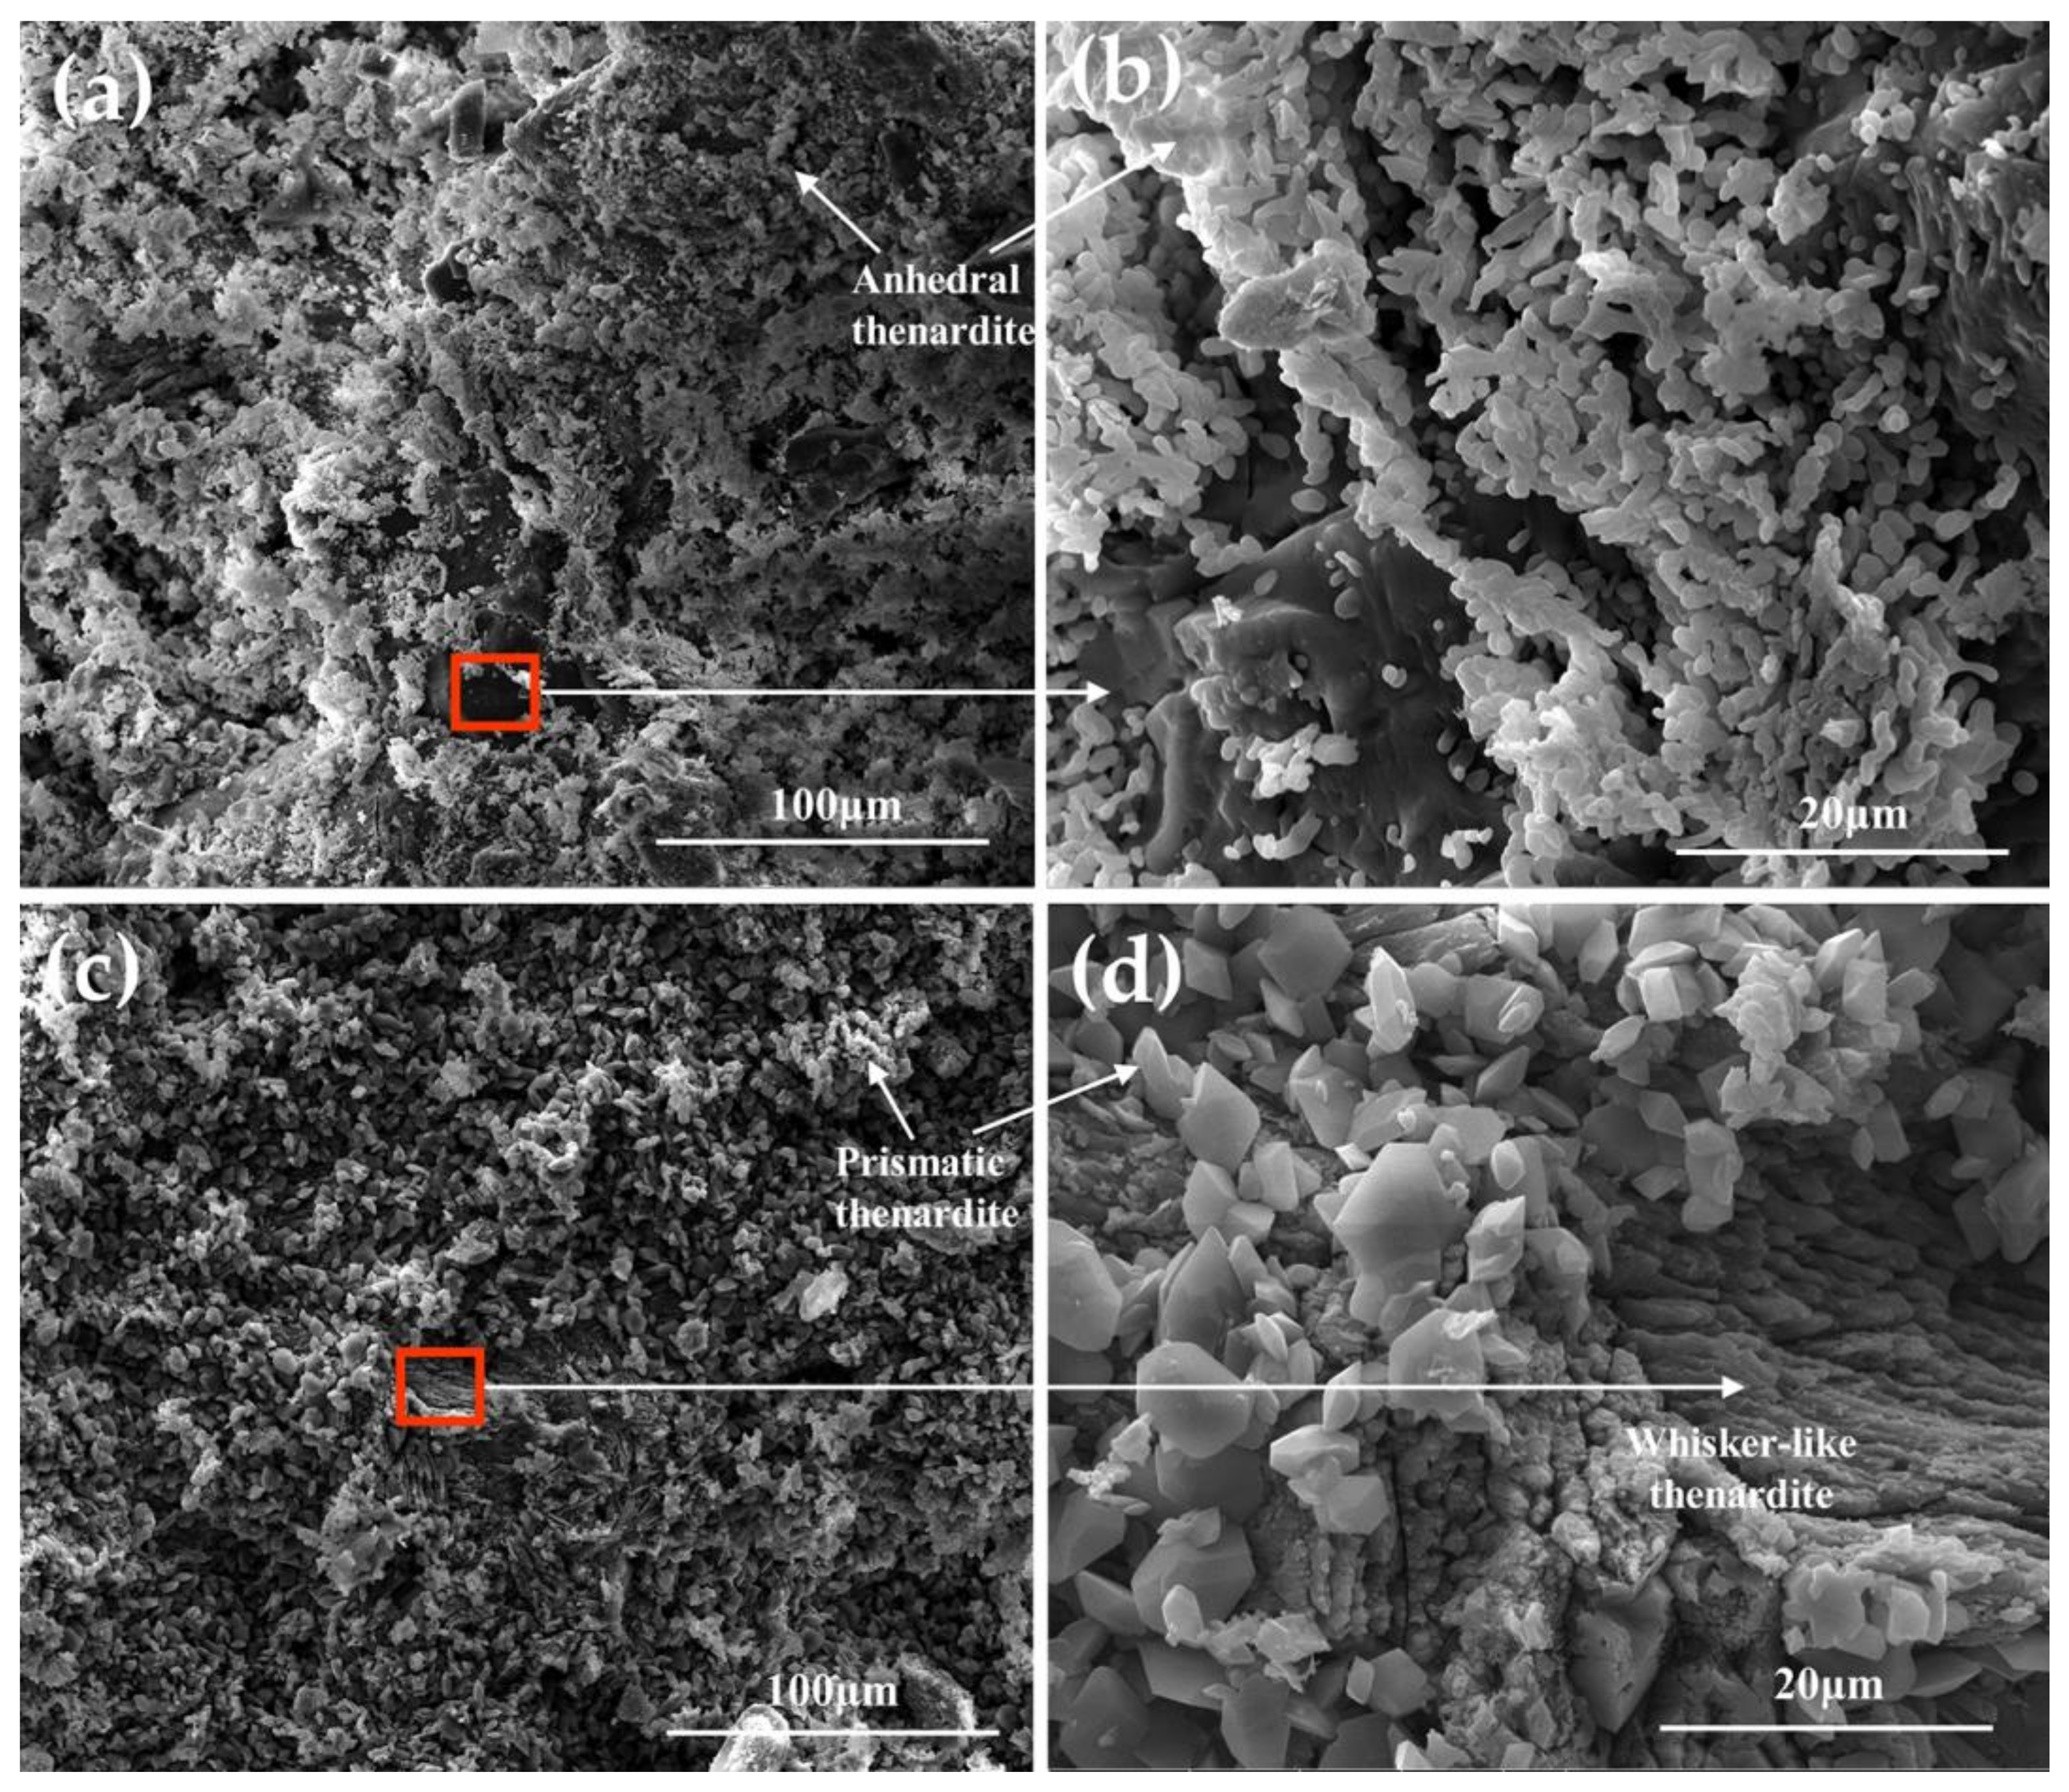
3.7.3. SEM Analysis of Sandstone after Salt Weathering

Thenardite (Na2SO4, phase V) crystals may form at low humidity, while mirabilite crystals (Na2SO4.10H2O) may form at high humidity [46,47]. Because the sodium sulfate on the tested sandstone surface is in a stable atmospheric environment (humidity below 55% and temperature below 25 °C), it should be a stable thenardite [48]. According to the XRD results (Figure S6), the characteristic diffraction peaks of mirabilite at 48.7°, 33.8°, 32°, and 19° appeared on the surface of the sandstone after salt weathering, indicating that sodium sulfate did exist in the crystal form of thenardite.
SEM analysis of sample SiON (Figure 9a,b) revealed that there were a large number of thenardite crystals about 2.5 microns in length and 2 microns in width. These small, euhedral crystals, similar in shape and size to thenardite crystals, were observed in SEM, directly precipitated on the sandstone surface. The thenardite crystals were heavily agglomerated, but did not damage the sandstone as much.
Thenardite had two distinct morphologies on the surface of sample B72, with a distinct layered distribution. A large number of thenardite (Figure 9c,d) crystals were visible first, followed by whisker—like crystals in contact with the sandstone surface. This was most likely due to a lack of space near the sandstone’s surface for the thenardite to grow into large crystals, whereas the prismatic crystals deposited above were not constrained by space.
In sample PDMS (Figure 9e,f), dendritic thenardite crystals were observed, which is also the crystal form of thenardite under low humidity, and no dehydration characteristics were observed. At the same time, these large—sized crystals were deposited on the surface or in the pores of the sandstone and tended to develop greater crystallization pressure.
In sample Blank (Figure 9g,h), it was observed that thenardite crystals had obvious dehydration characteristics and evolved into flake—like thenardite crystals. Derluyn et al. [11,49,50] reported greater crystallization damage for thenardite crystallization than for mirabilite crystallization. In contrast to the first three kinds of thenardite crystals, which were deposited on the surface of sandstone in large quantities, these flake—like thenardite crystals were closely combined with sandstone and appeared to grow from the inside of sandstone. We also found that weathering of the sandstone occurred as layered exfoliation, which was strongly related to the laminar structure of the sandstone. Figure 9h shows that the layered exfoliation of sandstone was likely to occur inside the fragile pores, and the formation of large pores resulted in significantly different heights in different positions of the sandstone.
The morphology of sodium sulfate inside the sandstone is shown in Figures S7 and S8. The SEM images of the cross sections show that these amorphous thenardite crystals had the same morphology despite their large number and wide distribution. Unlike the large crystals that grew freely on the surface of the specimen, the fine pores inside the sandstone did not allow it to produce large—sized crystals. In addition, SEM images (Figure S8) of the interior of the sandstone 1 cm from the surface still showed considerable amounts of sodium sulfate, and although no cosmetic damage could be seen in these areas, the accumulation of sodium sulfate could predict further extension of salt damage in the future.
Despite the fact that all of the sodium sulfate on the surface of the weathered specimens was the thenardite phase, the morphology and size of the thenardite crystals varied, and these differences should be noticed. Compared with samples of SiON, PDMS and B72 were more susceptible to higher crystallization pressure. The dehydration characteristics of thenardite on the surface of sample Blank were obvious because of its small molar volume.

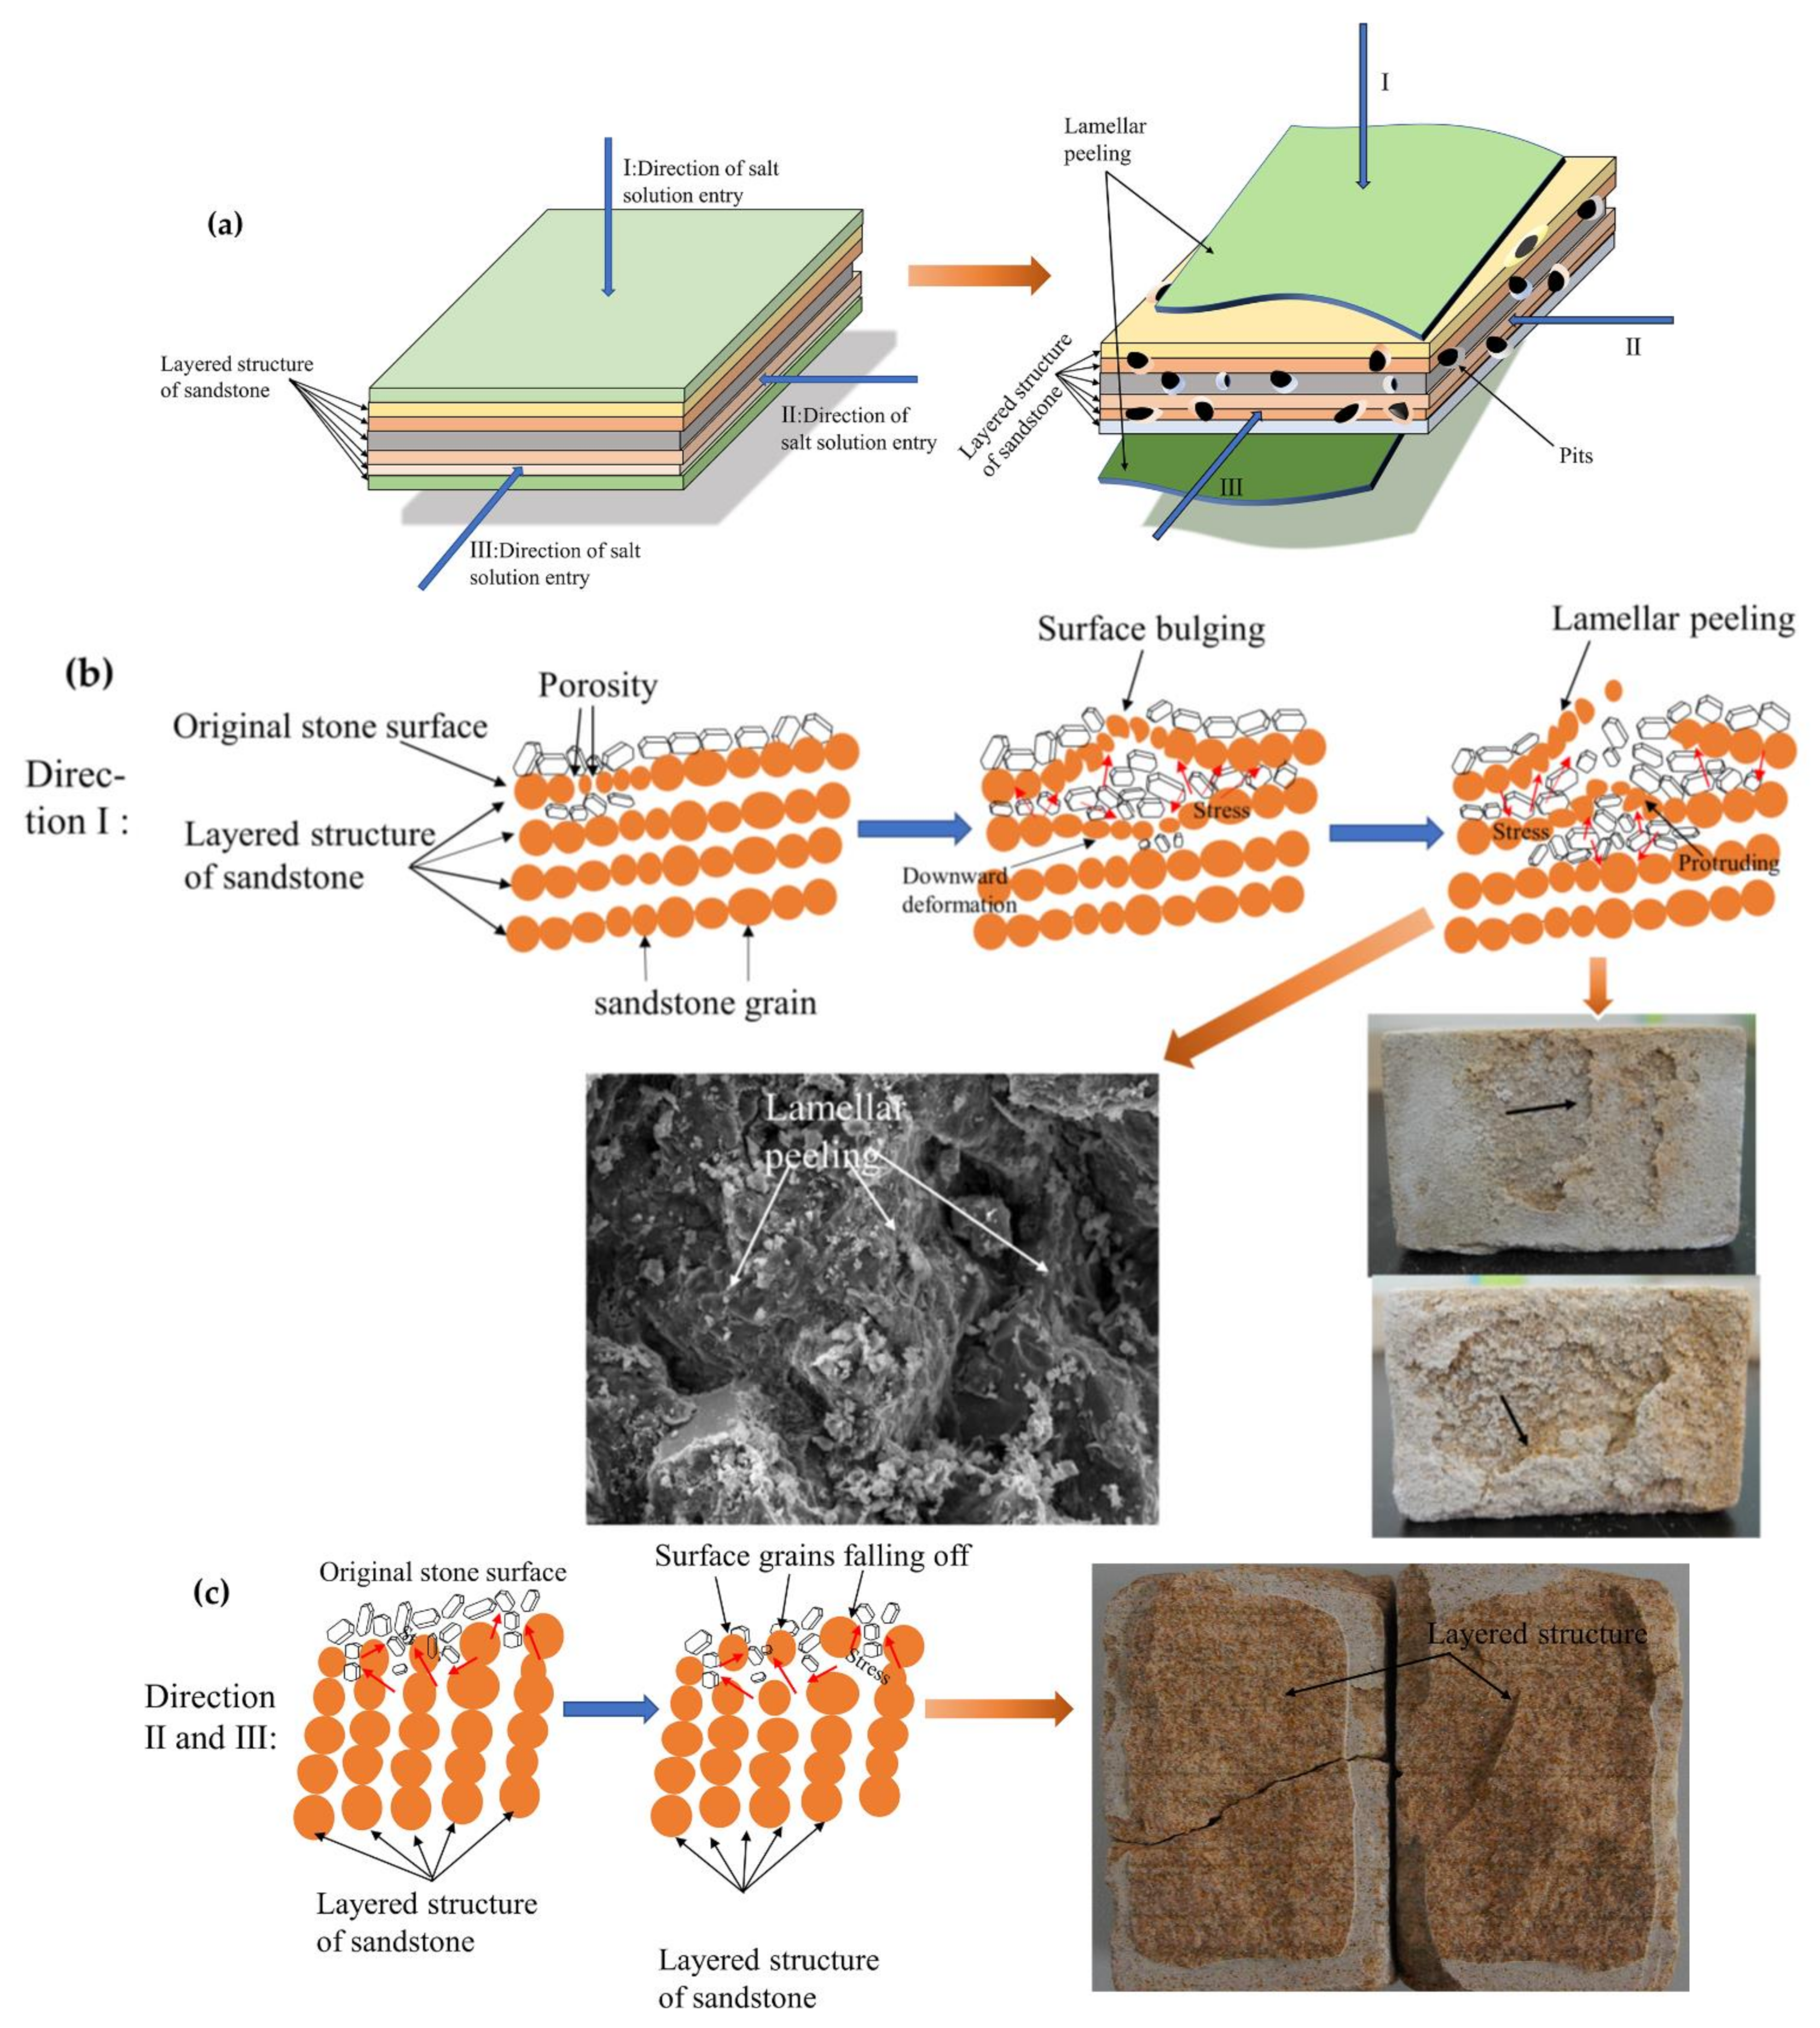
3.7.4. Analysis of Sandstone Laminar Exfoliation

The anisotropy of sandstone with well−developed bedding is extremely obvious, and the existence of bedding has a significant weakening effect on the mechanical properties of the rock. Sandstone is a non−homogeneous material and the crystallization pressure of the crystals often leads to laminar exfoliation of the laminated sandstone. Through the process of dissolution and recrystallization [8], sodium sulfate crystals cause significant damage to the porous material. Combining the crystallization pressure of the sodium sulfate crystals and the layered structure of the sandstone, we described this destruction process. Sodium sulfate entered the interior of the sandstone in different directions (Figure 10), and the failure forms were obviously different. When the sodium sulfate solution entered vertically in the direction of the layered structure (Figure 10b), the sandstone suffered the most serious damage in the form of flaky exfoliation. In the layered structure, the bonding force between the layers is weak, and the crystallization pressure is likely to cause the sliding between the layers to form laminar exfoliation [33,34,40]. When the salt solution entered the sandstone from other directions (Figure 10c), it was different from the type of laminar exfoliation, in that the surface of the sandstone was more inclined to produce uneven pits.

4. Conclusions

PHPS solution and commercial reference solutions (B72, PDMS) were sprayed on the sandstone surface in order to improve the stability of the sandstone’s influence on weathering. The XPS results showed that the percentage of N atoms on the surface of PHPS decreased from 22.71% to 3.38% with almost complete release, indicating a gradual conversion of the PHPS material to SiON. SiON and B72 materials were effective as protective materials because they formed a uniform and complete coating on the surface of the sandstone. The SiON−treated sandstone exhibited lower water absorption in the free water absorption test, due to better reduction of sandstone porosity. The water vapor permeability of sandstone treated with SiON and PDMS materials decreased by no more than 15%, while sandstone treated with B72 decreased by more than 20% of the acceptable threshold. The mass of the sandstone increased and then decreased during the salt weathering test, where the SiON specimen showed a small change in mass during the test with a loss rate of only 0.39%. The morphology of the densely connected anhydrous sodium sulfate crystals on the surface of all samples was different. The size of the sodium sulfate crystals on the surface of the SiON sample was smaller than that of the PDMS and B72 samples, and the crystallization pressure on the surface was the lowest. Unlike the physical interaction between rock particles and hydrophobic B72 and PDMS materials, rock particles and SiON materials could be chemically bonded for enhanced protection and performed somewhat better than these organic materials in resisting salt damage.
With the rapid development of science and technology, people’s requirements for coating materials are increasing. It is difficult to prepare a single composition material that can meet multiple needs at once, and there is still a long way to go before PHPS can truly achieve comprehensive protection. PHPS−based organic/inorganic hybrid materials can easily improve the hardness, heat resistance, air permeability, adhesion, and other properties of the material. Different PHPS/organic hybrid materials may be designed according to the characteristics of the stone to meet the protection needs of different stones. The variety of stone protection materials is not rich. SiON materials should be worthy of notice.
Rock materials’ mechanical properties and durability are primarily determined by their mineral composition and structure. The physical and chemical interactions between coating products and rock materials will affect the mineral composition, particle size, shape, distribution, pore structure, micro−cracks, and other internal properties of the rock, thereby affecting the physical and mechanical properties. Understanding and utilizing the interaction between coating products and rock materials has practical significance for improving the mechanical properties of rocks, which merits consideration.
Finally, a truly effective material necessitates long−term field observation, and we hope that future researchers will strive to improve SiON material performance, while also applying it to real−world protection.

Supplementary Materials

The following supporting information can be downloaded at: https://www.mdpi.com/article/10.3390/coatings12060748/s1, Figure S1: X-ray diffraction (XRD) spectra of pure sandstone: q = quartz; o = orthoclase; m = microcline; Figure S2: Photographs of sandstone flakes under orthogonal polarization (left) and single polarization (right); Figure S3: Diagram of vacuum device: (1) Vacuum pump, (2) Vacuum pressure gauge, (3) Water inlet, (4) Vacuum pumping tank, and (5) Samples; Figure S4: The binding mechanism between PHPS and the hydroxyl groups of the sandstone substrate is depicted in a simplified manner; Figure S5: Porosity of sandstone before and after coating with different materials; Figure S6: XRD analysis of sandstone surface particles before and after salt weathering experiments; Figure S7: Distribution of thenardite within the sandstone (near the surface): (a) sample SiON, (b) sample B72, (c) sample PDMS, and (d) sample Blank; Figure S8: Distribution of thenardite within the sandstone (1 cm from the surface): (a) sample SiON, (b) sample B72, (c) sample PDMS, (d) sample Blank, (e) sample Blank before salt weathering; Table S1: Microscopic analysis of sandstone minerals.

Author Contributions

Conceptualization, Q.L.; Data curation, H.Q.; Formal analysis, H.Q. and Y.W.; Funding acquisition, Q.L.; Investigation, H.Q.; Project administration, Y.W.; Supervision, Q.L.; Writing—Original draft, H.Q.; Writing—Review & editing, H.Q. All authors have read and agreed to the published version of the manuscript.

Funding

This work was financially supported by the Science and Technology Project of National Archives Administration of China (2021B03, 2021B04), the Construction Project in the Innovation Team of Philosophy and Social Sciences of Yunnan (No. 2021CX05), and the Open Project of the Gansu Provincial Research Center for Conservation of Dun Huang Cultural Heritage (GDW2021YB03). We are grateful to the Modern Analysis and Testing Center of Yunnan University (Donglu Campus) for providing the XPS and SEM instruments.

Institutional Review Board Statement

Not applicable.

Informed Consent Statement

Not applicable.

Data Availability Statement

Not applicable.

Acknowledgments

We thank Hui Chen, Zhenghua Zhou, and Baoyu Zhou for providing instrument support.

Conflicts of Interest

The authors declare no conflict of interest.

References

  1. Liu, Q.; Zhang, B.J. A New Method on Laboratory Evaluation of the Effectiveness of Consolidant Treatments for the Conservation of Historic Stone Buildings and Sculptures. Adv. Mater. Res. 2010, 108–111, 184–189. [Google Scholar] [CrossRef]
  2. Lettieri, M.; Masieri, M.; Morelli, A.; Pipoli, M.; Frigione, M. Oleo/hydrophobic coatings containing nano-particles for the protection of stone materials having different porosity. Coatings 2018, 8, 429. [Google Scholar] [CrossRef] [Green Version]
  3. Lo Schiavo, S.; De Leo, F.; Urzì, C. Present and Future Perspectives for Biocides and Antifouling Products for Stone−Built Cultural Heritage: Ionic Liquids as a Challenging Alternative. Appl. Sci. 2020, 10, 6568. [Google Scholar] [CrossRef]
  4. Turkington, A.V. Stone decay in the architectural environment. Geol. Soc. Am. 2005, 390, 39–49. [Google Scholar] [CrossRef]
  5. Thomas, D.S.G. Arid Zone Geomorphology: Process, form and Change in Drylands; John Wiley & Sons: Hoboken, NJ, USA, 2011. [Google Scholar]
  6. Smith, B.J.; Turkington, A. Stone Decay: Its Causes and Controls; Routledge: Abingdon, UK, 2016. [Google Scholar]
  7. Wang, Y.H.; Viles, H.; Desarnaud, J.; Yang, S.L.; Guo, Q.L. Laboratory simulation of salt weathering under moderate ageing conditions: Implications for the deterioration of sandstone heritage in temperate climates. Earth Surf. Processes Landf. 2021, 46, 1055–1066. [Google Scholar] [CrossRef]
  8. Jia, M.; Liang, J.; He, L.; Zhao, X.; Simon, S. Hydrophobic and hydrophilic SiO2−based hybrids in the protection of sandstone for anti−salt damage. J. Cult. Herit. 2019, 40, 80–91. [Google Scholar] [CrossRef]
  9. Çelik, M.Y.; Aygün, A. The effect of salt crystallization on degradation of volcanic building stones by sodium sulfates and sodium chlorides. Bull. Eng. Geol. Environ. 2018, 78, 3509–3529. [Google Scholar] [CrossRef]
  10. Manohar, S.; Bala, K.; Santhanam, M.; Menon, A. Characteristics and deterioration mechanisms in coral stones used in a historical monument in a saline environment. Constr. Build. Mater. 2020, 241, 118102. [Google Scholar] [CrossRef]
  11. Derluyn, H.; Vontobel, P.; Mannes, D.; Derome, D.; Lehmann, E.; Carmeliet, J. Saline Water Evaporation and Crystallization−Induced Deformations in Building Stone: Insights from High−Resolution Neutron Radiography. Transp. Porous Med. 2018, 128, 895–913. [Google Scholar] [CrossRef]
  12. Frigione, M.; Lettieri, M. Novel attribute of organic–inorganic hybrid coatings for protection and preservation of materials (stone and wood) belonging to cultural heritage. Coatings 2018, 8, 319. [Google Scholar] [CrossRef] [Green Version]
  13. Prabhu, K.; Subashini, B.C.; Venkatakrishnan, B.; Ramesh, A.S. Comparison of dimensional stability of die stone and die silicone: An In Vitro comparative study. J. Interdiscip. Dent. 2018, 8, 92–95. [Google Scholar] [CrossRef]
  14. Tesser, E.; Antonelli, F. Evaluation of silicone based products used in the past as today for the consolidation of venetian monumental stone surfaces. Mediterr. Archaeol. Archaeom. 2018, 18, 159–170. [Google Scholar] [CrossRef]
  15. Esposito Corcione, C.; Frigione, M. Influence of stone particles on the rheological behavior of a novel photopolymerizable siloxane−modified acrylic resin. J. Appl. Polym. Sci. 2011, 122, 942–947. [Google Scholar] [CrossRef]
  16. Negri, A.; Nervo, M.; Di Marcello, S.; Castelli, D. Consolidation and Adhesion of Pictorial Layers on a Stone Substrate. The Study Case of the Virgin with the Child from Palazzo Madama, in Turin. Coatings 2021, 11, 624. [Google Scholar] [CrossRef]
  17. Ling, H.; Maiqian, N.; Guozheng, L. Preparation and feasibility analysis of fluoropolymer to the sandstone protection. Prog. Org. Coat. 2008, 62, 206–213. [Google Scholar] [CrossRef]
  18. Ruffolo, S.A.; La Russa, M.F. Nanostructured Coatings for Stone Protection: An Overview. Front. Mater. 2019, 6, 147. [Google Scholar] [CrossRef]
  19. Zhang, H.; Liu, Q.; Liu, T.; Zhang, B. The preservation damage of hydrophobic polymer coating materials in conservation of stone relics. Prog. Org. Coat. 2013, 76, 1127–1134. [Google Scholar] [CrossRef]
  20. Liu, Q.; Zhang, B.J. Assessment of damage from organic protective coating treatments to historic stone buildings and sculptures. Appl. Mech. Mater. 2011, 44, 610–613. [Google Scholar] [CrossRef]
  21. Ershad−Langroudi, A.; Fadaei, H.; Ahmadi, K. Application of polymer coatings and nanoparticles in consolidation and hydrophobic treatment of stone monuments. Iran. Polym. J. 2018, 28, 1–19. [Google Scholar] [CrossRef]
  22. Terlikowski, W.; Gregoriou, M.; Kedzierski, M.; Sobczynska, E.; Wasilewski, K. Polymeric materials used in the preservation of historical stone buildings. Polimery 2020, 65, 289–296. [Google Scholar] [CrossRef]
  23. Xu, F.; Zeng, W.; Li, D. Recent advance in alkoxysilane−based consolidants for stone. Prog. Org. Coat. 2019, 127, 45–54. [Google Scholar] [CrossRef]
  24. Aldosari, M.A.; Darwish, S.S.; Adam, M.A.; Elmarzugi, N.A.; Ahmed, S.M. Evaluation of preventive performance of kaolin and calcium hydroxide nanocomposites in strengthening the outdoor carved limestone. Archaeol. Anthrop. Sci. 2018, 11, 3389–3405. [Google Scholar] [CrossRef] [Green Version]
  25. Della Volpe, C.; Penati, A.; Peruzzi, R.; Siboni, S.; Toniolo, L.; Colombo, C. The combined effect of roughness and heterogeneity on contact angles: The case of polymer coating for stone protection. J. Adhes. Sci. Technol. 2000, 14, 273–299. [Google Scholar] [CrossRef]
  26. Skoda, D.; Pucalikova, R.; Kuritka, I.; Kroftova, K. Paraloid B72 Nanodispersion Preparation Technology and Its Possibilities for Use in the Monument Care. Civ. Eng. J.—Staveb. Obz. 2018, 27, 31. [Google Scholar] [CrossRef]
  27. Baalousha, M.; Yang, Y.; Vance, M.E.; Colman, B.P.; McNeal, S.; Xu, J.; Blaszczak, J.; Steele, M.; Bernhardt, E.; Hochella, M.F., Jr. Outdoor urban nanomaterials: The emergence of a new, integrated, and critical field of study. Sci. Total Environ. 2016, 557–558, 740–753. [Google Scholar] [CrossRef] [PubMed] [Green Version]
  28. Magrini, D.; Bartolozzi, G.; Bracci, S.; Carlesi, S.; Cucci, C.; Picollo, M. Evaluation of the efficacy and durability of the “barium hydroxide method” after 40 years. Multi−analytical survey on the Crocifissione by Beato Angelico. J. Cult. Herit. 2020, 45, 362–369. [Google Scholar] [CrossRef]
  29. Arizzi, A.; Gomez−Villalba, L.S.; Lopez−Arce, P.; Cultrone, G.; Fort, R. Lime mortar consolidation with nanostructured calcium hydroxide dispersions: The efficacy of different consolidating products for heritage conservation. Eur. J. Mineral. 2015, 27, 311–323. [Google Scholar] [CrossRef] [Green Version]
  30. Rodriguez−Navarro, C.; Vettori, I.; Ruiz−Agudo, E. Kinetics and Mechanism of Calcium Hydroxide Conversion into Calcium Alkoxides: Implications in Heritage Conservation Using Nanolimes. Langmuir 2016, 32, 5183–5194. [Google Scholar] [CrossRef]
  31. Funayama, O.; Tashiro, Y.; Kamo, A.; Okumura, M.; Isoda, T. Conversion mechanism of perhydropolysilazane into silicon nitride−based ceramics. J. Mater. Sci. 2004, 29, 4883–4888. [Google Scholar] [CrossRef]
  32. Back, H.S.; Kim, M.J.; Baek, J.J.; Kim, D.H.; Shin, G.; Choi, K.H.; Cho, J.H. Intense−pulsed−UV−converted perhydropolysilazane gate dielectrics for organic field-effect transistors and logic gates. RSC Adv. 2019, 9, 3169–3175. [Google Scholar] [CrossRef] [Green Version]
  33. Khan, S.; Ahn, H.-Y.; Han, J.S.; Ju, B.-K.; Lee, S.Y.; Jang, H.S.; Byun, J.Y.; Cho, S.-H. Luminescent silica films prepared using perhydropolysilazane and Mn-doped ZnS nanophosphors. Appl. Surf. Sci. 2020, 511, 145441. [Google Scholar] [CrossRef]
  34. Kim, J.; Jang, J.H.; Kim, J.H.; Park, K.; Jang, J.S.; Park, J.; Park, N. Inorganic Encapsulation Method Using Solution−Processible Polysilazane for Flexible Solar Cells. ACS Appl. Energy Mater. 2020, 3, 9257–9263. [Google Scholar] [CrossRef]
  35. Wang, G.; Raji, A.-R.O.; Lee, J.-H.; Tour, J.M. Conducting-Interlayer SiOx Memory Devices on Rigid and Flexible Substrates. ACS Nano 2014, 8, 1410–1418. [Google Scholar] [CrossRef] [PubMed]
  36. Wen, Y.P.; Qing, H.L.; Shu, H.; Liu, Q. Evaluating the Protective Effects of Calcium Carbonate Coating on Sandstone Cultural Heritage. Coatings 2021, 11, 1534. [Google Scholar] [CrossRef]
  37. Morlier, A.; Cros, S.; Garandet, J.-P.; Alberola, N. Thin gas−barrier silica layers from perhydropolysilazane obtained through low temperature curings: A comparative study. Thin Solid Film. 2012, 524, 62–66. [Google Scholar] [CrossRef]
  38. Zhang, Z.; Shao, Z.; Luo, Y.; An, P.; Zhang, M.; Xu, C. Hydrophobic, transparent and hard silicon oxynitride coating from perhydropolysilazane. Polym. Int. 2015, 64, 971–978. [Google Scholar] [CrossRef]
  39. Smokovych, I.; Krüger, M.; Scheffler, M. Polymer derived ceramic materials from Si, B and MoSiB filler-loaded perhydropolysilazane precursor for oxidation protection. J. Eur. Ceram. Soc. 2019, 39, 3634–3642. [Google Scholar] [CrossRef]
  40. Li, P.; Zhang, Y.; Guo, Y.; Jiang, L.; Zhang, Z.; Xu, C. Resistance Switching Behavior of a Perhydropolysilazane−Derived SiOx−Based Memristor. J. Phys. Chem. Lett. 2021, 12, 10728–10734. [Google Scholar] [CrossRef]
  41. Liu, Y.; Yang, F.W.; Zuo, G.F.; Zhang, R.X.; Wei, G.F.; Ma, Q. Protection of the surface weathering stone artworks by a chemical conversion method. Constr. Build. Mater. 2018, 182, 210–214. [Google Scholar] [CrossRef]
  42. Lettieri, M.; Masieri, M.; Frigione, M. Durability to simulated bird guano of nano−filled oleo/hydrophobic coatings for the protection of stone materials. Prog. Org. Coat. 2020, 148, 105900. [Google Scholar] [CrossRef]
  43. Bajo, J.M.; Delrieux, C.; Patow, G. Physically inspired technique for modeling wet absorbent materials. Vis. Comput. 2020, 37, 2053–2068. [Google Scholar] [CrossRef]
  44. Yu, J.; Yao, W.; Duan, K.; Liu, X.; Zhu, Y. Experimental study and discrete element method modeling of compression and permeability behaviors of weakly anisotropic sandstones. Int. J. Rock Mech. Min. Sci. 2020, 134, 104437. [Google Scholar] [CrossRef]
  45. Verri, I.; Della Torre, A.; Montenegro, G.; Onorati, A.; Duca, S.; Mora, C.A.; Radaelli, F.; Trombin, G. Development of a Digital Rock Physics workflow for the analysis of sandstones and tight rocks. J. Petrol. Sci. Eng. 2017, 156, 790–800. [Google Scholar] [CrossRef]
  46. Rodriguez-Navarro, C.; Doehne, E.; Sebastian, E. How does sodium sulfate crystallize? Implications for the decay and testing of building materials. Cem. Concr. Res. 2000, 30, 1527–1534. [Google Scholar] [CrossRef] [Green Version]
  47. Rodriguez-Navarro, C.; Doehne, E. Salt weathering: Influence of evaporation rate, supersaturation and crystallization pattern. Earth Surf. Processes Landf. 1999, 24, 191–209. [Google Scholar] [CrossRef]
  48. Linnow, K.; Zeunert, A.; Steiger, M. Investigation of sodium sulfate phase transitions in a porous material using humidity−and temperature−controlled X-ray diffraction. Anal. Chem. 2006, 78, 4683–4689. [Google Scholar] [CrossRef] [PubMed]
  49. Xie, F.; Li, J.; Zhao, G.; Wang, C.; Wang, Y.; Zhou, P. Experimental investigations on the durability and degradation mechanism of cast-in-situ recycled aggregate concrete under chemical sulfate attack. Constr. Build. Mater. 2021, 297, 123771. [Google Scholar] [CrossRef]
  50. Cooke, R.U. Laboratory simulation of salt weathering processes in arid environments. Earth Surf. Processes 1979, 4, 347–359. [Google Scholar] [CrossRef]
Figure 1. Infrared absorption spectra of SiON solid with different pyrolysis times.
Coatings 12 00748 g001
Figure 2. X−ray photoelectron spectroscopy XPS spectra of the (a) wide−scan, (b) O (1s), (c) N (1s), and (d) Si (2p) peak transitions from PHPS coatings as a function of pyrolysis time.
Coatings 12 00748 g002
Figure 3. SEM micrographs of sandstone before and after coating with different materials: (a) sample Blank, (b) sample SiON, (c) sample B72, and (d) sample PDMS.
Coatings 12 00748 g003
Figure 4. Water vapor permeability curve of sandstone before and after coating with different materials.
Coatings 12 00748 g004
Figure 5. Contact angles of (a) sample SiON, (b) sample B72, (c) sample PDMS, and (d) sample Blank.
Coatings 12 00748 g005
Figure 6. Free water absorption of sandstone before and after coating with different materials.
Coatings 12 00748 g006
Figure 7. The mass change rate of sandstone coated with different materials after weathering cycles: (I) the first stage of salt weathering; (II) the second stage of salt weathering.
Coatings 12 00748 g007
Figure 8. The morphologies of sample SiON (a,b), sample B72 (c,d), sample PDMS (e,f), and sample Blank (g,h) before and after the salt weathering experiment.
Coatings 12 00748 g008
Figure 9. SEM micrographs of sandstone before and after coating with different materials after 13 salt crystallization cycles. (a,b) Small−sized thenardite crystals are deposited on the surface of sample SiON. (c,d) Prismatic and whisker—like crystals are sequentially deposited on the surface of sample B72. (e,f) Abundant dendritic, thenardite crystals grow on the surface of sample PDMS. (g,h) Flake—like thenardite crystals deposited on the surface of sample Blank.
Coatings 12 00748 g009aCoatings 12 00748 g009b
Figure 10. The suggested salt−damage process of the unprotected sandstone in Na2SO4 salt weathering cycles. (a) The influence of salt solution on sandstone from different directions. (b) Salt weathering destroys the layered structure of sandstone to form layered exfoliation. (c) Pits and layered structure.
Coatings 12 00748 g010
Table 1. The fraction (f) of nitrogen and oxygen atoms involved in different bonds as determined from deconvolution of XPS N (1s) and O (1S) core level spectra.
SiON’s Pyrolysis Time (h)Atomic Concentration (%)Concentration of Different Chemical States of Binding Energy N (1s) (%)
N (1S)O (1S)NSi3 (400 ev)NSi2O (400 ev)NSiO2 (402 ev)
0.522.7159.7416.775.940
1.58.2667.852.283.622.36
2.56.5768.053.581.181.81
3.55.6567.8903.342.31
4.54.1670.9303.021.14
5.53.3869.103.380
Table 2. Before and after treatment, chromaticity coordinates (L, a, and b) and global chromatic aberration data of the sandstone surface are shown.
Color DataSamplesTreatment
Without CoatingWith Coating
LSiON65.04 ± 0.4263.64 ± 0.35
B7261.81 ± 0.4357.67 ± 0.51
PDMS64.03 ± 0.6362.90 ± 0.48
aSiON7.45 ± 0.138.29 ± 0.08
B728.53 ± 0.129.61 ± 0.15
PDMS7.54 ± 0.177.85 ± 0.17
bSiON13.38 ± 0.5613.26 ± 0.51
B7213.87 ± 0.8216.34 ± 0.93
PDMS12.9 ± 0.5712.68 ± 0.46
ΔEabSiON——1.63 ± 0.40
B72——4.93 ± 0.35
PDMS——1.19 ± 0.39
Publisher’s Note: MDPI stays neutral with regard to jurisdictional claims in published maps and institutional affiliations.

