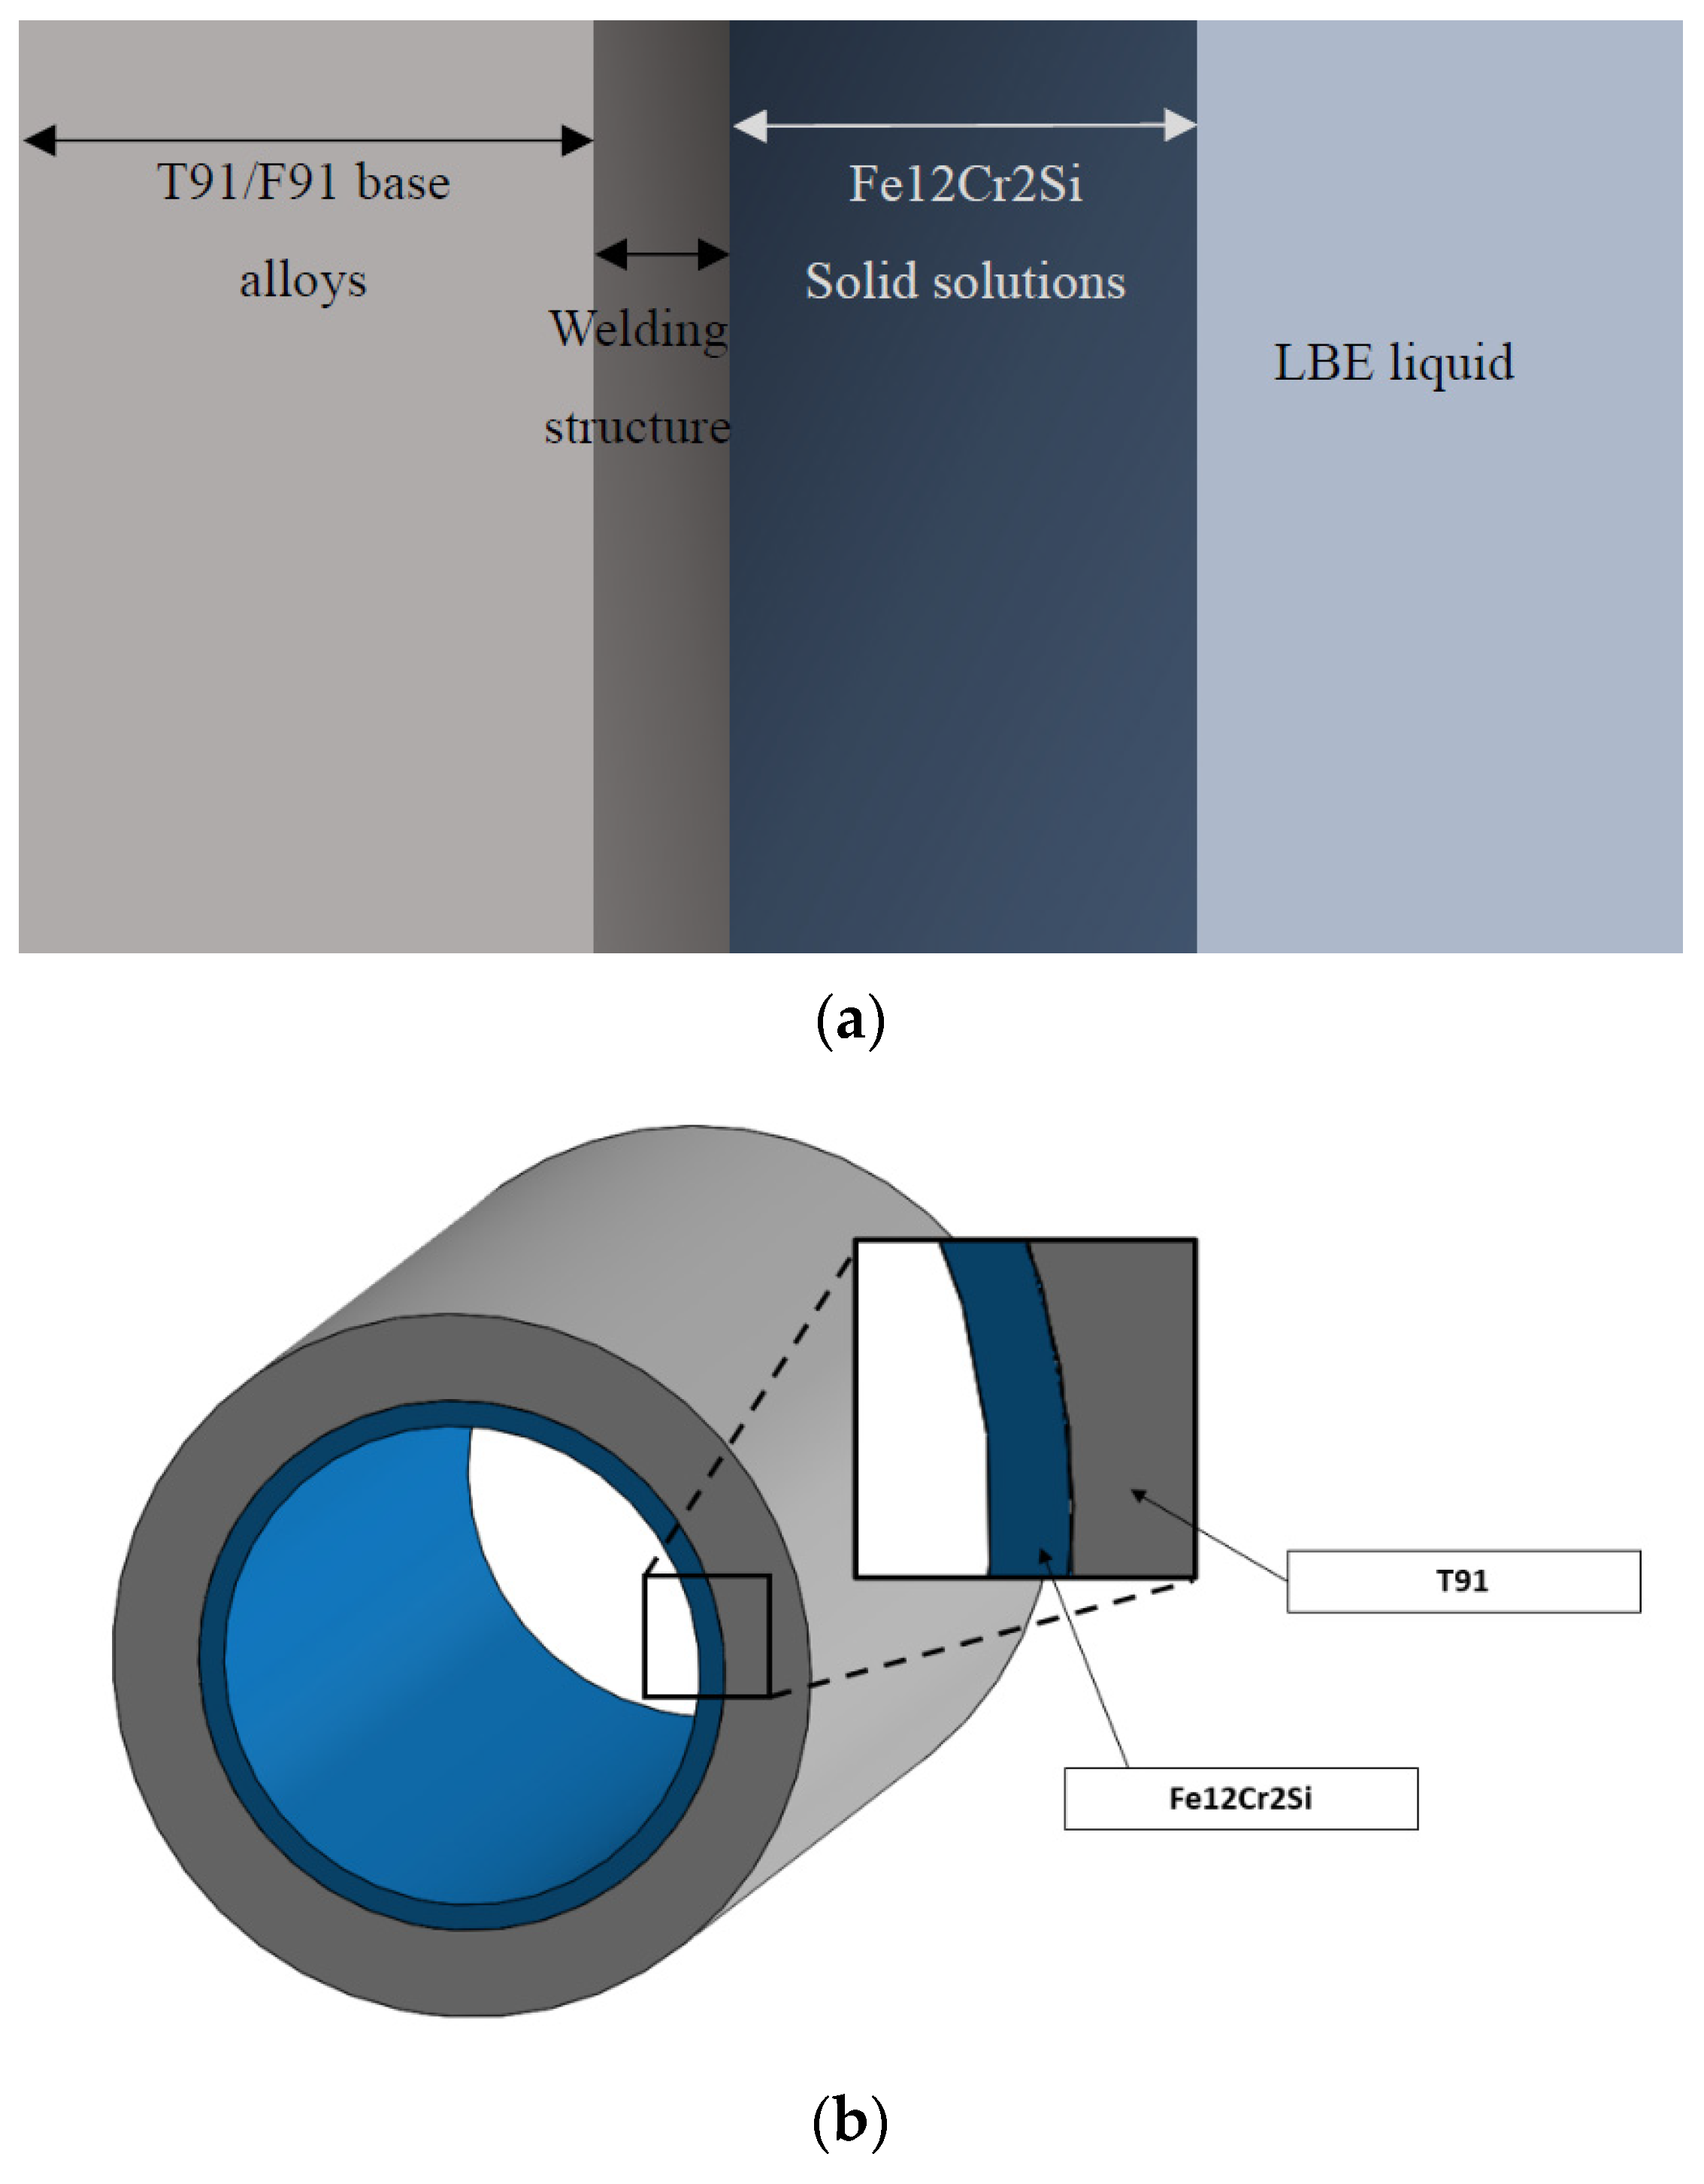
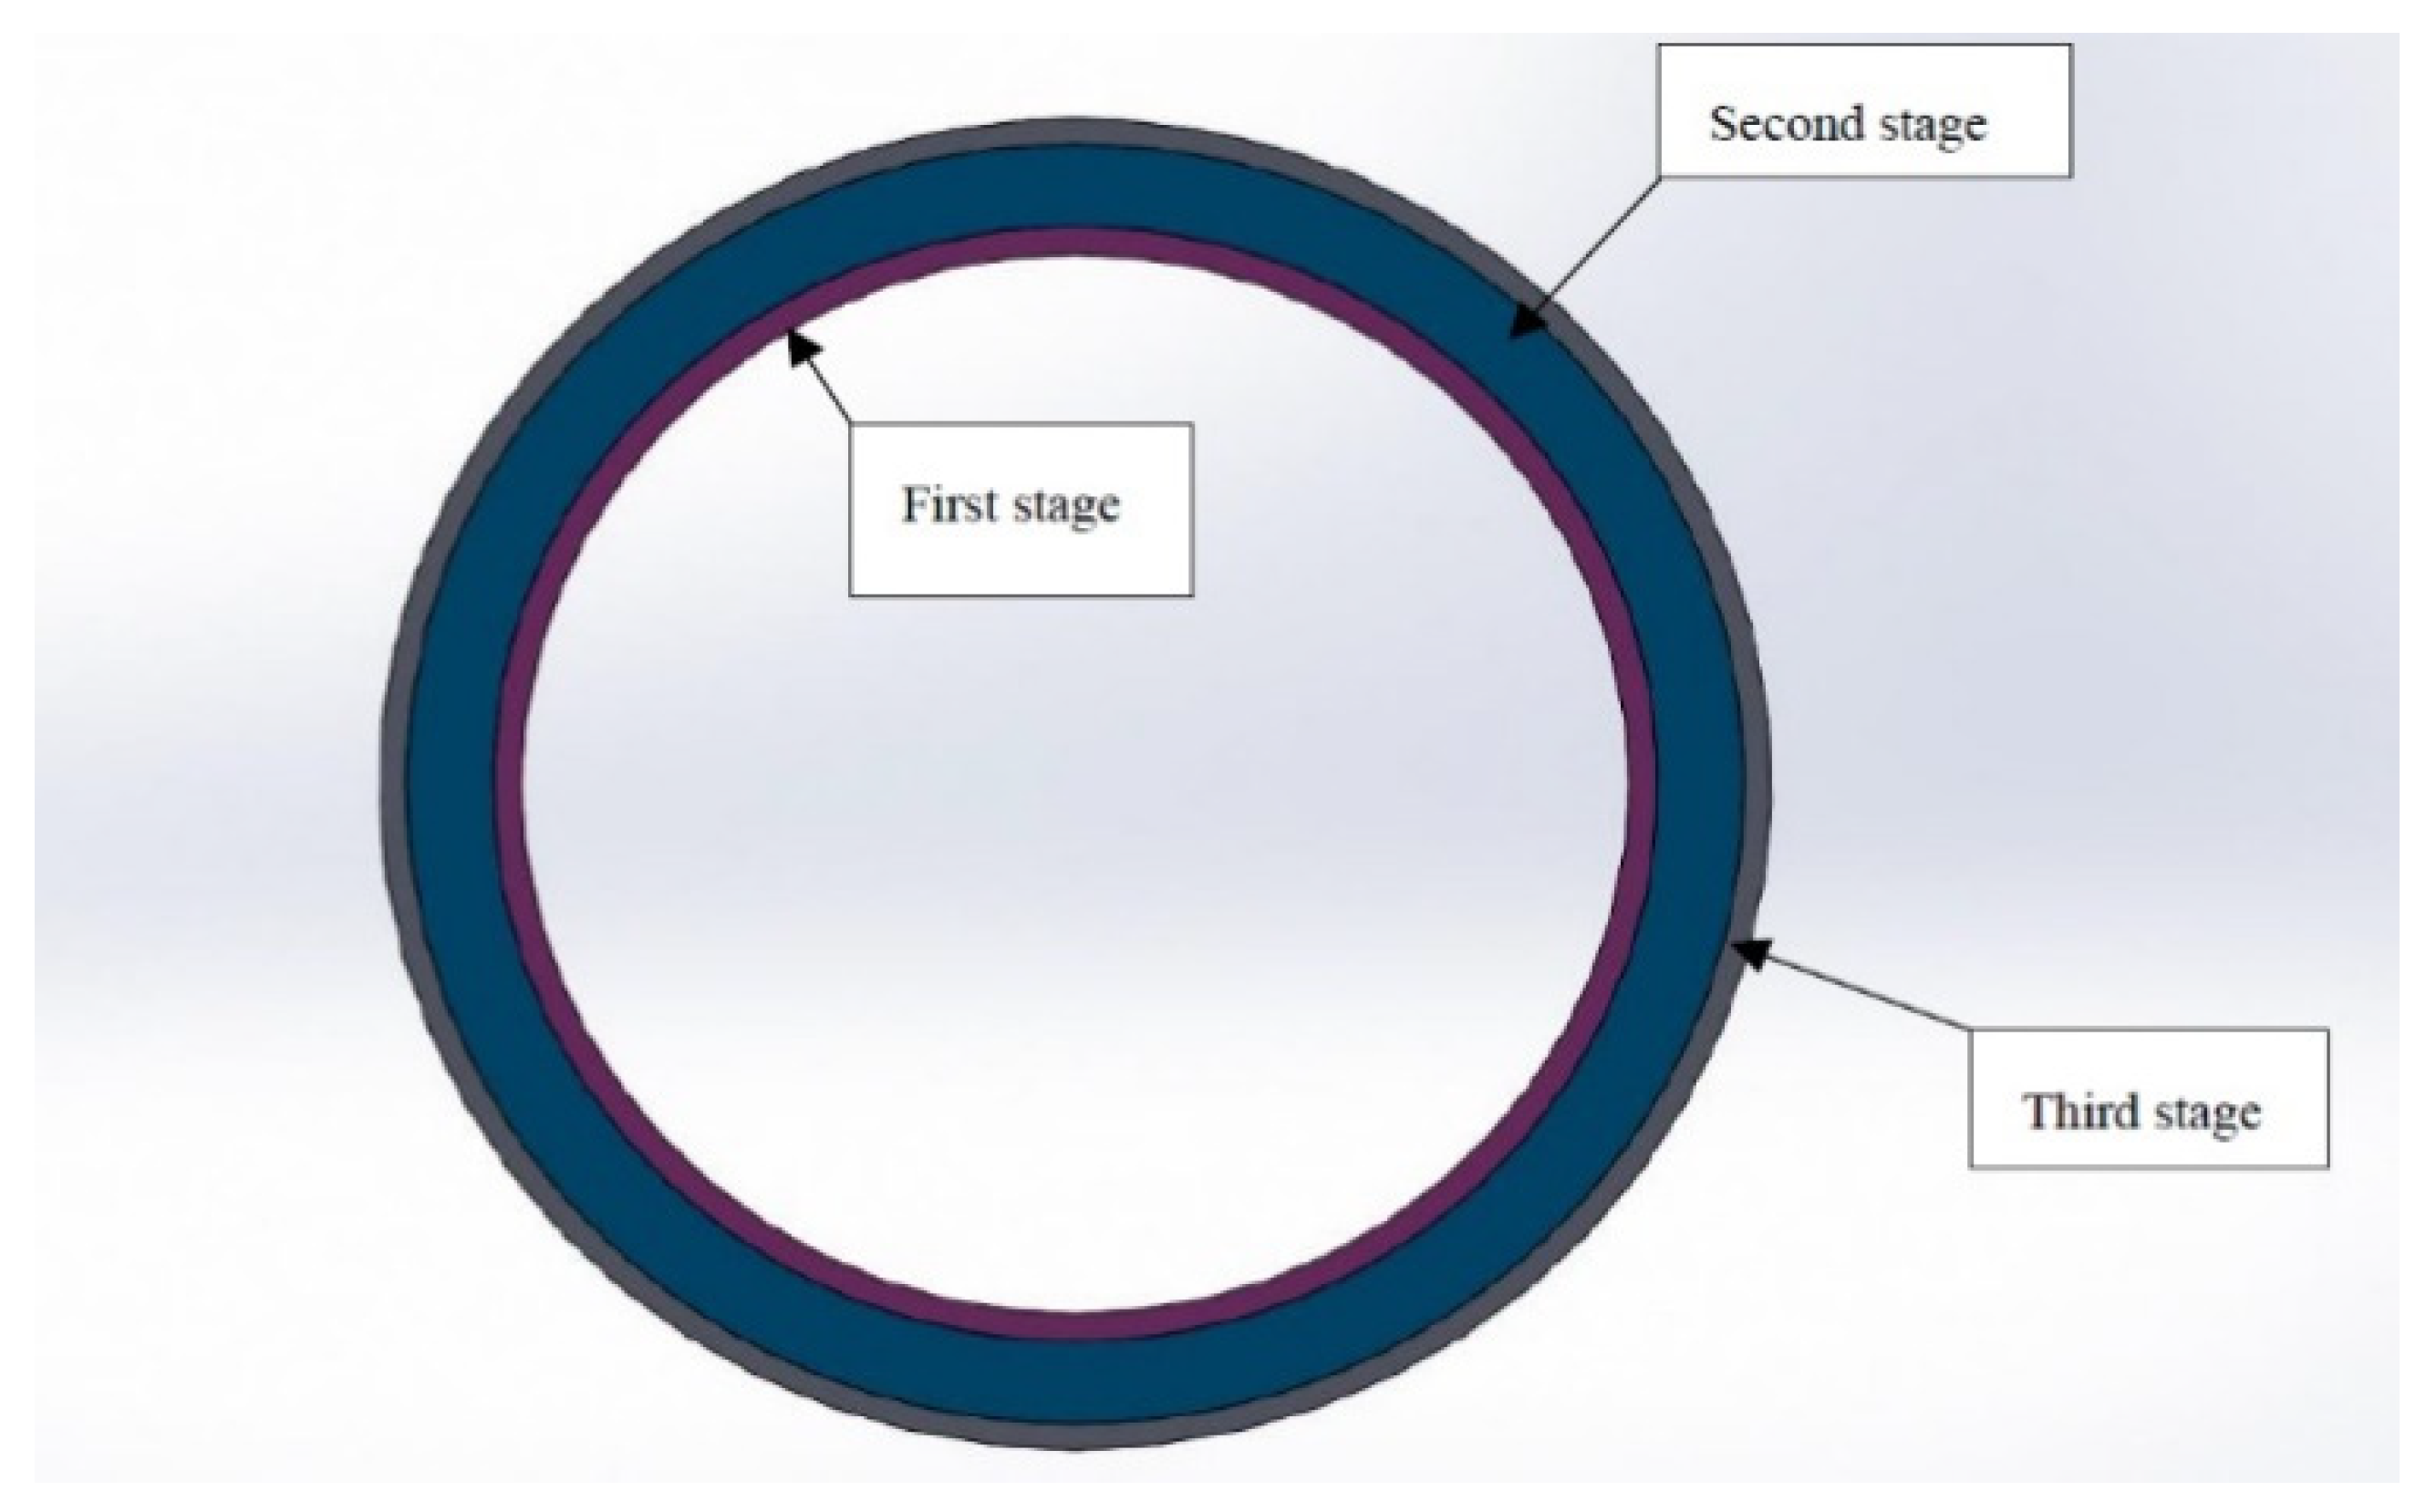
Figure 1.
(a). Nuclear reactor coolant system (b). Pipe structure.
Figure 1.
(a). Nuclear reactor coolant system (b). Pipe structure.
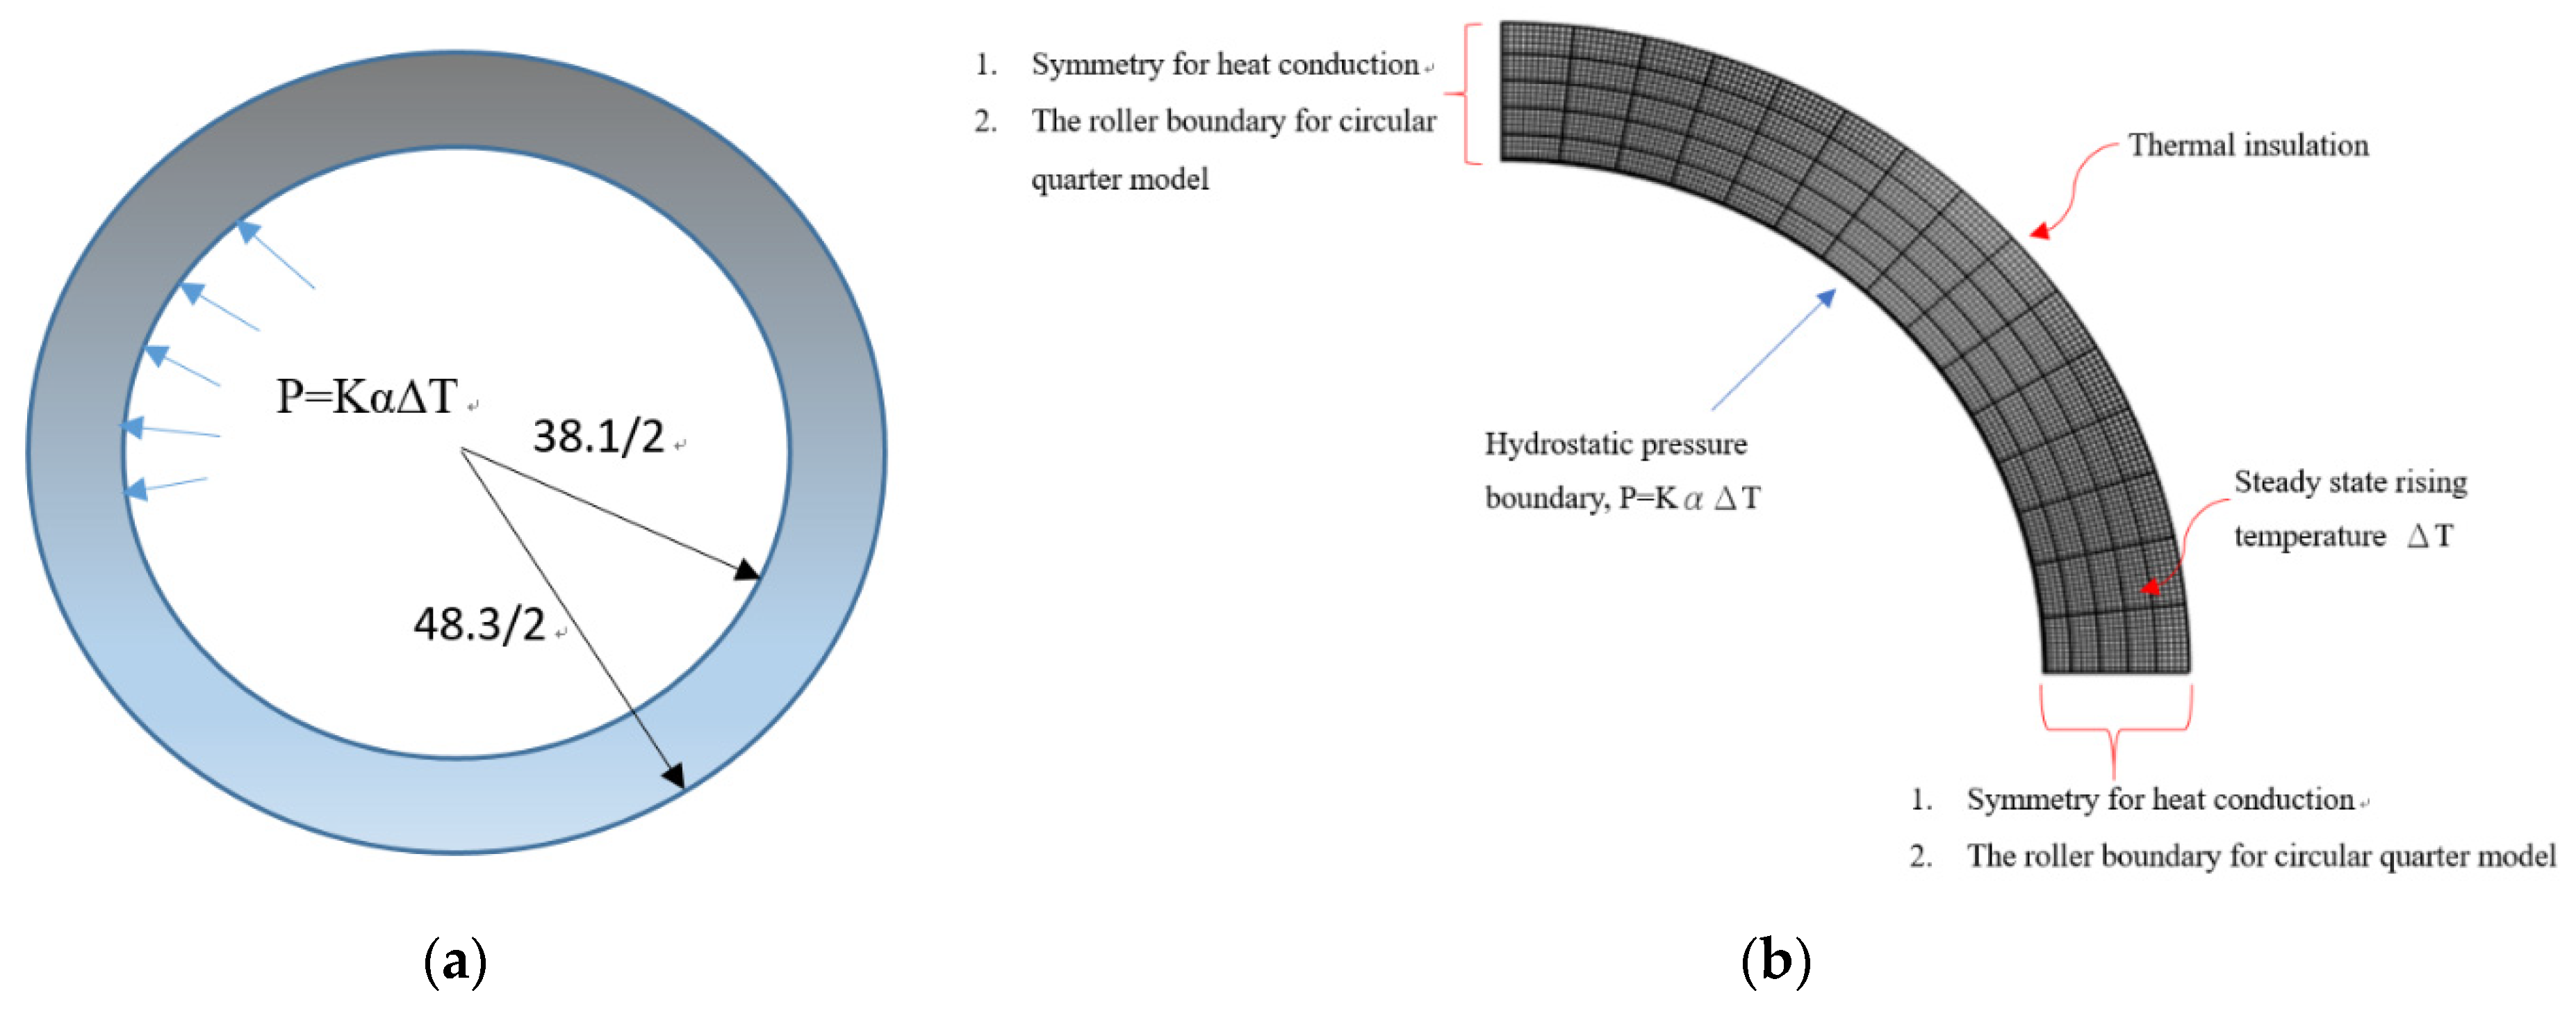
Figure 2.
(a) Schematic of 2D circular pipe with the pressure boundary condition. (b) Schematic of 2D circular quarter model in COMSOL 5.4 with the pressure and thermal boundary condition.
Figure 2.
(a) Schematic of 2D circular pipe with the pressure boundary condition. (b) Schematic of 2D circular quarter model in COMSOL 5.4 with the pressure and thermal boundary condition.
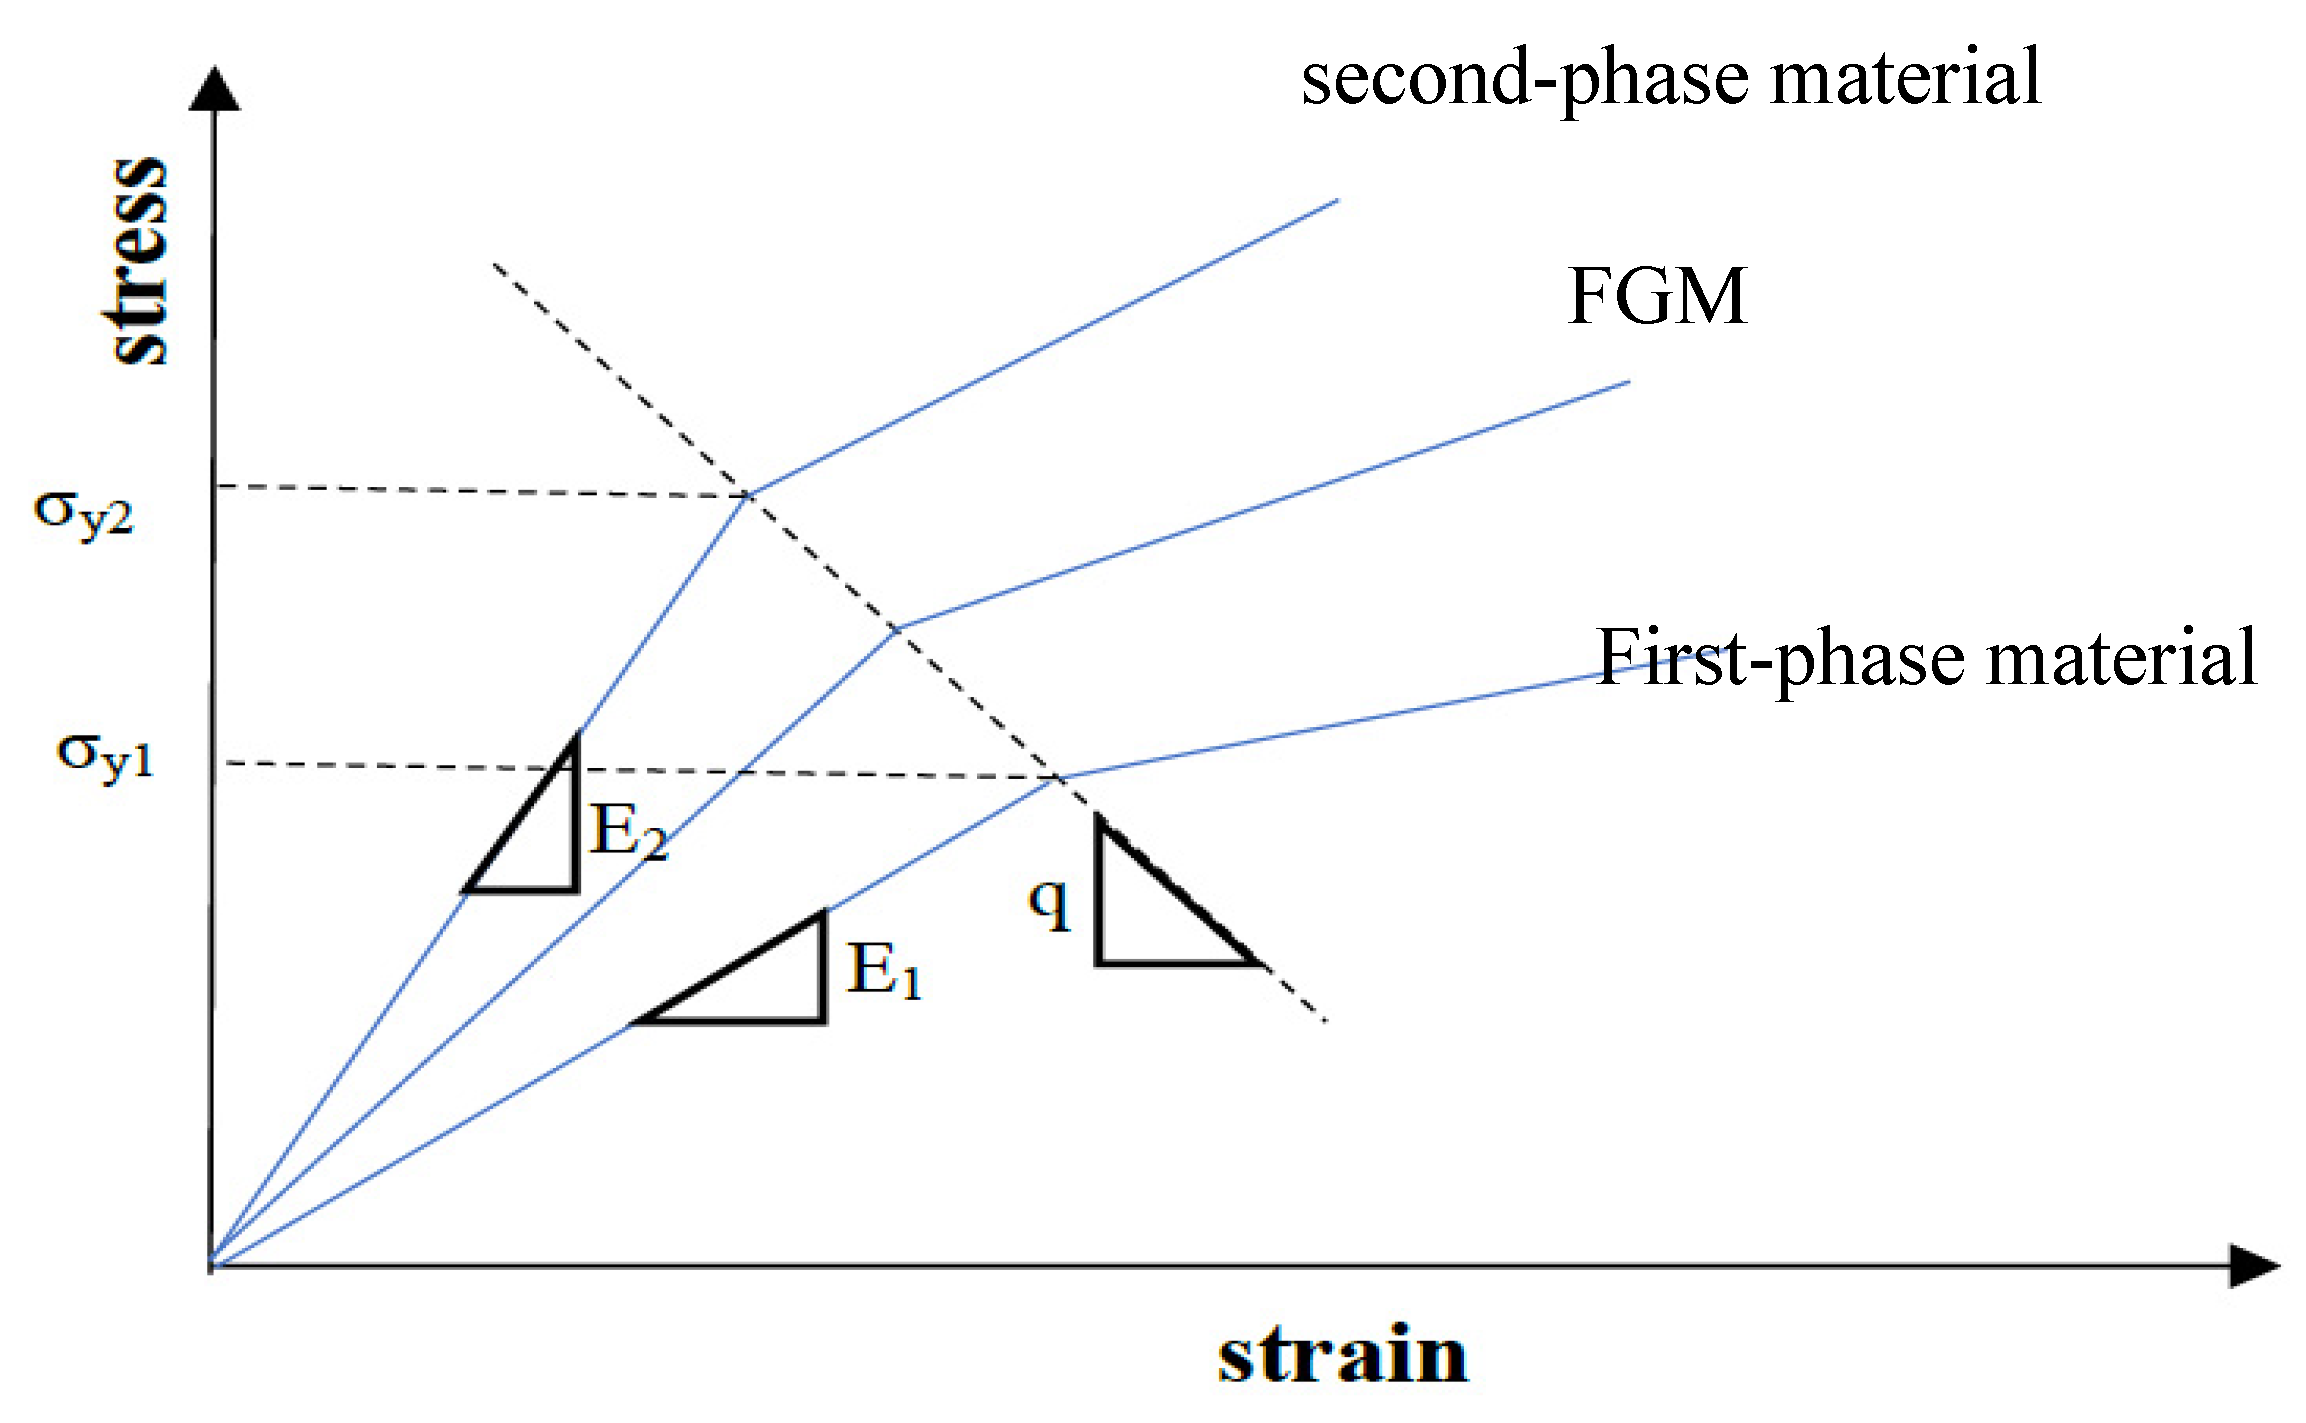
Figure 3.
The stress vs. strain curve of an arbitrary two-phase FGM (E1: First-phase material, E2: Second-phase material).
Figure 3.
The stress vs. strain curve of an arbitrary two-phase FGM (E1: First-phase material, E2: Second-phase material).
Figure 4.
Plate analysis of FGM/FGC coolant pipes.
Figure 4.
Plate analysis of FGM/FGC coolant pipes.
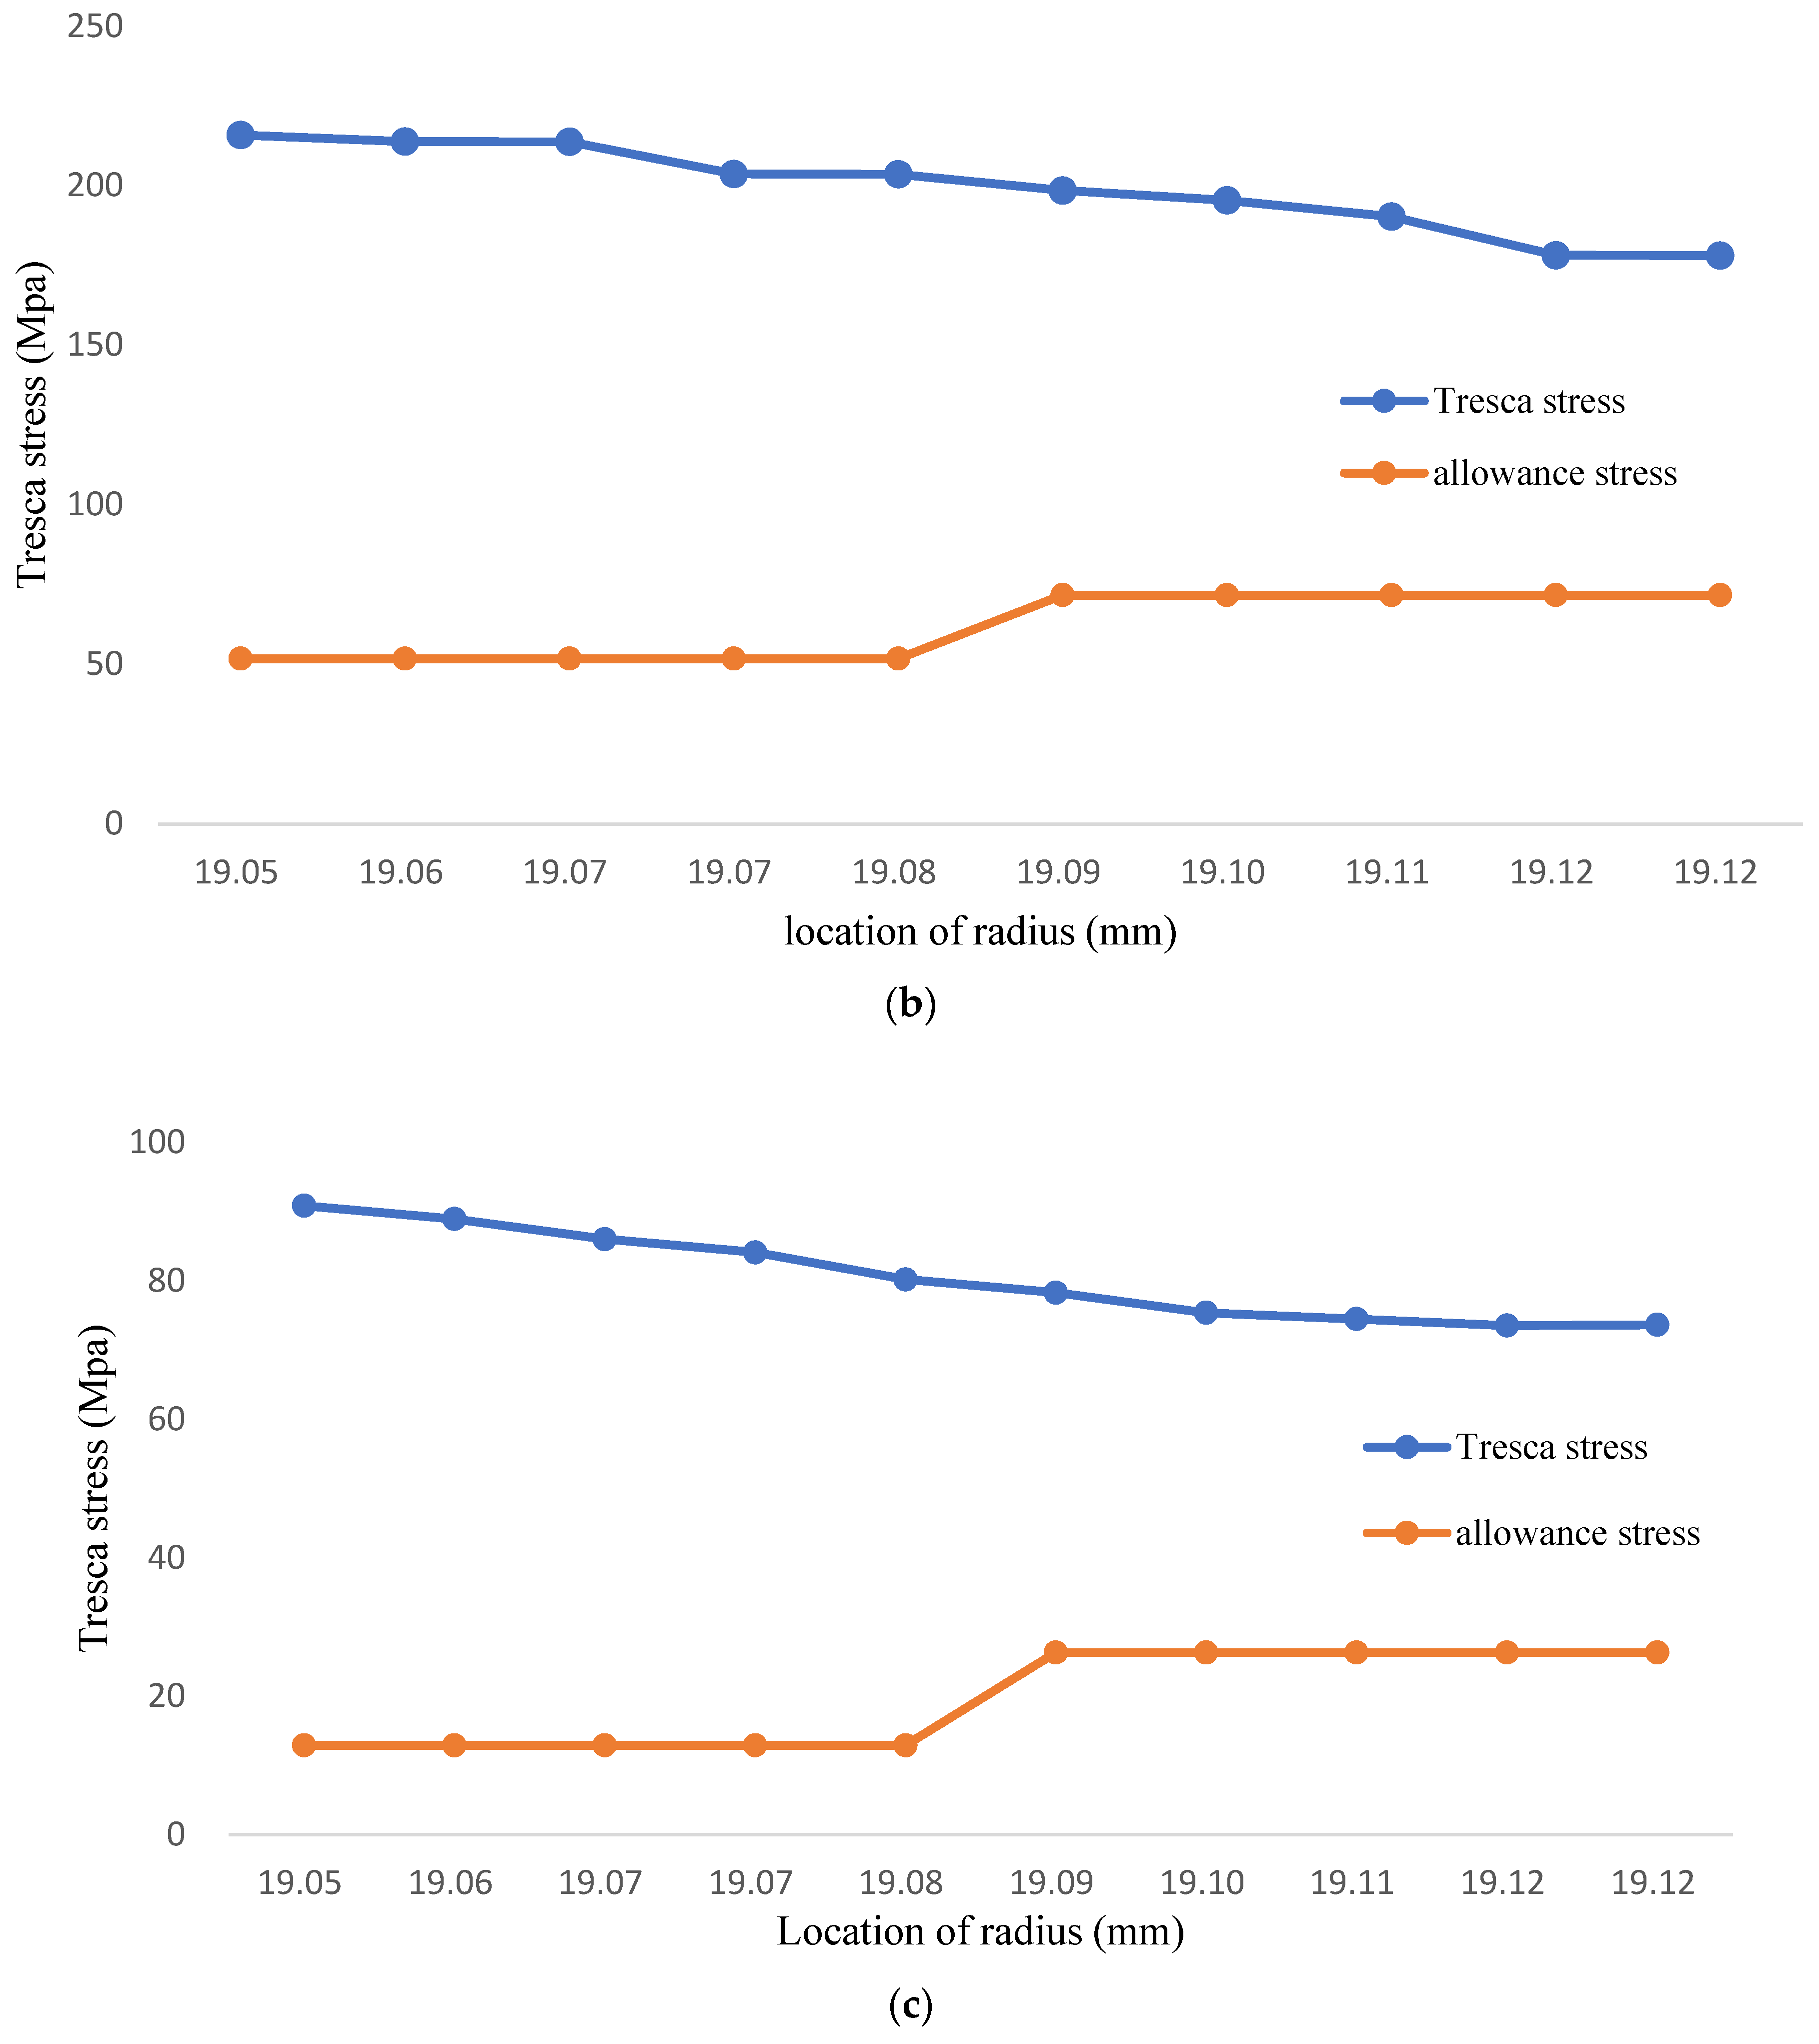
Figure 5.
(a) The Tresca stress of FGC structure (Temperature: 700 °C); (b) FGC structure Tresca stress (Temprature: 1000 °C); (c) FGC structure Tresca stress (Temprature: 1200 °C).
Figure 5.
(a) The Tresca stress of FGC structure (Temperature: 700 °C); (b) FGC structure Tresca stress (Temprature: 1000 °C); (c) FGC structure Tresca stress (Temprature: 1200 °C).
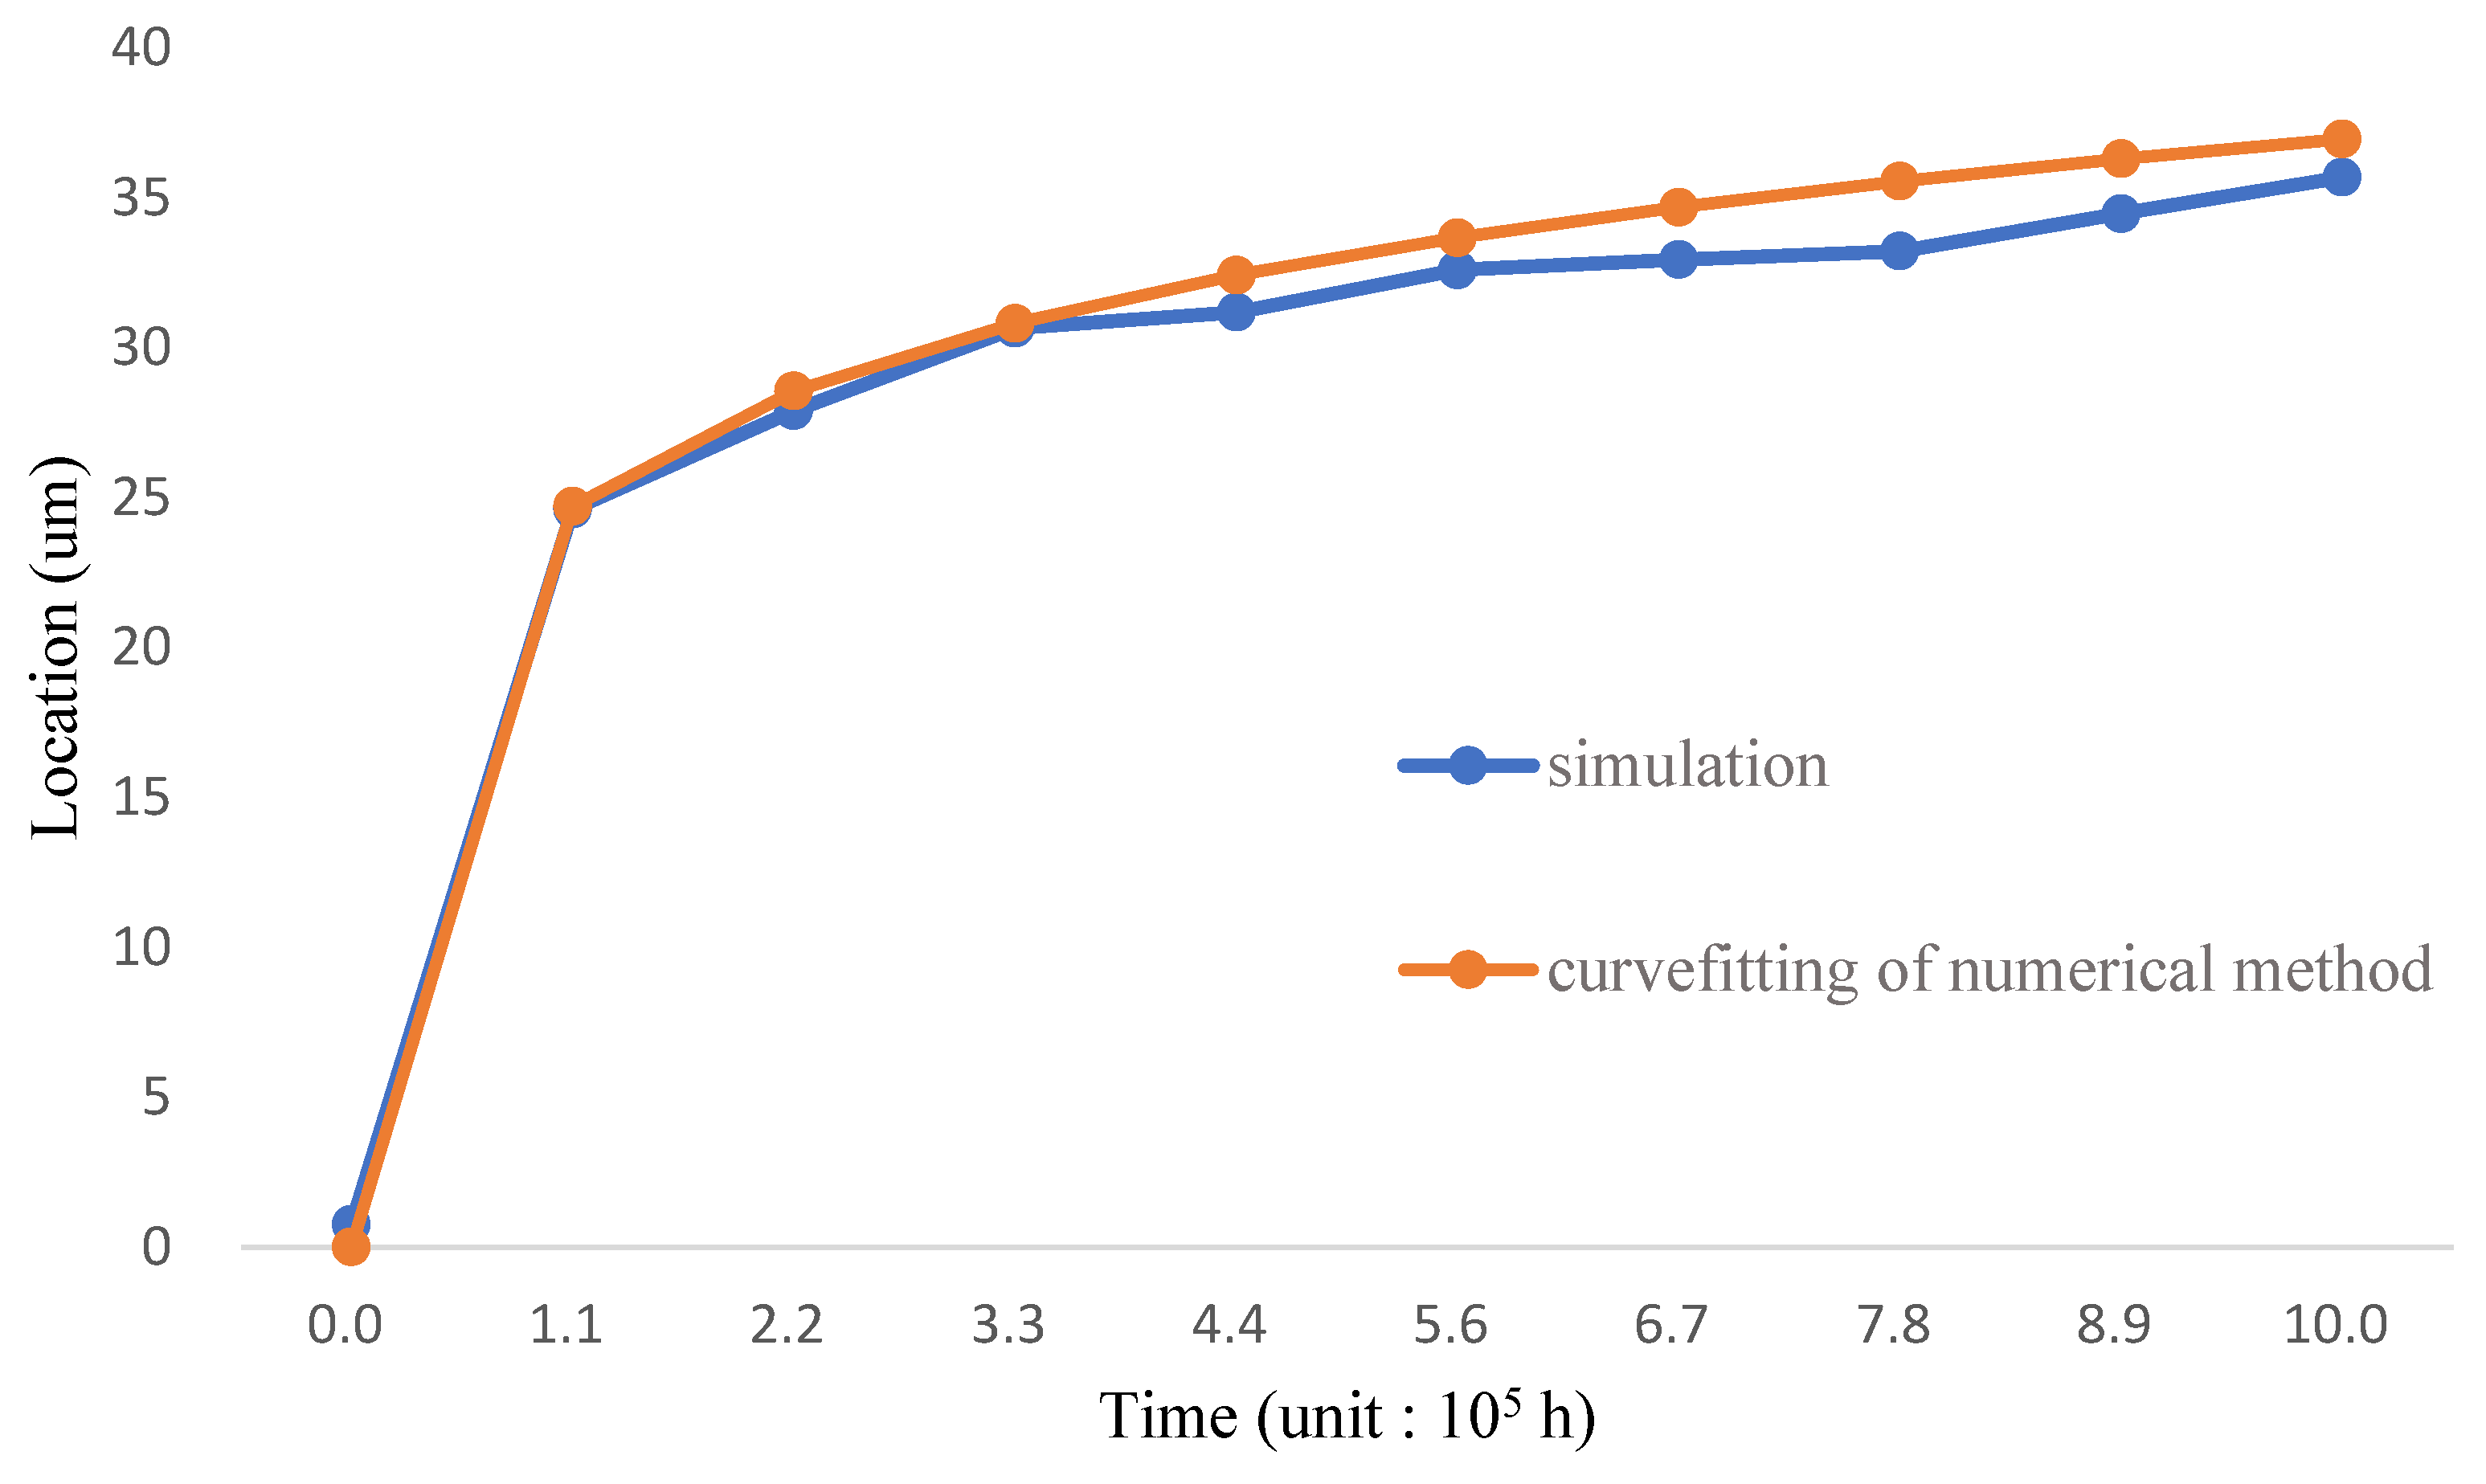
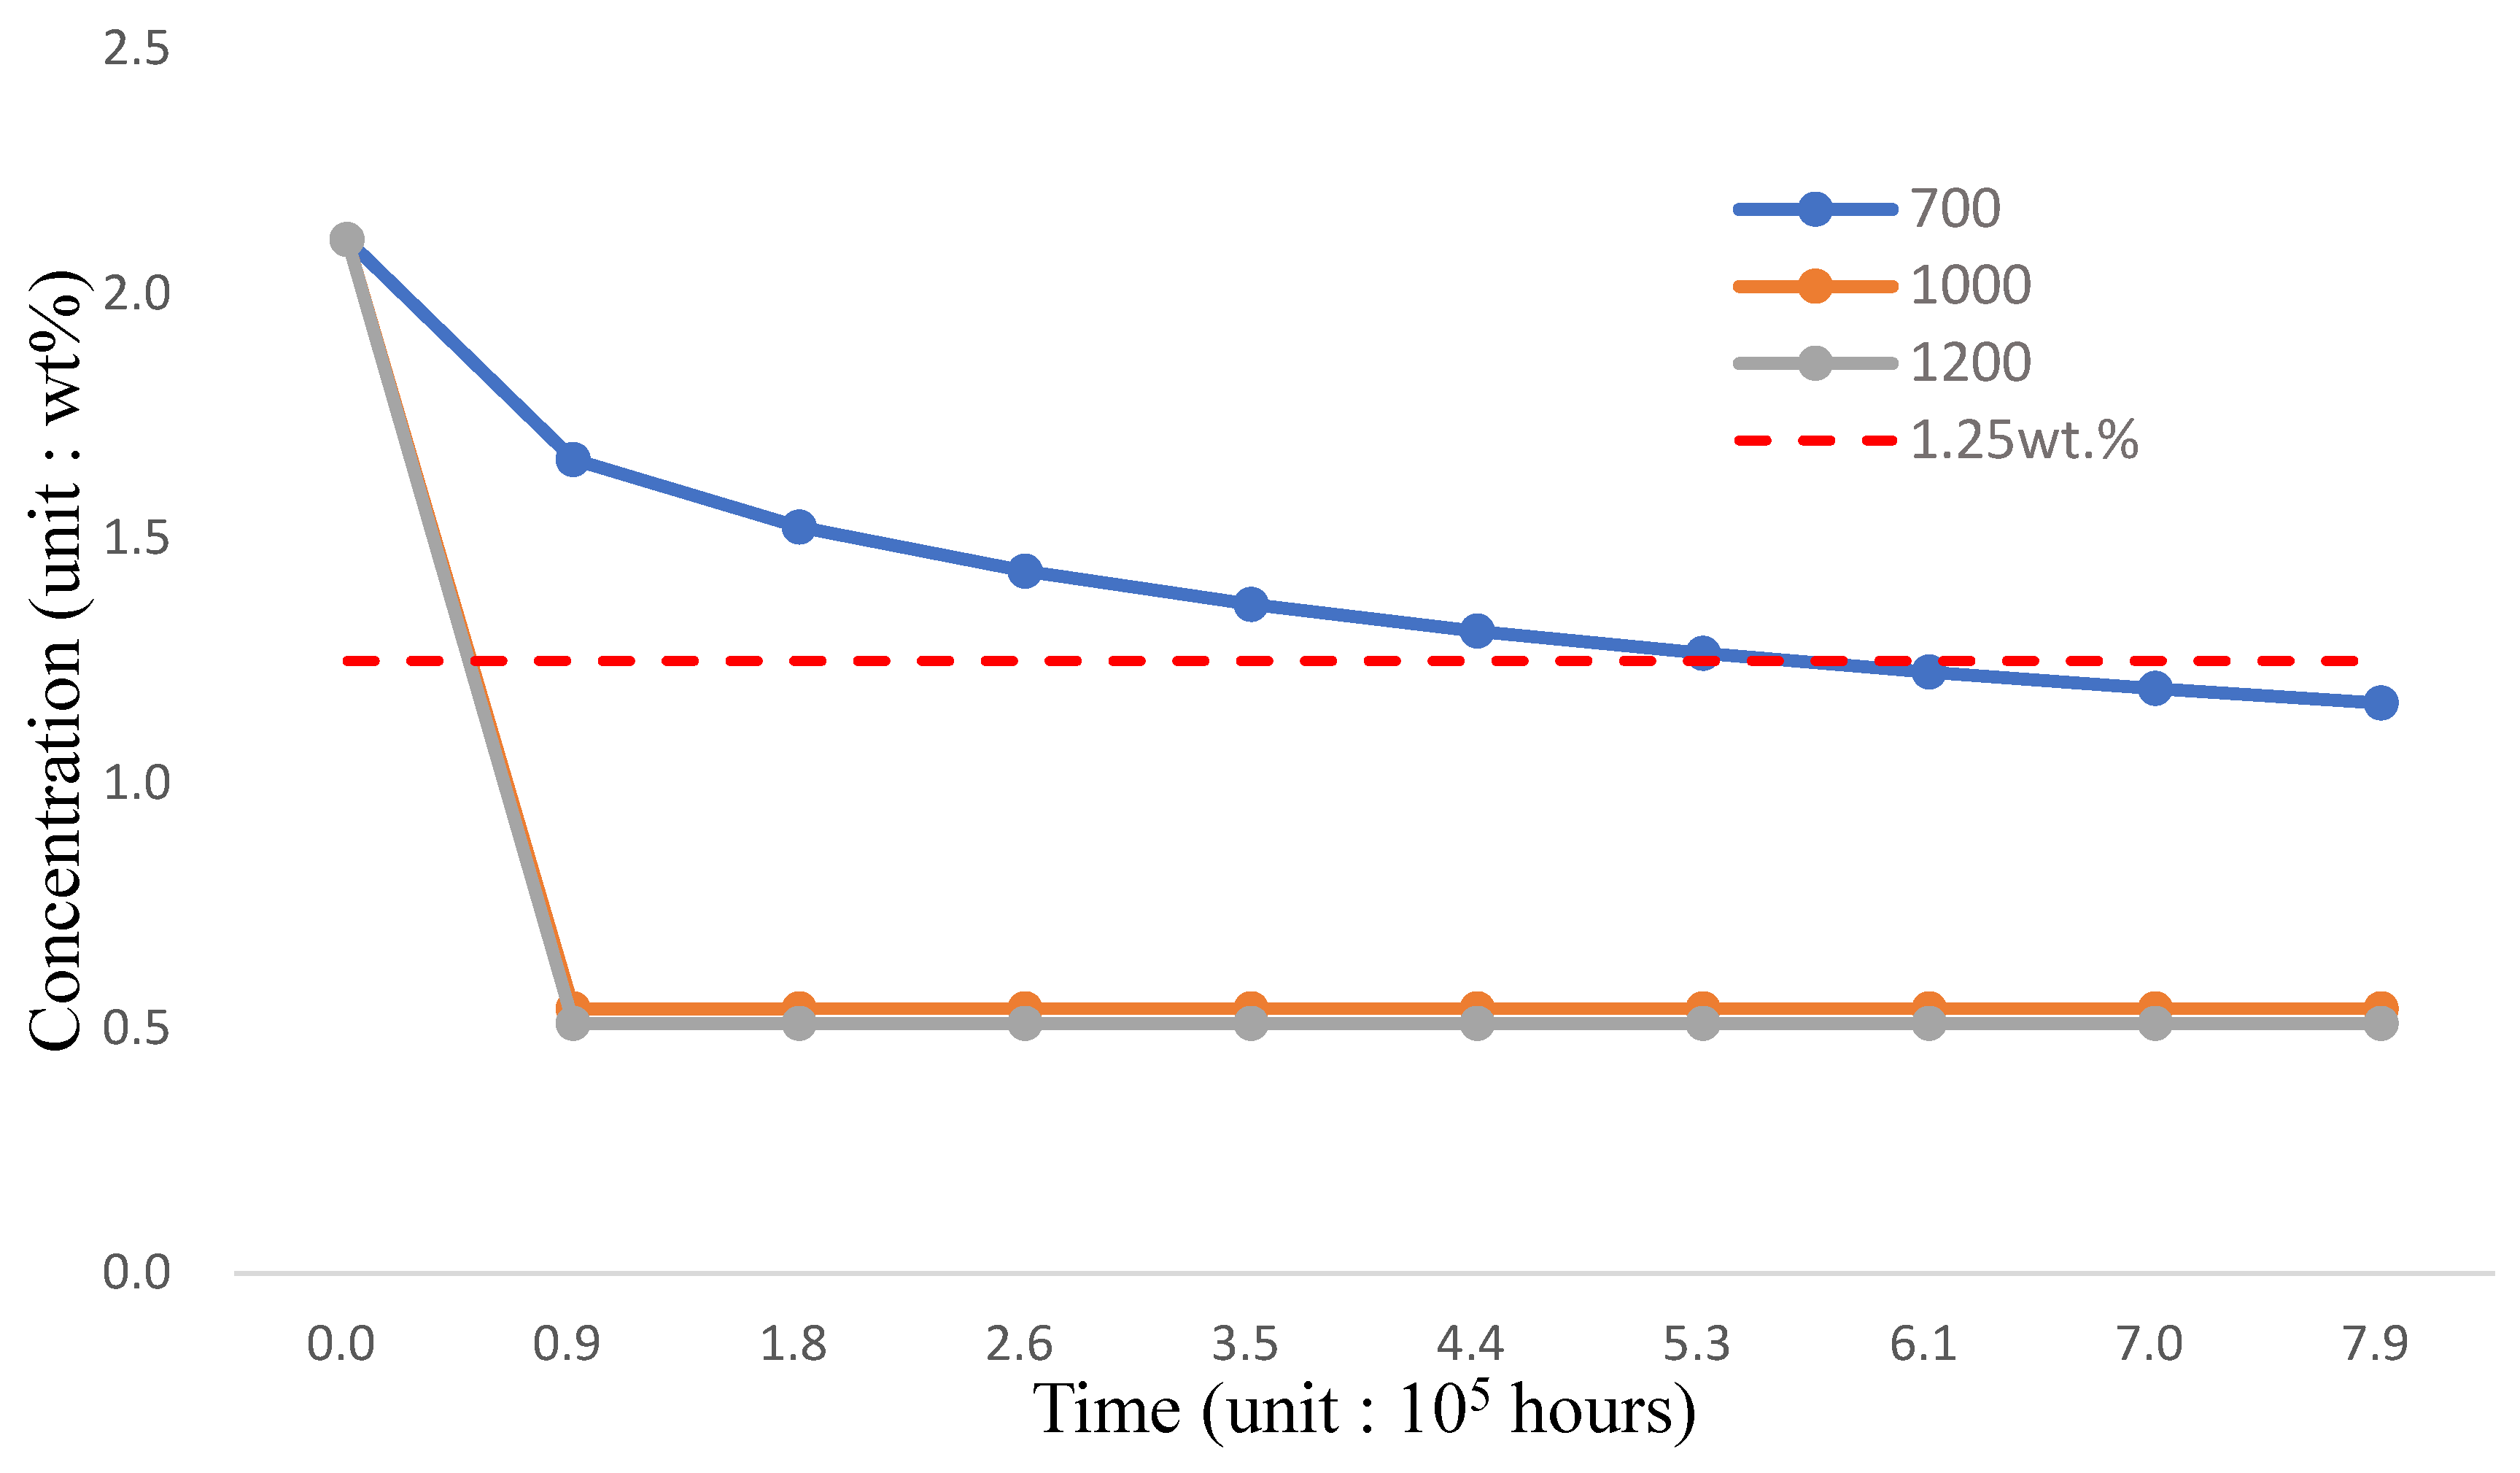
Figure 6.
The Corrosion levels as compared to FGC location of 1.25 wt.% against time distribution (Temp: 700 °C) [
7].
Figure 6.
The Corrosion levels as compared to FGC location of 1.25 wt.% against time distribution (Temp: 700 °C) [
7].
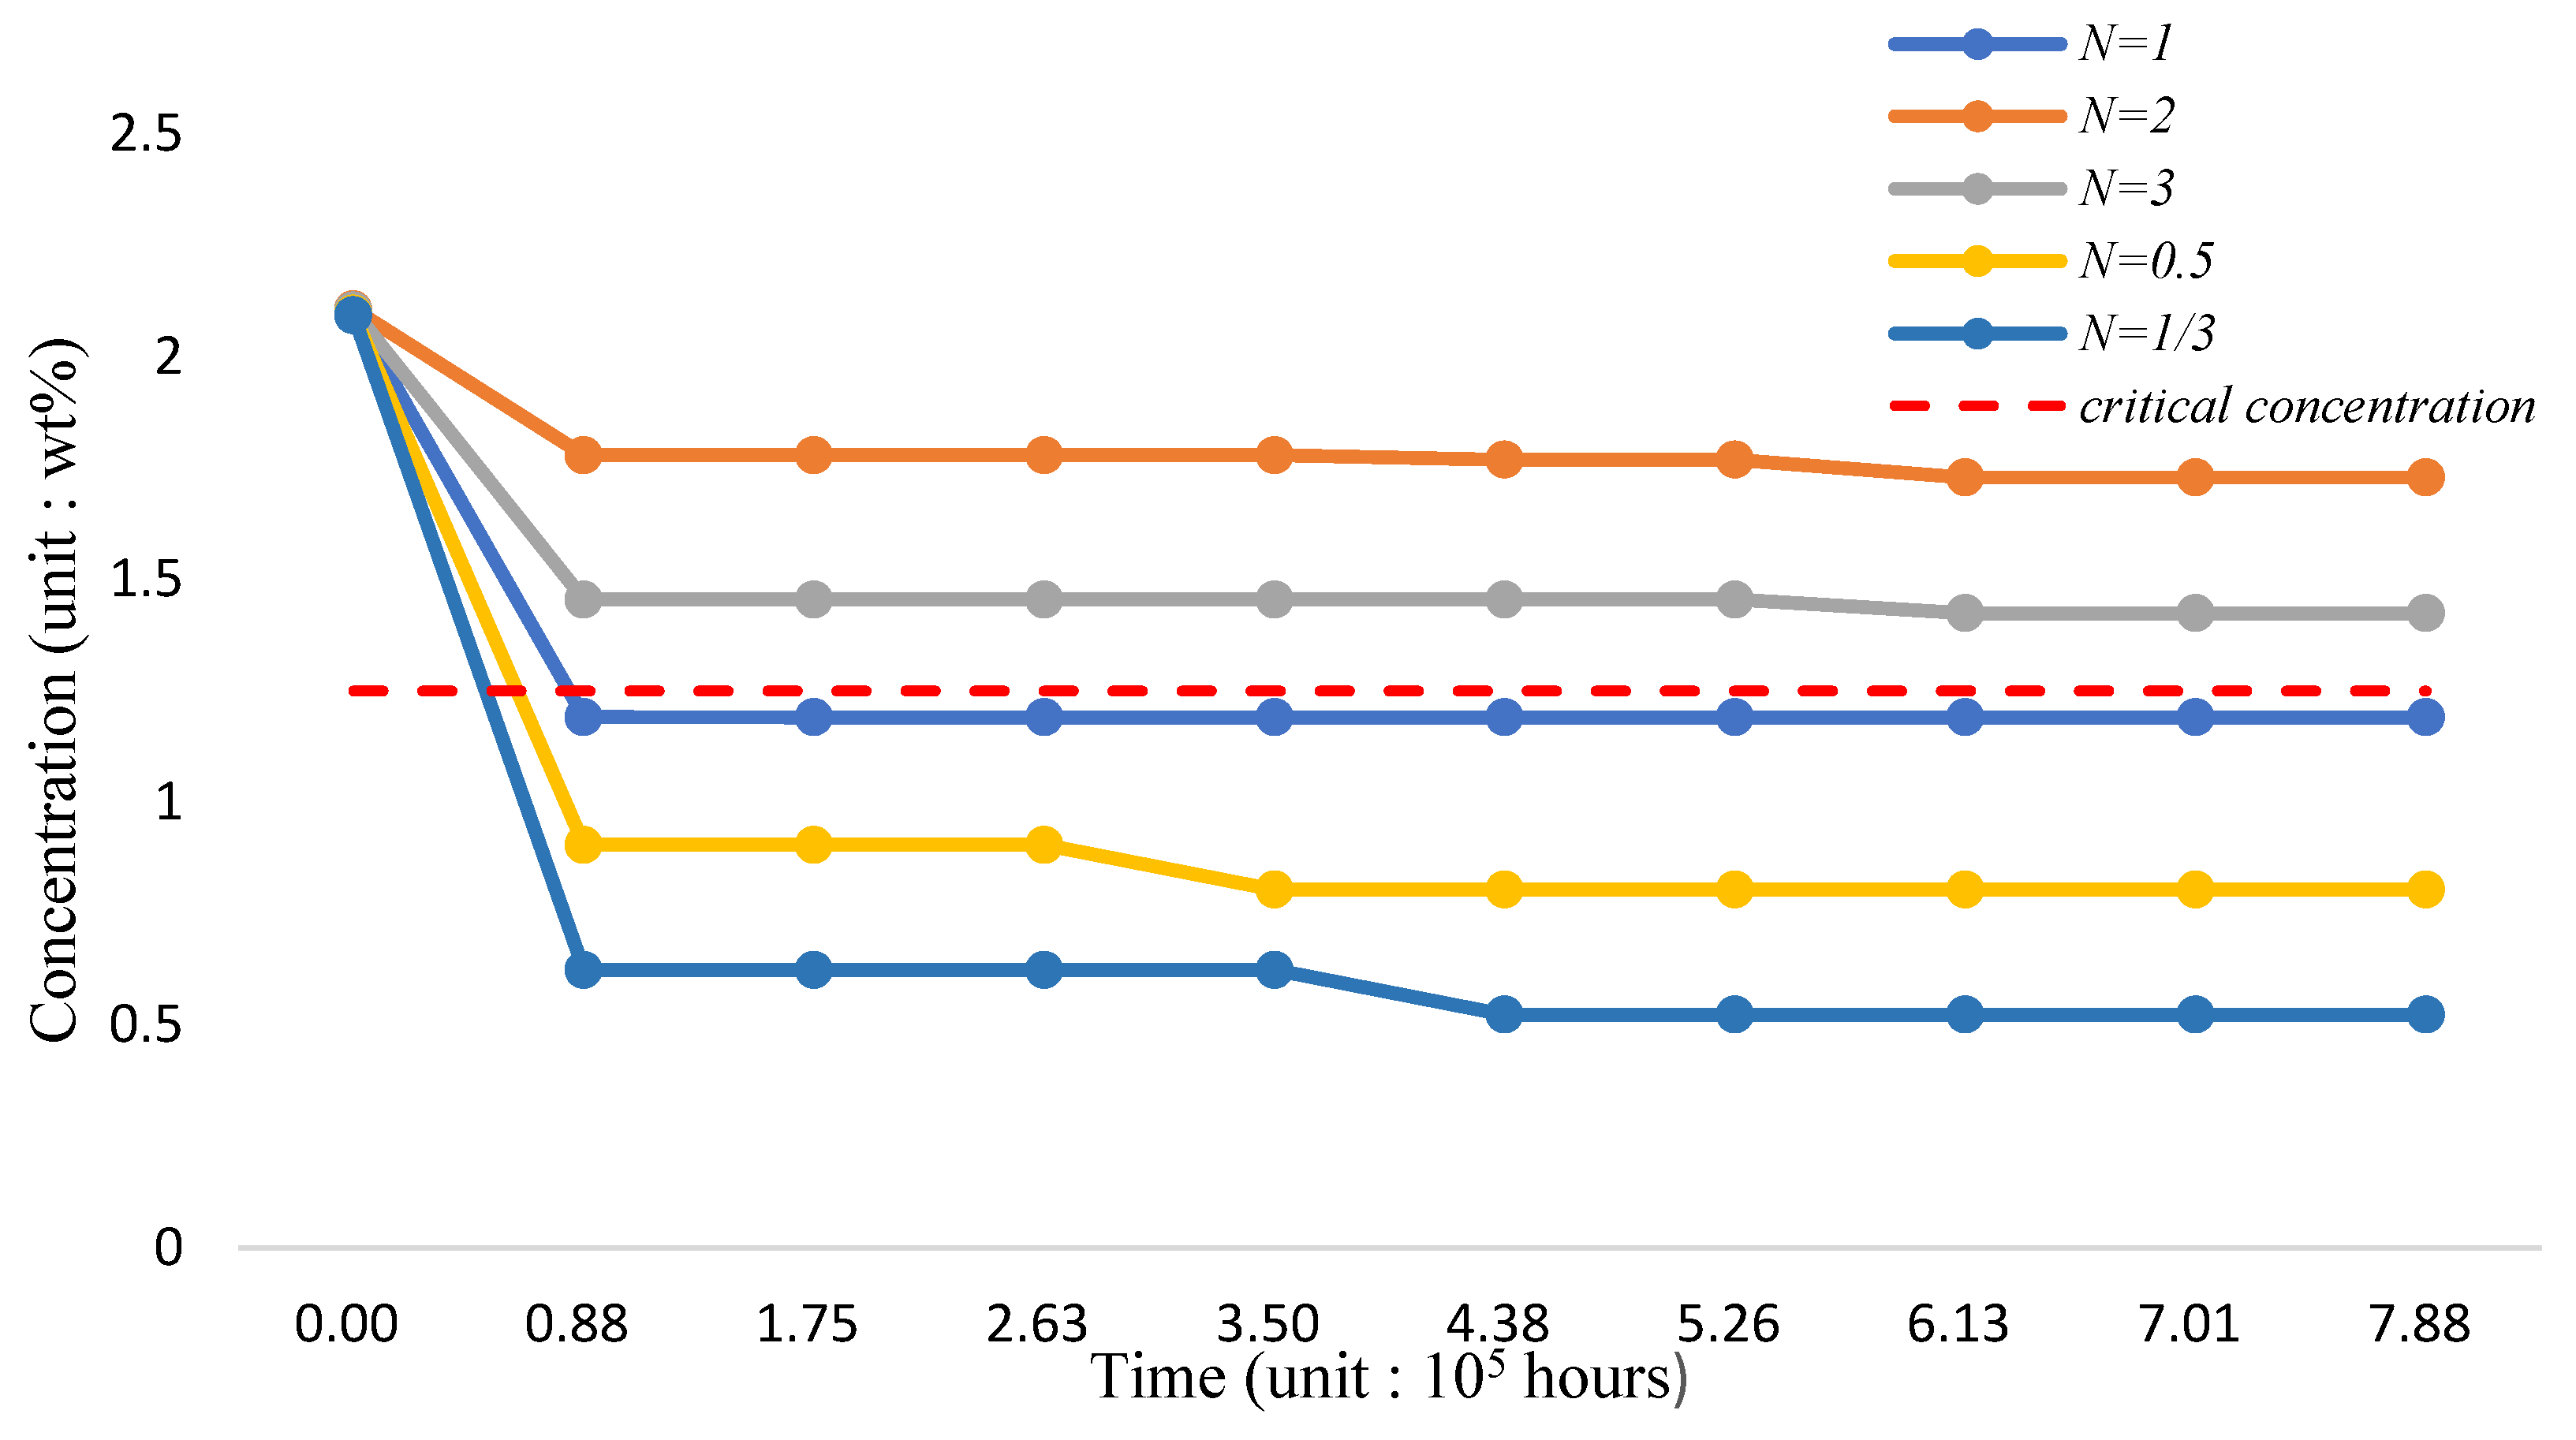
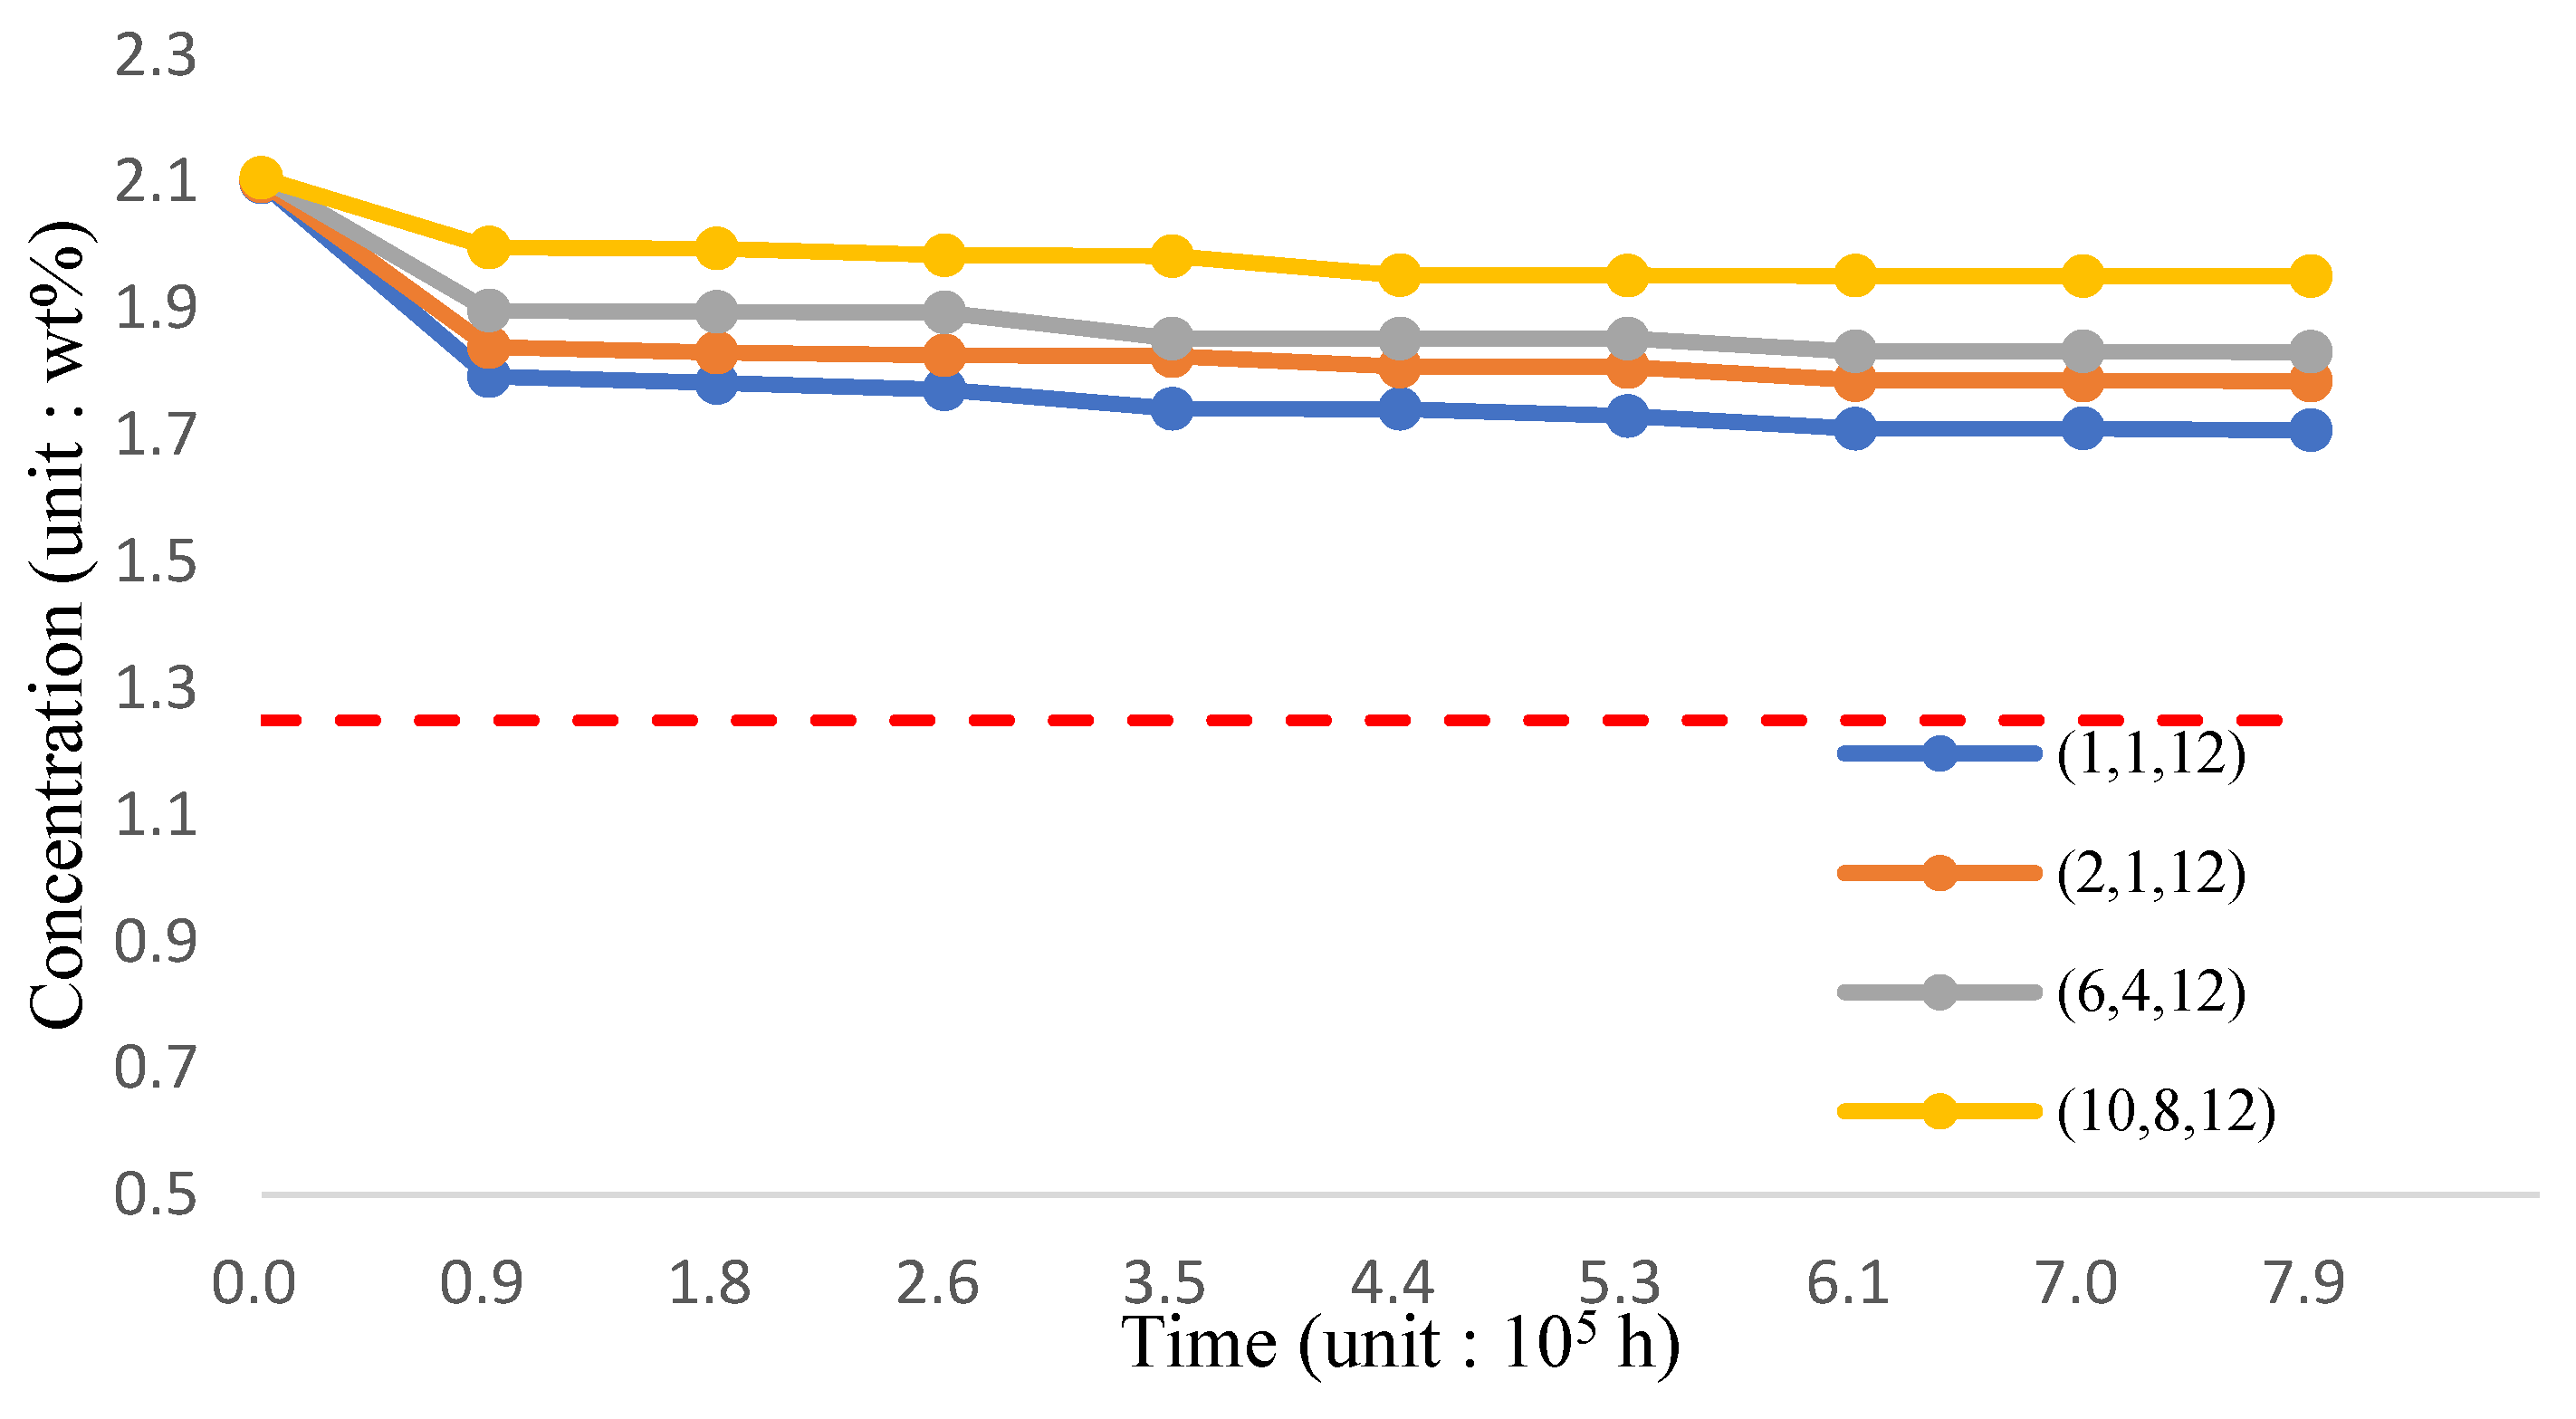
Figure 7.
FGC concentration-time distribution.
Figure 7.
FGC concentration-time distribution.
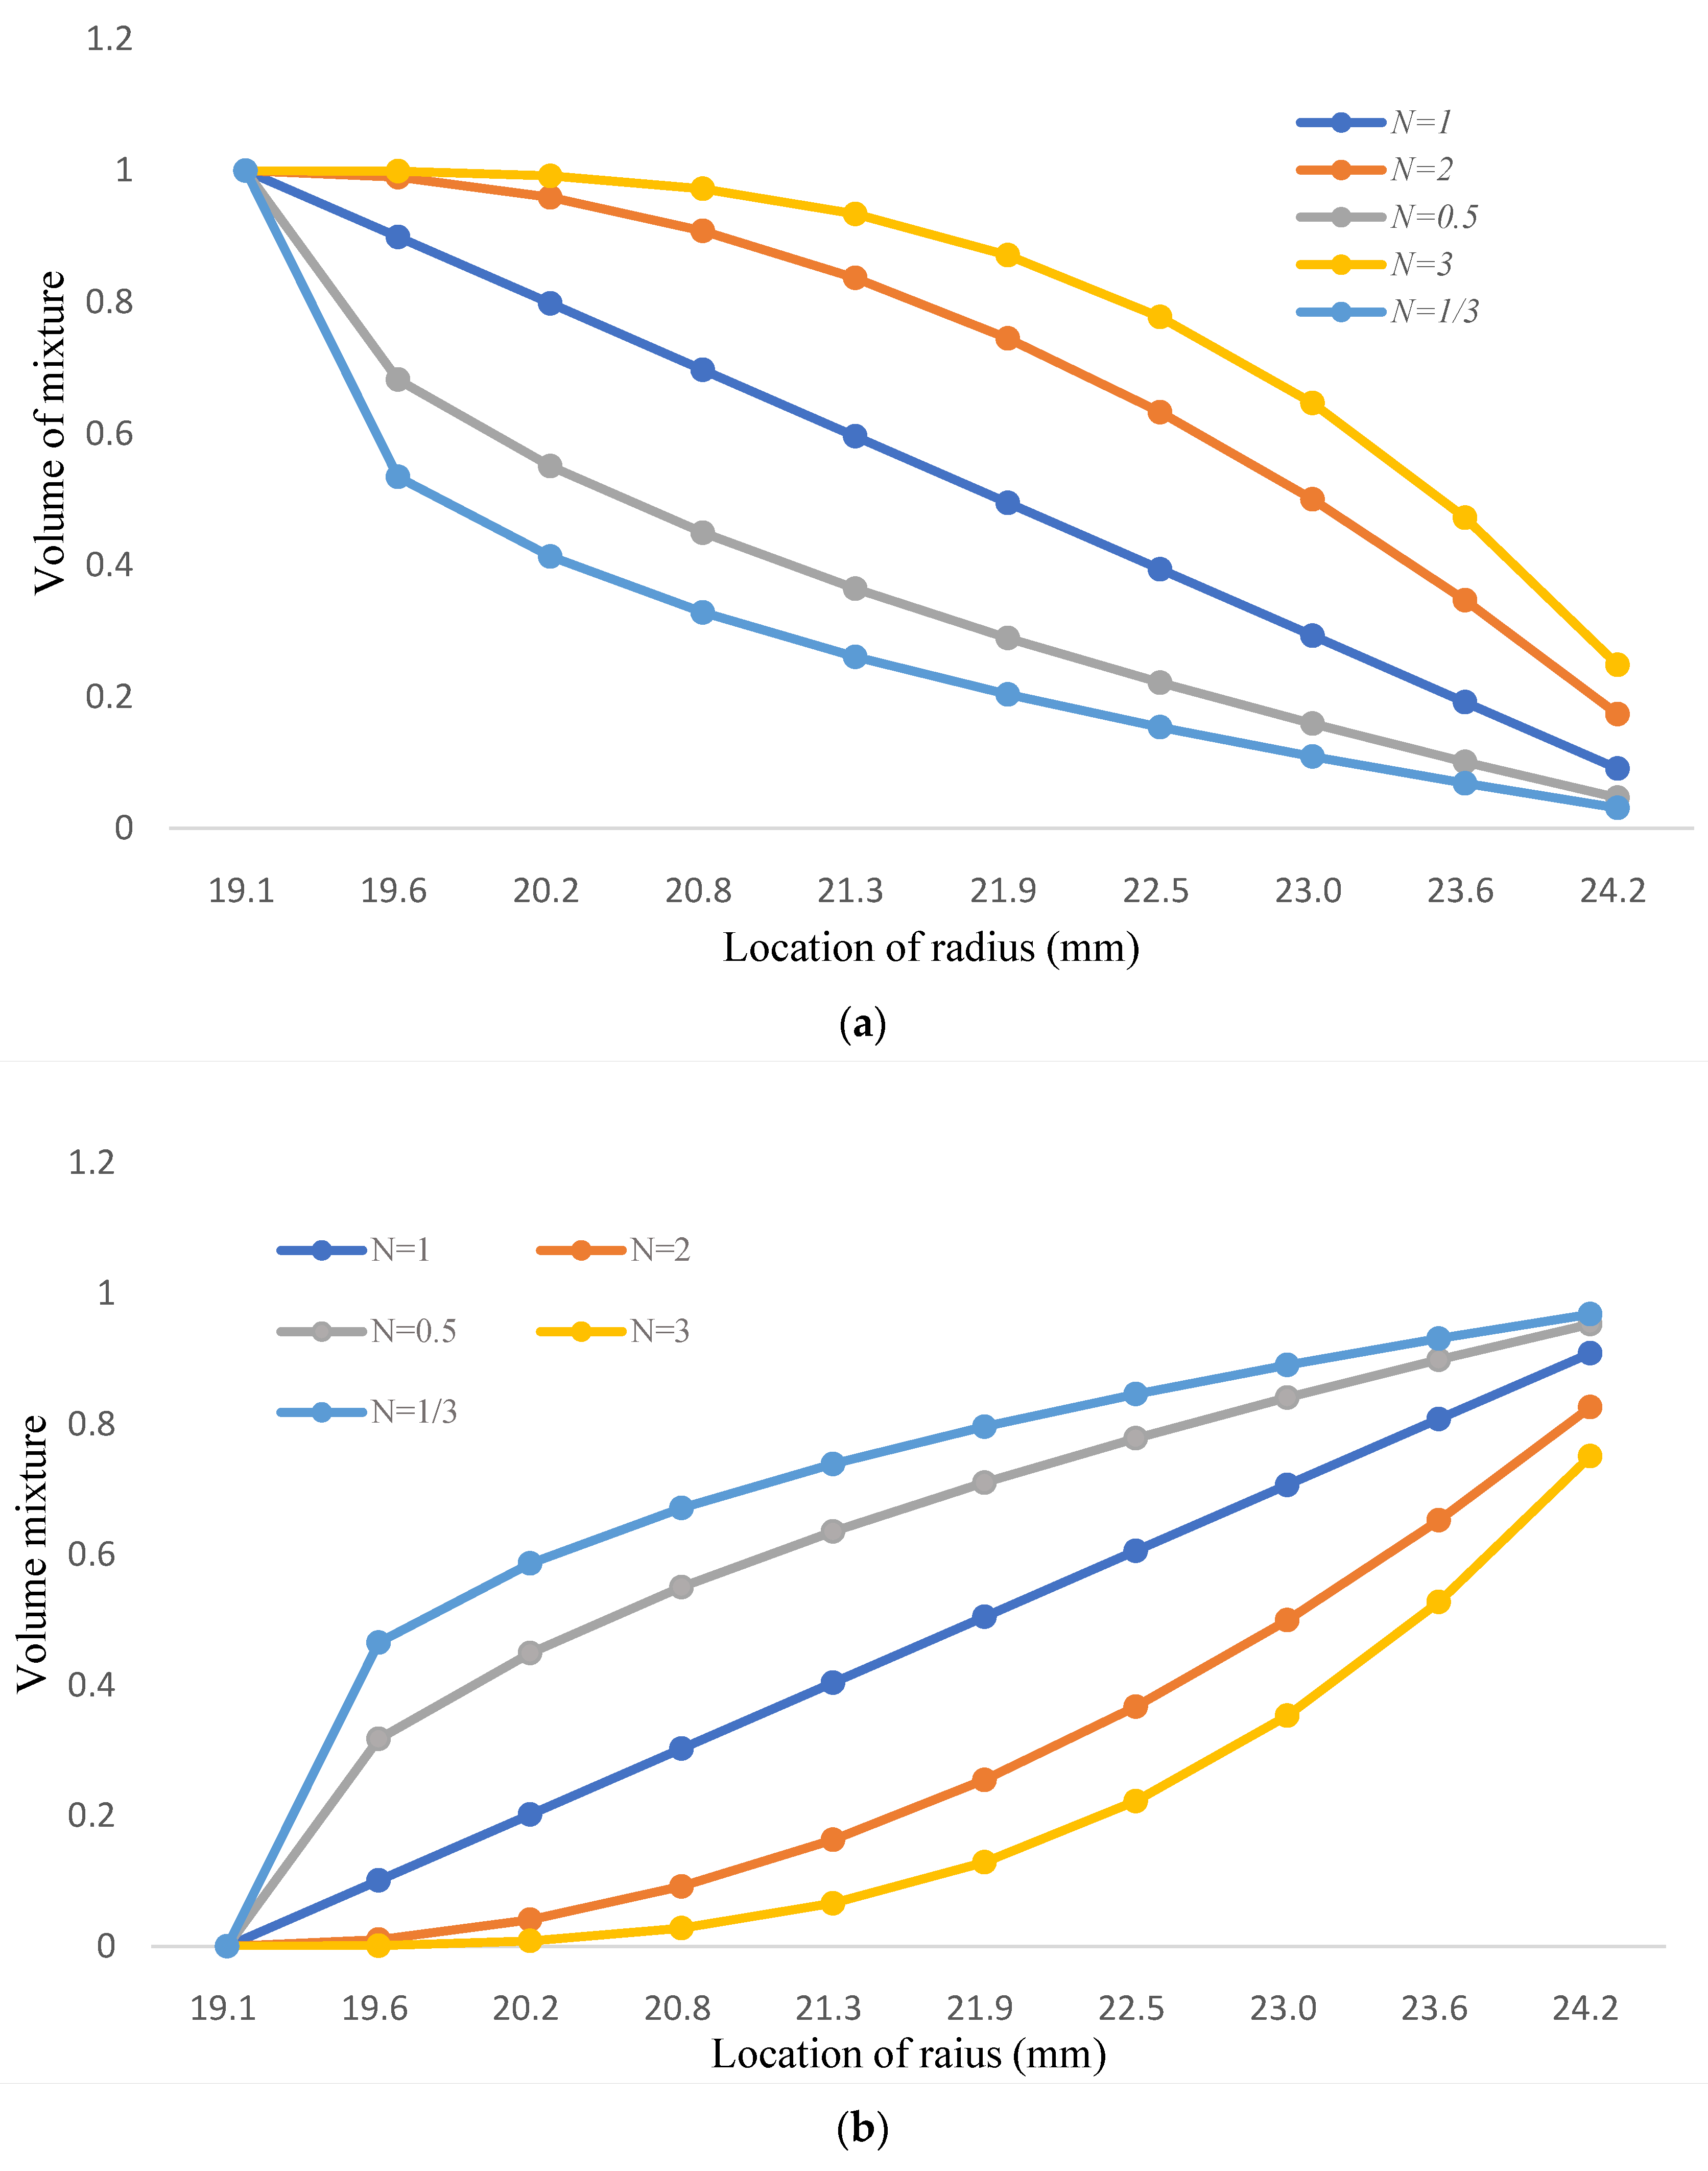
Figure 8.
(a) The volume mixture of Fe-12Cr-2Si for two-phase FGM; (b) The volume mixture of T91 for two-phase FGM.
Figure 8.
(a) The volume mixture of Fe-12Cr-2Si for two-phase FGM; (b) The volume mixture of T91 for two-phase FGM.
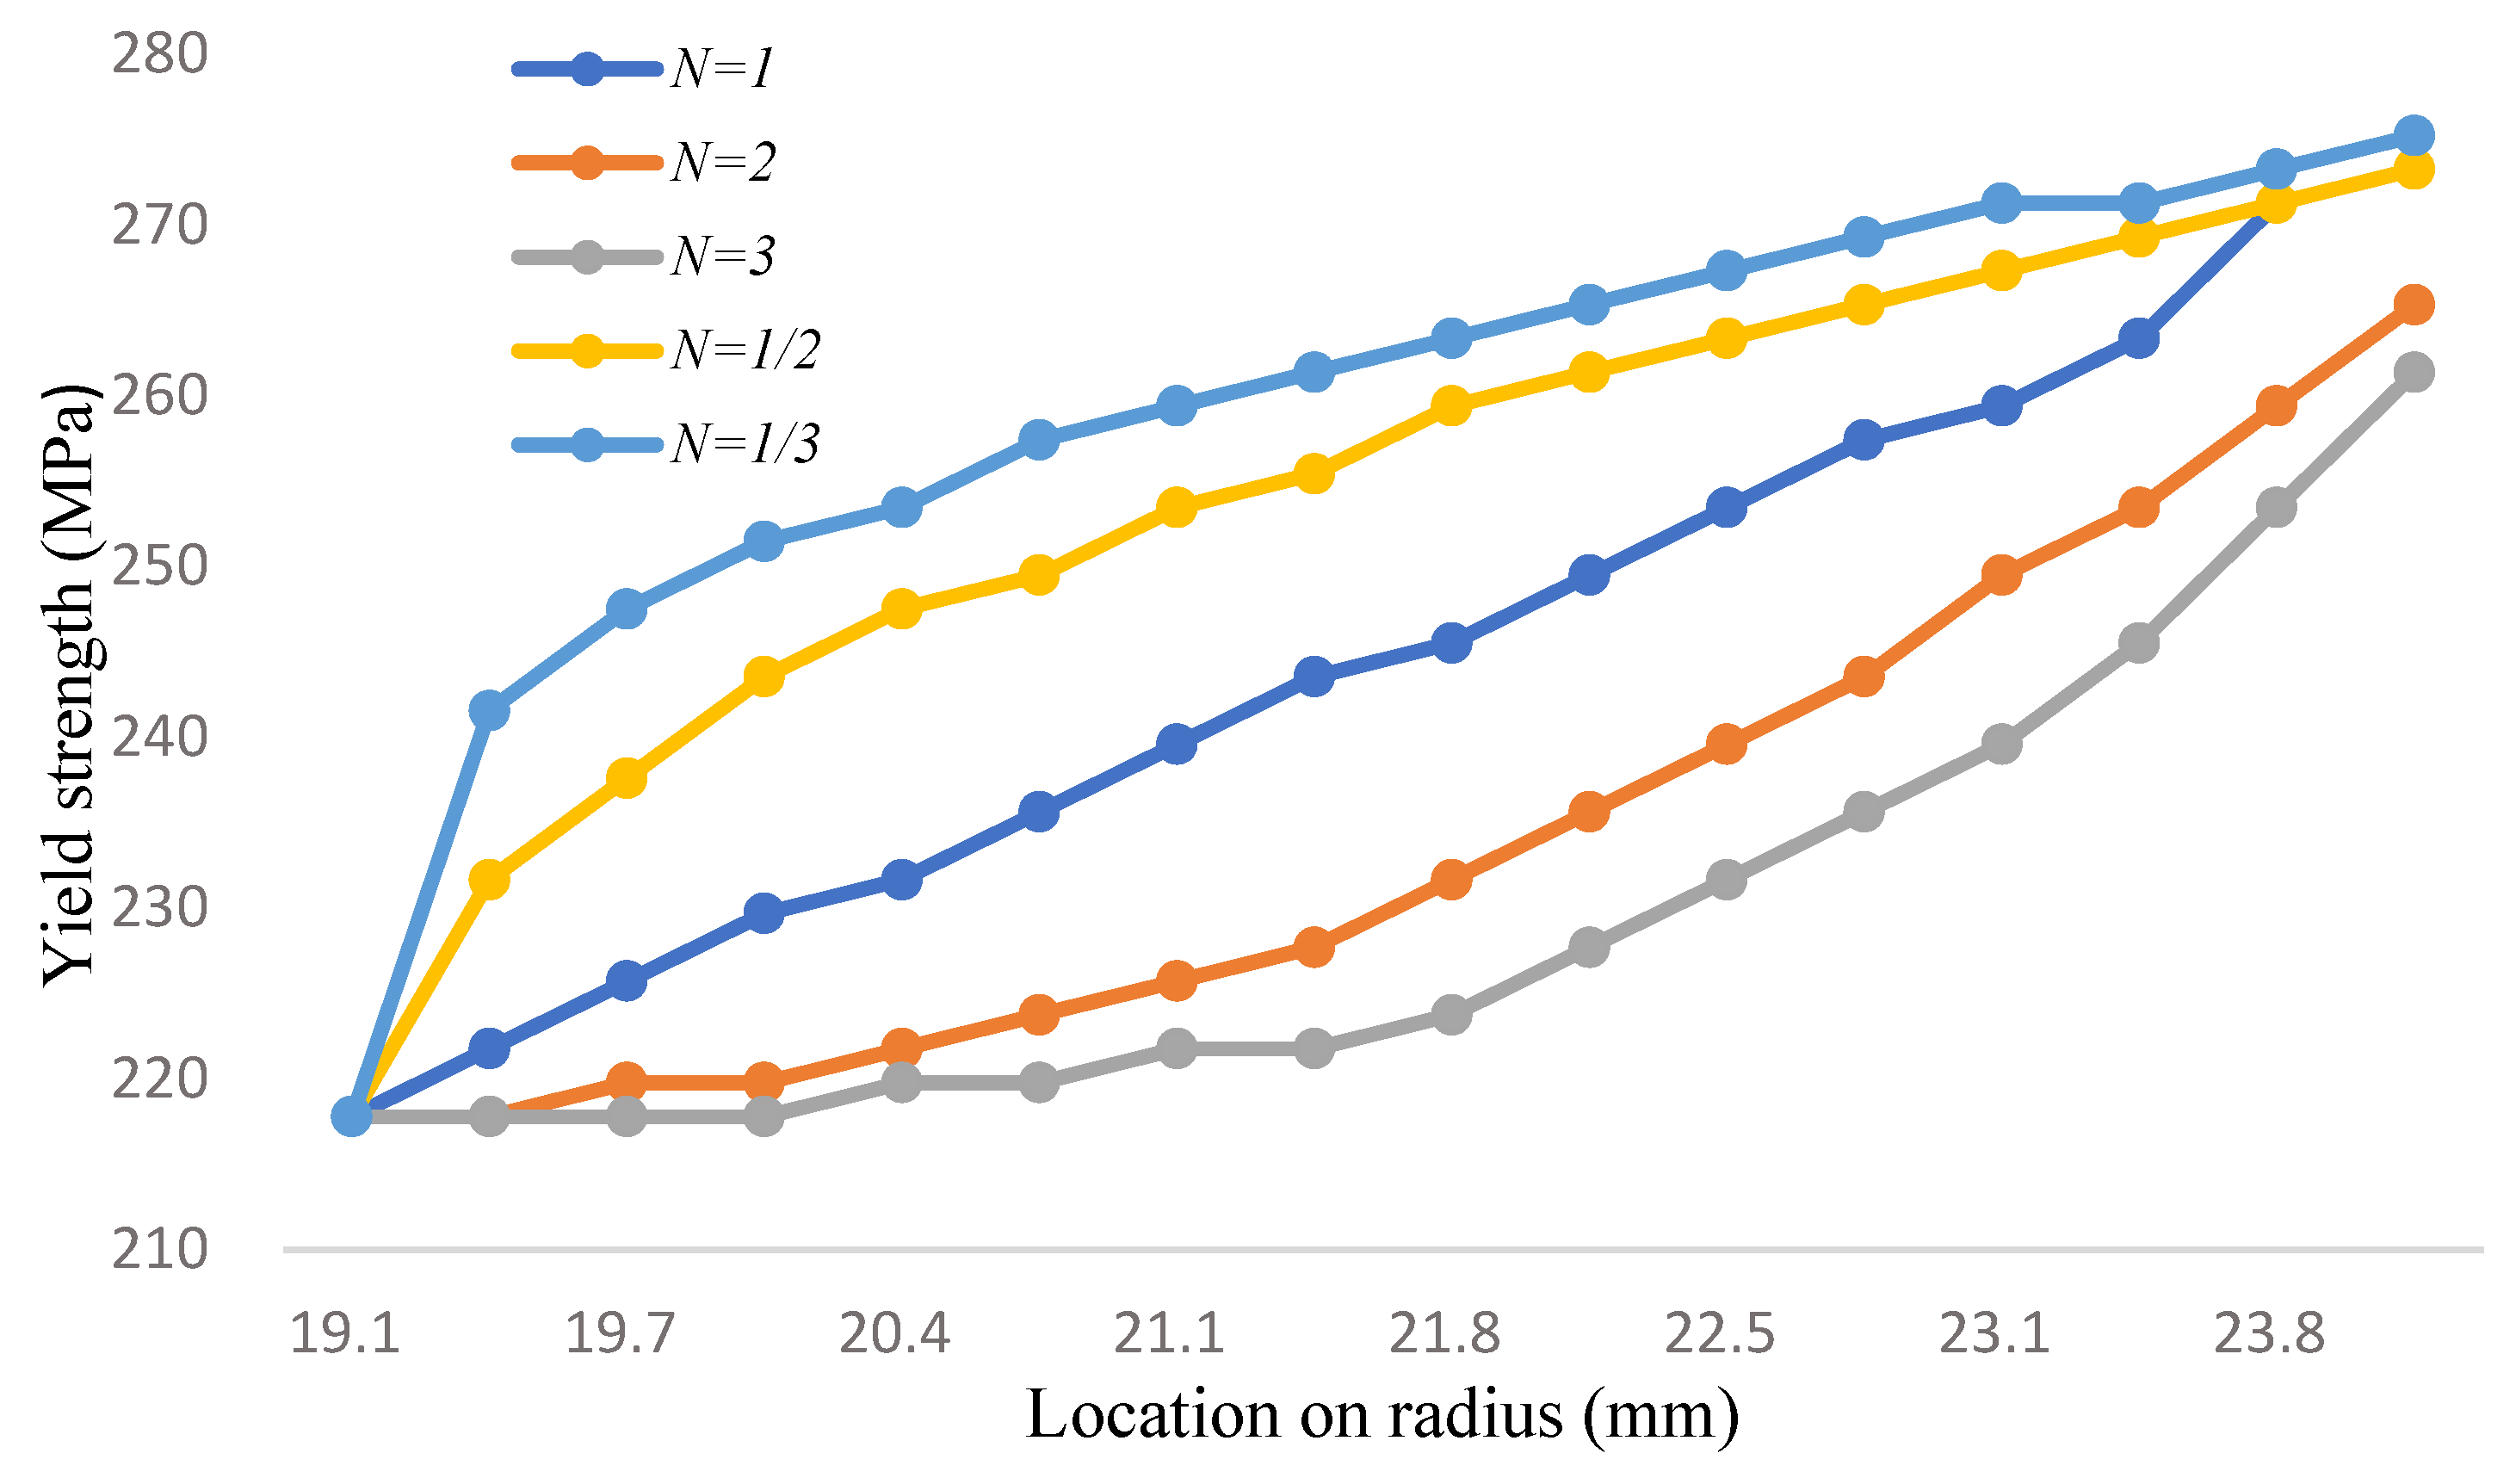
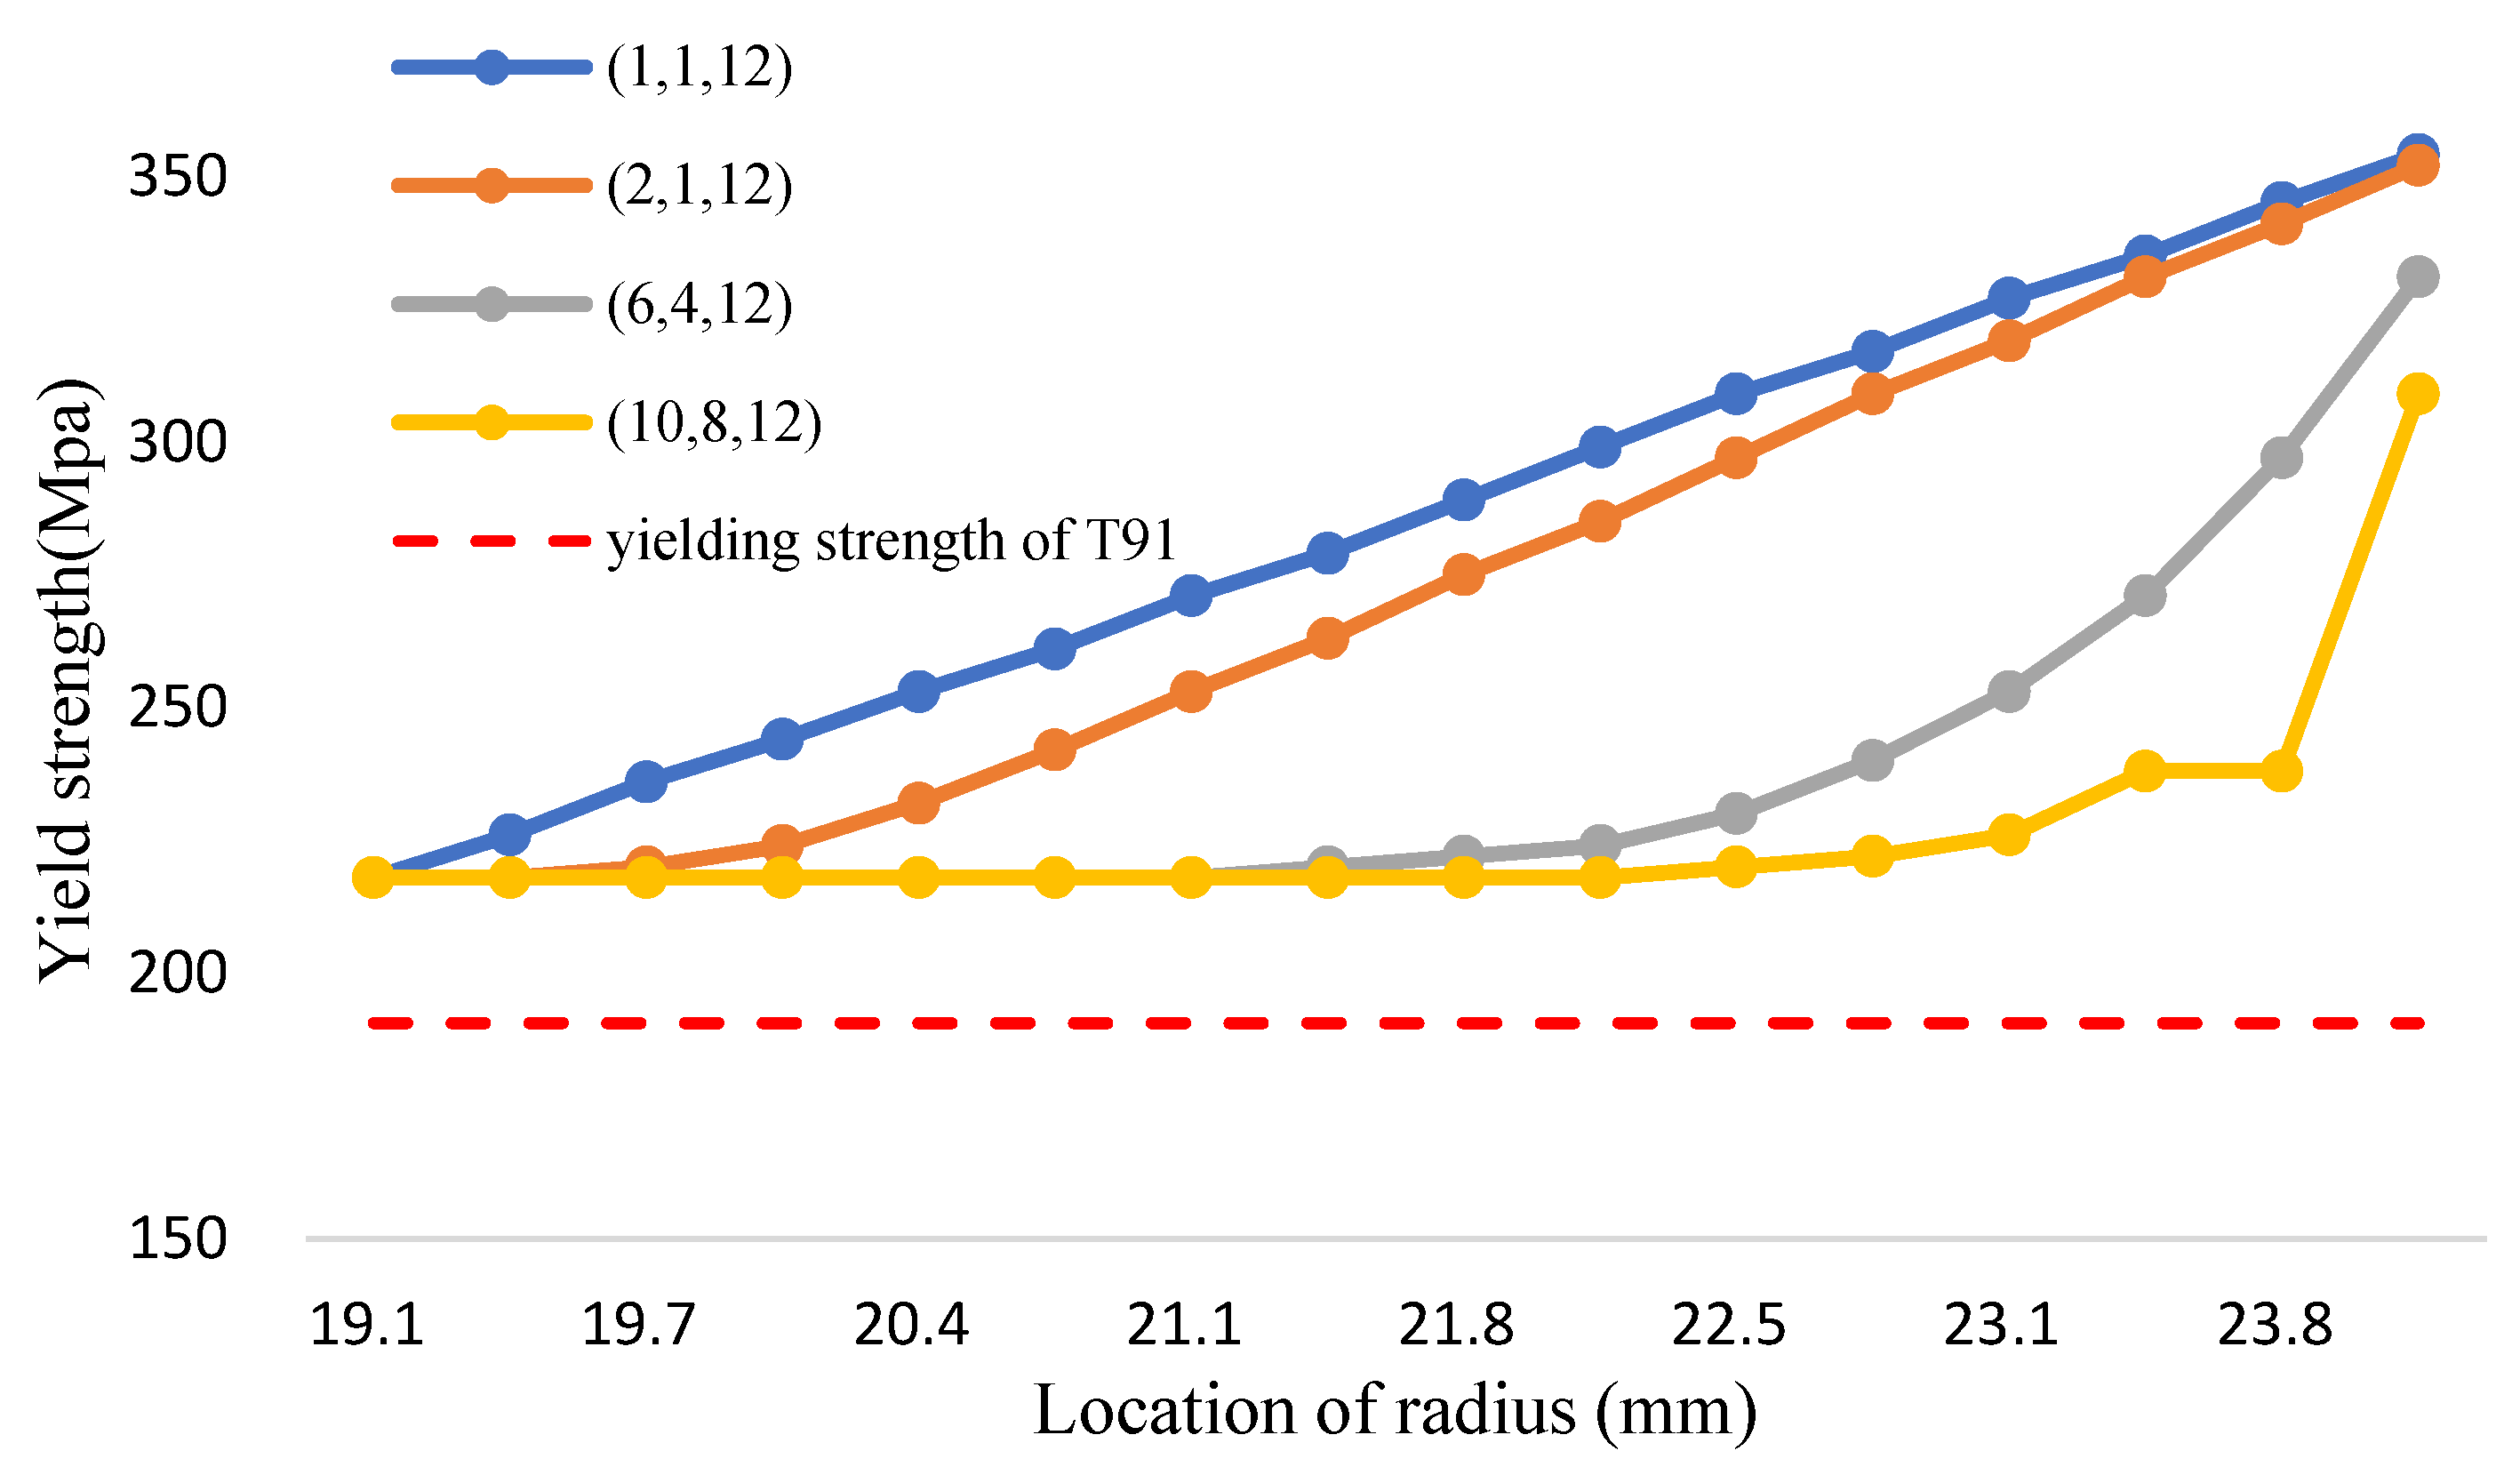
Figure 9.
The yield strength of the two-phase model (Unit: MPa, Temp: 700 °C).
Figure 9.
The yield strength of the two-phase model (Unit: MPa, Temp: 700 °C).
Figure 10.
The Tresca stress and yield strength distribution (Fe-12Cr-2Si-T91, T = 700 °C).
Figure 10.
The Tresca stress and yield strength distribution (Fe-12Cr-2Si-T91, T = 700 °C).
Figure 11.
The silicon concentration of the two-phase model (Unit: wt.%, Temp: 700 °C).
Figure 11.
The silicon concentration of the two-phase model (Unit: wt.%, Temp: 700 °C).
Figure 12.
Three-phase model distribution of coolant pipe (Fe-12Cr-2Si-TiO2-T91).
Figure 12.
Three-phase model distribution of coolant pipe (Fe-12Cr-2Si-TiO2-T91).
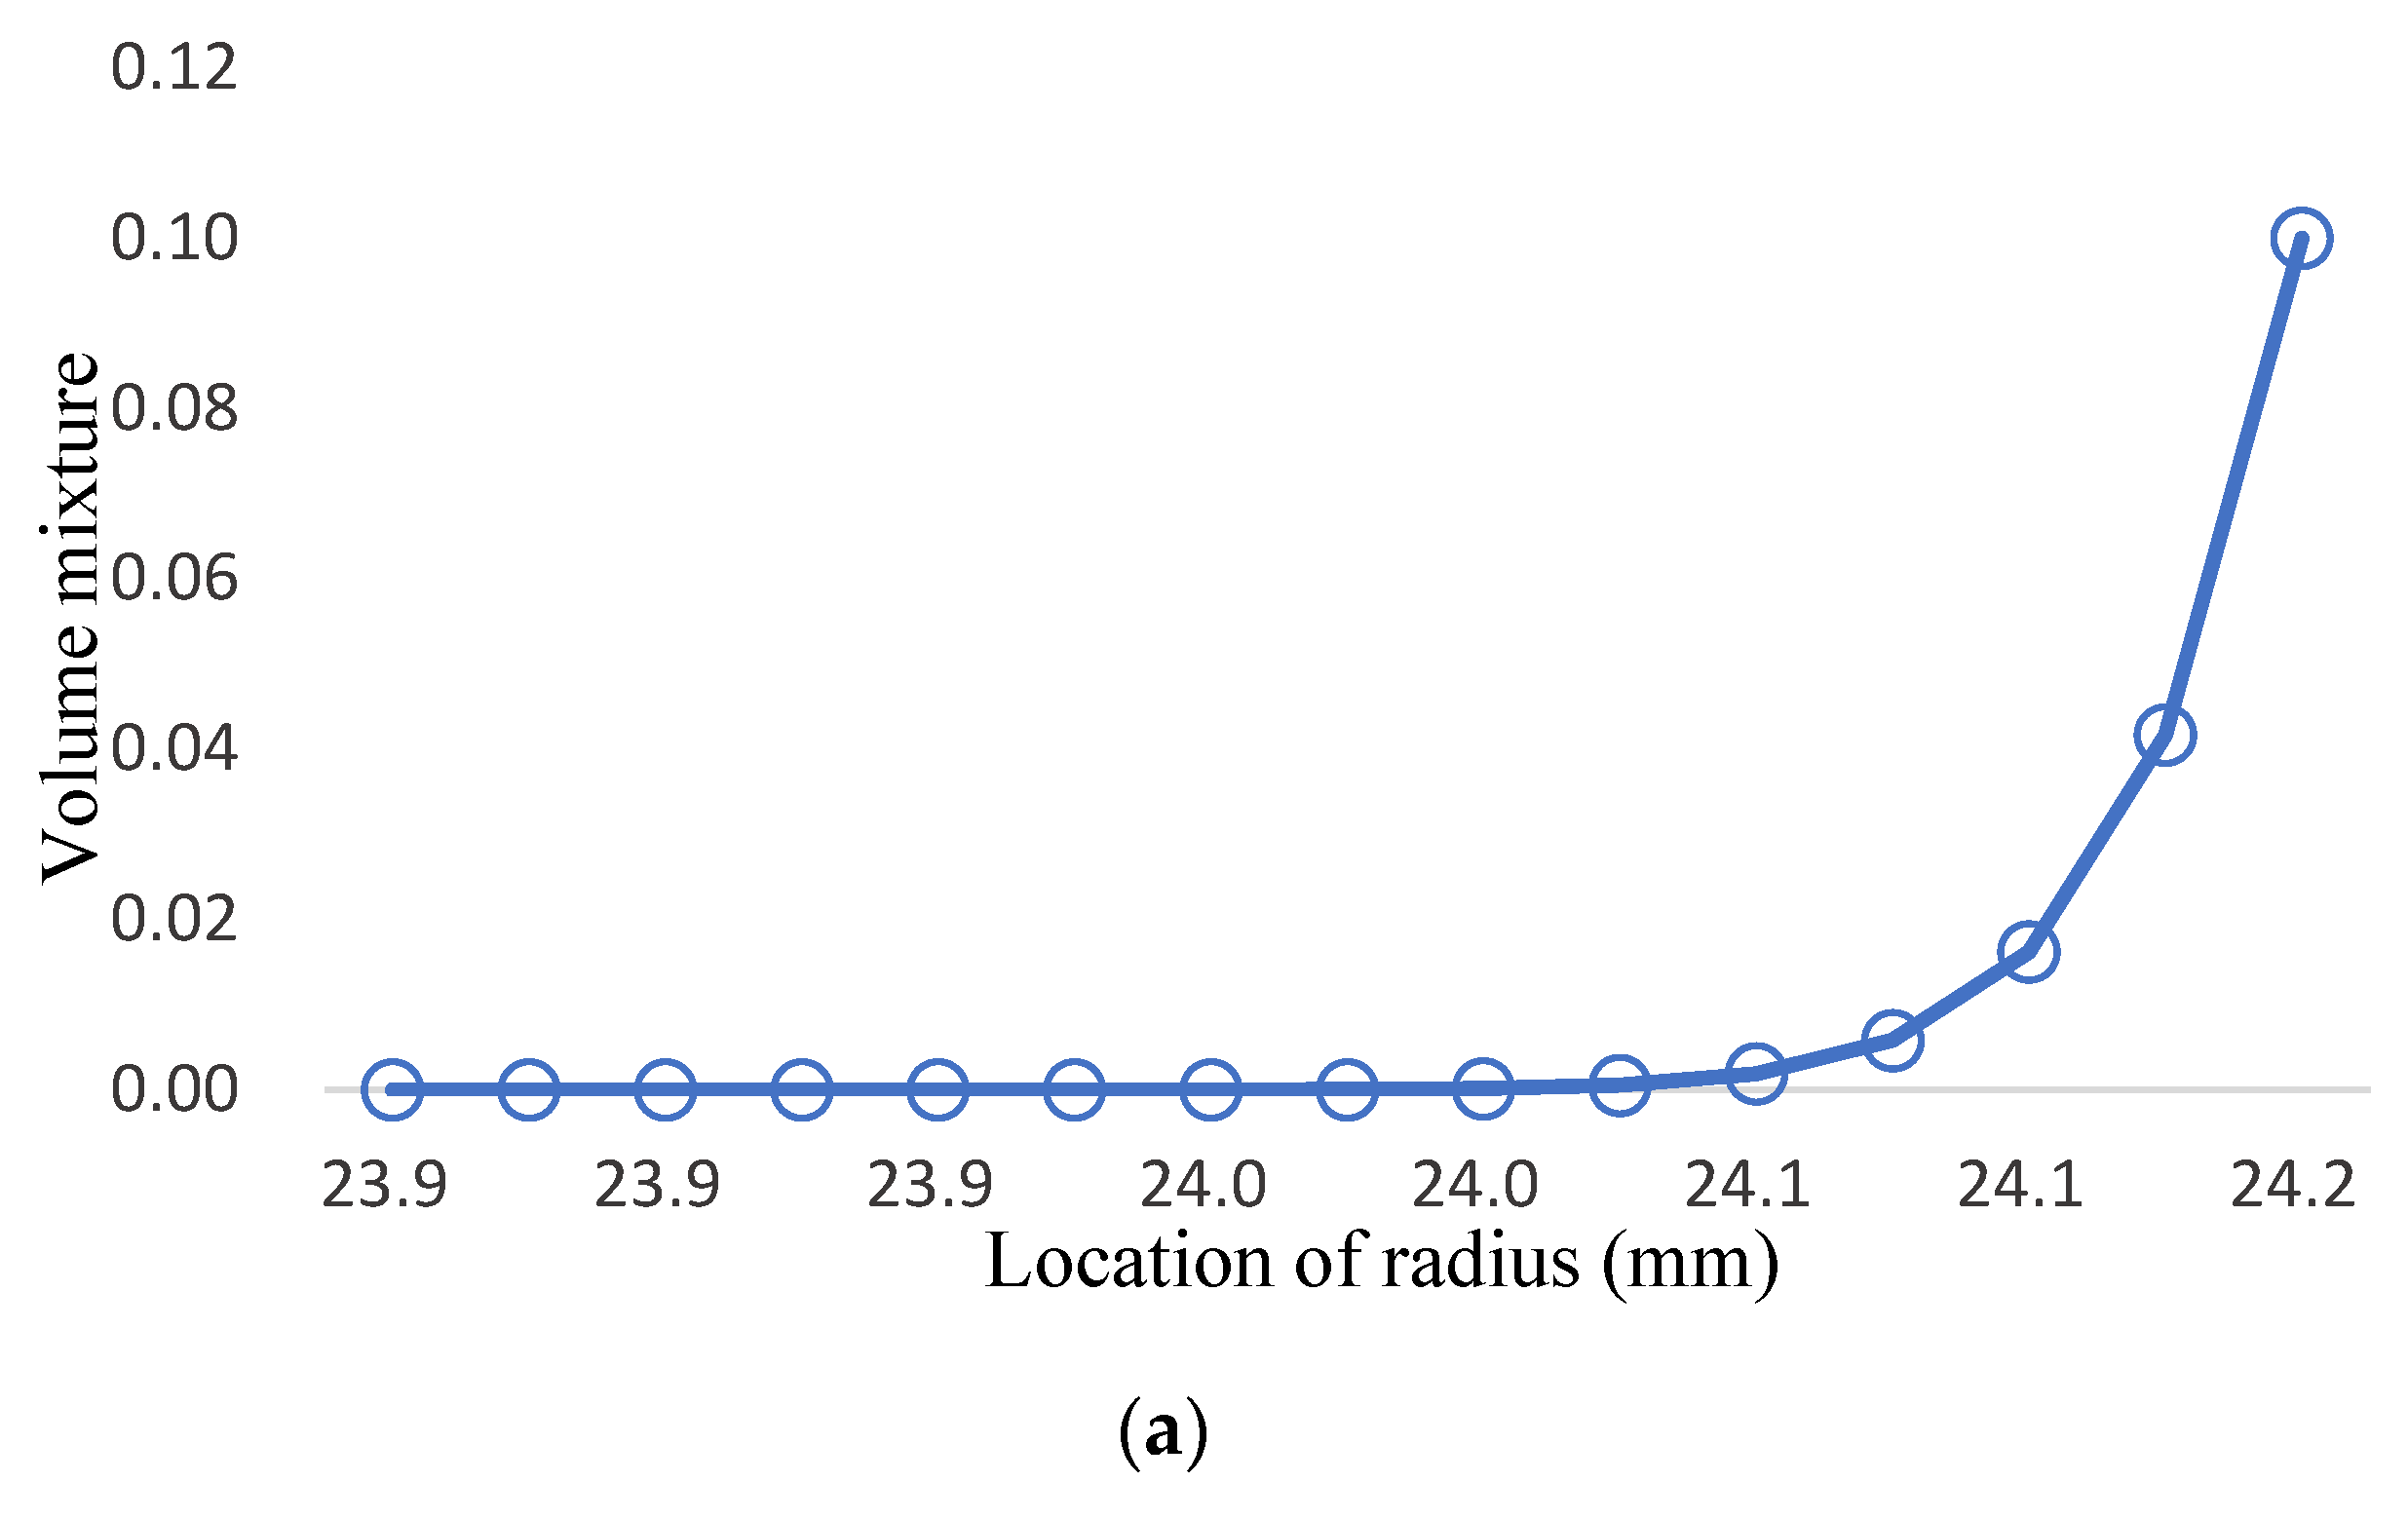
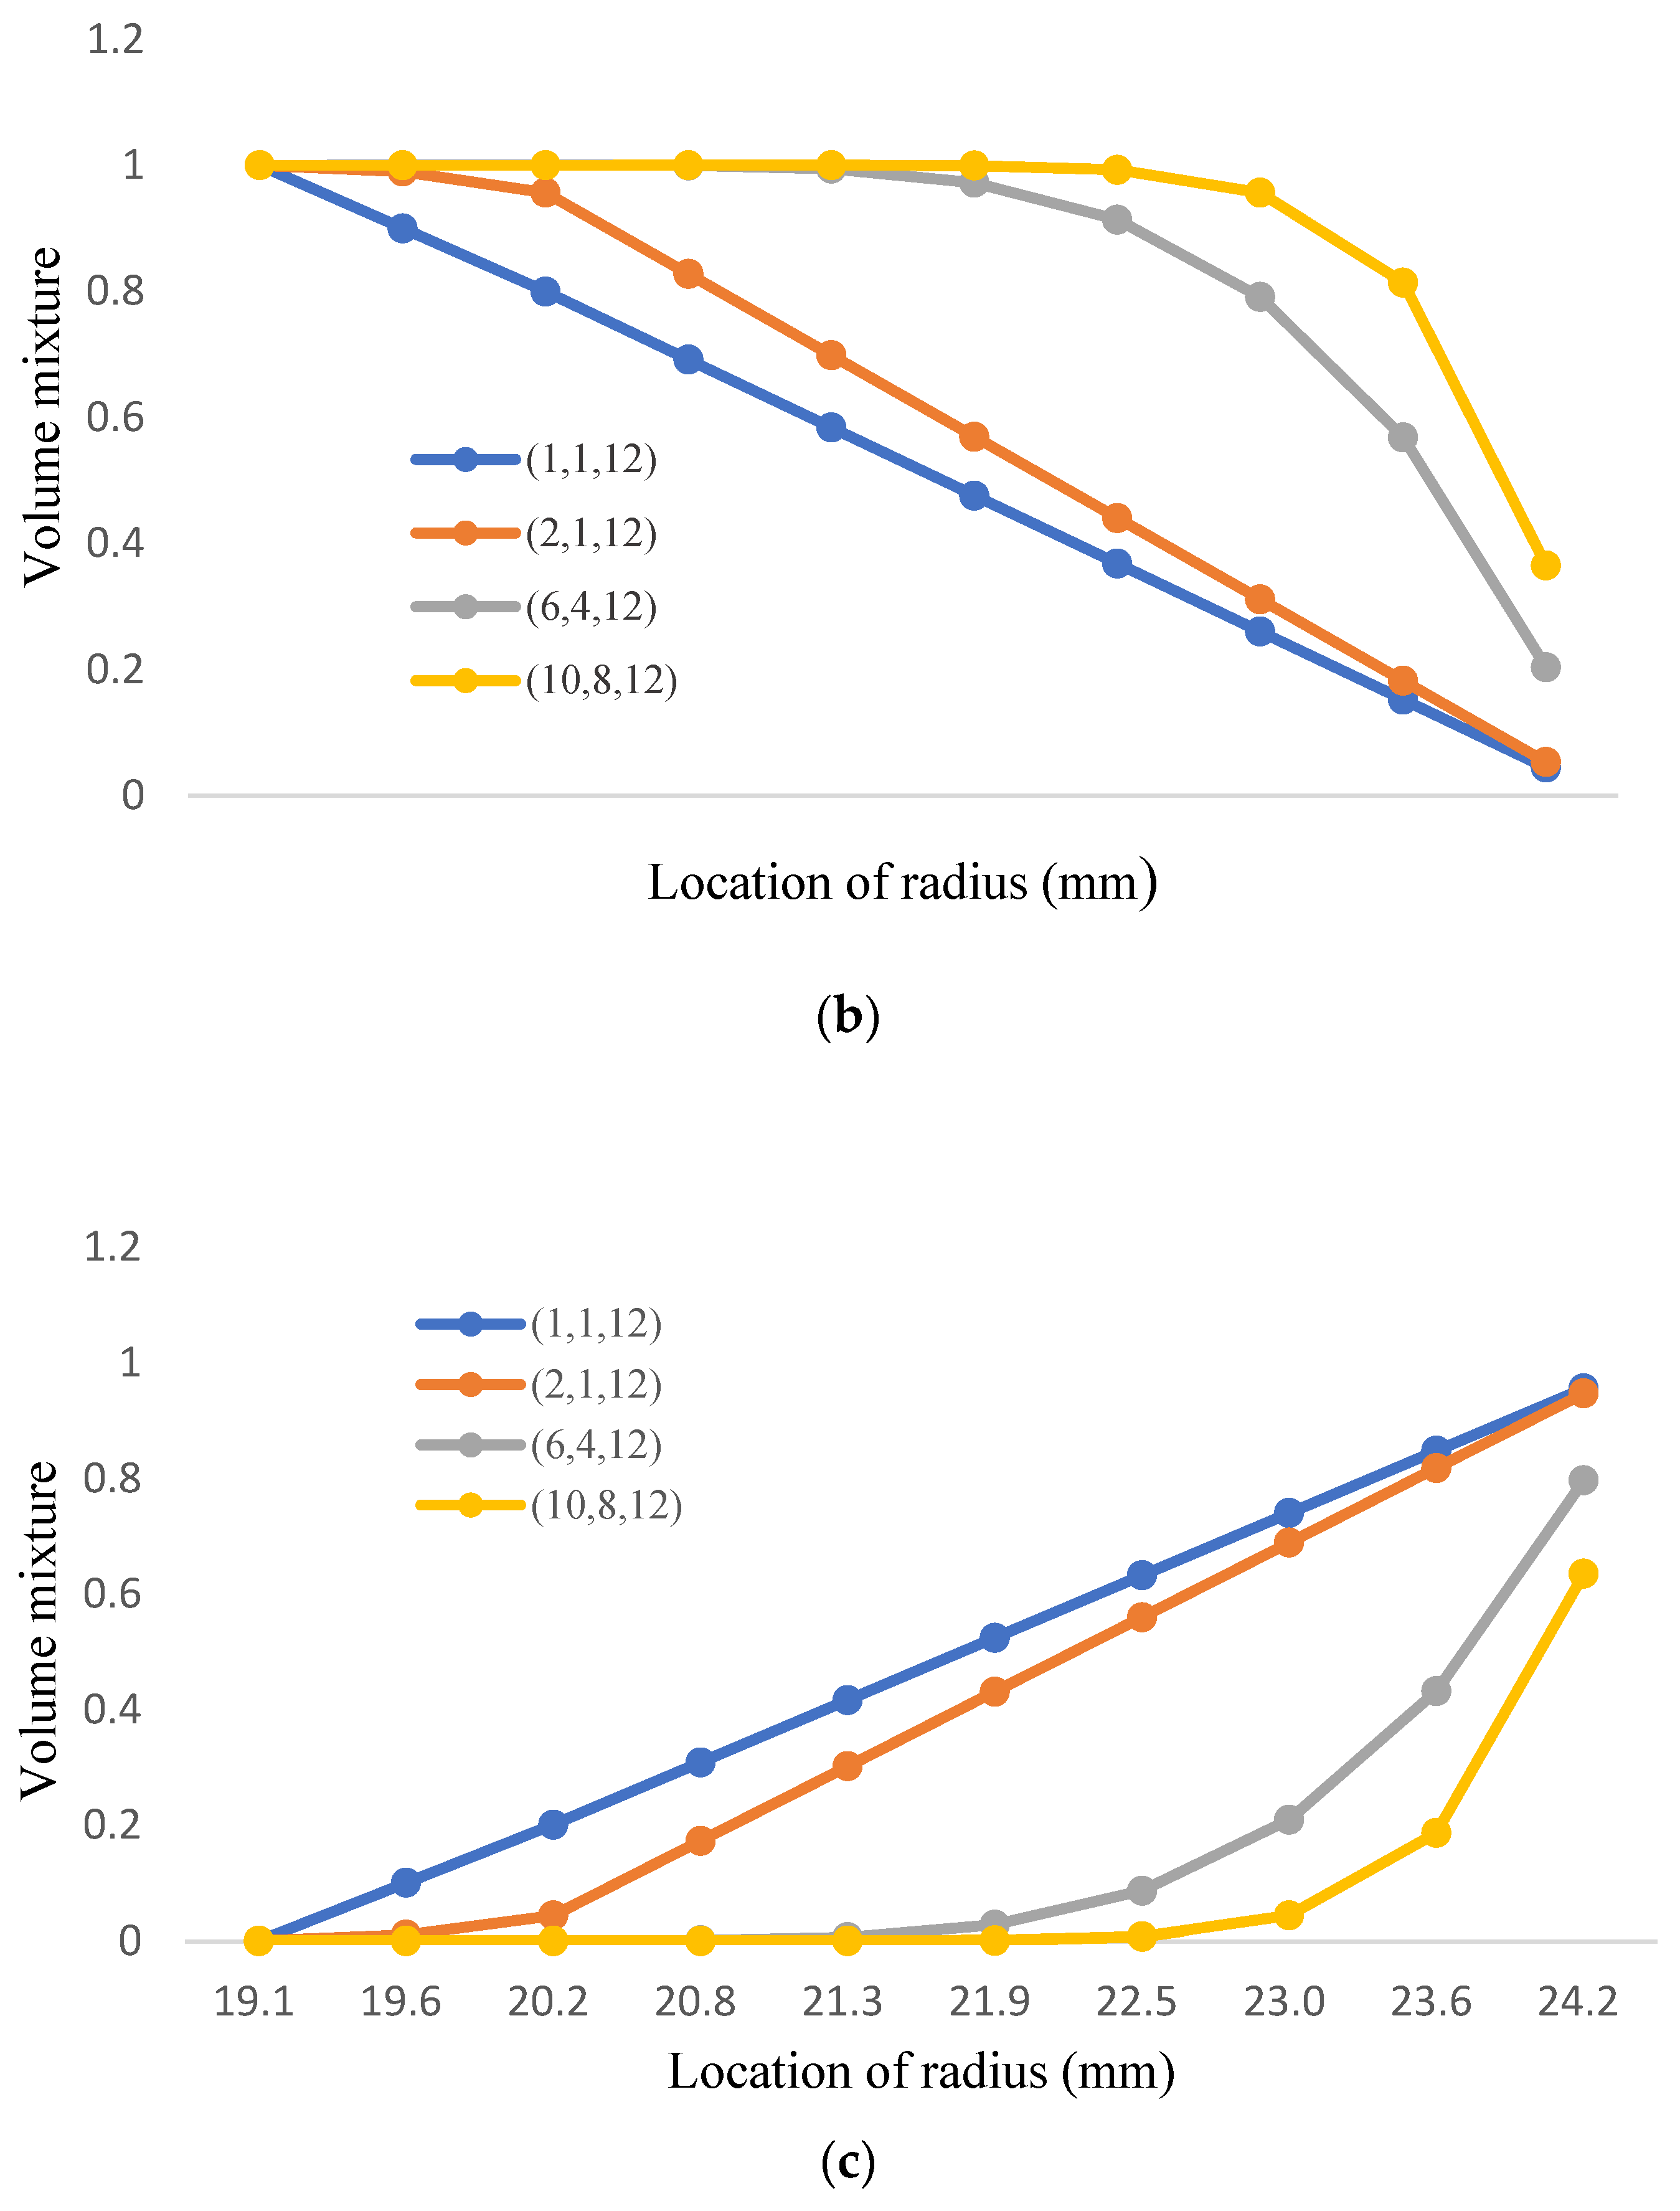
Figure 13.
(a). the volume mixture of T91 for three-phase FGM; (b). the volume mixture of Fe-12Cr-2Si for three-phase FGM; (c). the volume mixture of TiO2 for three-phase FGM.
Figure 13.
(a). the volume mixture of T91 for three-phase FGM; (b). the volume mixture of Fe-12Cr-2Si for three-phase FGM; (c). the volume mixture of TiO2 for three-phase FGM.
Figure 14.
The yield strength of FGM and T91 alloys (Fe-12Cr-2Si-TiO2-T91, Temperature: 700 °C).
Figure 14.
The yield strength of FGM and T91 alloys (Fe-12Cr-2Si-TiO2-T91, Temperature: 700 °C).
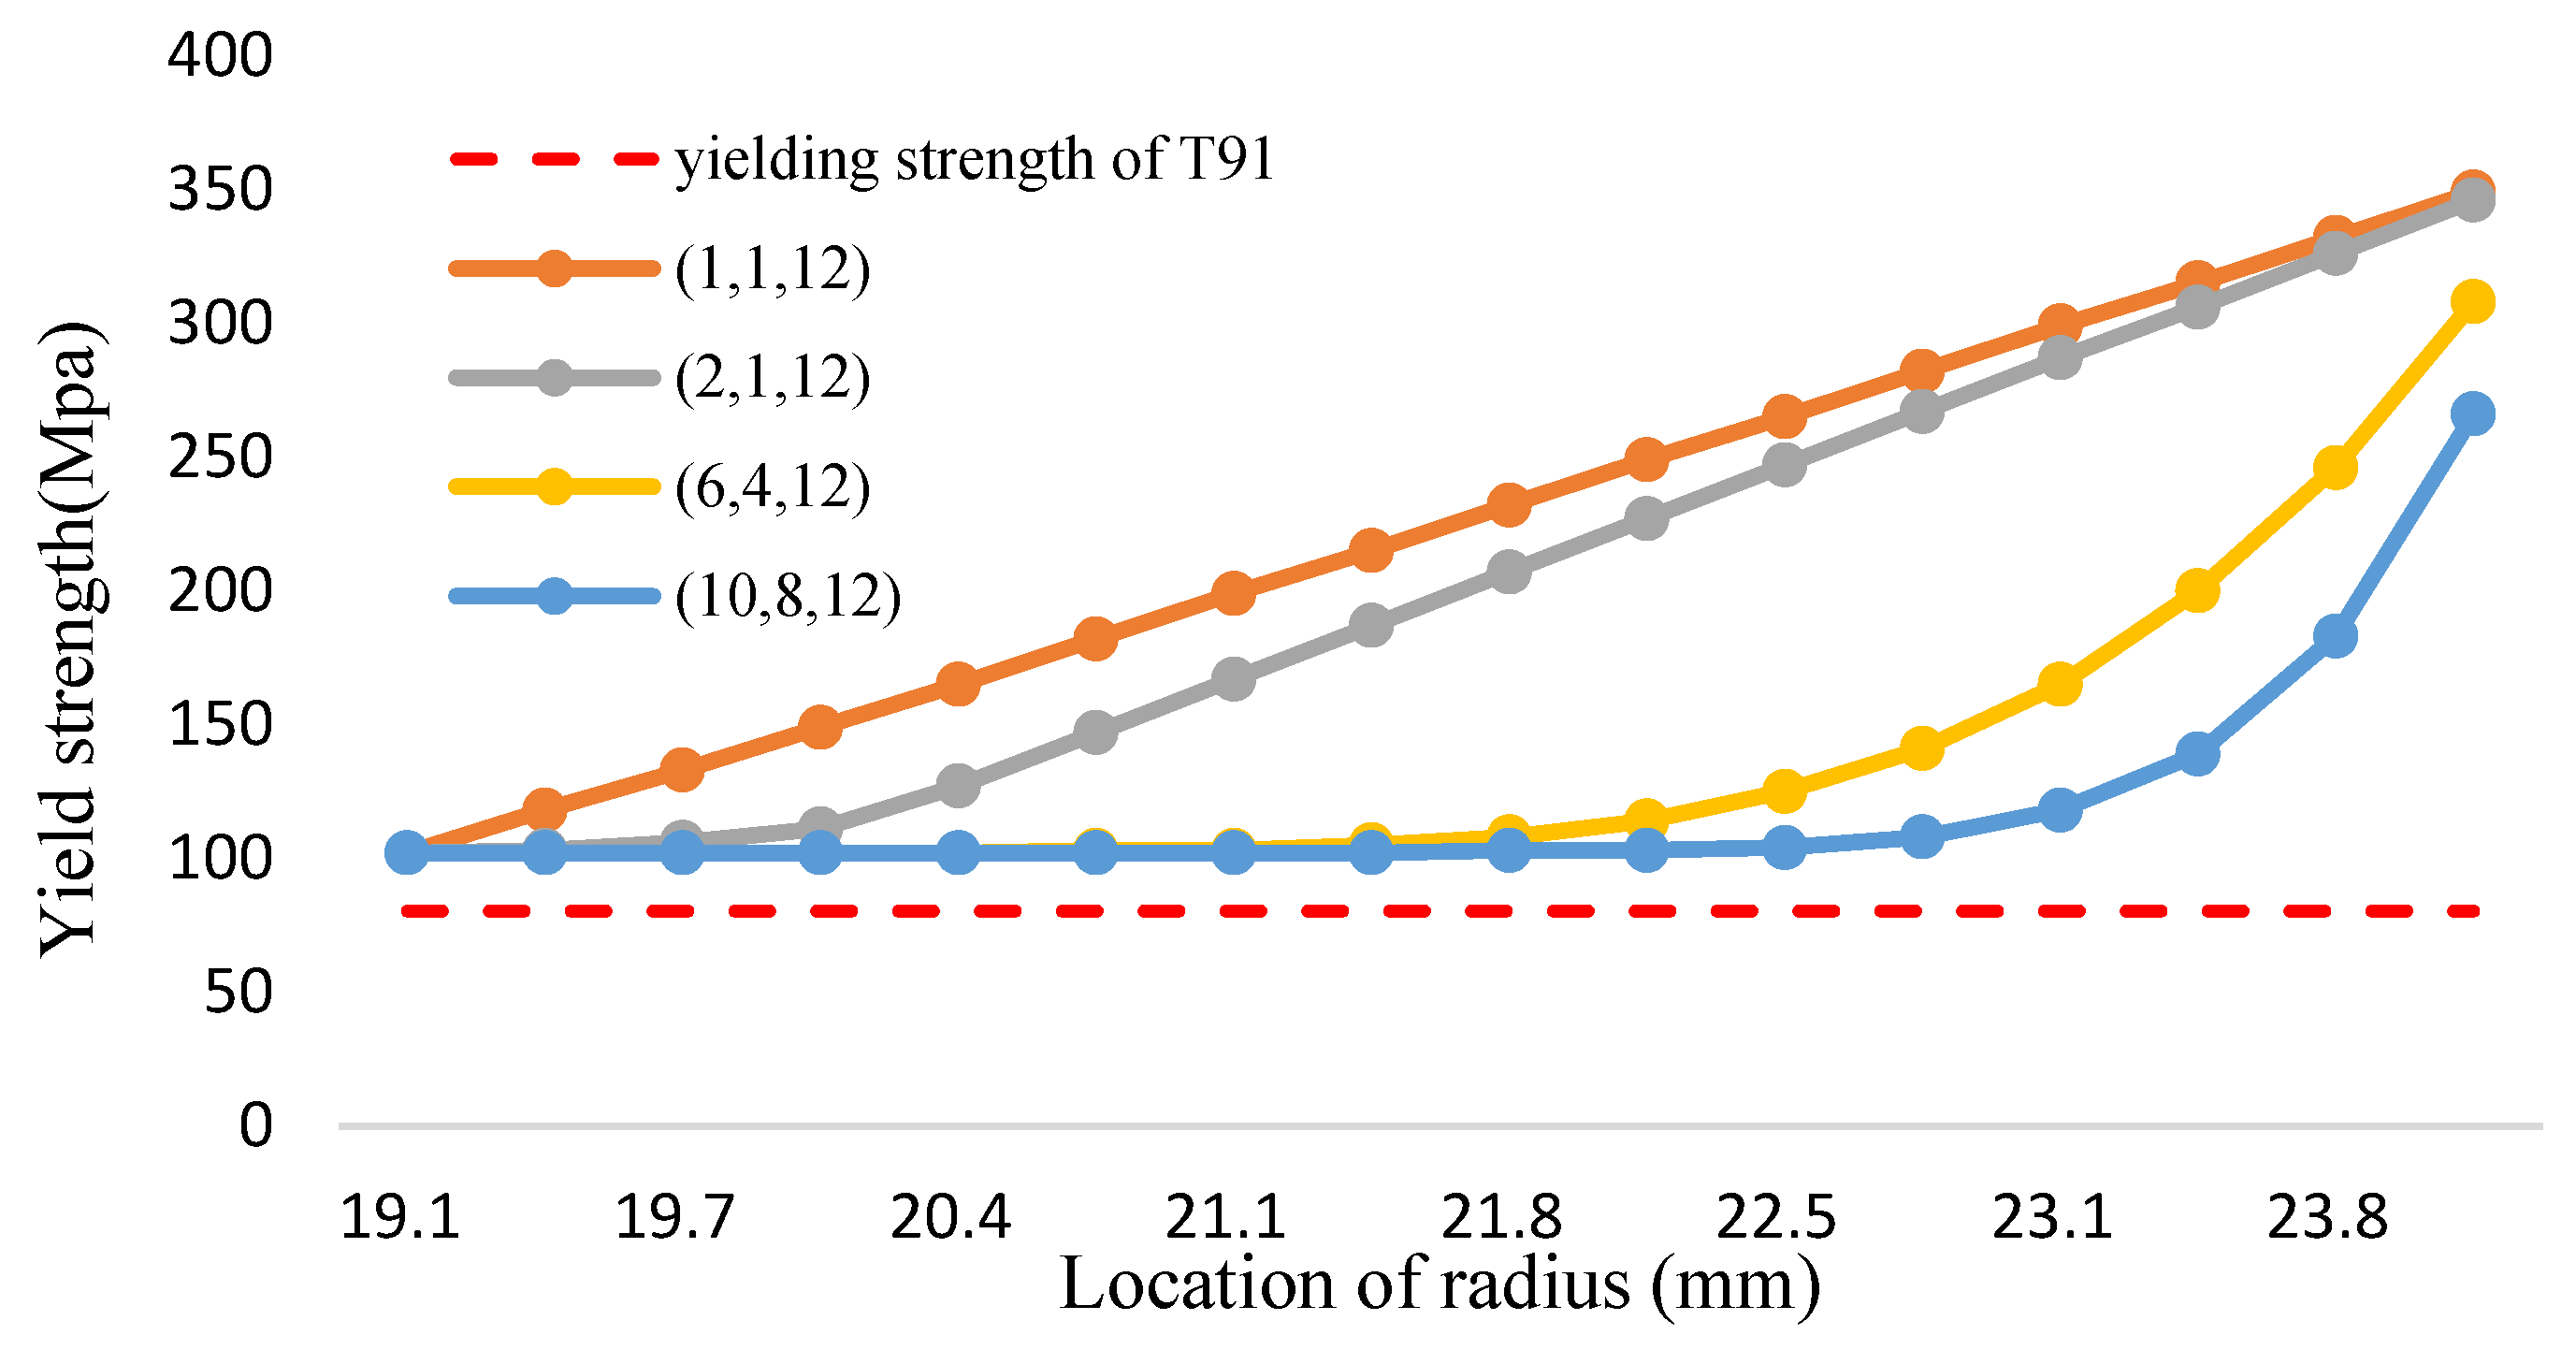
Figure 15.
The yield strength of FGM and T91 alloys (Fe-12Cr-2Si-TiO2-T91, Temperature: 1000 °C).
Figure 15.
The yield strength of FGM and T91 alloys (Fe-12Cr-2Si-TiO2-T91, Temperature: 1000 °C).
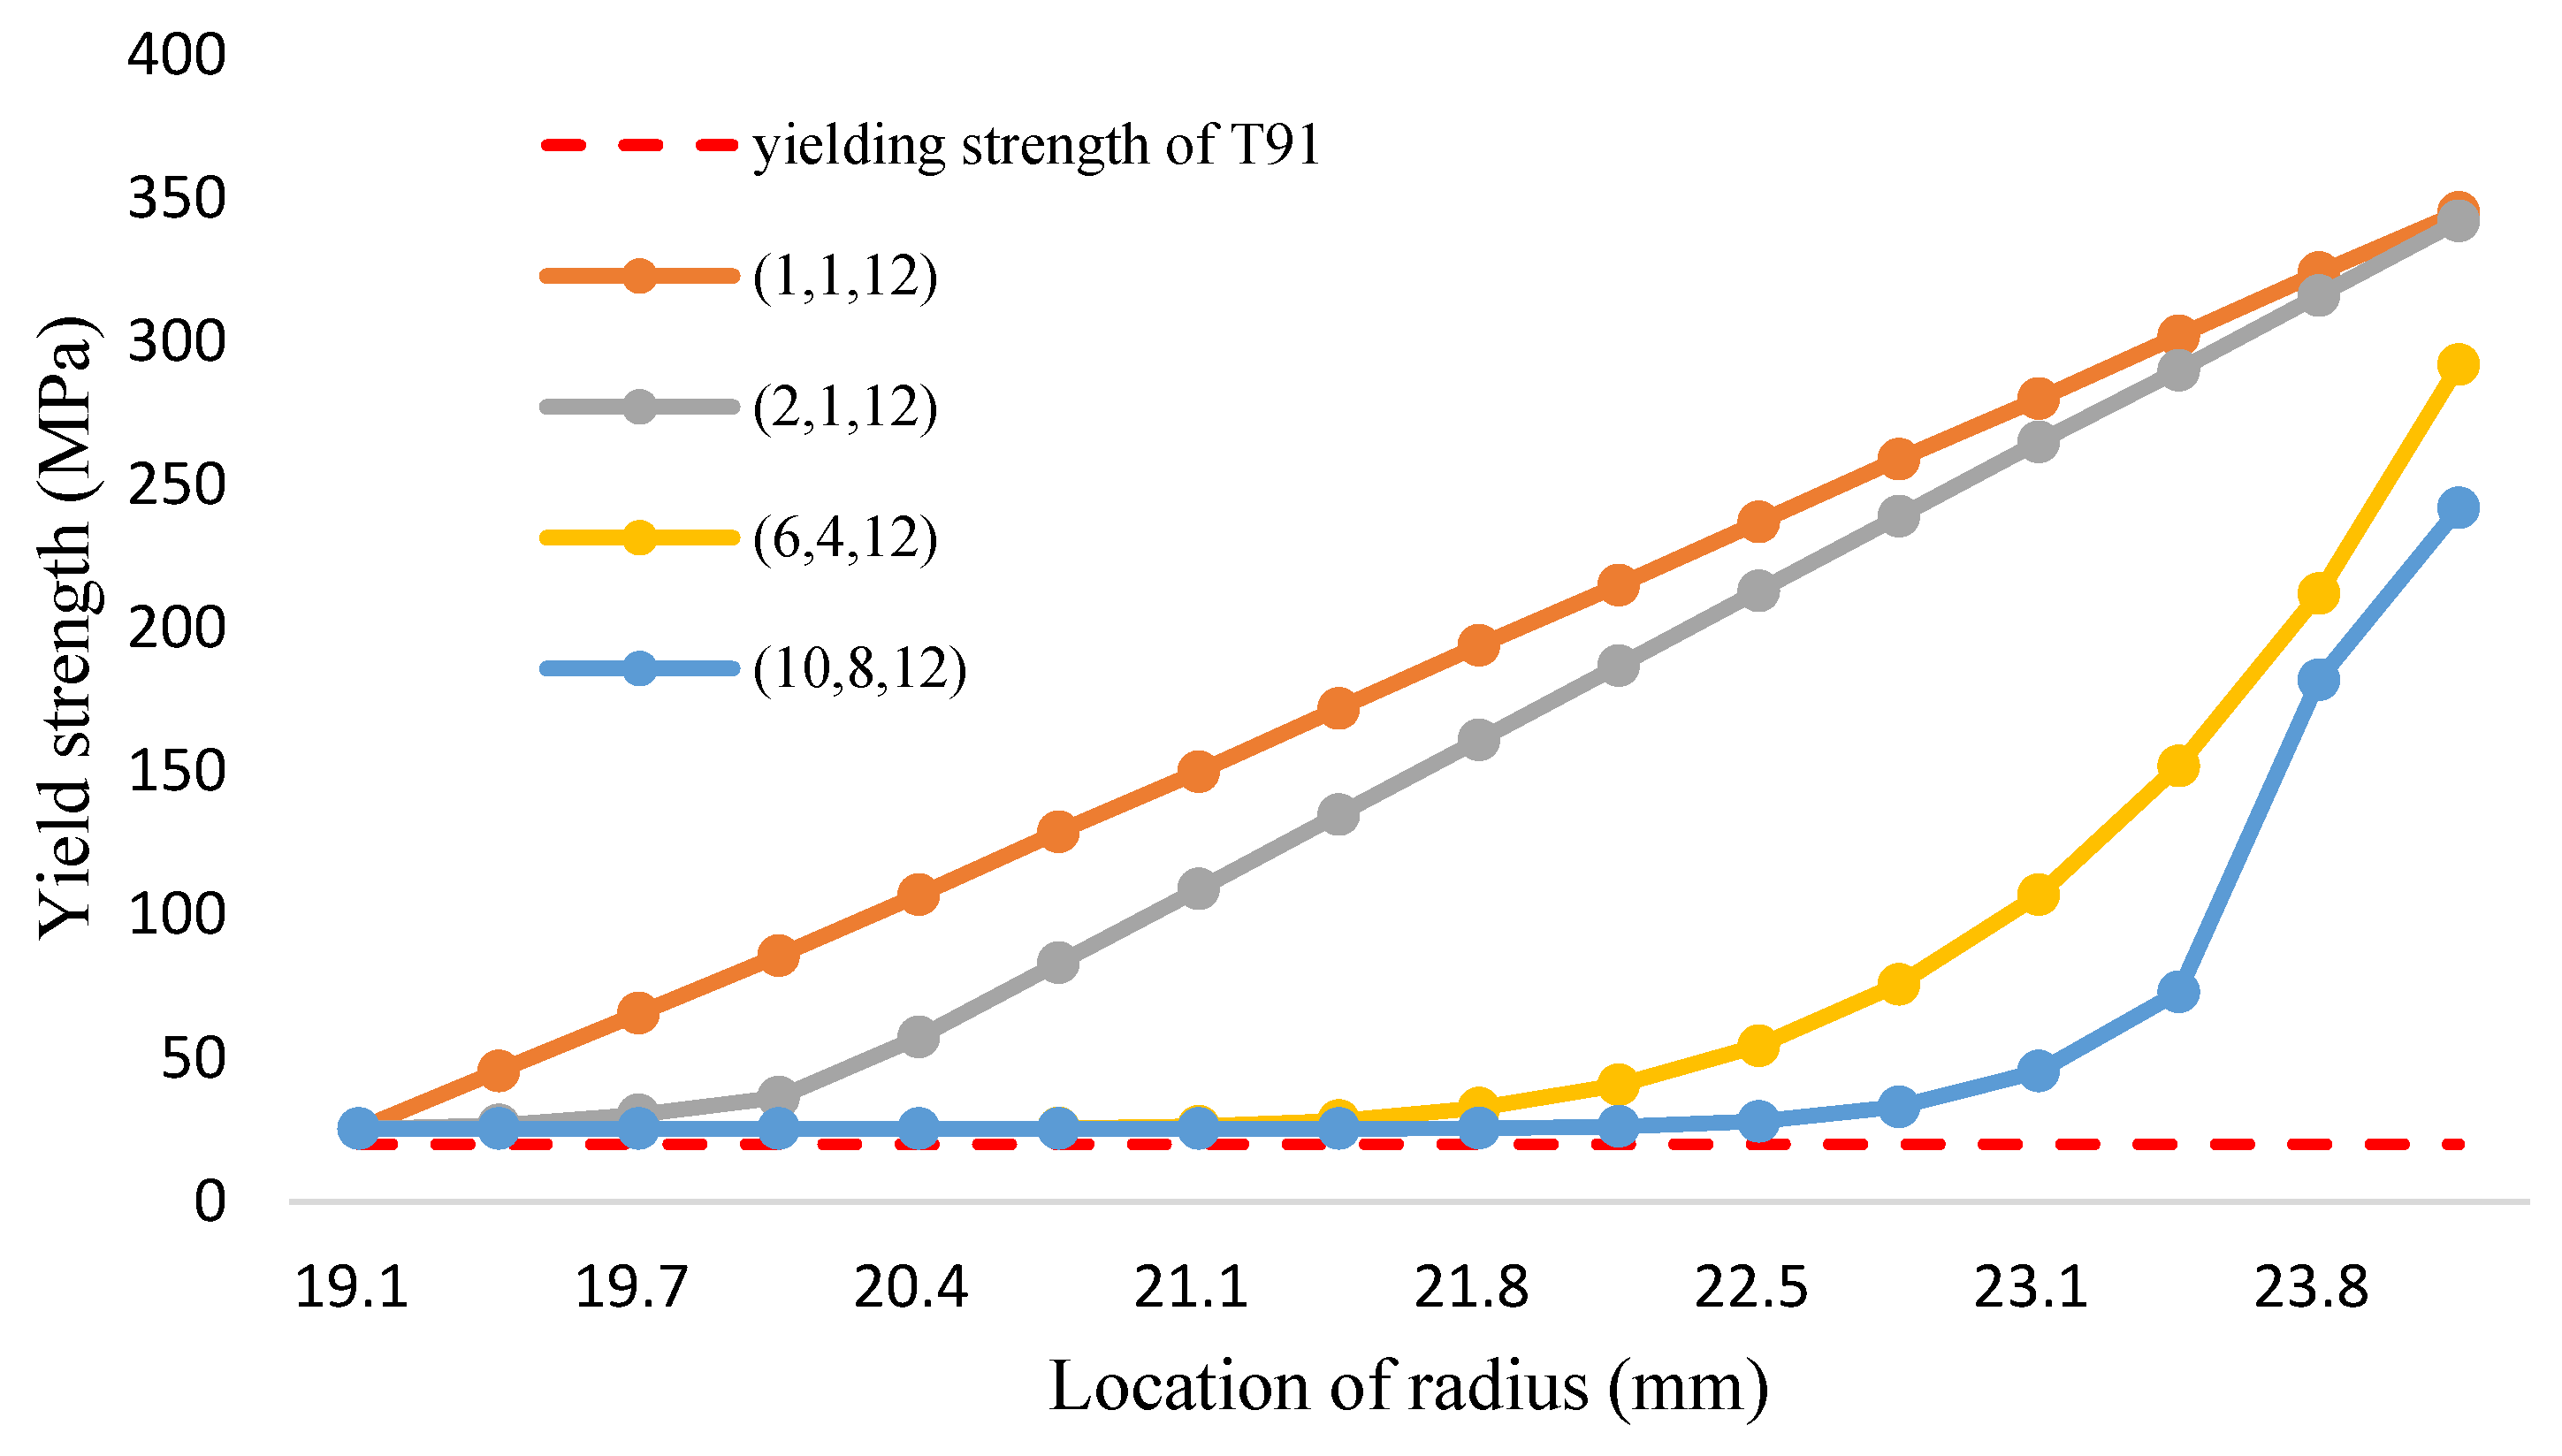
Figure 16.
The yield strength of FGM and T91 alloys (Fe-12Cr-2Si-TiO2-T91, Temperature: 1200 °C).
Figure 16.
The yield strength of FGM and T91 alloys (Fe-12Cr-2Si-TiO2-T91, Temperature: 1200 °C).
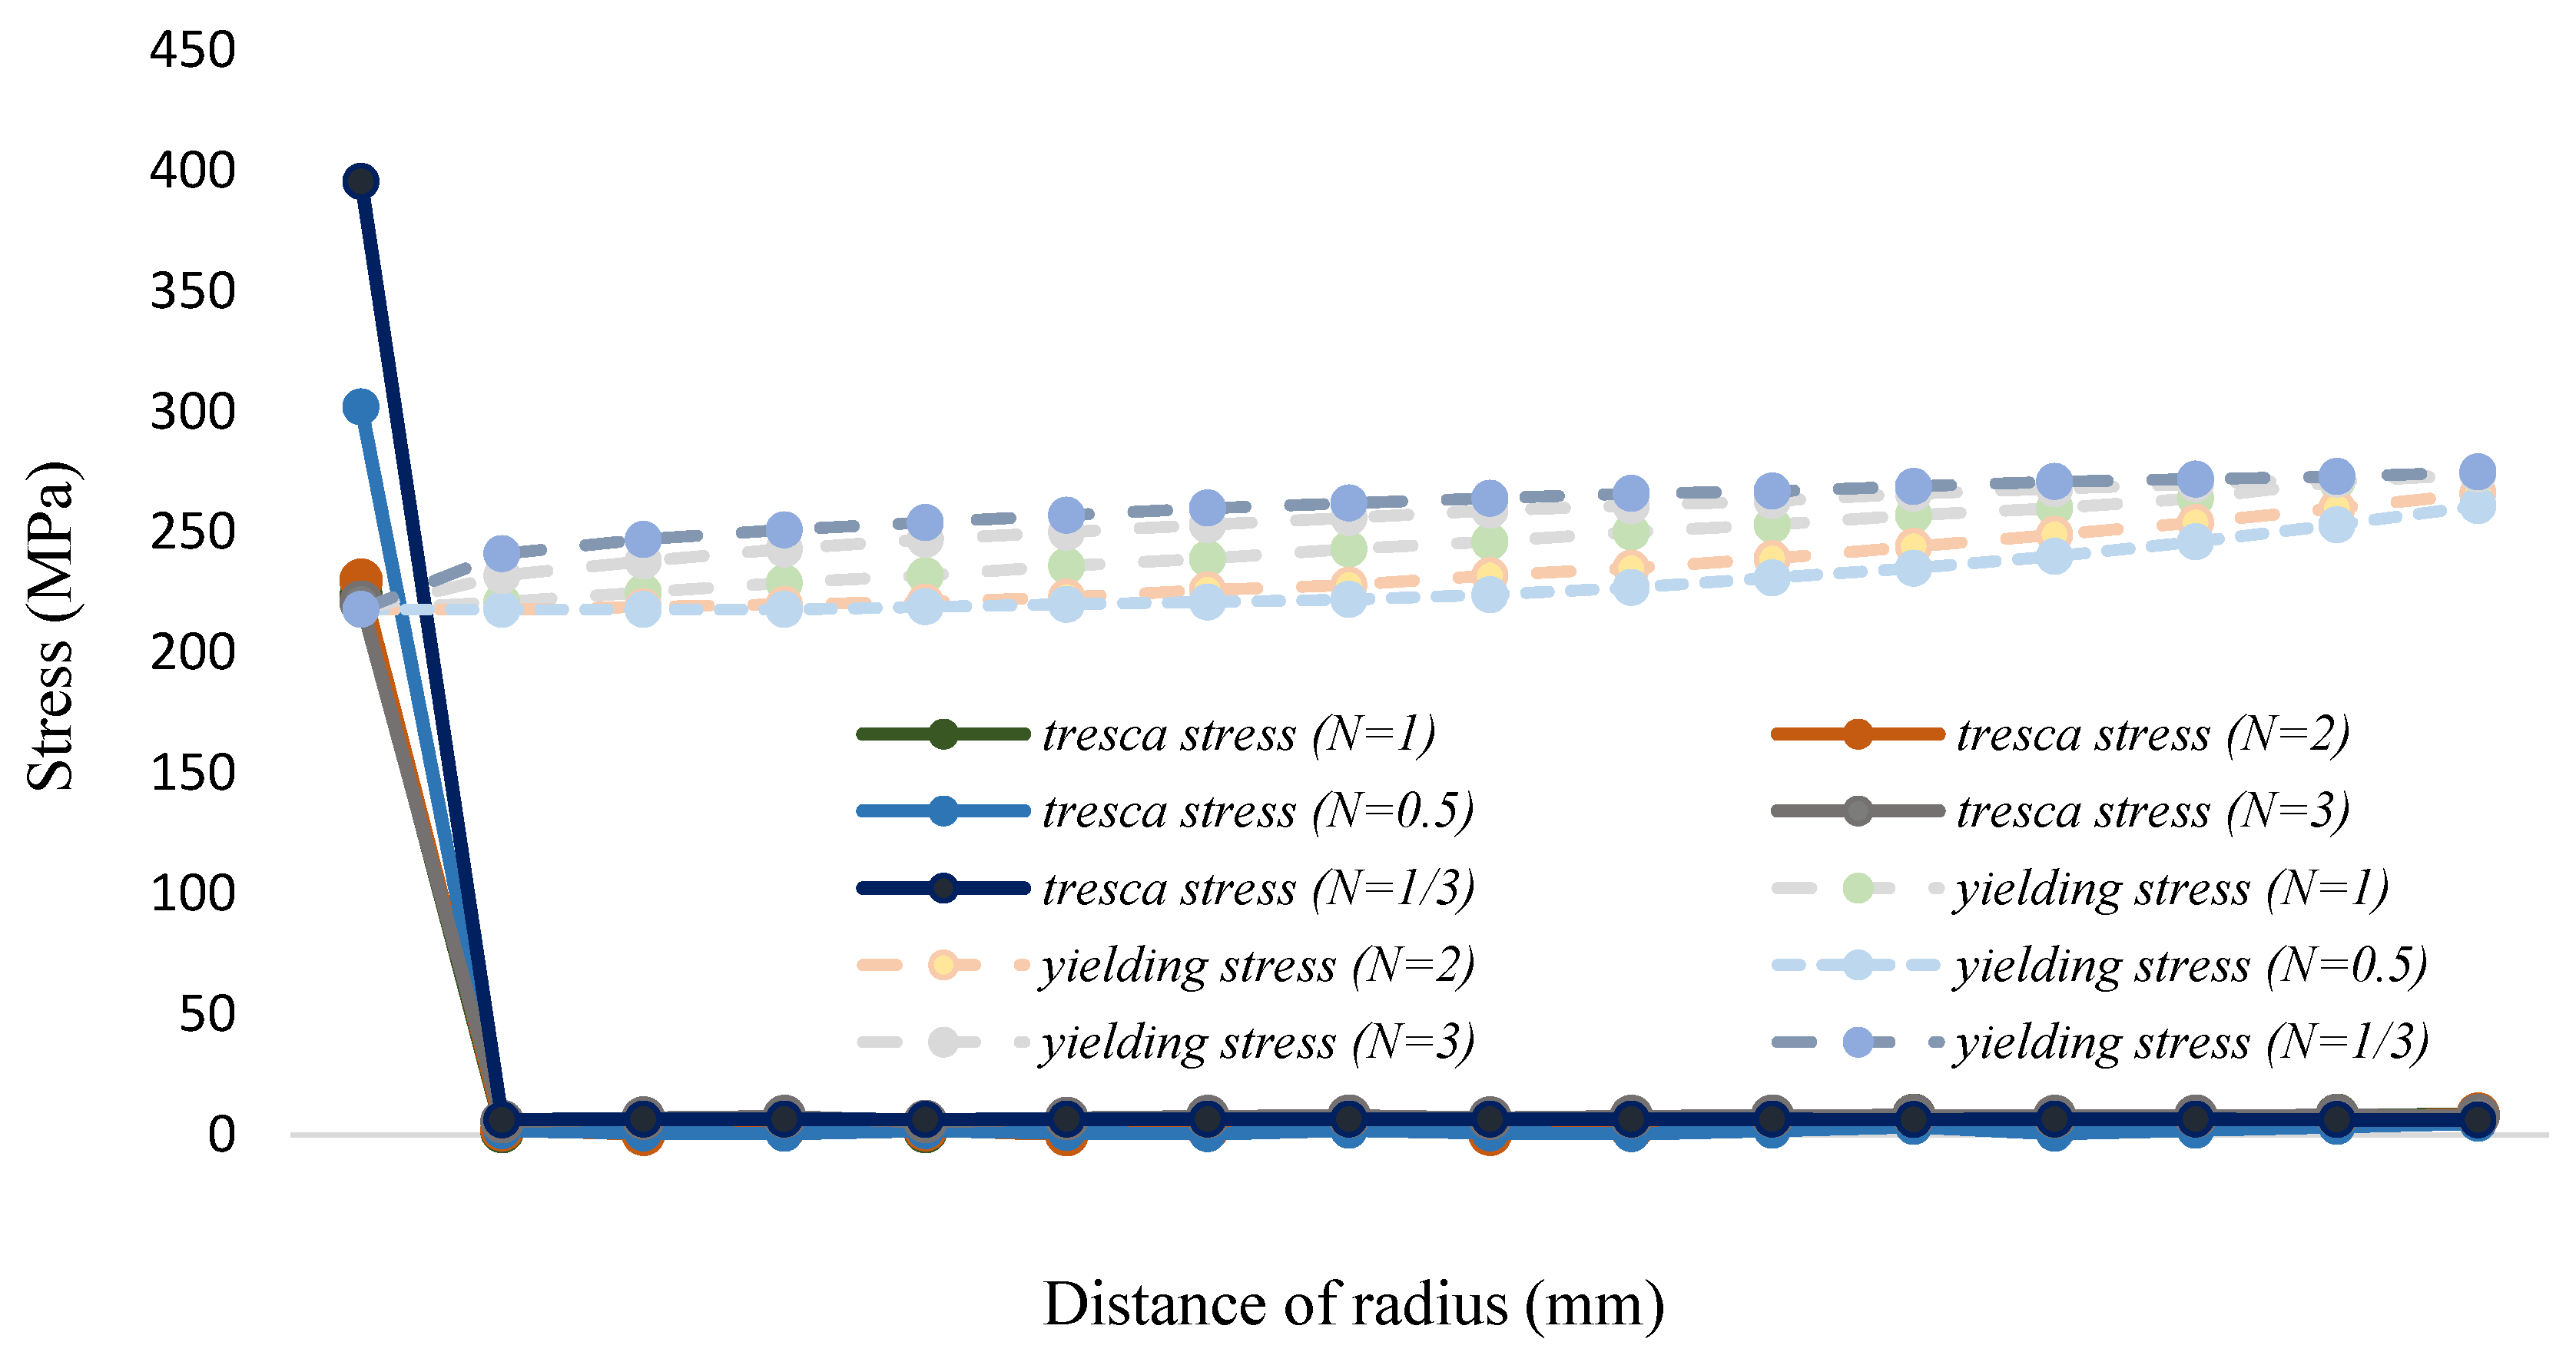
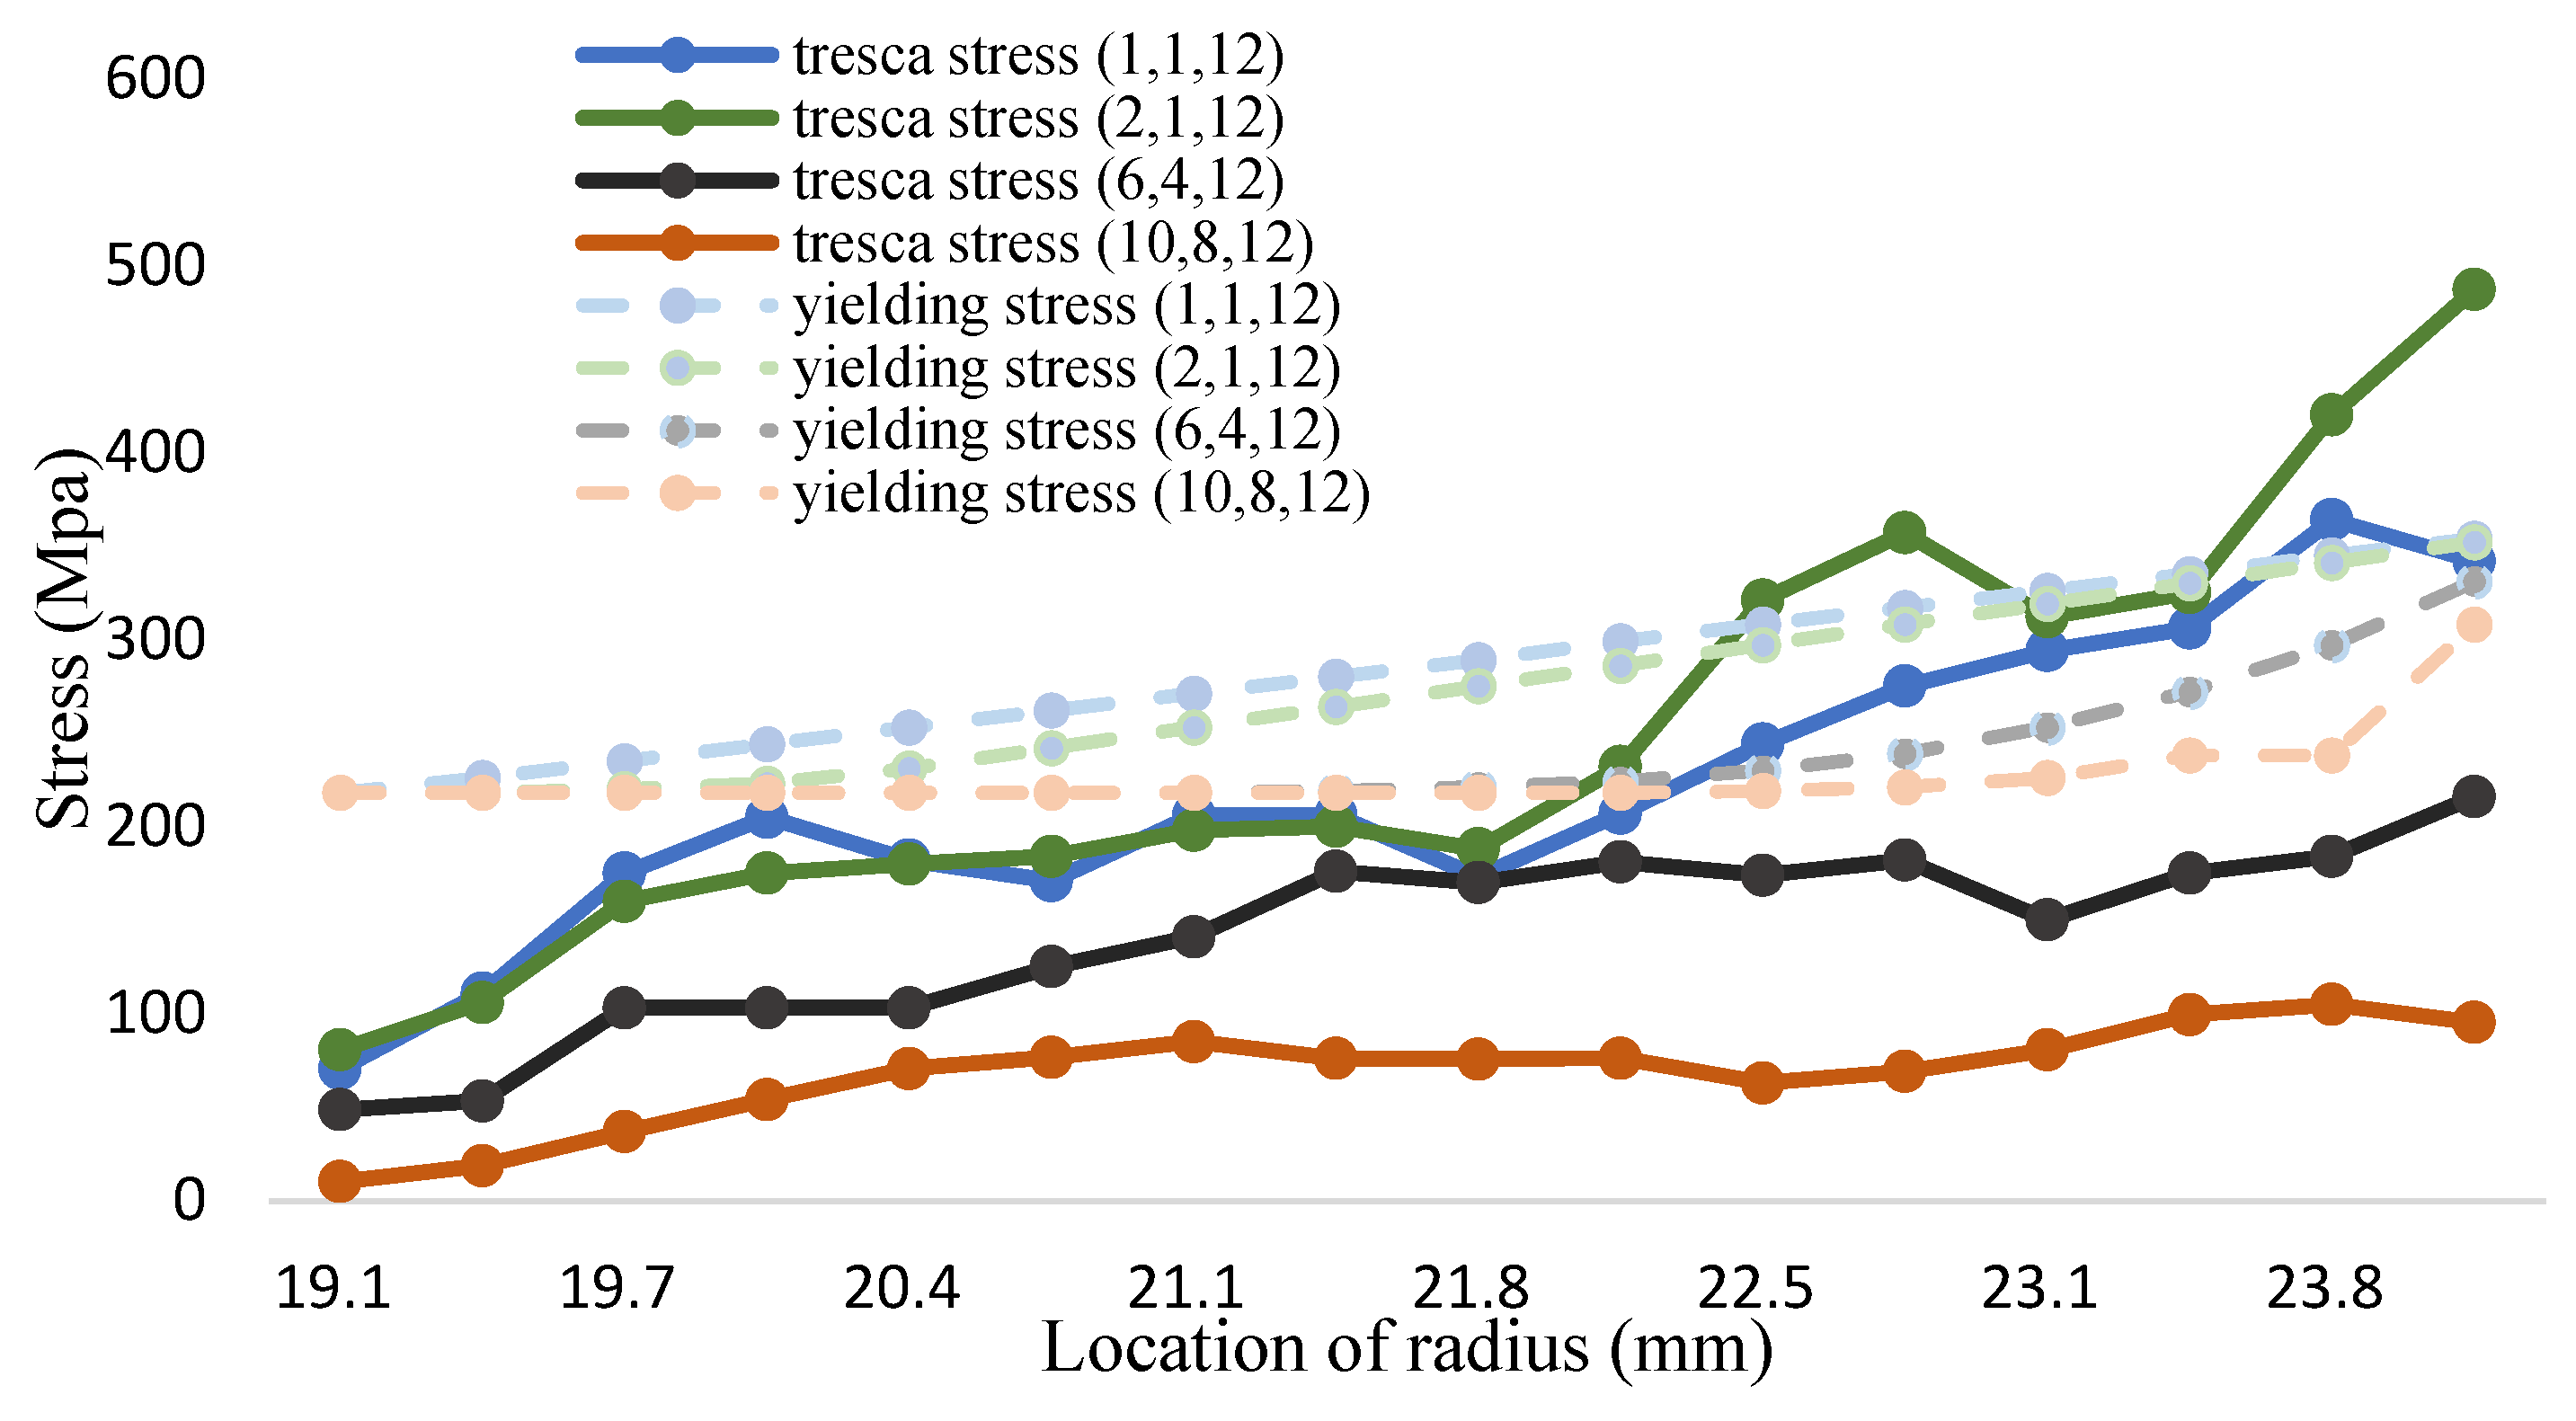
Figure 17.
The tresca stress and yield strength (Fe-12Cr-2Si-TiO2-T91, Unit: Mpa, Temperature: 700 °C).
Figure 17.
The tresca stress and yield strength (Fe-12Cr-2Si-TiO2-T91, Unit: Mpa, Temperature: 700 °C).
Figure 18.
The tresca stress and yield strength (Fe-12Cr-2Si-TiO2-T91, Unit: Mpa, Temperature: 1000 °C).
Figure 18.
The tresca stress and yield strength (Fe-12Cr-2Si-TiO2-T91, Unit: Mpa, Temperature: 1000 °C).
Figure 19.
The tresca stress and yield strength (Fe-12Cr-2Si-TiO2-T91, Unit: Mpa, Temperature: 1200 °C).
Figure 19.
The tresca stress and yield strength (Fe-12Cr-2Si-TiO2-T91, Unit: Mpa, Temperature: 1200 °C).
Figure 20.
The silicon concentration (Fe-12Cr-2Si-TiO2-T91, Temperature: 700 °C).
Figure 20.
The silicon concentration (Fe-12Cr-2Si-TiO2-T91, Temperature: 700 °C).
Figure 21.
The silicon concentration (Fe-12Cr-2Si-TiO2-T91, Temperature: 1000 °C).
Figure 21.
The silicon concentration (Fe-12Cr-2Si-TiO2-T91, Temperature: 1000 °C).
Figure 22.
The silicon concentration (Fe-12Cr-2Si-TiO2-T91, Temperature: 1200 °C).
Figure 22.
The silicon concentration (Fe-12Cr-2Si-TiO2-T91, Temperature: 1200 °C).
Figure 23.
The margin of safety for three-phase model (Fe-12Cr-2Si-TiO2-T91, volume of mixture: (10,8,12)).
Figure 23.
The margin of safety for three-phase model (Fe-12Cr-2Si-TiO2-T91, volume of mixture: (10,8,12)).
| | Elastic Modulus | Poisson Ratio | Thermal Expansion | Bulk Modulus |
|---|
| Fe12Cr2Si | 216.4 (GPa) | 0.31 | 5.2 × 10⁻⁵(1/K) | 1.89 × 10¹¹ |
| T91 | - | 0.27 | 1.3 × 10⁻⁵ (1/K) | 1.73 × 10¹¹ |
| TiO2 | 230 (GPa) | 0.27 | 9 × 10⁻⁶ (1/K) | 1.67 × 10¹¹ |
| LBE | 92.8 (MPa) | 0.4995 | 1.285 × 10⁻⁴ (1/K) | 3.093 × 10¹⁰ |
Table 2.
The research targets.
Table 2.
The research targets.
| | 700 °C | 1000 °C | 1200 °C |
|---|
| High-Strength (margin of safety) | ≥98% | ≥98% | ≥98% |
| High-temperature resistance (wt.%) | - | ≥1.25 wt.% | ≥1.25 wt.% |
| Corrosion testing (wt.%) | ≥1.25 wt.% | - | - |
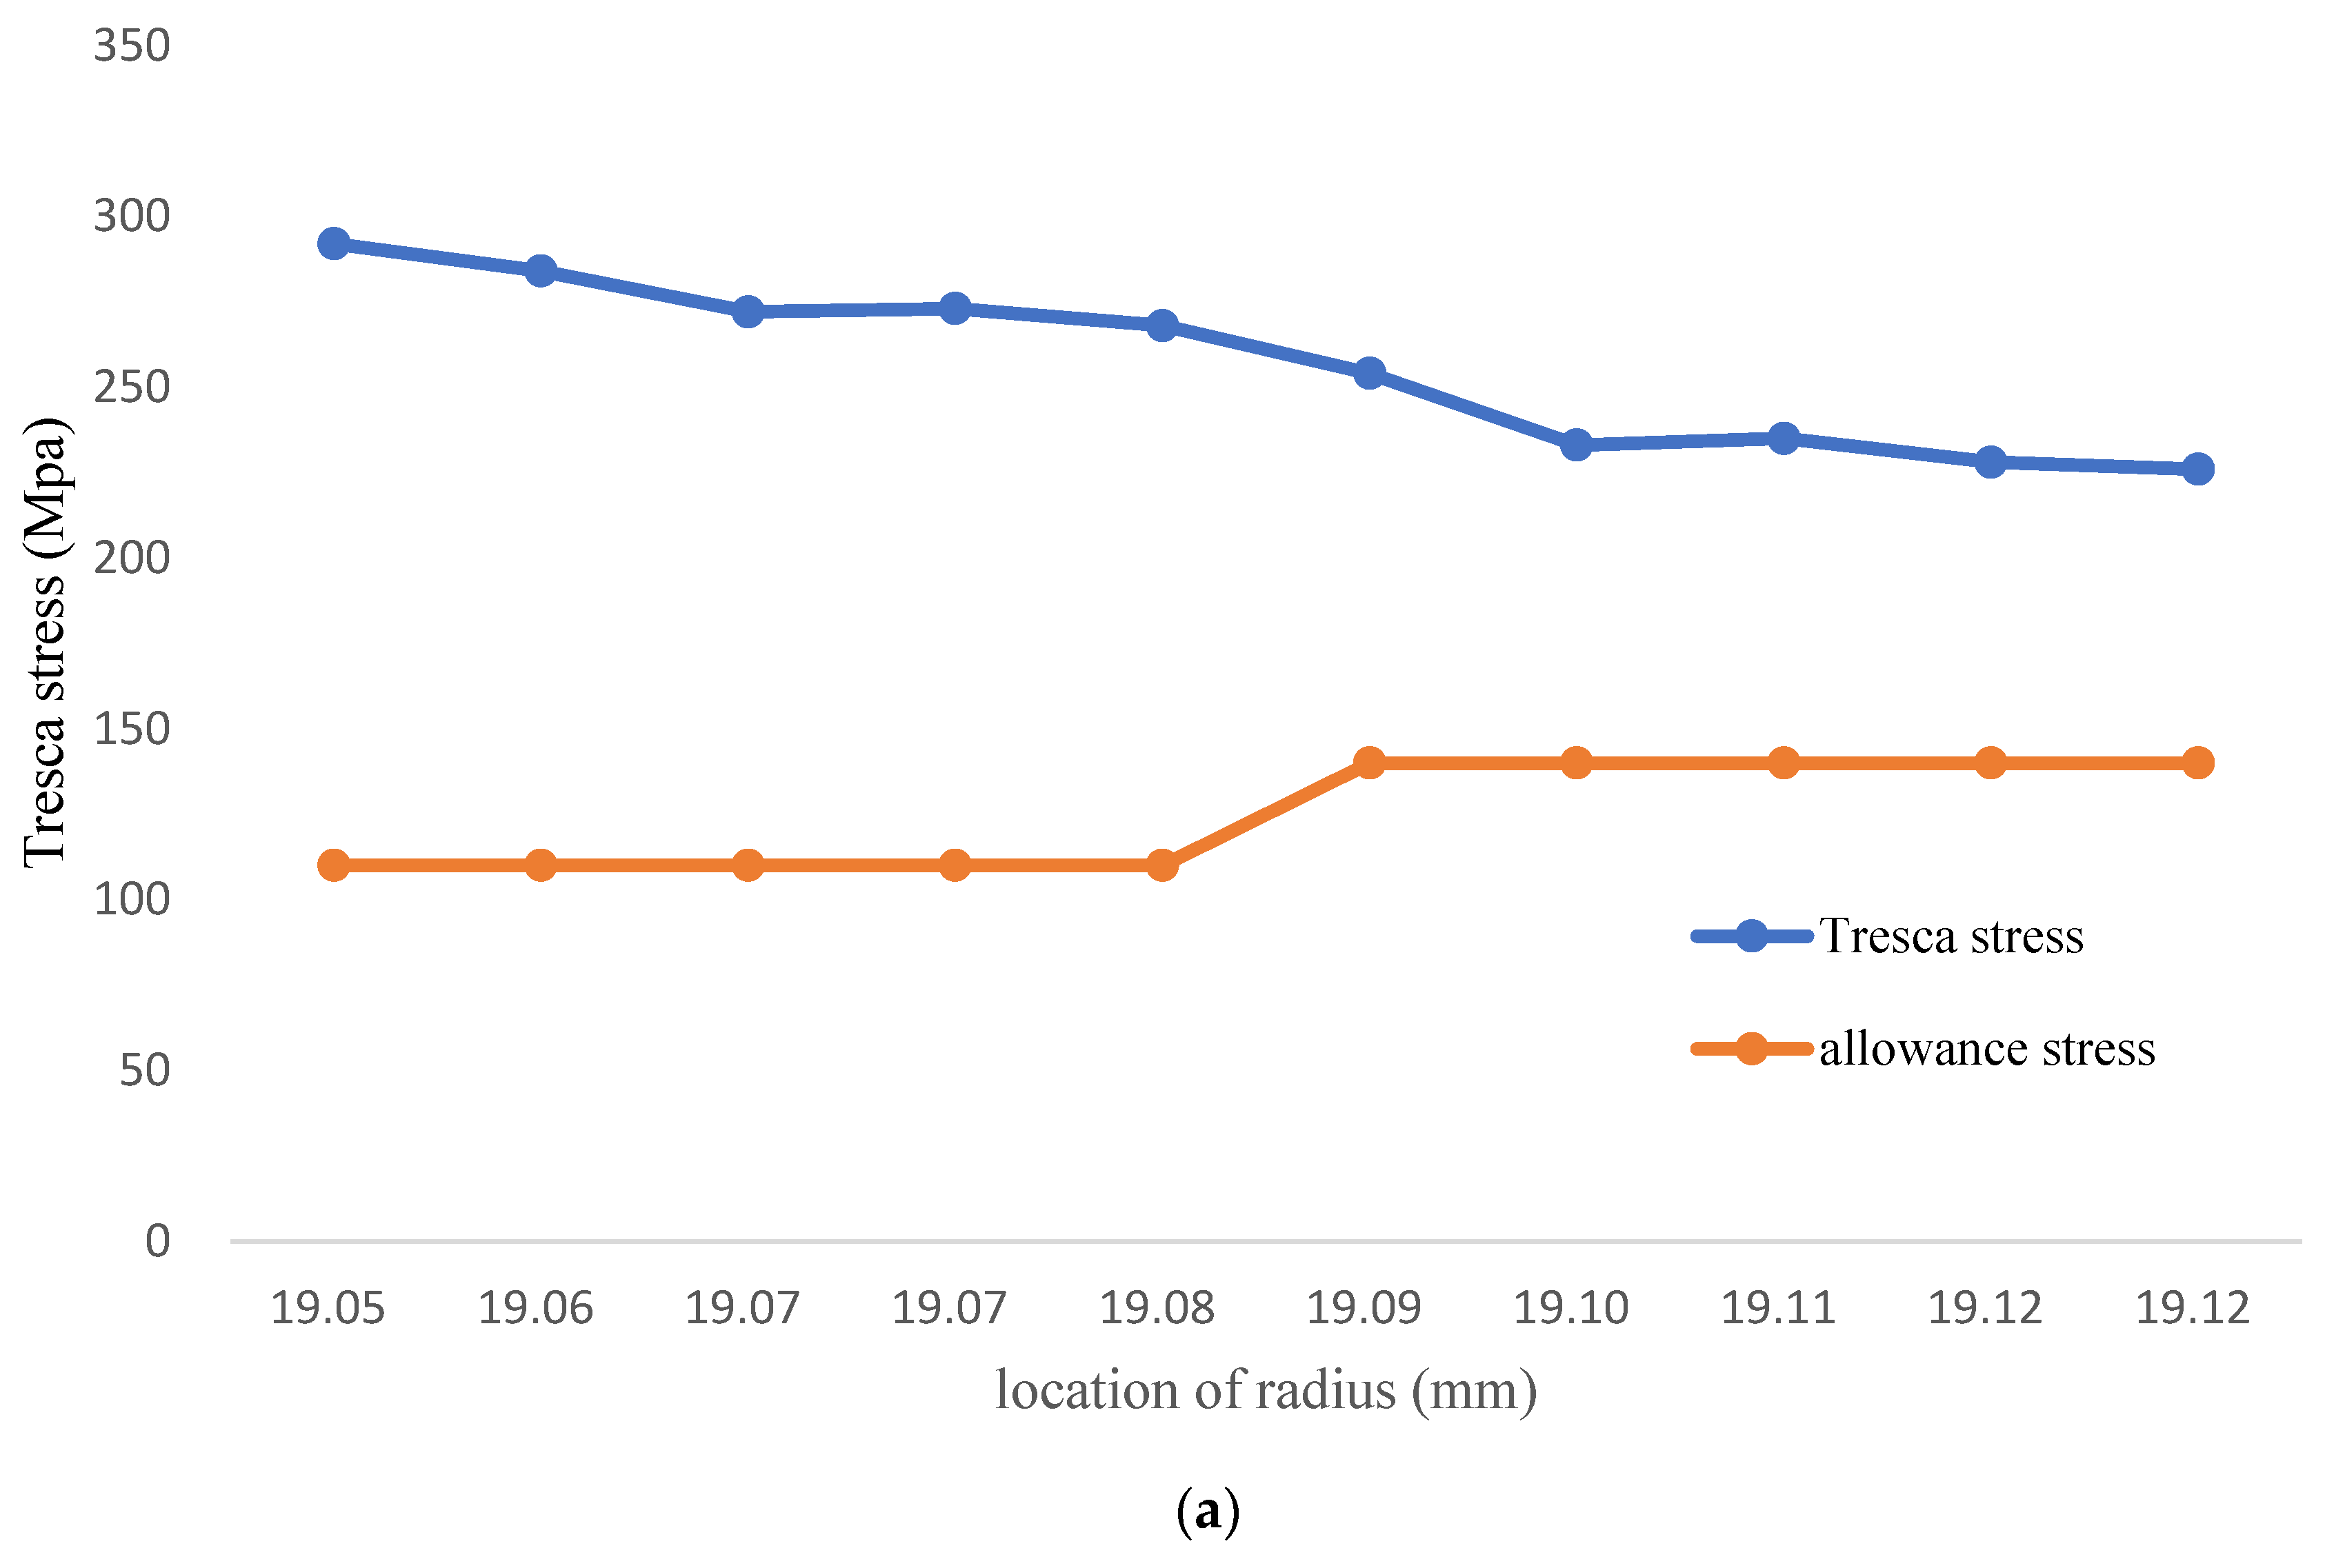
Table 3.
The tresca stress and allowance strength (FGC, Temprature: 700 °C).
Table 3.
The tresca stress and allowance strength (FGC, Temprature: 700 °C).
| Location (mm) | 19.05 | 19.05 | 19.06 | 19.07 | 19.08 | 19.09 | 19.09 | 19.10 | 19.11 | 19.12 |
|---|
| Allowance | 110.0 | 110.0 | 110.0 | 110.0 | 110.0 | 140.0 | 140.0 | 140.0 | 140.0 | 140.0 |
| Tresca stress | 292.00 | 284.00 | 272.00 | 273.00 | 268.00 | 254.00 | 233.00 | 235.00 | 228.00 | 226.00 |
Table 4.
The tresca stress and allowance strength (FGC, Temprature: 1000 °C).
Table 4.
The tresca stress and allowance strength (FGC, Temprature: 1000 °C).
| Location (mm) | 19.05 | 19.05 | 19.06 | 19.07 | 19.08 | 19.09 | 19.09 | 19.10 | 19.11 | 19.12 |
|---|
| Allowance | 51.76 | 51.76 | 51.76 | 51.76 | 51.76 | 71.65 | 71.65 | 71.65 | 71.65 | 71.65 |
| Tresca stress | 215.84 | 213.76 | 213.68 | 203.59 | 203.50 | 198.41 | 195.33 | 190.24 | 178.15 | 178.07 |
Table 5.
Tresca stress and allowable strength (FGC, Temprature: 1200 °C).
Table 5.
Tresca stress and allowable strength (FGC, Temprature: 1200 °C).
| Location (mm) | 19.05 | 19.05 | 19.06 | 19.07 | 19.08 | 19.09 | 19.09 | 19.10 | 19.11 | 19.12 |
|---|
| Allowance | 12.90 | 12.90 | 12.90 | 12.90 | 12.90 | 26.30 | 26.30 | 26.30 | 26.30 | 26.30 |
| Tresca stress | 90.90 | 88.09 | 86.07 | 84.16 | 80.25 | 78.34 | 75.42 | 74.51 | 73.60 | 73.68 |
Table 6.
FGC the location of 1.25 wt.%—time relation (Temprature: 700 °C).
Table 6.
FGC the location of 1.25 wt.%—time relation (Temprature: 700 °C).
| Time (105 h) | 0.00 | 1.11 | 2.23 | 3.34 | 4.45 | 5.57 | 6.66 | 7.78 | 8.89 | 10.00 |
|---|
| simulation | 0.758 | 24.613 | 27.898 | 30.651 | 31.184 | 32.598 | 32.936 | 33.224 | 34.470 | 35.688 |
| Curve-fitting | 0.00 | 24.70 | 28.56 | 30.82 | 32.42 | 33.67 | 34.69 | 35.55 | 36.30 | 36.96 |
Table 7.
FGC concentration-time distribution.
Table 7.
FGC concentration-time distribution.
| Time (105 h) | 0.00 | 0.87 | 1.75 | 2.62 | 3.50 | 4.38 | 5.25 | 6.13 | 7.00 | 7.88 |
|---|
| T = 700 °C | 2.101 | 1.661 | 1.523 | 1.432 | 1.364 | 1.310 | 1.265 | 1.226 | 1.193 | 1.163 |
| T = 1000 °C | 2.101 | 0.539 | 0.538 | 0.538 | 0.538 | 0.538 | 0.538 | 0.538 | 0.538 | 0.538 |
| T = 1200 °C | 2.101 | 0.509 | 0.508 | 0.508 | 0.508 | 0.498 | 0.498 | 0.498 | 0.498 | 0.498 |
Table 8.
The volume mixture of Fe-12Cr-2Si for two-phase FGM.
Table 8.
The volume mixture of Fe-12Cr-2Si for two-phase FGM.
| Location (mm) | 19.05 | 19.61 | 20.18 | 20.75 | 21.31 | 21.88 | 22.45 | 23.01 | 23.58 | 24.15 |
|---|
| N = 1 | 1 | 0.889 | 0.778 | 0.667 | 0.556 | 0.444 | 0.333 | 0.222 | 0.199 | 0.090 |
| N = 2 | 1 | 0.984 | 0.950 | 0.889 | 0.809 | 0.698 | 0.556 | 0.306 | 0.347 | 0.175 |
| N = 3 | 1 | 0.993 | 0.958 | 0.985 | 0.988 | 0.948 | 0.863 | 0.712 | 0.473 | 0.246 |
| N = 1/2 | 1 | 0.667 | 0.595 | 0.465 | 0.333 | 0.254 | 0.183 | 0.113 | 0.101 | 0.046 |
| N = 1/3 | 1 | 0.306 | 0.286 | 0.198 | 0.1497 | 0.119 | 0.072 | 0.041 | 0.068 | 0.031 |
Table 9.
The volume mixture of T91 for two-phase FGM.
Table 9.
The volume mixture of T91 for two-phase FGM.
| Location (mm) | 19.05 | 19.61 | 20.18 | 20.75 | 21.31 | 21.88 | 22.45 | 23.01 | 23.58 | 24.15 |
|---|
| N = 1 | 0 | 0.111 | 0.222 | 0.333 | 0.444 | 0.556 | 0.667 | 0.778 | 0.889 | 0.909 |
| N = 2 | 0 | 0.012 | 0.043 | 0.111 | 0.191 | 0.302 | 0.444 | 0.608 | 0.713 | 0.826 |
| N = 3 | 0 | 0.008 | 0.027 | 0.065 | 0.128 | 0.226 | 0.353 | 0.527 | 0.751 | 0.758 |
| N = 1/2 | 0 | 0.333 | 0.475 | 0.575 | 0.667 | 0.756 | 0.897 | 0.887 | 0.949 | 0.953 |
| N = 1/3 | 0 | 0.465 | 0.586 | 0.671 | 0.739 | 0.796 | 0.928 | 0.846 | 0.890 | 0.968 |
Table 10.
The yield strength of the two-phase model (Unit: MPa, Temp: 700 °C).
Table 10.
The yield strength of the two-phase model (Unit: MPa, Temp: 700 °C).
| Location (mm) | 19.05 | 19.61 | 20.18 | 20.75 | 21.31 | 21.88 | 22.45 | 23.01 | 23.58 | 24.15 |
|---|
| N = 1 | 218.00 | 222.00 | 226.00 | 230.00 | 240.00 | 246.00 | 249.00 | 253.00 | 263.00 | 273.00 |
| N = 2 | 218.00 | 220.00 | 224.00 | 228.00 | 232.00 | 236.00 | 244.00 | 253.00 | 259.00 | 265.00 |
| N = 3 | 218.00 | 220.00 | 222.00 | 224.00 | 224.00 | 226.00 | 242.00 | 248.00 | 256.00 | 264.00 |
| N = 1/2 | 218.00 | 234.00 | 250.00 | 255.00 | 258.00 | 260.00 | 260.00 | 262.00 | 265.00 | 273.00 |
| N = 1/3 | 218.00 | 242.00 | 251.00 | 257.00 | 259.00 | 261.00 | 265.00 | 267.00 | 269.00 | 275.00 |
Table 11.
The Tresca stress and yield strength distribution (Fe-12Cr-2Si-T91, T = 700 °C).
Table 11.
The Tresca stress and yield strength distribution (Fe-12Cr-2Si-T91, T = 700 °C).
| Location (mm) | 19.05 | 19.61 | 20.18 | 20.75 | 21.31 | 21.88 | 22.45 | 23.01 | 23.58 | 24.15 |
|---|
| N = 1 | 223.50 | 1.34 | 4.28 | 6.22 | 4.14 | 7.24 | 4.29 | 6.04 | 7.24 | 7.95 |
| N = 2 | 230.00 | 2.16 | 2.11 | 2.97 | 4.72 | 5.14 | 2.65 | 7.02 | 5.13 | 8.45 |
| N = 3 | 221.00 | 5.38 | 5.42 | 6.80 | 7.47 | 7.76 | 6.86 | 7.47 | 7.75 | 7.84 |
| N = 1/2 | 302.00 | 1.68 | 7.65 | 1.83 | 1.73 | 3.36 | 1.83 | 3.36 | 4.72 | 4.72 |
| N = 1/3 | 395.46 | 6.17 | 6.47 | 6.22 | 6.46 | 6.38 | 6.22 | 6.48 | 6.37 | 6.05 |
Table 12.
The silicon concentration of the two-phase model (Unit: wt.%, Temp: 700 °C).
Table 12.
The silicon concentration of the two-phase model (Unit: wt.%, Temp: 700 °C).
| Time (105 h) | 0 | 0.876 | 1.752 | 2.628 | 3.504 | 4.38 | 5.25 | 6.132 | 7.00 | 7.88 |
|---|
| N = 1 | 2.0997 | 1.1907 | 1.1907 | 1.1907 | 1.1907 | 1.1907 | 1.1907 | 1.1907 | 1.1907 | 1.1907 |
| N = 3 | 2.1064 | 1.7885 | 1.7885 | 1.7885 | 1.7885 | 1.7885 | 1.7885 | 1.7885 | 1.7885 | 1.7885 |
| N = 2 | 2.103 | 1.4847 | 1.4847 | 1.4847 | 1.4847 | 1.4847 | 1.4847 | 1.4847 | 1.4847 | 1.4847 |
| N = 1/2 | 2.0964 | 0.9039 | 0.9039 | 0.9039 | 0.9039 | 0.9039 | 0.9039 | 0.9039 | 0.9039 | 0.9039 |
| N = 1/3 | 2.0926 | 0.6236 | 0.6236 | 0.6236 | 0.6236 | 0.6236 | 0.6236 | 0.6236 | 0.6236 | 0.6236 |
Table 13.
The volume mixture of T91 for three-phase FGM.
Table 13.
The volume mixture of T91 for three-phase FGM.
| Location (mm) | 23.86 | 23.88 | 23.92 | 23.96 | 23.98 | 24.00 | 24.04 | 24.06 | 24.10 | 24.15 |
|---|
| Volume of mixture | 0.00 | 0.00 | 0.00 | 0.00 | 2.92 × 10⁻⁵ | 1.39 × 10⁻⁴ | 5.52 × 10⁻⁴ | 1.62 × 10⁻² | 4.16 × 10⁻² | 0.1 |
Table 14.
The volume mixture of Fe12Cr2Si for three-phase FGM.
Table 14.
The volume mixture of Fe12Cr2Si for three-phase FGM.
| Location (mm) | 19.05 | 19.57 | 20.08 | 20.59 | 21.10 | 21.61 | 22.12 | 22.63 | 23.14 | 23.86 |
|---|
| (1,1,12) | 1.00 | 0.89 | 0.79 | 0.69 | 0.58 | 0.47 | 0.36 | 0.26 | 0.15 | 0.04 |
| (2,1,12) | 1.00 | 0.98 | 0.95 | 0.82 | 0.69 | 0.56 | 0.44 | 0.31 | 0.18 | 0.05 |
| (6,4,12) | 1.00 | 0.99 | 0.98 | 0.98 | 0.98 | 0.97 | 0.91 | 0.79 | 0.56 | 0.20 |
| (10,8,12) | 1.00 | 1.00 | 1.00 | 1.00 | 0.99 | 0.98 | 0.98 | 0.95 | 0.81 | 0.36 |
Table 15.
The volume mixture of TiO2 for three-phase FGM.
Table 15.
The volume mixture of TiO2 for three-phase FGM.
| Location (mm) | 19.05 | 19.61 | 20.18 | 20.75 | 21.31 | 21.88 | 22.45 | 23.01 | 23.58 | 24.15 |
|---|
| (1,1,12) | 0.00 | 0.1002 | 0.2006 | 0.3084 | 0.4163 | 0.5242 | 0.6320 | 0.7399 | 0.8477 | 0.9556 |
| (2,1,12) | 0.00 | 0.1004 | 0.0436 | 0.1726 | 0.3017 | 0.4307 | 0.5597 | 0.6888 | 0.8178 | 0.9469 |
| (6,4,12) | 0.00 | 1.01 × 10⁻⁶ | 5.74 × 10⁻⁵ | 4.36 × 10⁻⁴ | 5.67 × 10⁻³ | 0.02774 | 0.0864 | 0.2093 | 0.4317 | 0.7967 |
| (10,8,12) | 0.00 | 1.02 × 10⁻¹⁰ | 8.54 × 10⁻⁸ | 2.29 × 10⁻⁷ | 3.16 × 10⁻⁵ | 7.67 × 10⁻⁴ | 7.67 × 10⁻⁴ | 0.0437 | 0.1863 | 0.6348 |
Table 16.
The yield strength of FGM and T91 alloys (Fe-12Cr-2Si-TiO2-T91, Temperature: 700 °C, Unit: Mpa).
Table 16.
The yield strength of FGM and T91 alloys (Fe-12Cr-2Si-TiO2-T91, Temperature: 700 °C, Unit: Mpa).
| Location (mm) | 19.05 | 19.61 | 20.18 | 20.75 | 21.31 | 21.88 | 22.45 | 23.01 | 23.58 | 24.15 |
|---|
| (1,1,12) | 218.00 | 226.00 | 236.00 | 244.00 | 261.00 | 279.00 | 299.00 | 317.00 | 335.00 | 354.00 |
| (2,1,12) | 218.00 | 220.00 | 224.00 | 253.00 | 275.00 | 285.00 | 309.00 | 319.00 | 341.00 | 352.00 |
| (6,4,12) | 218.00 | 218.00 | 218.00 | 218.00 | 220.00 | 224.00 | 230.00 | 253.00 | 297.00 | 331.00 |
| (10,8,12) | 218.00 | 218.00 | 218.00 | 218.00 | 218.00 | 218.00 | 220.00 | 226.00 | 238.00 | 309.00 |
| Yt91 | 190.64 | 190.64 | 190.64 | 190.64 | 190.64 | 190.64 | 190.64 | 190.64 | 190.64 | 190.64 |
Table 17.
The yield strength of FGM and T91 alloys (Fe-12Cr-2Si-TiO2-T91, Temperature: 1000 °C, Unit: Mpa).
Table 17.
The yield strength of FGM and T91 alloys (Fe-12Cr-2Si-TiO2-T91, Temperature: 1000 °C, Unit: Mpa).
| Location (mm) | 19.05 | 19.61 | 20.18 | 20.75 | 21.31 | 21.88 | 22.45 | 23.01 | 23.58 | 24.15 |
|---|
| (1,1,12) | 102.00 | 118.00 | 133.00 | 182.00 | 215.00 | 232.00 | 265.00 | 299.00 | 332.00 | 349.00 |
| (2,1,12) | 102.00 | 103.00 | 127.00 | 147.00 | 167.00 | 207.00 | 227.00 | 267.00 | 287.00 | 346.00 |
| (6,4,12) | 102.00 | 102.00 | 102.00 | 102.00 | 103.00 | 103.00 | 105.00 | 114.00 | 141.00 | 308.00 |
| (10,8,12) | 102.00 | 102.00 | 102.00 | 102.00 | 102.00 | 102.00 | 103.00 | 108.00 | 139.00 | 266.00 |
| Yt91 | 80.35 | 80.35 | 80.35 | 80.35 | 80.35 | 80.35 | 80.35 | 80.35 | 80.35 | 80.35 |
Table 18.
The yield strength of FGM and T91 alloys (Fe-12Cr-2Si-TiO2-T91, Temperature: 1200 °C, Unit: Mpa).
Table 18.
The yield strength of FGM and T91 alloys (Fe-12Cr-2Si-TiO2-T91, Temperature: 1200 °C, Unit: Mpa).
| Location (mm) | 19.05 | 19.61 | 20.18 | 20.75 | 21.31 | 21.88 | 22.45 | 23.01 | 23.58 | 24.15 |
|---|
| (1,1,12) | 25.50 | 45.60 | 85.80 | 107.00 | 129.00 | 172.00 | 194.00 | 215.00 | 280.00 | 345.00 |
| (2,1,12) | 25.50 | 26.70 | 36.40 | 83.30 | 109.00 | 135.00 | 161.00 | 187.00 | 239.00 | 342.00 |
| (6,4,12) | 25.50 | 25.50 | 25.50 | 25.50 | 26.30 | 28.20 | 32.60 | 75.80 | 107.00 | 292.00 |
| (10,8,12) | 25.50 | 25.50 | 25.50 | 25.50 | 25.50 | 25.50 | 25.60 | 28.00 | 45.50 | 242.00 |
| Yt91 | 20.54 | 20.54 | 20.54 | 20.54 | 20.54 | 20.54 | 20.54 | 20.54 | 20.54 | 20.54 |
Table 19.
The tresca stress and yield strength (Fe-12Cr-2Si-TiO2-T91, Unit: Mpa, Temp: 700 °C).
Table 19.
The tresca stress and yield strength (Fe-12Cr-2Si-TiO2-T91, Unit: Mpa, Temp: 700 °C).
| Location (mm) | 19.05 | 19.61 | 20.18 | 20.75 | 21.31 | 21.88 | 22.45 | 23.01 | 23.58 | 24.15 |
|---|
| (1,1,12) | 70.58 | 111.00 | 175.00 | 171.00 | 244.00 | 275.00 | 294.00 | 306.00 | 364.00 | 342.00 |
| (2,1,12) | 80.57 | 106.00 | 160.00 | 180.00 | 198.00 | 188.00 | 232.00 | 357.00 | 325.00 | 487.00 |
| (6,4,12) | 48.70 | 53.30 | 103.00 | 125.00 | 141.00 | 170.00 | 181.00 | 174.00 | 182.00 | 216.00 |
| (10,8,12) | 10.21 | 18.70 | 36.80 | 76.60 | 85.00 | 76.00 | 75.70 | 76.20 | 69.10 | 95.20 |
Table 20.
The tresca stress and yield strength (Fe-12Cr-2Si-TiO2-T91, Unit: Mpa, Temp: 1000 °C).
Table 20.
The tresca stress and yield strength (Fe-12Cr-2Si-TiO2-T91, Unit: Mpa, Temp: 1000 °C).
| Location (mm) | 19.05 | 19.61 | 20.18 | 20.75 | 21.31 | 21.88 | 22.45 | 23.01 | 23.58 | 24.15 |
|---|
| (1,1,12) | 105.00 | 198.00 | 225.00 | 252.00 | 245.00 | 258.00 | 262.00 | 305.00 | 330.00 | 332.00 |
| (2,1,12) | 145.00 | 153.00 | 185.00 | 195.00 | 234.00 | 308.00 | 315.00 | 325.00 | 348.00 | 383.00 |
| (6,4,12) | 46.90 | 102.00 | 93.30 | 99.30 | 136.00 | 132.00 | 141.00 | 154.00 | 175.00 | 216.00 |
| (10,8,12) | 0.00 | 36.90 | 41.70 | 37.70 | 43.50 | 48.20 | 41.60 | 45.90 | 52.10 | 109.00 |
Table 21.
The tresca stress and yield strength (Fe-12Cr-2Si-TiO2-T91, Unit: Mpa, Temperature: 1200 °C).
Table 21.
The tresca stress and yield strength (Fe-12Cr-2Si-TiO2-T91, Unit: Mpa, Temperature: 1200 °C).
| Location (mm) | 19.05 | 19.61 | 20.18 | 20.75 | 21.31 | 21.88 | 22.45 | 23.01 | 23.58 | 24.15 |
|---|
| (1,1,12) | 122.49 | 292.00 | 319.00 | 326.00 | 358.00 | 423.00 | 430.00 | 438.00 | 480.00 | 583.00 |
| (2,1,12) | 102.01 | 230.00 | 302.00 | 333.00 | 352.00 | 385.00 | 403.00 | 414.00 | 485.00 | 502.00 |
| (6,4,12) | 0.00 | 53.30 | 129.00 | 169.00 | 176.00 | 153.00 | 155.00 | 139.00 | 175.00 | 216.00 |
| (10,8,12) | 12.79 | 12.10 | 12.10 | 11.90 | 11.90 | 10.60 | 12.20 | 13.40 | 24.30 | 58.00 |
Table 22.
The silicon concentration (Fe-12Cr-2Si-TiO2-T91, Temperature: 700 °C, Unit: wt.%).
Table 22.
The silicon concentration (Fe-12Cr-2Si-TiO2-T91, Temperature: 700 °C, Unit: wt.%).
| Time (105 h) | 0 | 0.876 | 1.752 | 2.628 | 3.504 | 4.38 | 5.25 | 6.132 | 7.00 | 7.88 |
|---|
| (1,1,12) | 2.0988 | 1.7930 | 1.7928 | 1.7925 | 1.7923 | 1.7921 | 1.7919 | 1.7917 | 1.7916 | 1.7914 |
| (2,1,12) | 2.1005 | 1.8397 | 1.8397 | 1.8396 | 1.8395 | 1.8392 | 1.8389 | 1.8381 | 1.8376 | 1.8373 |
| (6,4,12) | 2.1060 | 1.9965 | 1.9963 | 1.9958 | 1.9953 | 1.9950 | 1.9947 | 1.9943 | 1.9941 | 1.9937 |
| (10,8,12) | 2.1076 | 2.0419 | 2.0414 | 2.0399 | 2.0397 | 2.0392 | 2.0389 | 2.0388 | 2.0385 | 2.0384 |
Table 23.
The silicon concentration (Fe-12Cr-2Si-TiO2-T91, Temperature: 1000 °C, Unit: wt.%).
Table 23.
The silicon concentration (Fe-12Cr-2Si-TiO2-T91, Temperature: 1000 °C, Unit: wt.%).
| Time (105 h) | 0 | 0.876 | 1.752 | 2.628 | 3.504 | 4.38 | 5.25 | 6.132 | 7.00 | 7.88 |
|---|
| (1,1,12) | 2.0988 | 1.7927 | 1.7923 | 1.7160 | 1.7912 | 1.7909 | 1.7905 | 1.7902 | 1.78991 | 1.7896 |
| (2,1,12) | 2.1005 | 1.8387 | 1.8391 | 1.8389 | 1.8383 | 1.8381 | 1.8372 | 1.8365 | 1.8358 | 1.8356 |
| (6,4,12) | 2.1060 | 1.9962 | 1.9944 | 1.9934 | 1.9924 | 1.9923 | 1.9921 | 1.9919 | 1.9918 | 1.9910 |
| (10,8,12) | 2.1060 | 1.9960 | 1.9944 | 1.9940 | 1.9919 | 1.9916 | 1.9913 | 1.9910 | 1.9908 | 1.9906 |
Table 24.
The silicon concentration (Fe-12Cr-2Si-TiO2-T91, Temperature: 1200 °C, Unit: wt.%).
Table 24.
The silicon concentration (Fe-12Cr-2Si-TiO2-T91, Temperature: 1200 °C, Unit: wt.%).
| Time (105 h) | 0 | 0.876 | 1.752 | 2.628 | 3.504 | 4.38 | 5.25 | 6.132 | 7.00 | 7.88 |
|---|
| (1,1,12) | 2.0988 | 1.7927 | 1.7823 | 1.7860 | 1.7812 | 1.7809 | 1.7805 | 1.7802 | 1.78991 | 1.7896 |
| (2,1,12) | 2.1005 | 1.8387 | 1.8391 | 1.8389 | 1.8383 | 1.8381 | 1.8372 | 1.8365 | 1.8358 | 1.8356 |
| (6,4,12) | 2.1060 | 1.9940 | 1.9920 | 1.9870 | 1.9850 | 1.9810 | 1.9780 | 1.9770 | 1.9760 | 1.9760 |
| (10,8,12) | 2.1060 | 2.0350 | 2.0340 | 2.0310 | 2.0270 | 2.0260 | 2.0240 | 2.0220 | 2.0210 | 2.0190 |
Table 25.
The margin of safety for three-phase model (Fe-12Cr-2Si-TiO2-T91, volume of mixture: (10,8,12)).
Table 25.
The margin of safety for three-phase model (Fe-12Cr-2Si-TiO2-T91, volume of mixture: (10,8,12)).
| | 19.05 | 19.61 | 20.18 | 20.75 | 21.31 | 21.88 | 22.45 | 23.01 | 23.58 | 24.15 |
|---|
| 700 °C | 20.35 | 10.66 | 3.04 | 2.09 | 1.56 | 1.87 | 1.88 | 2.48 | 1.39 | 2.24 |
| 1000 °C | 5.69 | 1.76 | 1.40 | 1.71 | 1.34 | 1.12 | 1.16 | 1.27 | 2.38 | 1.44 |
| 1200 °C | 0.99 | 1.11 | 1.14 | 3.00 | 1.41 | 1.16 | 1.43 | 1.47 | 1.57 | 3.17 |


