Abstract
In this study, TiN films doped with different copper contents (TiCuN) were prepared by using direct current magnetron sputtering method. The effects of Cu doping on composition, structure, and mechanical properties of TiN films were studied by energy-dispersive spectroscopy (EDS), X-ray diffraction (XRD), a Vickers microhardnessmeter, and density functional theory (DFT). The results of experimental and DFT study showed that Cu mainly replaced Ti atoms in TiN to form replacement solid solution doping. When Cu replaced Ti in TiN, a weak Cu-N (bond population varied from 0.06 to 0.11) covalent bond formed; meanwhile, the bonding strength of Ti-N (bond population varied from 0.29 to 0.4) bond adjacent to Cu increased. When Cu content was low, a small number of weak Cu-N bonds were formed, with strengthened Ti-N bond near Cu atom, resulting in an increased hardness of Cu doped TiN films. According to the theory of weak bonds, when the Cu content was increased further, the number of weak Cu-N bonds increased and TiCuN hardness decreased. With an increase in Cu content, it was found the toughness of TiCuN also increased. The results of this study will provide a theoretical and experimental guidance for improving the toughness and deformation resistance of TiN, which has a potential application in the surface modification of medical devices.
1. Introduction
Titanium nitride (TiN) films are widely used in manufacturing and industrial fields due to their hardness, wear resistance, electrical conductivity, and thermal stability [1,2]. The corrosion resistance and chemical inertness of TiN films have important application prospects in the field of medical implants [3]. Several studies have shown that TiN films used for surface modification of nickel-titanium alloy (NiTi), 316 L stainless steel (316LSS), Co-Cr-Mo alloy, and other medical metal materials can effectively prevent the release of nickel (Ni), chromium (Cr), and other toxic metal ions, improving the corrosion resistance and biocompatibility of these medical metals [4,5,6]. Some medical devices are subject to stretching and bending deformation during and after implantation. For instance, NiTi self-expanding vascular stents undergo a compression process during implantation, and a shape recovery process under the influence of body temperature. Moreover, long-term pulsating fatigue caused by periodic changes in blood pressure during service has been observed [7]. Therefore, if the NiTi self-expanding stent is modified through a TiN coating, the coating must withstand these deformations without spalling and/or cracking. However, TiN has inadequate inherent toughness and poor resistance to deformation. To ensure that their advanced physical and chemical functions are fully realized, the toughness of the TiN coating need be improved.
Metal doping is an effective method used to improve the toughness of ceramic materials and decrease the fracture tendency of films. Siddheswaran et al. [8] investigated ZnO doped with Co and Al, and found that the fracture toughness of the material improved after doping. Islahudin et al. [9] synthesized Cu doped CdS nanoparticles and observed changes in the particle size of CdS after Cu-doping through scanning electron microscopy. The results demonstrated that the particle size decreased after Cu doping of CdS. The decrease in grain size and the corresponding increase in the number of interface increases the hardness and toughness of the coating. Zhang et al. [10] doped an a-C film with aluminum through co-sputtering graphite and an aluminum target, which significantly improved the toughness of the film.
For ceramic coatings used in the biomedical field, the biological properties of the doped metal should be considered. Cu is an essential microelement for the human body, and Cu ions promote adhesion and proliferation of endothelial cells. Recently, Cu doped Ag clusters, Diamond-like Carbon (DLC), TiN, and other ceramic materials have been reported [11,12,13]. Researchers have carried out experimental studies on the hardness [14,15,16], corrosion resistance [17], tribological properties [18,19], and biocompatibility [20,21,22,23] of Cu doped TiN films. However, the micro-mechanism involved in the effect of Cu-doping of the crystal structure and mechanical properties of TiN has not been studied comprehensively.
In this study, a combined experimental and DFT study was used to obtain a detailed understanding of the effect of Cu-doping on the crystal structure and mechanical properties of TiN. This study will provide a theoretical and experimental guidance for improving the toughness and deformation resistance of TiN, which has a potential application in the surface modification of medical devices.
2. Materials and Methods
2.1. Preparation and Characterization of Films
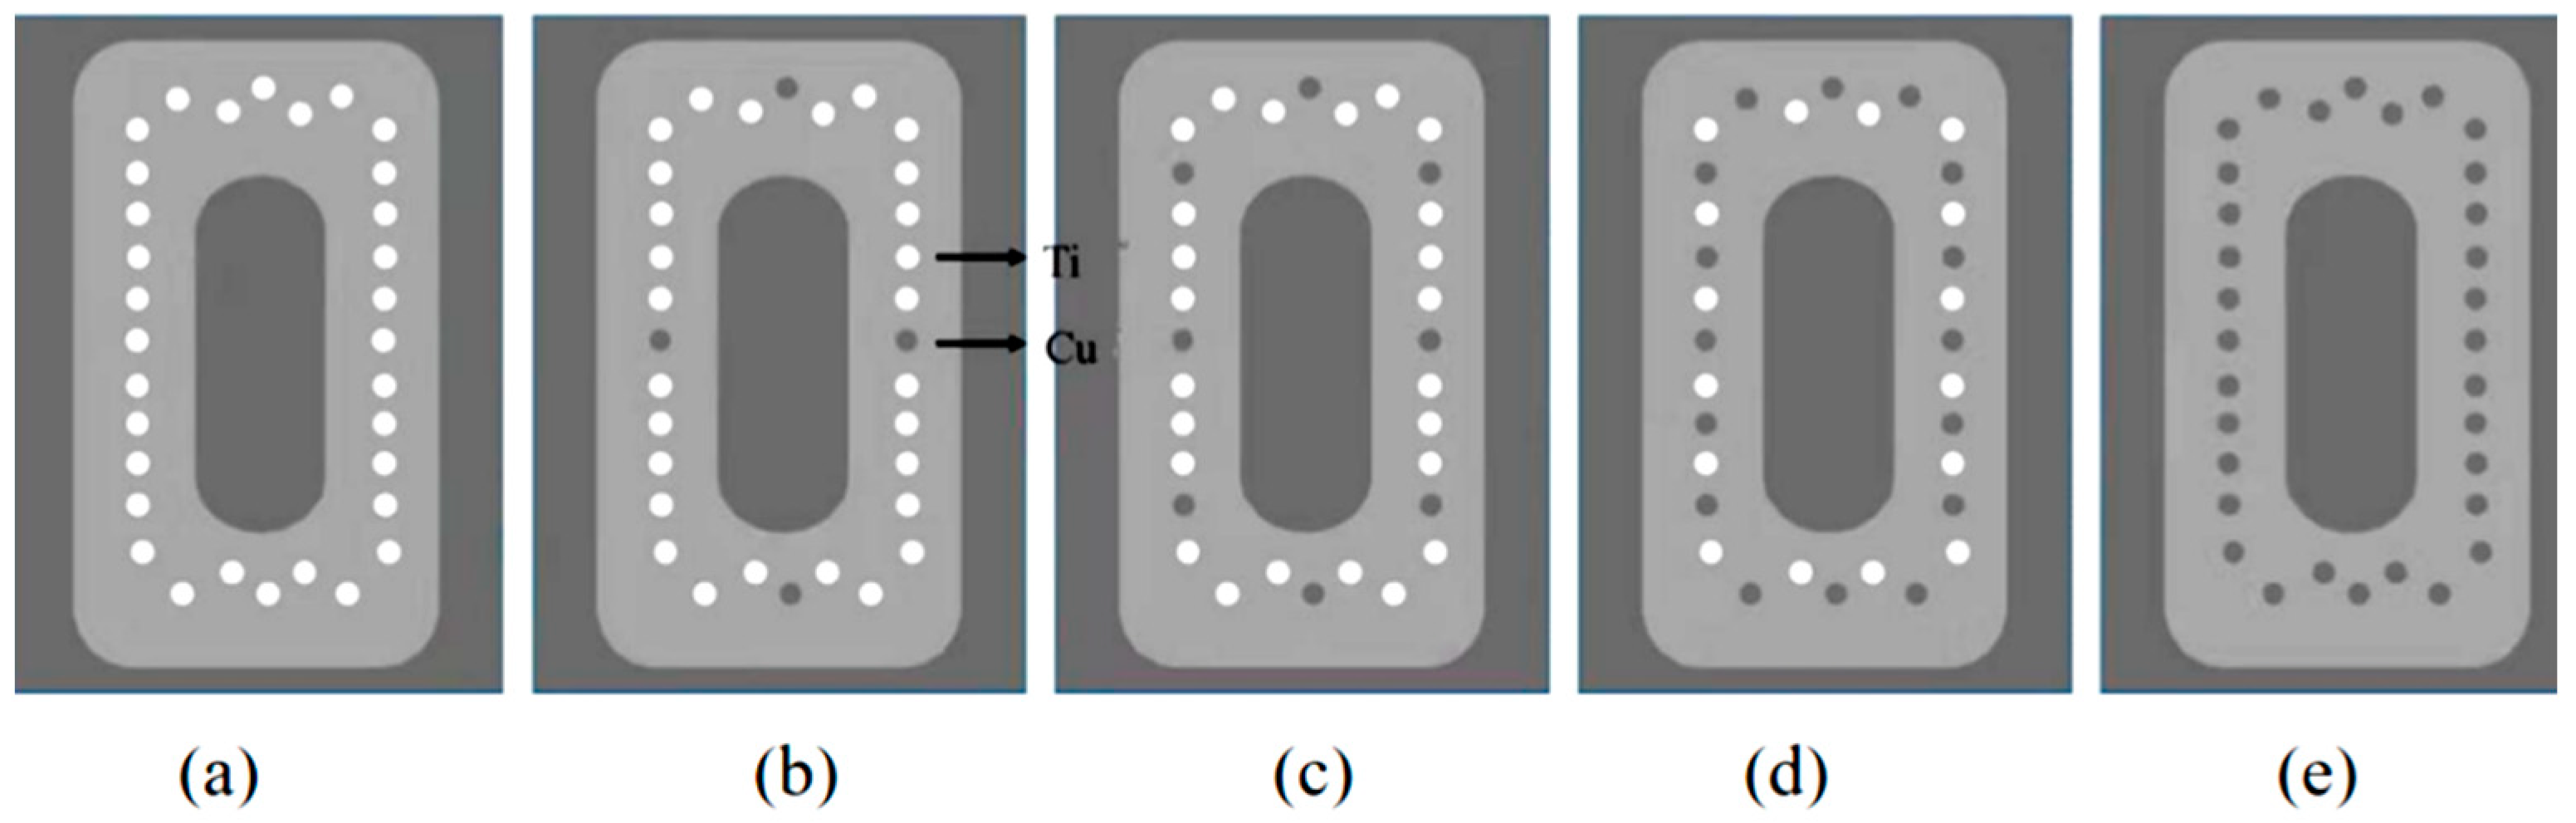
TiCuN films were prepared on single crystal silicon (Si) (100) using direct current magnetron sputtering (DCMS). The target used to prepare the film was a rectangular titanium (Ti) (170 mm × 134 mm, 99.9%). Ti rods of equal size (φ = 6 mm, L = 6 mm) were embedded in the track ring area of the Ti target to form a mosaic target. During the preparation of TiCuN films, Ti rods were replaced with Cu rods, and TiCuN films with different Cu contents were prepared by controlling the number of Cu rods. As shown in Figure 1, the number of Cu rods was set to 0, 4, 8, 16, and 32, and the corresponding prepared samples were labeled as TiCuN-0Cu, TiCuN-4Cu, TiCuN-8Cu, TiCuN-16Cu, and TiCuN-32Cu, respectively.
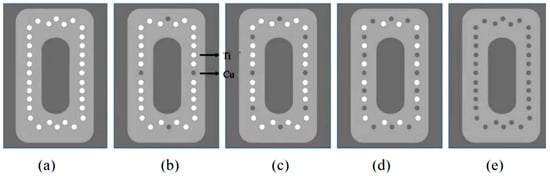
Figure 1.
Schematic diagram of Ti-Cu mosaic target with (a) 0 Cu rods; (b) 4 Cu rods; (c) 8 Cu rods; (d) 16 Cu rods; and (e) 32 Cu rods.
The DCMS equipment and film deposition process have been described in our previous report [24]. The TiCuN film was prepared under a mixture of Ar and N2, the ratio of Ar/N2 was set to 40/6 (sccm), and the vacuum chamber pressure was set to 0.4 Pa. The target current was 2 A, the distance between the target and substrate was 80 mm, the substrate bias was −50 V, and the deposition time for all the samples was set to 10 min.
The chemical composition of the prepared films was analyzed using an energy-dispersive spectroscope- (EDS) equipped field emission scanning electron microscope (SEM, JSM 7800F, JEOL, Tokyo, Japan). The thickness of the TiCuN films deposited on the Si substrate was measured using a stylus profiler (XP-2, AMBIOS, Santa Cruz, CA, USA) by measuring the height of a step fabricated by shielding a small part of the substrate with a silicon slice. The crystal structure of the films was characterized using an X-ray diffraction (XRD) (PANalytical, X’pert, Almelo, The Netherlands), with Cu acting as an anode target (λ = 1.54060 A). The X-ray tube voltage was 40 kV, and the current was 40 mA. In this study, the conventional scanning mode was adopted, and the scanning range was 25–80°.
TiCuN films were subjected to micro-indentation experiments (YZHV-1000P, Shanghai, China), with a load of 4.9 N and a dwell time of 10 s. The indentation diagonal length was measured using an optical microscope to evaluate the toughness of the film. Film hardness was determined using a dynamic ultramicro hardness tester (DUH-211S, SHIMADZU, Kyoto, Japan). The load–unload operating mode was selected, with a normal load of 10 mN and a loading speed of 0.89 mN s−1. During the tests, the load–unload curves were recorded, and the hardness levels of the fabricated TiCuN films were estimated using the Oliver–Pharr method [25].
2.2. Calculation Model and Method
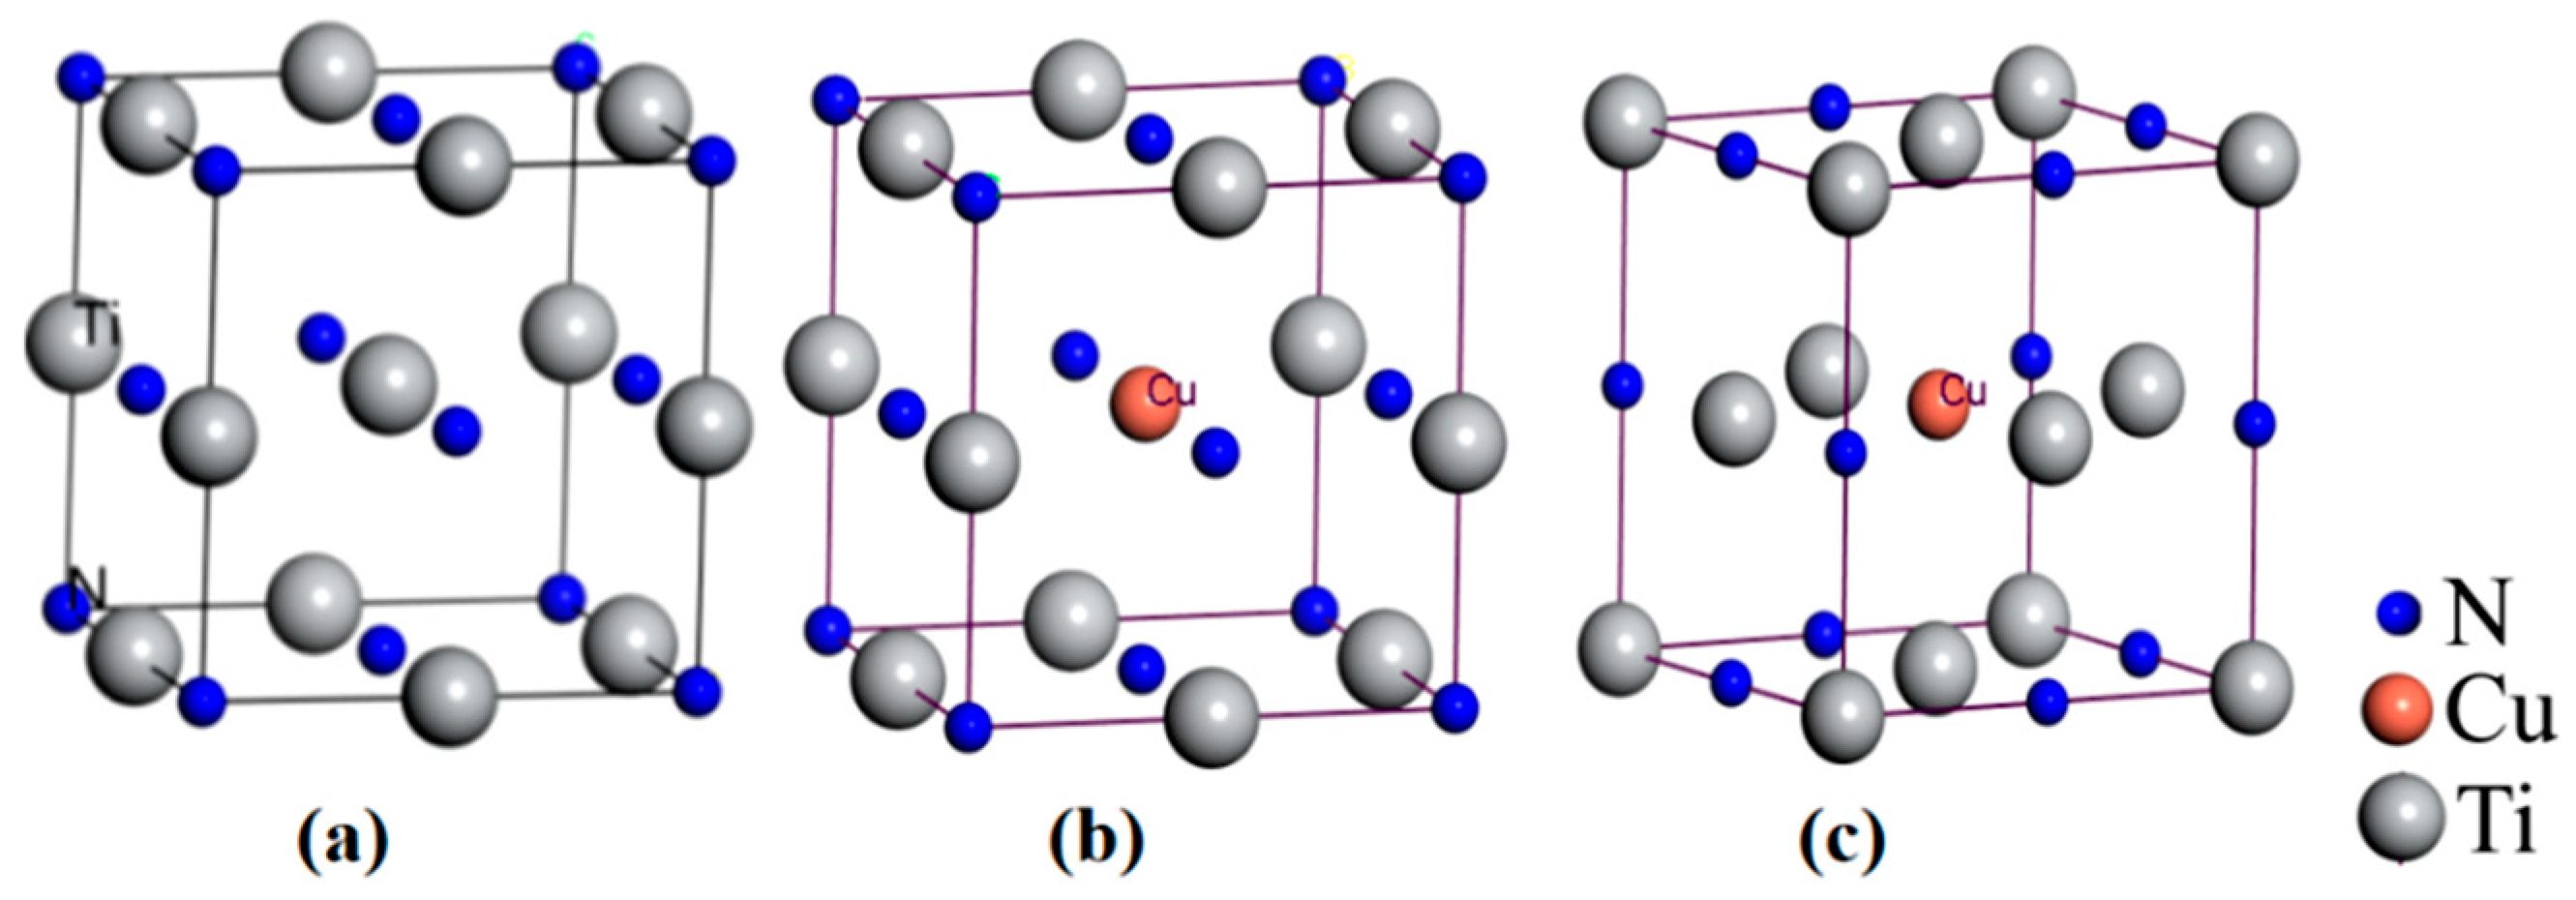
In this study, TiN had a NaCl-type face-centered cubic structure and a space group of Fm-3m (group 225) [26], having four Ti atoms and four N atoms in its cell structure, as shown in Figure 2a. The data used for the modeling were obtained from the literature [26,27], as shown in Table 1.
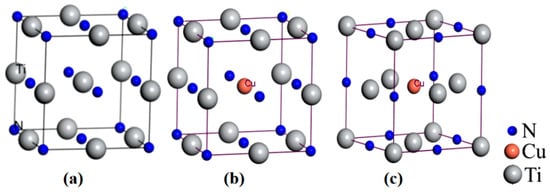
Figure 2.
Crystal cell structures of (a) Ti4N4; (b) Ti3CuN4; and (c) Ti4N3Cu.

Table 1.
Unit cell parameters of TiN structure.
To explore the occupying situation of Cu atom doping in a TiN lattice, the Cu substitution Ti doping model, shown in Figure 2b, and the Cu substitution N doping model, shown in Figure 2c, were constructed. Vesta software was used to simulate the XRDs of the two models. The parameter used in the simulation was the Cu target Ka1 = 1.54056 Å. The occupied potential energy of the two models was calculated using a first principles program package, based on DFT. According to the XRD experimental and simulation results, and the calculation of occupied energy, Cu mainly replaced Ti to form substitution solid solution doping in the TiCuN film (see Section 3.1 and Section 3.3 for details). On this basis, the 2 × 2 × 2 supercell model of TiN was established, with a structure of Ti32N32, as shown in Figure 3a. Subsequently, 2, 4, 6, and 8 Cu atoms were used to replace Ti atoms in supercrystal cells, and four TiCuN doping models were established, as shown in Figure 3. The structures corresponding to the four doping models were Ti30Cu2N32, Ti28Cu4N32, Ti26Cu6N32, and Ti24Cu8N32, and their corresponding Cu atom doping concentrations were 3.13 at%, 6.25 at%, 9.38 at%, and 12.5 at%, respectively.
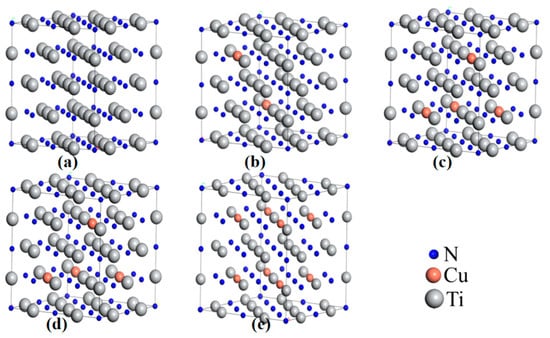
Figure 3.
Supercell models of (a) Ti32N32; (b) Ti30Cu2N32; (c) Ti28Cu4N32; (d) Ti26Cu6N32; and (e) Ti24Cu8N32.
In this study, all DFT calculations were performed using Cambridge Sequential Total Energy Package (CASTEP) [28]. In these calculations, the electron exchange correlation energy adopted a generalized gradient approximation (PBE-GGA), the interaction between valence electrons and the real ion was described by ultra-soft pseudopotential (USPP), the electron wave function was expanded by the plane wave basis vector group, and the cut-off energy and k-point spacing were set to 500 eV and 0.02 Å−1, respectively. The calculations were carried out in the reciprocal lattice space under periodic boundary conditions. The convergence accuracy of self-consistent calculation was 2.0 × 10⁻⁶ eV/atom, the force requirement on each atom was less than 0.1 eV/nm, the tolerance deviation was less than 5.0 × 10⁻⁵ nm, and the stress deviation was less than 0.02 GPa. First, the crystal structures of TiCuN systems were geometrically optimized, and then the total energy, elastic coefficient, and electronic structure were calculated. It can be seen from Table 1 that the TiN crystal cell parameters calculated using the parameters set in this study are largely in agreement with the literature and experimental results [26,27], indicating that the parameters selected in this study are reasonable.
3. Results and Discussion
3.1. EDS and XRD
EDS was used to analyze the types and contents of elements in the film, and the results are shown in Table 2. The thickness of prepared films is also listed in Table 2, and it can be seen that all the samples have approximately the same thickness, which is important to eliminate the effect of film thickness on hardness measurements. The main components in the film are Ti, N, Cu, Si, and O. It is clear that Si originated from the Si substrate, and the presence of O is attributed to residual gas in the vacuum chamber during film deposition or O adsorption upon ambient air exposure. The content of Cu in the film gradually increased with an increase in the number of Cu rods in the target. When the number of Cu rods was 4, 8, 16, and 32, the corresponding Cu content was 1.09 at%, 2.21 at%, 4.1 at%, and 11.08 at%, respectively. When the number of Cu rods increased from 16 to 32, the content of Cu in the film approximately doubled, induced by the presence of a single crystal Cu phase in the film [23,29], which was confirmed by subsequent XRD results.
Table 2.
EDS component analysis of TiCuN with different Cu contents.
Figure 4a shows the XRD of the prepared film. It can be seen from the XRD that when the Cu content was between 1.09 at% and 4.1 at%, the Cu-related peak was not observed and no new peak appeared in the XRD, indicating that the film still had a TiN crystal structure. When the Cu content was 11.08 at% (TiCuN-32Cu), the diffraction peak of Cu (200) appeared in the XRD, indicating that a small amount of Cu nanocrystals appeared in the film. It can be seen from Table 3 that with the increase in Cu content, the half peak widths of TiN (111) and TiN (200) peaks increase. According to Scherrer’s formula [30], the larger the full width at half maximum, the smaller the grain size. Therefore, the grain size of the TiCuN film decreased with an increase in Cu content.
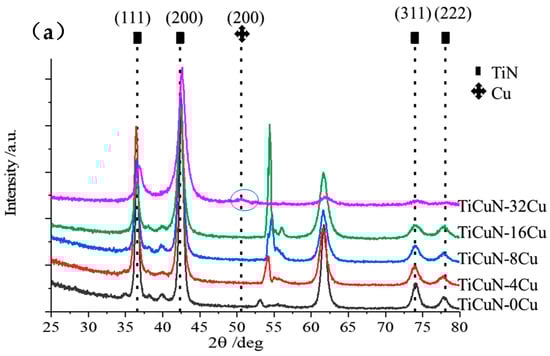
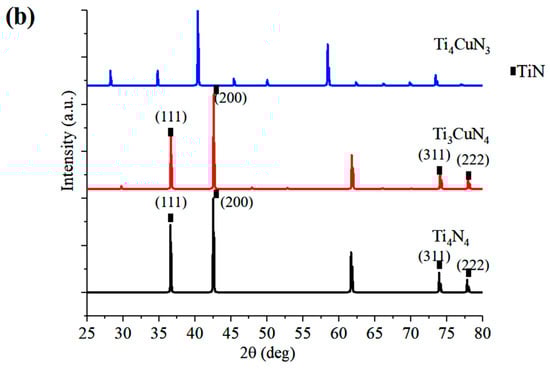
Figure 4.
XRD spectrum of TiCuN films with different Cu contents (a) experimental XRD spectrum; and (b) simulated XRD spectrum.
Table 3.
Half width and height of TiCuN films with different Cu contents.
3.2. Hardness and Indentation Morphology
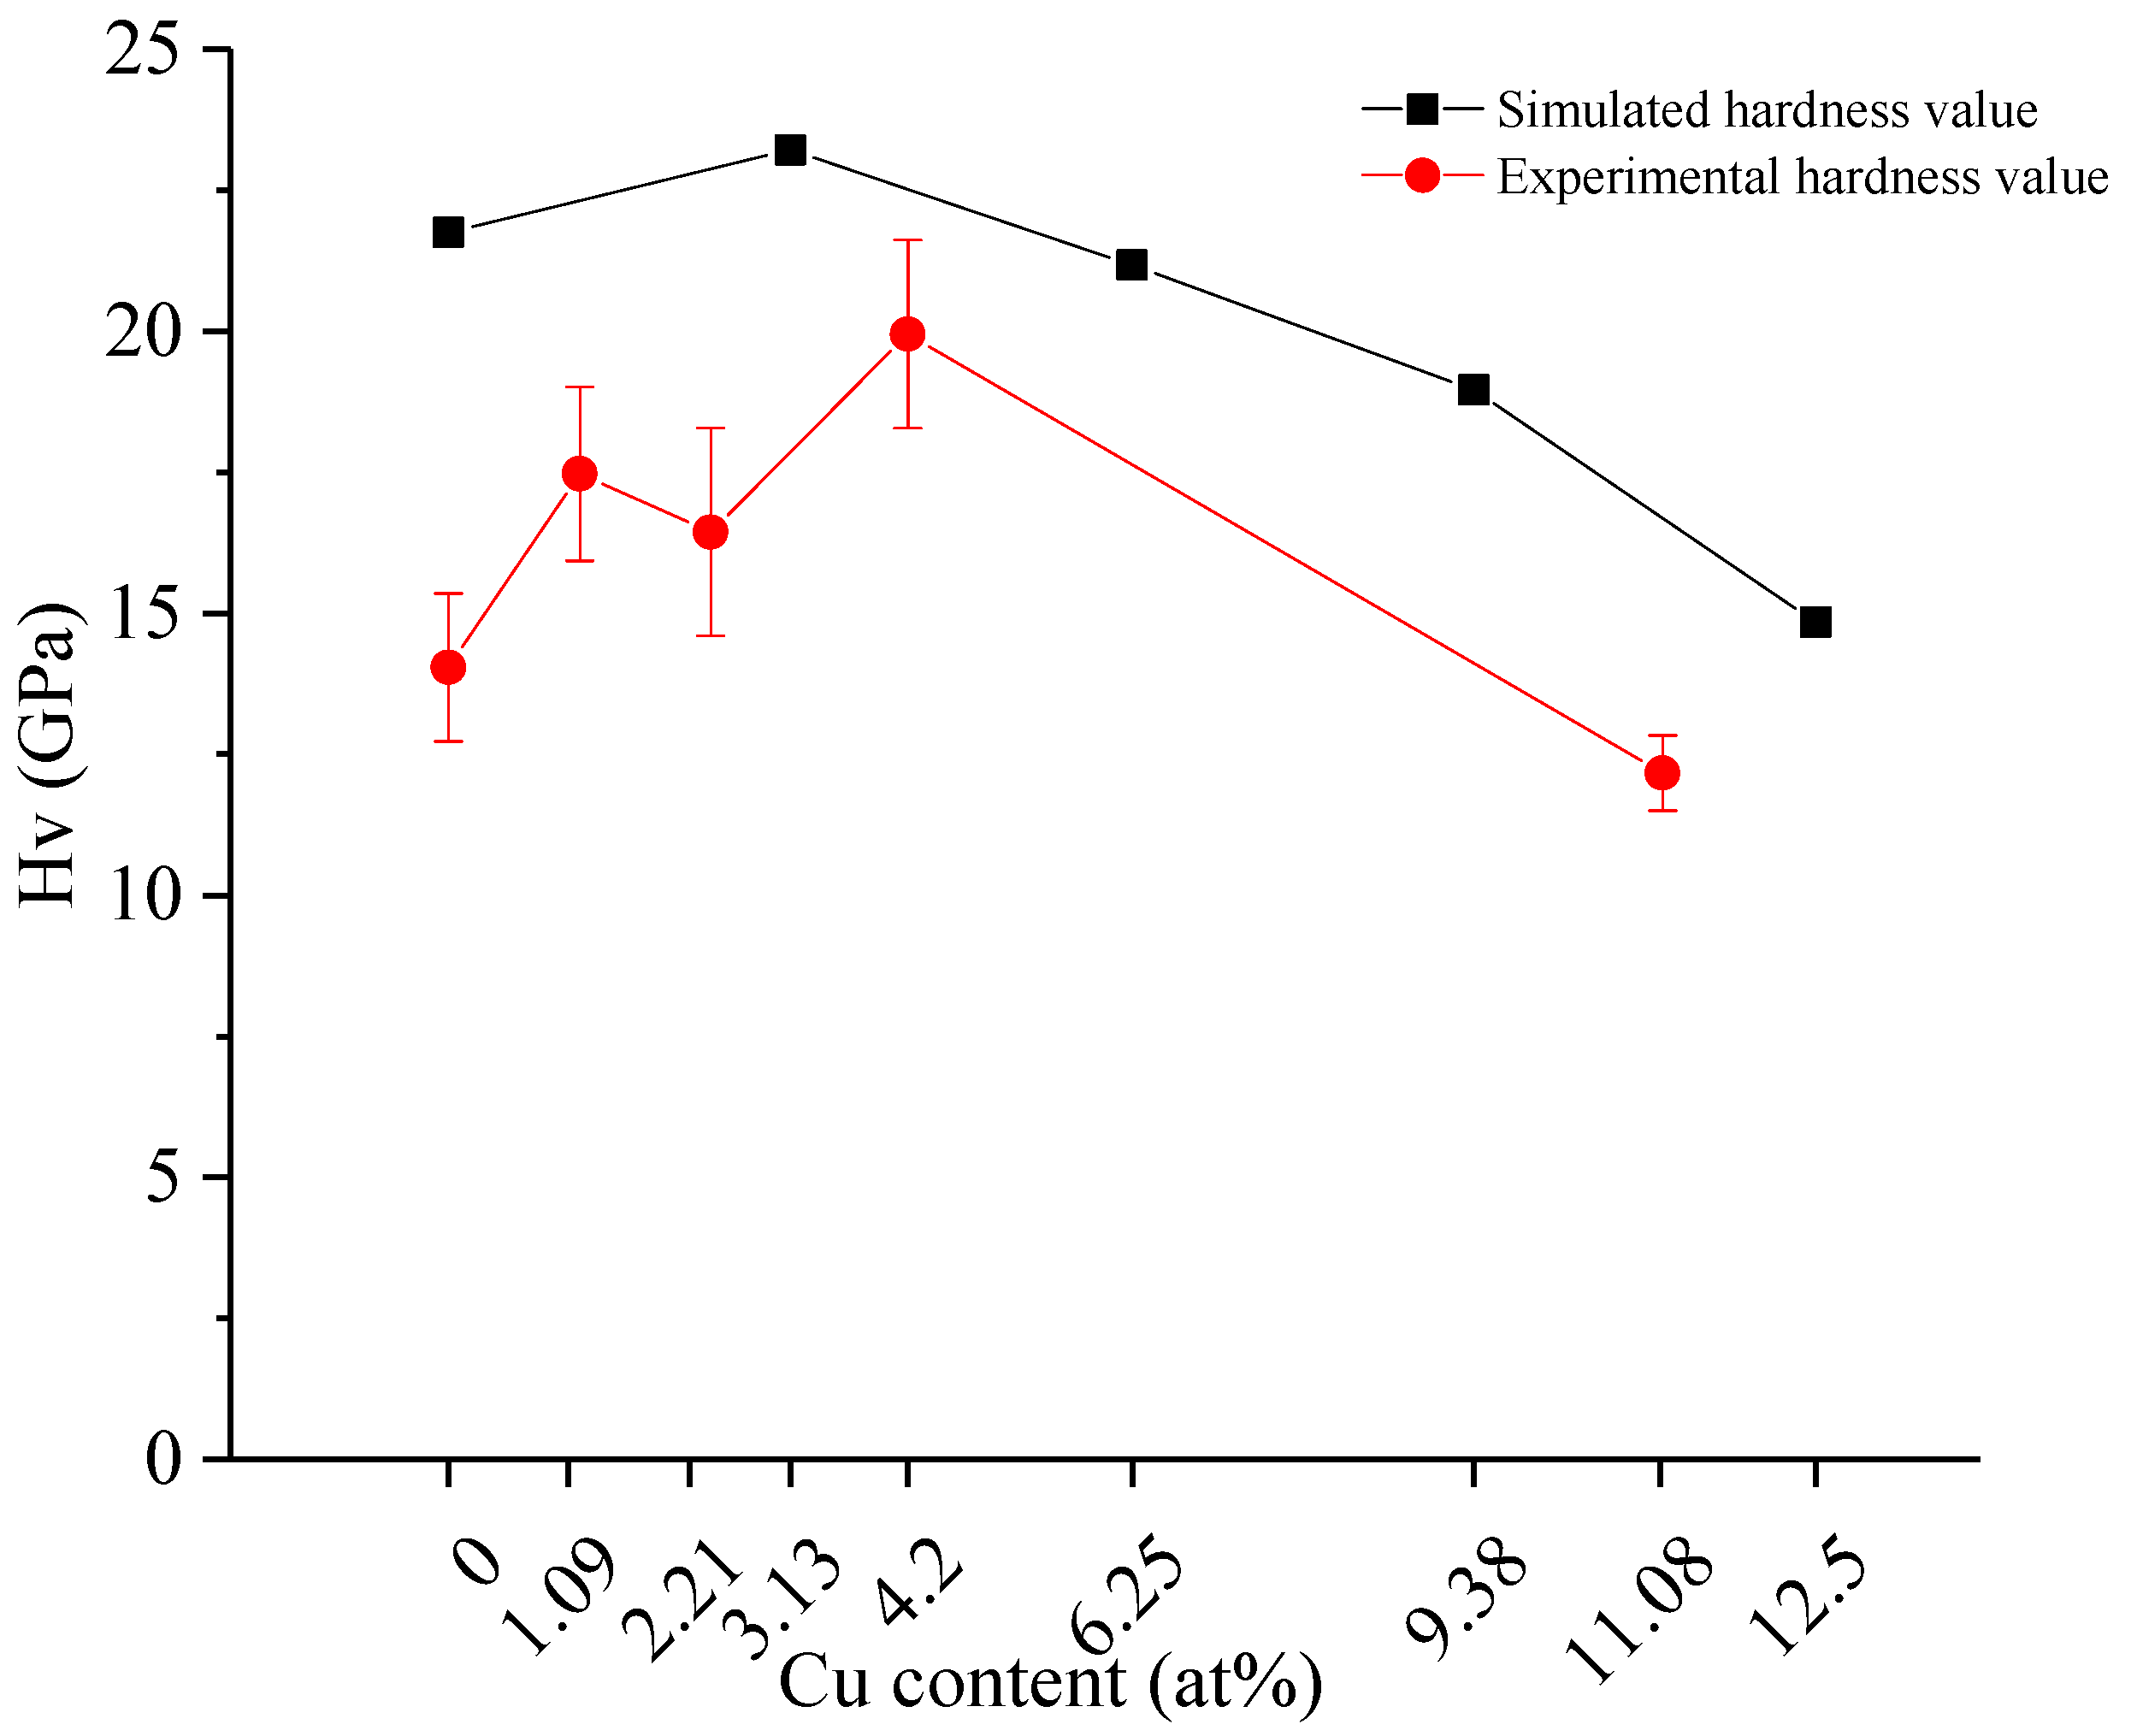
The experimental hardness values of the film are shown in Figure 5. The figure shows that with an increase in Cu content, the hardness of the TiCuN film increases first and then decreases. When the Cu content was 4.1 at%, the hardness of the TiCuN film was the highest at approximately 20 GPa. The XRD results show that an increase in the Cu content in a certain range (0 at% → 4.1 at%) refined the TiCuN grain, so that the hardness of the TiCuN film increased with the increase in Cu content in the film. When the Cu content in the film reached 11.08 at%, the Cu phase was formed in the film, which can be detected through XRD. The hardness of the film decreased with the incorporation of the soft metal phase. Zhang et al. [31] also observed a similar trend, whereby adding Cu into TiN film resulted in a TiCuN solid solution with a Cu content of 5.2 at% and a TiN/Cu nanocomposite coating with a Cu content of 12.6 at%. In the film, the formation of a TiCuN solid solution led to the lattice distortion of TiN, which promoted the formation of a stress field interacting with dislocations and hindering their motion, thus increasing the hardness of the thin film. For TiN/Cu nanocomposite coatings, the hardness of the film decreased as the number of Cu nanoclusters increased.
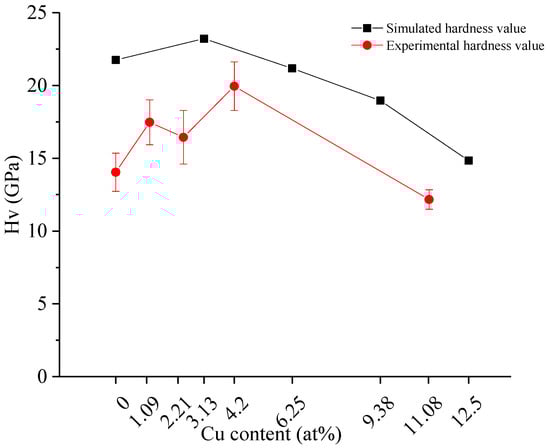
Figure 5.
Hardness of TiCuN with different Cu contents.
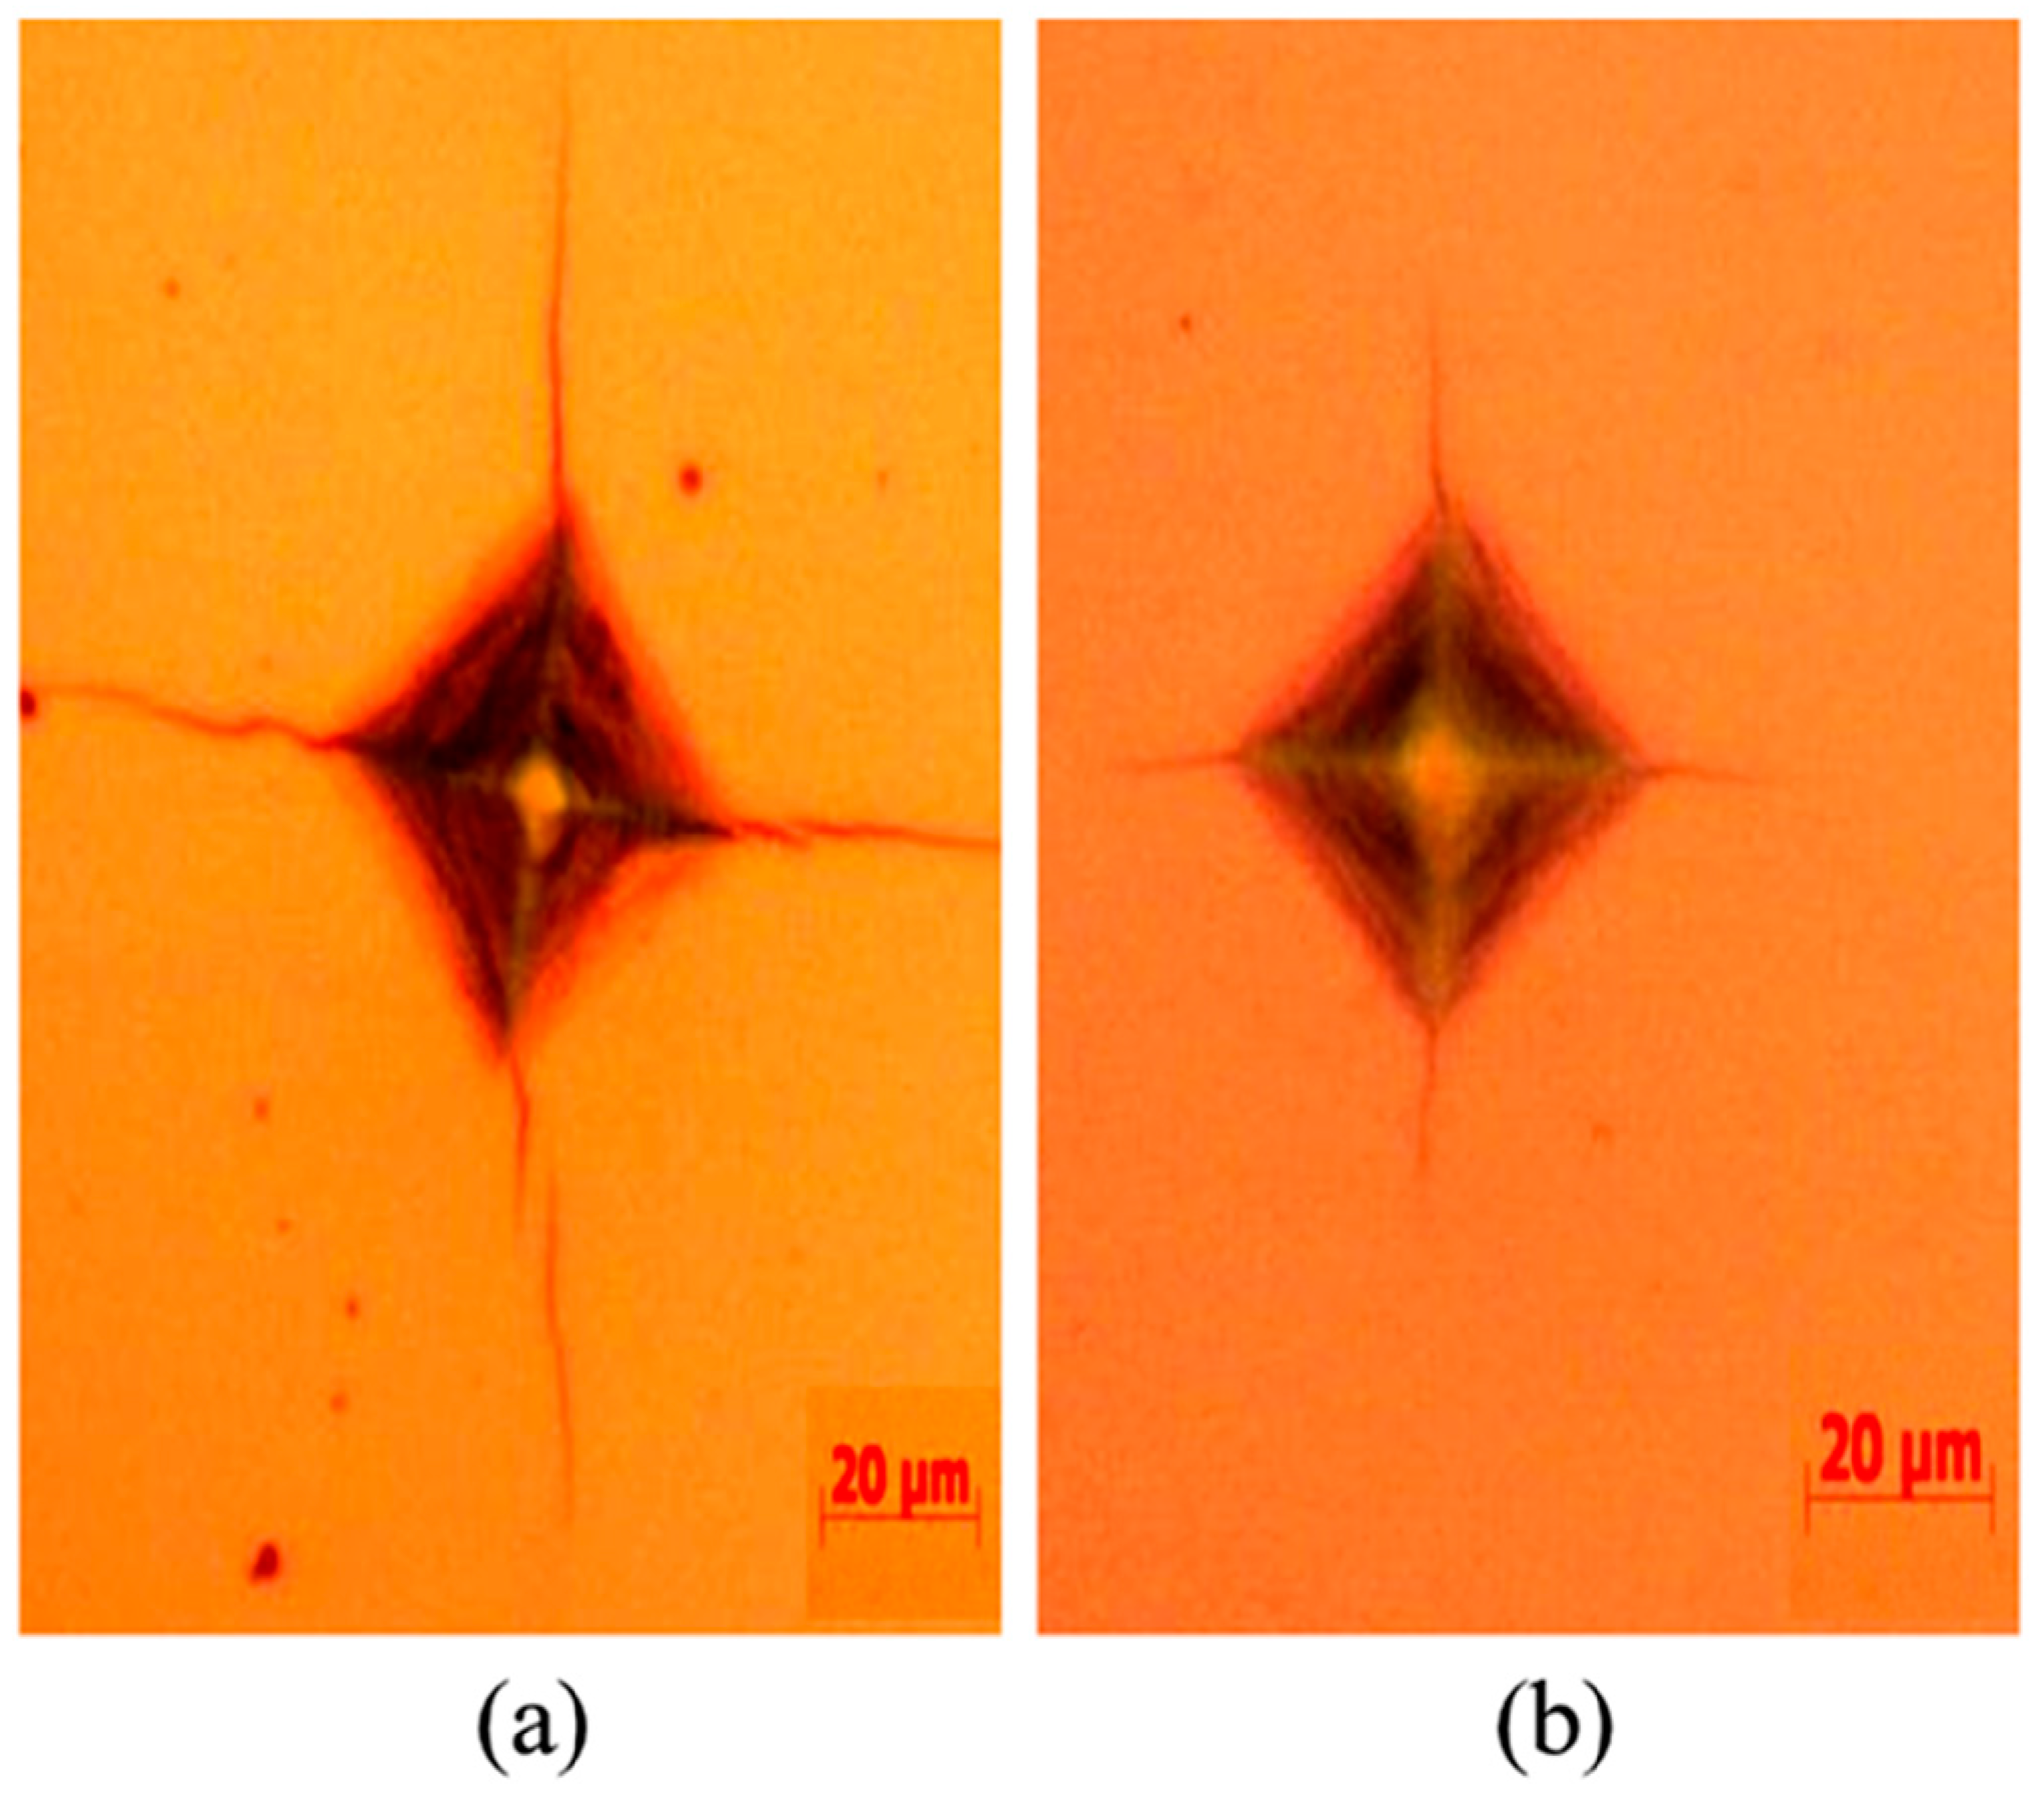
Figure 6 shows the typical microindentation morphology of TiCuN-0Cu and TiCuN-16Cu. It can be seen from the figure that the pure TiCuN-0Cu indentation diagonal produces a long crack, which was caused by TiN being a ceramic material with insufficient toughness. The crack length of TiCuN-16Cu was much shorter under the same load, indicating that Cu doping improved the toughness of TiN. Although it has been experimentally proven that the doping of Cu improves the toughness of TiN, the micromechanism of the toughness enhancement requires further study. Therefore, in this study, the first principles calculation based on density functional theory was used to study the microscopic mechanism of Cu doped TiN films.
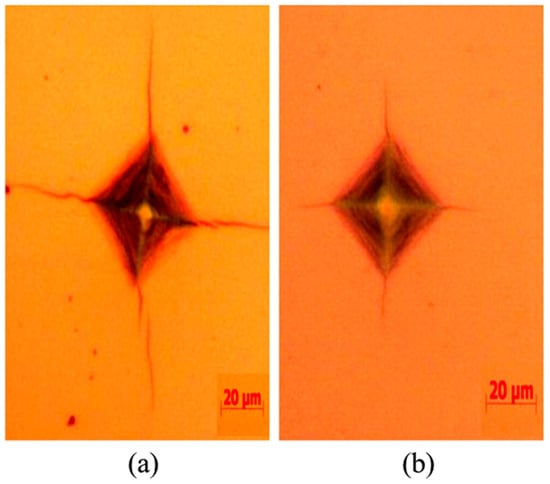
Figure 6.
Typical microindentation morphology of (a) TiCuN-0Cu; and (b) TiCuN-16Cu.
3.3. Calculation Results and Analysis
3.3.1. Cu Occupying Position in TiN Lattice
It is known that two types of impurities exist in crystals: interstitial and substitutional. It has been experimentally demonstrated that interstitial doping is suitable for systems with rsolute/rsolvent < 0.59 [32], where rsolute and rsolvent denote the radius of the solute atom and the solvent atom, respectively. It is known that substitution impurity occurs when the atomic radius and valence electron structure of the doped atom are similar to those of the crystal atom. In this study, the radii of Ti, N, and Cu were 1.45 nm, 0.80 nm, and 1.28 nm, respectively. Therefore, the possibility of Cu forming an interstitial solid solution in TiN is low, and the substitution doping is mainly formed. To further determine that whether Cu tends to occupy the Ti site or N site when doped in TiN, the formation energies of two doped models, as shown in Figure 2b,c, were calculated. The formation energies of the two models are used to calculate the Esite (occupation energy) of Cu in TiN crystal. The equation to calculate the occupation energy is as follows [32]:
In Equation (1), HTi represents the formation energy of the Cu occupying the central Ti atom, HN represents the formation energy of the Cu occupying the central N atom, and Esite represents the occupation energy. The occupation energy was negative, indicating that Cu was easier to replace in the Ti site in practice, whereas the positive value indicated that Cu was easier to replace in the N site. The formation energy is expressed as follows [33]:
In Equation (2), Etot is the total energy of the doped model as shown in Figure 2b,c, and Esolid(Ti), Esolid(Cu), and EN(N) represent the ground state energies of single Ti, Cu, and N atoms in the crystal cell, respectively. In addition, a, b, and c represent the number of atoms of Ti, Cu, and N in the doping system, respectively. The calculated results showed that the formation energies of Cu substitutions for Ti and N were both negative (−2.08 eV and −1.38 eV, respectively), indicating that the substitutions were theoretically possible. However, the occupation energy calculated using Equation (2) was negative (−0.7 eV). According to thermodynamic theory [34], the substitution of Cu for Ti sites is easier to achieve in practice. To verify this result, the XRD of three models, shown in Figure 2a–c, were simulated using Vesta software. The results are shown in Figure 4b.
When the XRD simulation results were compared to the experimental results, it was found that peak position of the XRD simulation spectrum of the Cu substitution Ti doping model was very similar to that of the experiment results, whereas peak position of the XRD simulation spectrum of the Cu substitution N atom doping model was very different from that of the experimental results. This result indicates that in the preparation process of the film, replacing Ti with Cu is more reasonable, which is consistent with the calculation results of occupation energy.
It was also found that the full width at half maximum (FWHM) of the XRD simulation spectrum is significantly smaller than that of the experiment spectrum. As described in Section 2.2, When simulating the XRD spectrum, the ideal single crystal model was used. Ideal single crystal has infinitely repetitive and symmetric structure. It is also believed that an ideal single crystal has a larger crystal size. However, the prepared thin film is usually composed of nanocrystals, and the practical size of nanocrystals is very small. According to the Scherrer’s formula [30], the bigger the grain size, the smaller the FWHM. Thus, the FWHM of the XRD simulation spectrum is much smaller than that of the experimental spectrum because the former has larger grain size than the latter.
According to the experimental results of XRD, the simulation results, and the calculation of occupation energy, Cu should mainly replace Ti atoms in TiN to form a solid solution doping. Therefore, the subsequent doping model considered only the case of Cu replacing Ti atom doping, with the specific model shown in Figure 3.
3.3.2. Forming and Binding Energies
According to the doping model of Cu replacing Ti, shown in Figure 3, the structure was optimized, and the formation energy and binding energy were calculated. The equation for the binding energy is as follows [33]:
In Equation (3), Etot is the total energy of the doped model, and Eatom(Ti), Eatom(Cu), and Eatom(N) are the free-state energies of single Ti, Cu, and N atoms in the crystal cell, respectively. Moreover, a, b, and c represent the number of atoms of Ti, Cu, and N in the doping system, respectively.
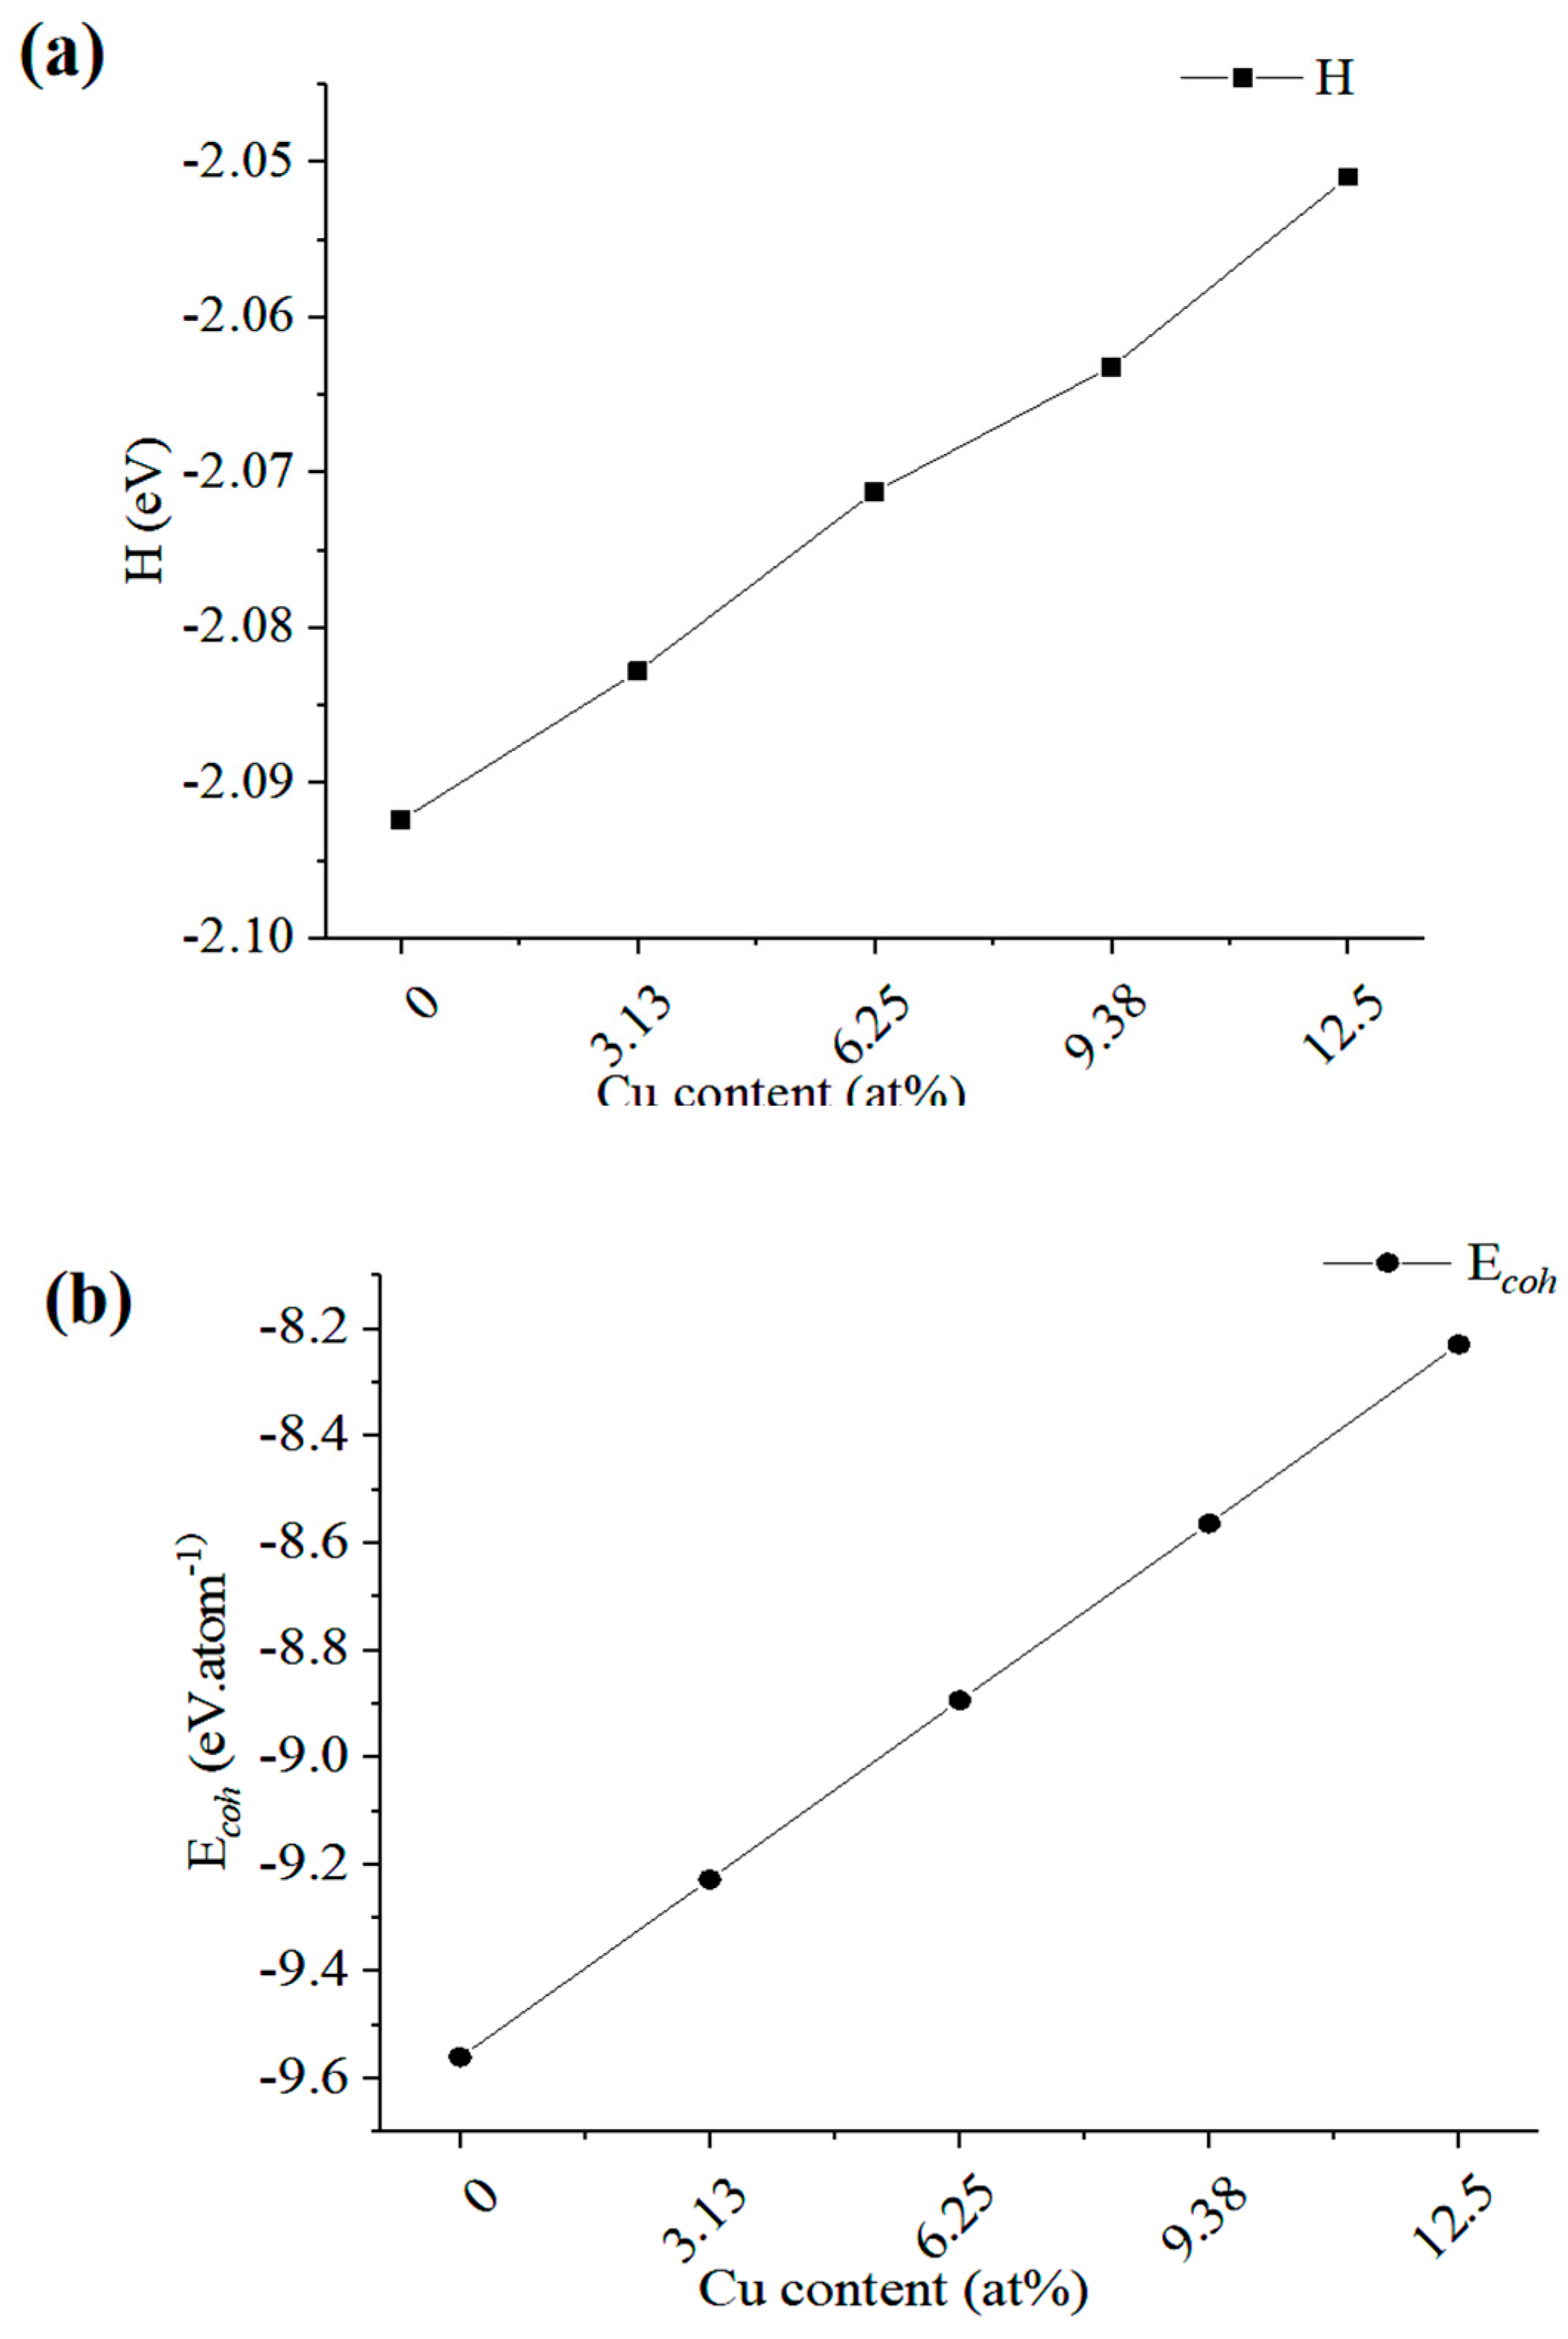
The calculated formation energy and binding energy of the doped structures are shown in Figure 7. As shown in Figure 7a, the formation energies of all Cu doped TiN systems are negative, indicating that these systems can be prepared under certain experimental conditions. However, with an increase in Cu content, the absolute value of the system formation energy decreases, indicating that the increase in Cu content decreases the structure stability of TiN. It was found in the experiment that when the Cu content exceeded 11.08 at%, there was a single crystal phase of Cu in the coating [23]. It is simply the instability of the doping system that caused the precipitation of Cu. It can be observed from Figure 7b that with an increase in Cu content, the binding energy (absolute value) of the doping system decreases, indicating that Cu doping will cause a change in TiN bonding state, resulting in the decrease in average bonding strength, which can be confirmed by conducting density of states and Mulliken population analysis.
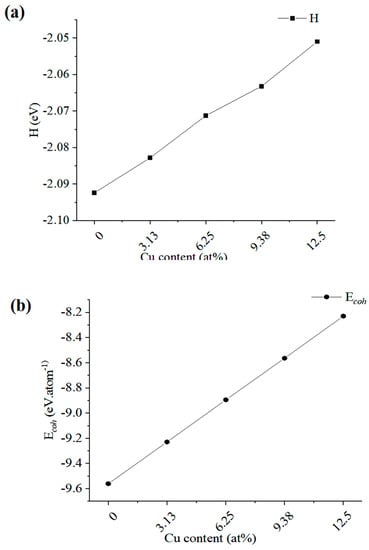
Figure 7.
(a) Formation energy (H); and (b) binding energy (E) of TiCuN with different Cu contents.
3.3.3. Elastic Coefficient and Mechanical Properties
The elastic coefficient was calculated for the doping system model shown in Figure 3. The calculation results are shown in Table 4. The mechanical stability of TiCuN was determined using the elastic coefficient. For cubic systems, the elastic constants must satisfy the following relation to obtain mechanical stability [35]:
Table 4.
Elastic coefficients of TiCuN with different Cu contents.
The calculation result showed that the four TiCuN models, shown in Figure 3, meet the mechanical stability conditions. Using the elastic coefficient and the Voigt–Reuss–Hill (VRH) theory [34], the calculation results of bulk modulus B, shear modulus G, and Poisson’s ratio v of the system were obtained, as shown in Table 5. It can be seen from Table 5 that with an increase in Cu atomic concentration, the modulus B and the shear modulus G of TiCuN decrease, and the decrease in G is more apparent, which increases the ratio B/G.
Table 5.
Bulk modulus, shear modulus, Poisson’s ratio, and the ratio of B/G for TiCuN with different Cu contents.
Usually, bulk modulus B reflects the average strength of chemical bonds in materials, and shear modulus G is the ratio of shear stress to strain, which reflects the ability of the material to resist the change in the chemical bond under external force. The result of this study indicates that Cu doping decreases the average bonding strength within TiN. However, Cu doping also increases the ductility and toughness of TiN. According to the Pugh criterion [36], the ratio of B/G can be used to characterize the ductility and brittleness of the material. When B/G > 1.75, the material is ductile, and the greater the B/G ratio, the better the ductility of the material. Table 5 presents that the undoped TiN is a brittle material. With an increase in Cu concentration, its ductility increases. When the doping concentration reaches 12.5 at%, TiN becomes a ductile material.
Poisson’s ratio v can also characterize the brittleness and toughness of the material. When v > 0.26, the material is ductile, and the greater the value of v, the better the toughness of the material. It can be seen from the data in Table 5 that undoped TiN is a brittle material. With an increase in Cu concentration, the ductility increases. When the doping concentration reaches 12.5 at%, TiN becomes a ductile material. The crack in the micro indentation in Figure 6 proves that Cu doping will improve the toughness of the material.
Using the results of B, G, and Chen’s formula [37], the theoretical hardness Hv was calculated. The results are shown in Figure 5. It can be seen from the figure that although the simulation results of hardness are different from the experimental results, there is a common trend that with the increase in Cu content, the hardness of the doped system first increases slightly, and then decreases.
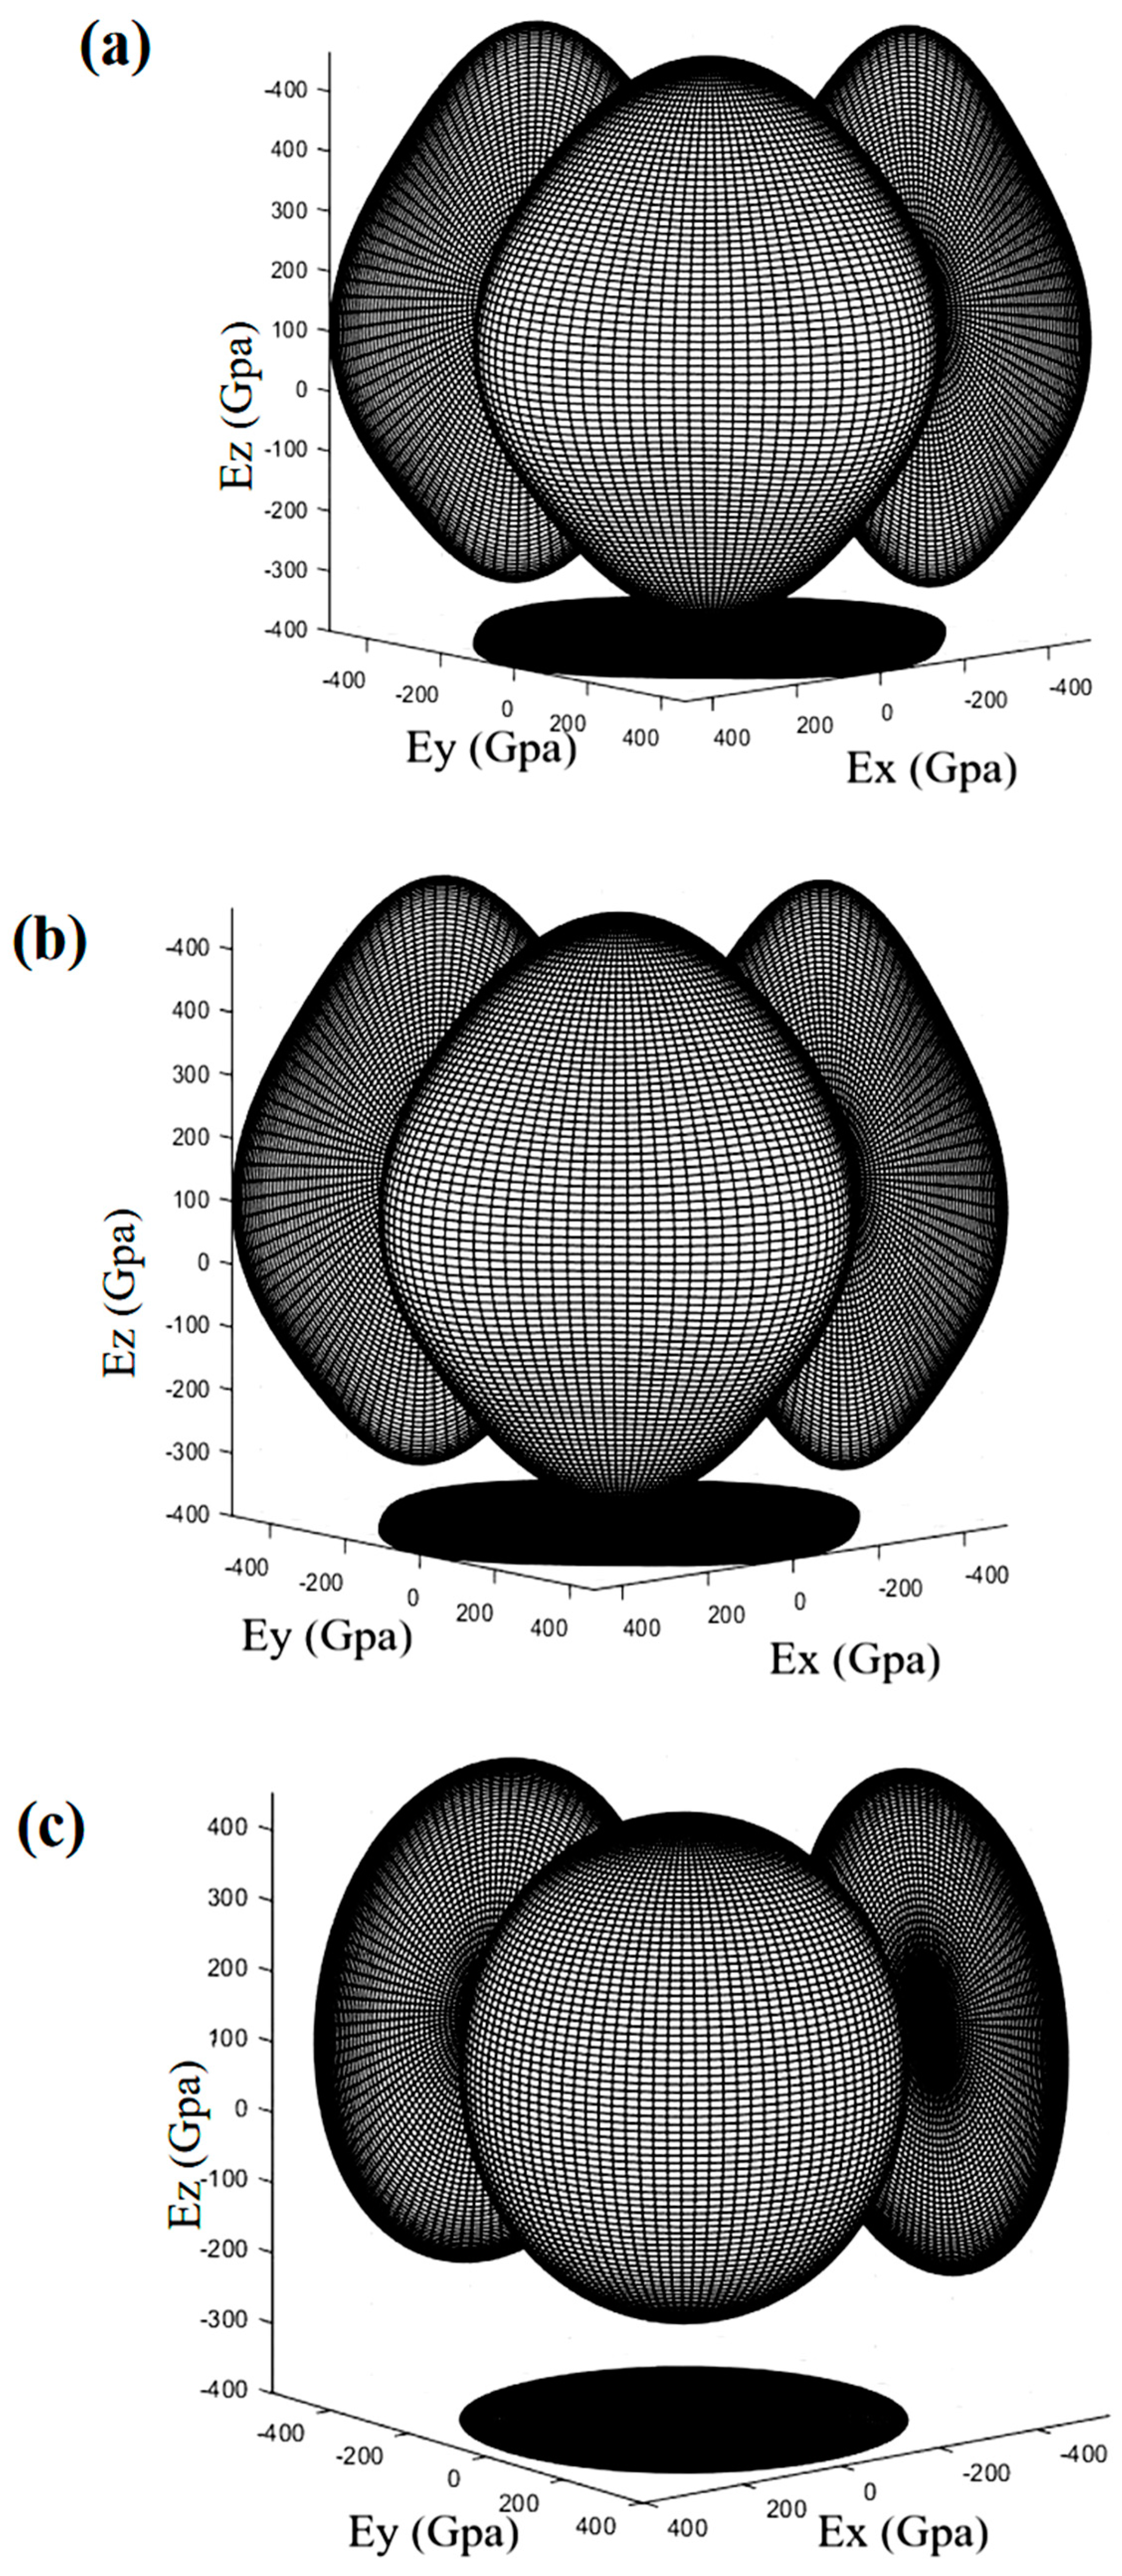
Due to the anisotropy of crystals, microcracks and distortions are often formed under external loads, resulting in the film peeling off the substrate. The 3D Young’s modulus diagram of the system can clearly show the anisotropy of the crystal. In this study, the 3D Young’s modulus distribution of TiCuN was calculated in Matlab software using the elastic coefficient script [38]. As shown in Figure 8, when the Cu content is 0 at% (Ti32N32) and 3.13 at% (Ti30Cu2N32), the 3D surface is anisotropic and deviates from being spherical. When the Cu content reached 12.5 at% (Ti24Cu8N32), the 3D surface was approximately spherical and isotropic. Therefore, Cu doping decreases the elastic anisotropy of TiN, which also helps to improve their toughness and crack resistance [39].
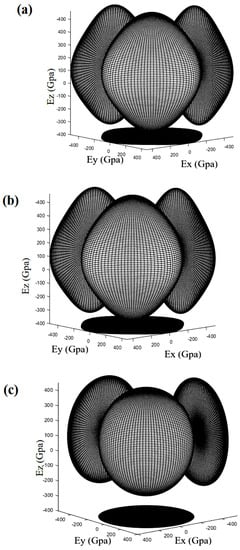
Figure 8.
Typical 3D Young’s modulus diagram of (a) Ti32N32; (b) Ti30Cu2N32; and (c) Ti24Cu8N32.
3.3.4. Density of States and Mulliken Population Analysis
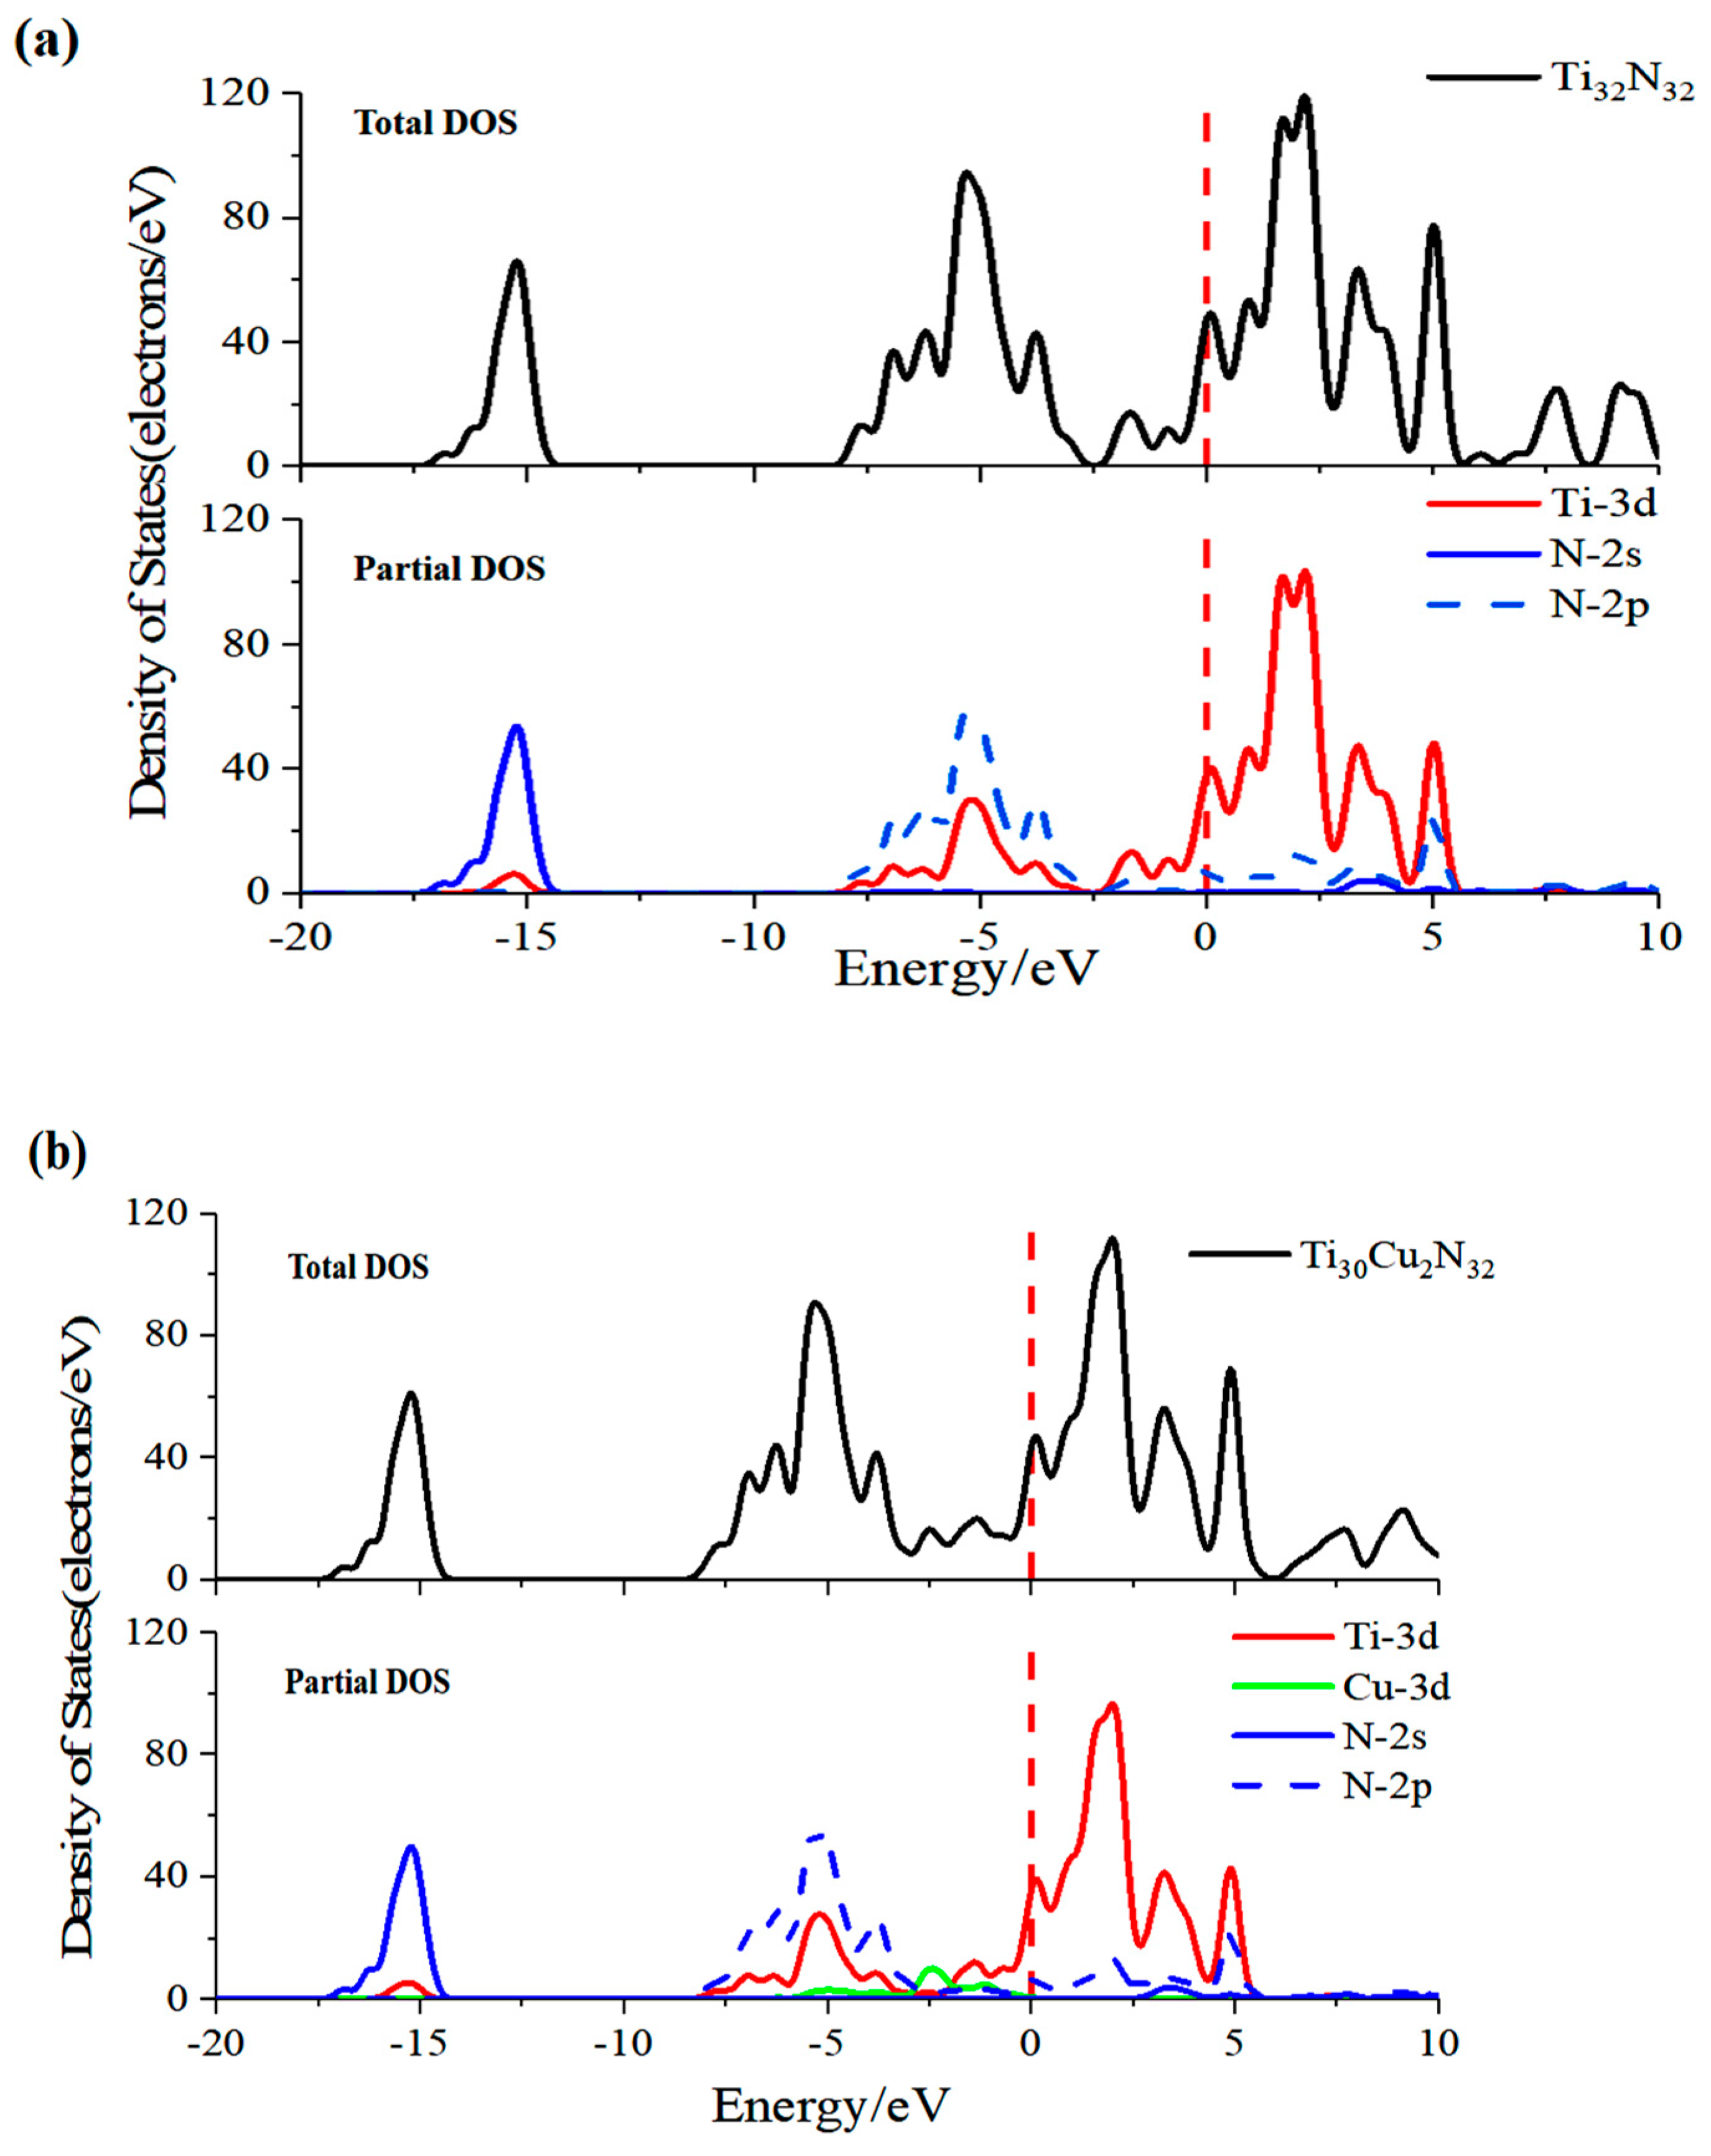
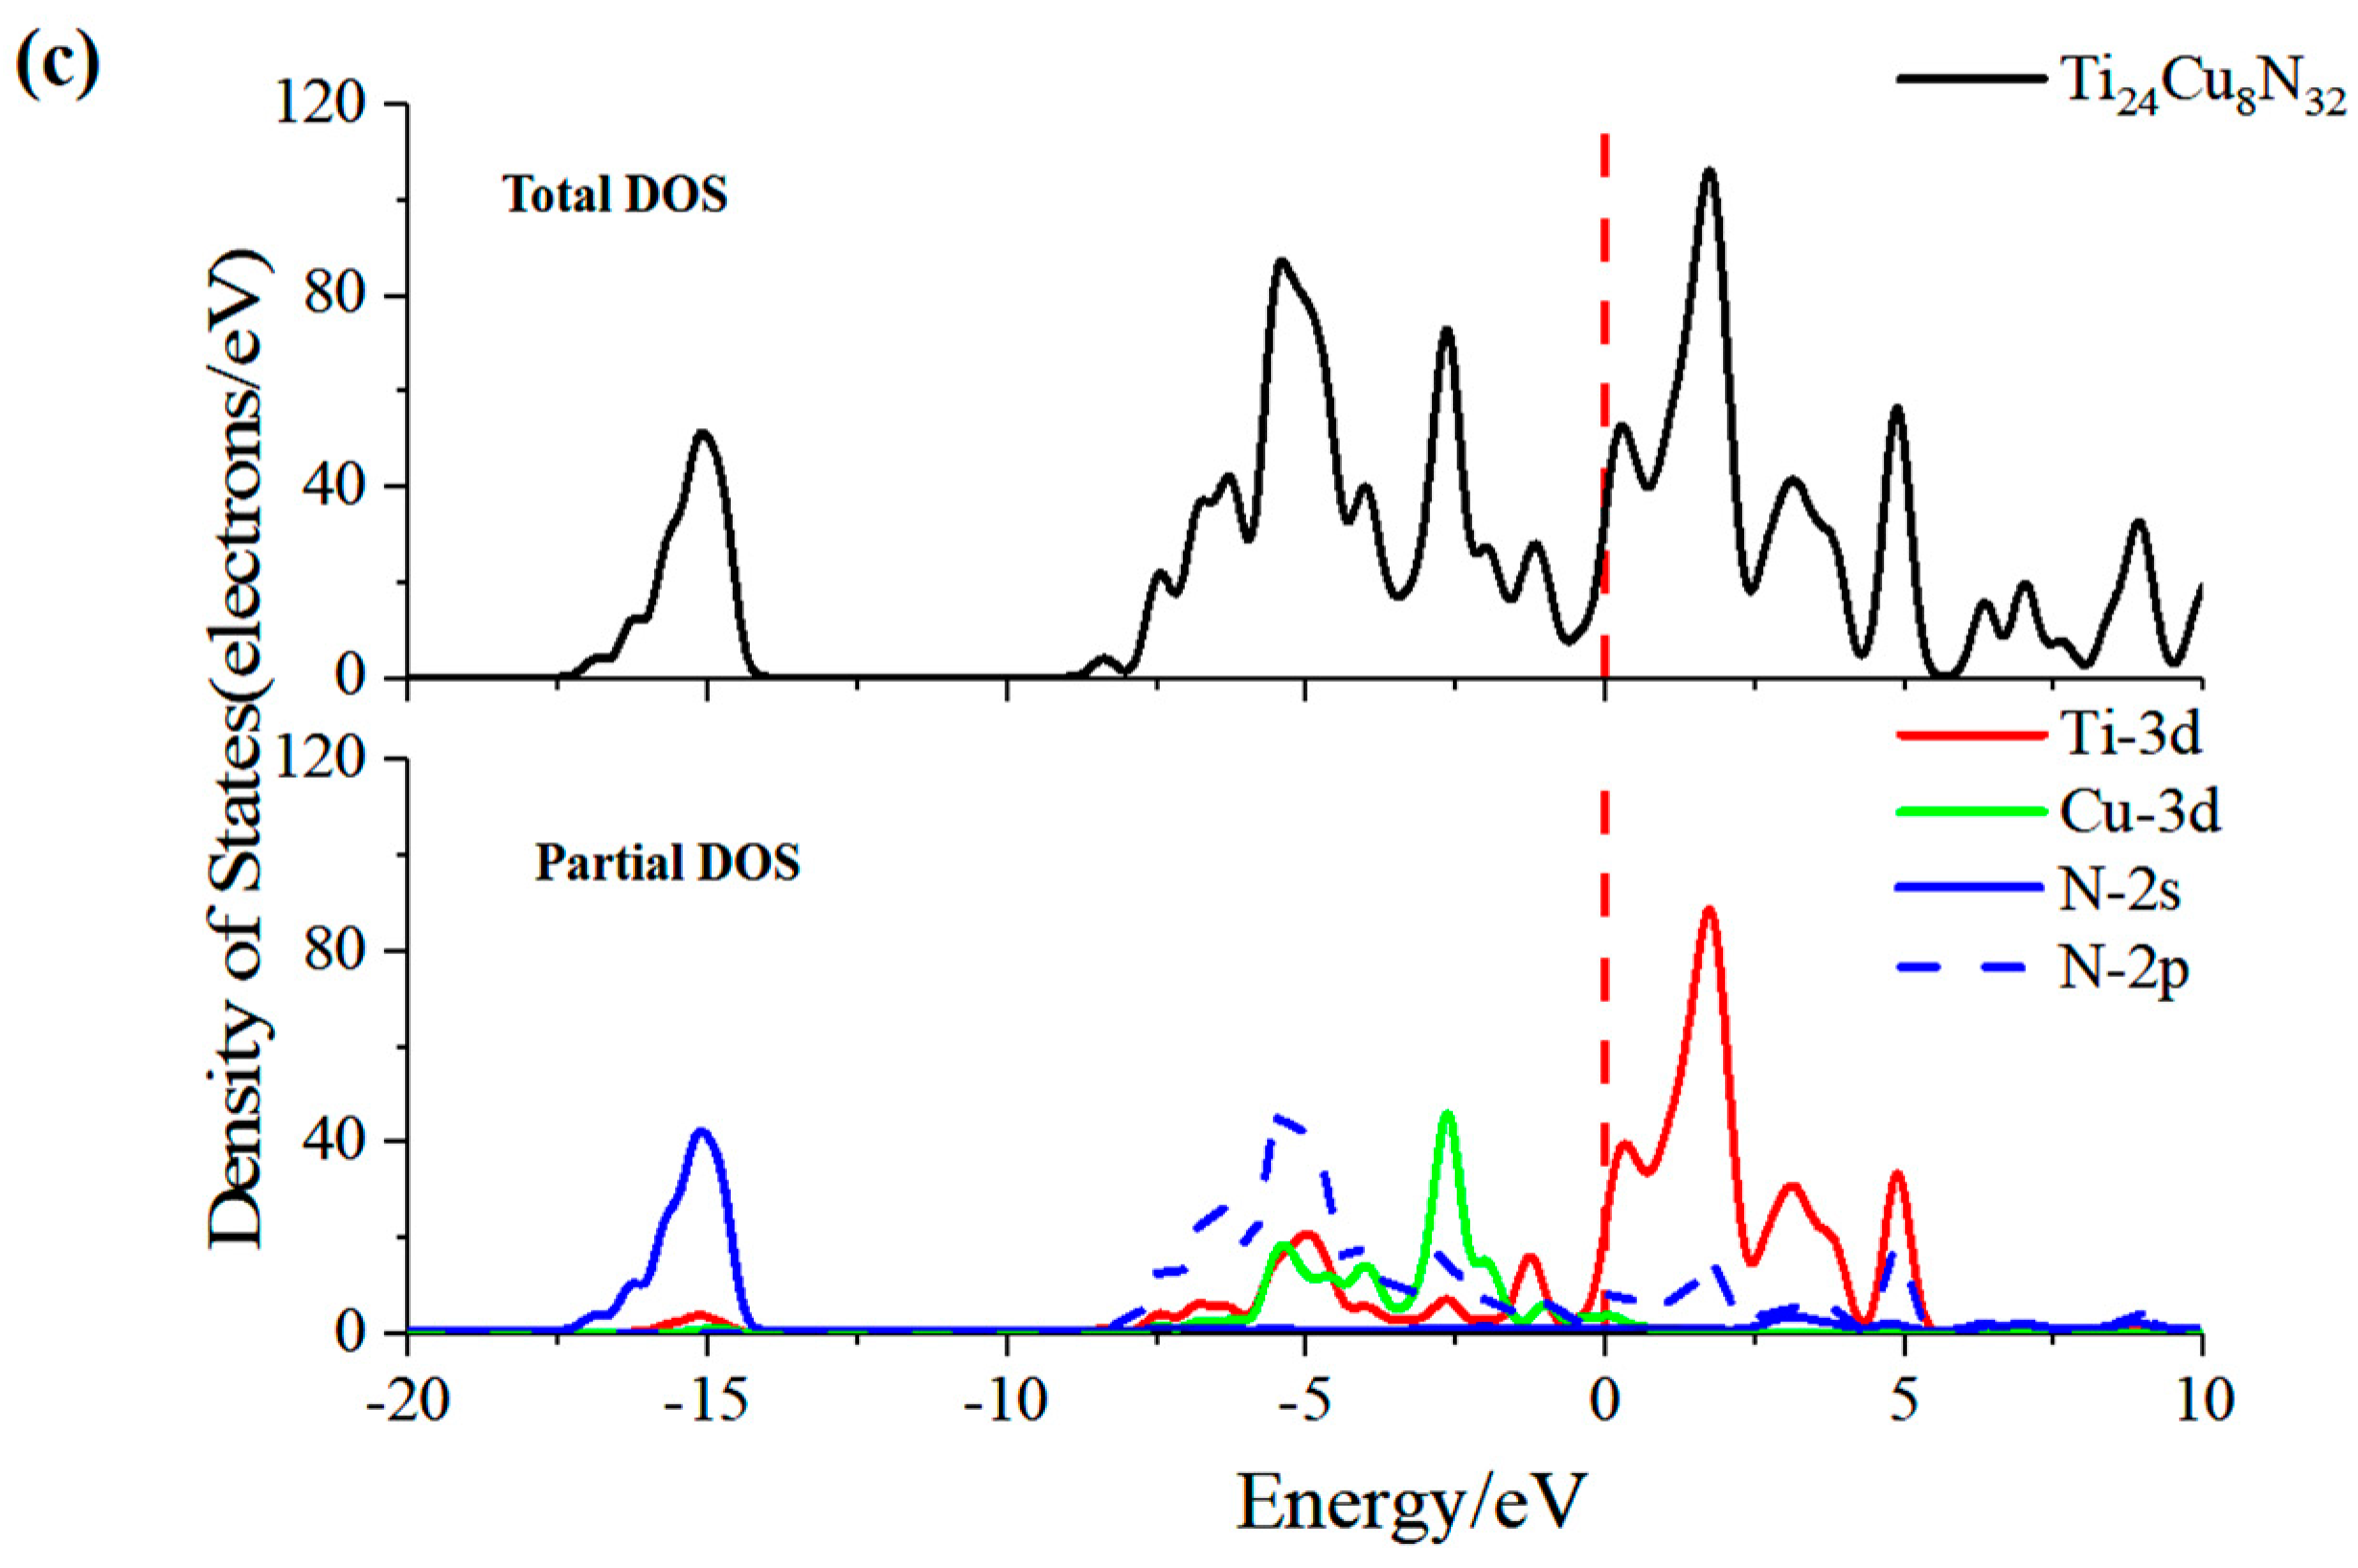
Figure 9 shows the total and partial density of undoped TiN. It can be seen that the conduction band of TiN is composed mostly of Ti 3d and a small number of N 2p states. The valence bands are split into two discontinuous groups, the lower part between −17.5 eV and −13.5 eV is mostly composed of N 2s states, and the upper part between −7.5 eV and 0 eV is mainly composed of N 2p states and Ti 3d states. The composition of the upper valance and conduction bands indicate that hybridization and strong covalent bonding exists between the Ti atom and N atom.
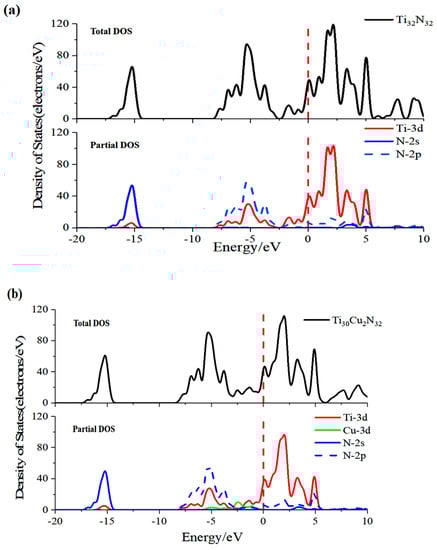
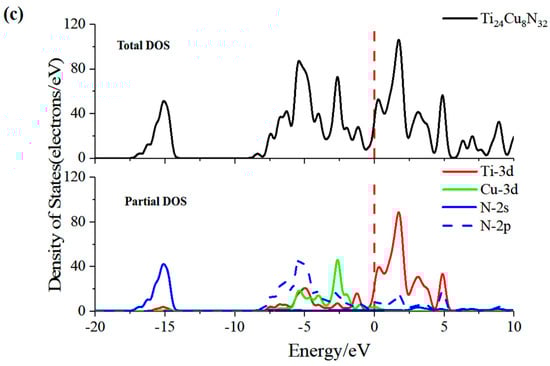
Figure 9.
Typical total density of states and partial density of states for (a) Ti32N32; (b) Ti30Cu2N32; and (c) Ti24Cu8N32.
After Cu doping, the DOS distribution of TiCuN is approximately the same as that of TiN, except that Cu 3d states peak appears in the range of the upper valance band, as shown in Figure 9b,c. Cu 3D states appearing in the upper valance band indicated more complex hybridization between Cu, Ti, and N. To further investigate the bonding information between Cu, Ti, and N, Mulliken population analysis was performed, and the results are listed in Table 6. It should be noted that the calculated bond population of Ti-Cu is negative, indicating that no bond was formed between the copper and titanium atoms, and this negative population is not listed in Table 6.
Table 6.
Mulliken bond population of TiCuN with different Cu contents.
As shown in Table 6, when Cu substituted Ti to form solid solution doping, a weak Cu-N bond was formed, and the bond population was between 0.06 and 0.11, which is far less than the Ti-N bond population in undoped TiN (bond population 0.29). In addition, it was found that the strength of adjacent Ti-N bonds changed near the doped Cu atom. Some Ti-N bond populations increased (bond population varied 0.29~0.4), whereas some populations decreased slightly (bond population varied 0.27~0.29). The number of Ti-N bonds with enhanced bond populations was higher than that with slightly decreased bond populations. For the sample with less Cu content (3.13 at%), the calculated theoretical hardness was greater than that of undoped TiN, which should be attributed to the strengthened Ti-N bond near the doped Cu atom. Table 6 shows that with an increase in Cu content, the number of weak Cu-N bonds increases, but the number of Ti-N bonds with strong bond population changes minimally. This increases the proportion of weak Cu-N bonds in the system when the Cu content increases. According to the weak bond theory [40], the strength of the system decreases and the theoretical hardness also decreases.
4. Conclusions
In this study, the effects of Cu doping on the composition, crystal structure, and mechanical properties of TiCuN films were investigated by combining experimental and theoretical calculations. The key conclusions as follows:
- (1)
- According to the experimental and simulation spectra of XRD as well as the lattice occupation energy analysis based on DFT, Cu mainly replaced Ti atoms in TiN and formed substitution solid solution doping in the TiCuN films.
- (2)
- Both experimental and theoretical results of hardness show that with an increase in Cu content, the hardness of TiCuN increased slightly at first, and then decreased after a certain limit. The analysis of the density of states and Mulliken population reveal the effect of Cu doping on the hardness of TiCuN films. It was found that when Cu replaced Ti in TiN to form a weak Cu-N covalent bond, the bonding strength of some Ti-N bonds adjacent to Cu increased concurrently. At low Cu content, the number of Cu-N weak bonds was small, and the increase in TiCuN hardness was due to the enhanced Ti-N bond near the Cu atom. When the Cu content increased beyond a threshold, the number of weak Cu-N bonds also increased, while the increase in the number of enhanced Ti-N bonds was not significant. With the increase in the Cu-N bond beyond a certain extent, the hardness of TiCuN decreased, according to the weak bond theory.
- (3)
- The DFT results also showed that the value of B/G ratio and Poisson’s coefficient of TiCuN increased, and the isotropic elastic modulus E increased as a function of increasing Cu content. These results indicate that the toughness of the TiCuN system improved and the ability to resist cracks increased by increasing Cu composition in TiN. The analysis of the indentation morphology of both TiCuN confirmed that Cu doping improved the toughness of TiN. Therefore, the results of this study can provide theoretical and experimental guidance for improving the toughness and deformation resistance of TiN, which has potential applications in the surface modification of medical devices.
In the end, we also found that Cu precipitated when the Cu content was high, and the interface of Cu and TiCuN appeared simultaneously distinctly in the doped system. In future, we intend to investigate how these changes in the interfacial bonding properties affect the mechanical properties of the Cu doped TiN system. The study of the uniaxial tensile behavior of TiCuN by combining experimental and theoretical calculations is ongoing, and the related results will be reported in a subsequent article.
Author Contributions
Conceptualization, D.X.; methodology, Y.F.; software, Y.F.; validation, D.M. and F.J.; formal analysis, Y.L.; investigation, Y.L.; resources, F.J.; data curation, D.M.; writing—original draft preparation, Y.F.; writing—review and editing, D.T.A.M. and R.G.; visualization, Y.F.; supervision, D.X.; project administration, D.X.; funding acquisition, Y.L. All authors have read and agreed to the published version of the manuscript.
Funding
This research was supported by the Science and Technology on Surface Physics and Chemistry Laboratory [grant number 6142A02190402] and the Sichuan Science and Technology Program (2021YFH0032).
Institutional Review Board Statement
Not applicable.
Informed Consent Statement
Not applicable.
Data Availability Statement
Data sharing is not applicable to this article.
Conflicts of Interest
The authors declare no conflict of interest.
References
- Tahara, H.; Ando, Y. Study of Titanium Nitride Deposition by Supersonic Plasma Spraying. Vacuum 2008, 83, 98–101. [Google Scholar] [CrossRef]
- Liu, Z.G.; Zheng, C.B.; Fu, Q.S. Hydrothermal Oxidation Improves Corrosion and Wear Properties of Multi-Arc Ion Plated Titanium Nitride Coating for Biological Application. J. Vac. 2022, 198, 110871. [Google Scholar] [CrossRef]
- Thanka Rajan, S.; Subramanian, B.; Arockiarajan, A. A Comprehensive Review on Biocompatible Thin Films for Biomedical Application. Ceram. Int. 2022, 48, 4377–4400. [Google Scholar] [CrossRef]
- Yang, D.; Lü, X.; Hong, Y.; Xi, T.; Zhang, D. The Molecular Mechanism for Effects of TiN Coating on NiTi Alloy on Endothelial Cell Function. Biomaterials 2014, 35, 6195–6205. [Google Scholar] [CrossRef] [PubMed]
- Song, M.; Yang, Y.; Guo, J.; Xiang, M.; Zhu, Q.; Ge, Y. A New Precursor for Fabricating TiN Coating on 316L Stainless Steel at Low Temperature Without Corrosive Byproducts. Ceram. Int. 2019, 45, 18265–18272. [Google Scholar] [CrossRef]
- Türkan, U.; Öztürk, O.; Eroğlu, A.E. Metal Ion Release from TiN Coated CoCrMo Orthopedic Implant Material. Surf. Coat. Technol. 2006, 200, 5020–5027. [Google Scholar] [CrossRef] [Green Version]
- Shayanfard, P.; Šandera, P.; Horníková, J.; Petruška, J.; Šittner, P.; Pokluda, J. Ni-Ti Self-Expanding Vascular Stent Configuration and Biomedical Interaction with Artery: Finite Element Analysis. Solid State Phenom. 2017, 258, 366–369. [Google Scholar] [CrossRef]
- Siddheswaran, R.; Mangalaraja, R.V.; Avila, R.E.; Manikandan, D.; Esther Jeyanthi, C.; Ananthakumar, S. Evaluation of Mechanical Hardness and Fracture Toughness of Co and Al Co-Doped ZnO. Mater. Sci. Eng. A 2012, 558, 456–461. [Google Scholar] [CrossRef]
- Din, I.U.; Salam, W.; Gillani, S.; Tahir, M.; Ikram, M.; Ali, S. Retraction notice to “Tuning the structure and optical properties of nanostructured CdS by Cu doping” [Optik 203 (2019) 164073]. Optik 2020, 203, 164707. [Google Scholar] [CrossRef]
- Zhang, S.; Bui, X.L.; Fu, Y. Magnetron-Sputtered nc-TiC/a-C (Al) Tough Nanocomposite Coatings. Thin Solid Films. 2004, 467, 261–266. [Google Scholar] [CrossRef]
- Ma, W.; Chen, F. Optical and Electronic Properties of Cu Doped Ag Clusters. J. Alloys Compd. 2012, 541, 79–83. [Google Scholar] [CrossRef]
- Khan, M.I.; Adil, F.; Majeed, S.; Farooq, W.A.; Hasan, M.S.; Jabeen, R.; Al-Mutairi, M.A.; Bukhtiar, A.; Iqbal, M. Structural, Morphological, Electrical and Optical Properties of Cu Doped DLC Thin Films. Mater. Res. Express 2019, 6, 126420. [Google Scholar] [CrossRef]
- Myung, H.S.; Lee, H.M.; Shaginyan, L.R.; Han, J.G. Microstructure and Mechanical Properties of Cu Doped TiN Superhard Nanocomposite Coatings. Surf. Coat. Technol. 2003, 163–164, 591–596. [Google Scholar] [CrossRef]
- Balashabadi, P.; Larijani, M.M.; Jafari-Khamse, E.; Seyedi, H. The Role of Cu Content on the Structural Properties and Hardness of TiN –Cu Nanocomposite Film. J. Alloys Compd. 2017, 728, 863–871. [Google Scholar] [CrossRef]
- Latushkina, S.D.; Romanov, I.M.; Zhizhchenko, A.G.; Posylkina, O.I.; Komarovskaya, V.M.; Piskunova, O.Y. Formation of Wear-Resistant Nanostructured TiN/Cu Coatings. J. Frict. Wear. 2016, 37, 27–31. [Google Scholar] [CrossRef]
- Zhang, L.; Ma, G.J.; Lin, G.Q.; Han, K.C.; Ma, H. Synthesis of Cu Doped TiN Composite Films Deposited by Pulsed Bias Arc Ion Plating. Nucl. Instrum. Methods Phys. Res. B 2014, 320, 17–21. [Google Scholar] [CrossRef]
- Peng, C.; Zhao, Y.; Jin, S.; Wang, J.; Liu, R.; Liu, H.; Shi, W.; Kolawole, S.K.; Ren, L.; Yu, B.; et al. Antibacterial TiCu/TiCuN Multilayer Films with Good Corrosion Resistance Deposited by Axial Magnetic Field-Enhanced Arc Ion Plating. ACS Appl. Mater. Interfaces 2019, 11, 125–136. [Google Scholar] [CrossRef]
- Kelly, P.J.; Li, H.; Benson, P.S.; Whitehead, K.A.; Verran, J.; Arnell, R.D.; Iordanova, I. Comparison of the Tribological and Antimicrobial Properties of CrN/Ag, ZrN/Ag, TiN/Ag, and TiN/Cu Nanocomposite Coatings. Surf. Coat. Technol. 2010, 205, 1606–1610. [Google Scholar] [CrossRef]
- Wang, H.; Shu, X.; Guo, M.; Huang, D.; Li, Z.; Li, X.; Tang, B. Structural, Tribological and Antibacterial Activities of Ti–Cu–N Hard Coatings Prepared by Plasma Surface Alloying Technique. Surf. Coat. Technol. 2013, 235, 235–240. [Google Scholar] [CrossRef]
- Zhao, Y.; Wang, X.; Xiao, J.; Yu, B.; Li, F. Ti–Cu–N Hard Nanocomposite Films Prepared by Pulse Biased Arc Ion Plating. Appl. Surf. Sci. 2011, 258, 370–376. [Google Scholar] [CrossRef]
- Pinakidou, F.; Paloura, E.C.; Matenoglou, G.M.; Patsalas, P. Nanostructural Characterization of TiN–Cu Films Using EXAFS Spectroscopy. Surf. Coat. Technol. 2010, 204, 1933–1936. [Google Scholar] [CrossRef]
- Zhang, X.; Sun, S.; Su, D.; Wu, H. Structure and Properties of TiCuN Coatings by HCD Assisted AIP. Surf. Eng. 2016, 32, 223–228. [Google Scholar] [CrossRef]
- Luo, X.Y.; Ma, D.L.; Jing, P.P.; Gong, Y.L.; Zhang, Y.; Jing, F.J.; Leng, Y.X. In Vitro Analysis of Cell Compatibility of TiCuN Films with Different Cu Contents. Surf. Coat. Technol. 2021, 408, 126790. [Google Scholar] [CrossRef]
- Ma, Q.C.; Zhang, S.; Zhou, Q.; Shi, X.W. A First-Principles Study on Optical Properties and Dispersion Analysis of TiN Thin Films. Mater. Sci. Technol. 2019, 27, 85–89. [Google Scholar] [CrossRef]
- Kan, Q.; Yan, W.; Kang, G.; Sun, Q. Oliver–Pharr Indentation Method in Determining Elastic Moduli of Shape Memory Alloys—A Phase Transformable Material. J. Mech. Phys. Solids. 2013, 61, 2015–2033. [Google Scholar] [CrossRef]
- Lazar, P.; Redinger, J.; Podloucky, R. Density Functional Theory Applied to V N/Ti N Multilayers. Phys. Rev. B 2007, 76, 174112. [Google Scholar] [CrossRef]
- Kutschej, K.; Rashkova, B.; Shen, J.; Edwards, D.; Mitterer, C.; Dehm, G. Experimental Studies on Epitaxially Grown TiN and VN Films. Thin Solid Films 2007, 516, 369–373. [Google Scholar] [CrossRef]
- Segall, M.D.; Lindan, P.J.D.; Probert, M.J.; Pickard, C.J.; Hasnip, P.J.; Clark, S.J.; Payne, M.C. First-Principles Simulation: Ideas, Illustrations and the CASTEP Code. J. Phys. Condens. Matter. 2002, 14, 2717–2744. [Google Scholar] [CrossRef]
- Warren, B.E. X-Ray Diffraction. Courier Corporation: North Chelmsford, MA, USA, 1990. [Google Scholar]
- Scherrer, P.; Gottingen, N.G.W. Estimation of the size and internal structure of colloidal particles by means of röntgen. Nachr. Ges. Wiss. 1918, 2, 96–100. [Google Scholar]
- Zhang, Y.J.; Qin, Y.G.; Qing, Y.A.; Deng, R.P.; Jin, H.; Li, R.Y.; Rehman, J.; Wen, M.; Zhang, K. TiCuN Solid Solution Coating: Excellent Wear-Resistant Biocompatible Material to Protect Artificial Joint. Mater. Lett. 2018, 227, 145–148. [Google Scholar] [CrossRef]
- Hu, D.C. Metal Structure and Corrosion Resistance. Aerospace Press: Beijing, China, 1987. [Google Scholar]
- Sahu, B.R. Electronic Structure and Bonding of Ultralight LiMg. Mater. Sci. Eng. B 1997, 49, 74–78. [Google Scholar] [CrossRef]
- Sevinçek, R.; Aygün, M.; Şahin, Y. Enthalpy of Formation Calculations on Five-Membered Azaborolidine Derivatives. J. Mol. Struct. 2020, 1217, 128321. [Google Scholar] [CrossRef]
- Mouhat, F.; Coudert, F. Necessary and Sufficient Elastic Stability Conditions in Various Crystal Systems. Phys. Rev. B 2014, 90, 224104. [Google Scholar] [CrossRef] [Green Version]
- Pugh, S.F. Relations Between the Elastic Moduli and the Plastic Properties of Polycrystalline Pure Metals. Lond. Edinb. Dublin Philos. Mag. J. Sci. 1954, 45, 823–843. [Google Scholar] [CrossRef]
- Chen, X.; Niu, H.; Li, D.; Li, Y. Modeling Hardness of Polycrystalline Materials and Bulk Metallic Glasses. Intermetallics 2011, 19, 1275–1281. [Google Scholar] [CrossRef] [Green Version]
- Chen, H.S. Elastic Anisotropy of Metals; Metallurgical Industry Press: Beijing, China, 1996. [Google Scholar]
- Sofi, S.A.; Gupta, D.C. High Pressure-Temperature Study on Thermodynamics, Half-Metallicity, Transport, Elastic and Structural Properties of Co-Based Heusler Alloys: A First-Principles Study. J. Solid State Chem. 2020, 284, 121178. [Google Scholar] [CrossRef]
- Cao, Z.; Jin, N.; Ye, J.; Du, X.; Liu, Y. First-Principles Study on the Effects of N and Al Doping on the Mechanical Properties and Electronic Structures of TiC. RSC Adv. 2020, 10, 36295–36302. [Google Scholar] [CrossRef]


Publisher’s Note: MDPI stays neutral with regard to jurisdictional claims in published maps and institutional affiliations. |
© 2022 by the authors. Licensee MDPI, Basel, Switzerland. This article is an open access article distributed under the terms and conditions of the Creative Commons Attribution (CC BY) license (https://creativecommons.org/licenses/by/4.0/).