1. Introduction
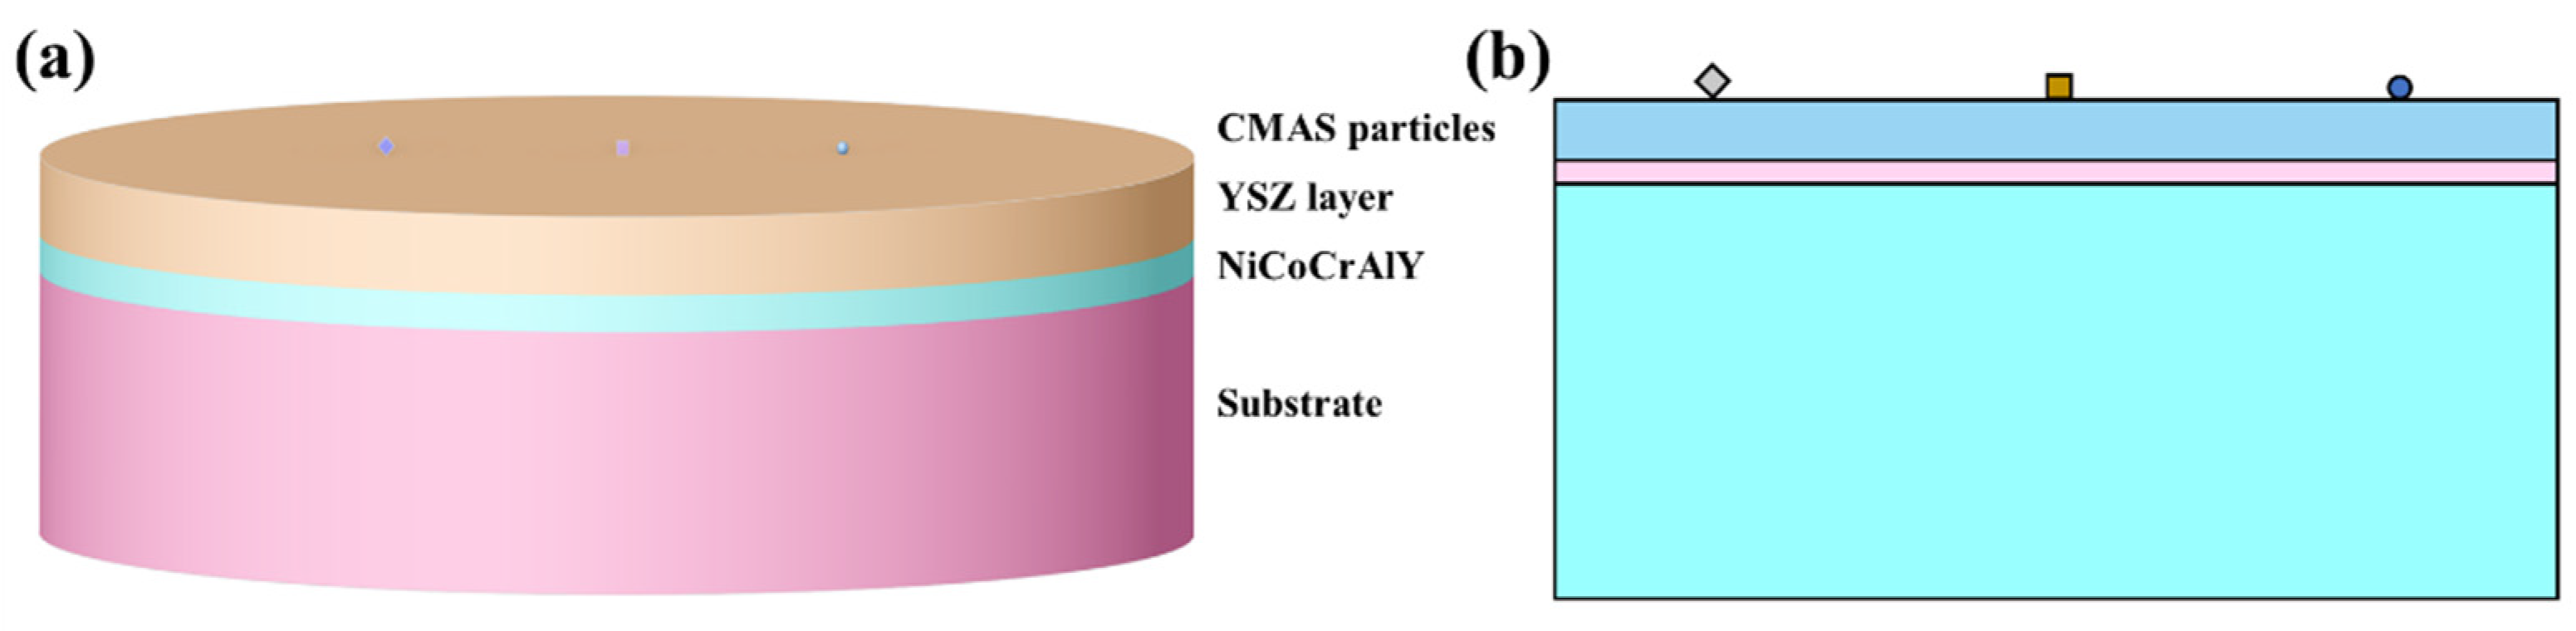
As mainstream coating materials, thermal barrier coatings (TBCs) are usually coated onto the surface of superalloys. Apart from being used as the thermal insulation part of critical industrial components, TBCs are also widely used in aeroengines or gas turbines with high working temperatures. The main composition of TBCs is yttria-stabilized zirconia (YSZ). Y
2O
3-ZrO
2 composite powder with a mass ratio of 7% Y
2O
3 is usually deposited onto the surface of the metallic layer by electron beam–physical vapor deposition (EB–PVD) or atmospheric plasma spraying (APS) [
1]. Therefore, TBCs usually consist of two layers: the ceramic top-coat (TC) layer which provides thermal insulation and the bond-coat (BC) layer which is deposited between the ceramic layer and superalloy substrate. The BC layer is to prevent the oxidation of the substrate and provide necessary adhesion between the coating and the substrate [
2]. YSZ coating is widely used in engineering due to its excellent structural stability, high thermal shock resistance, relatively large thermal expansion coefficient and high fracture toughness.
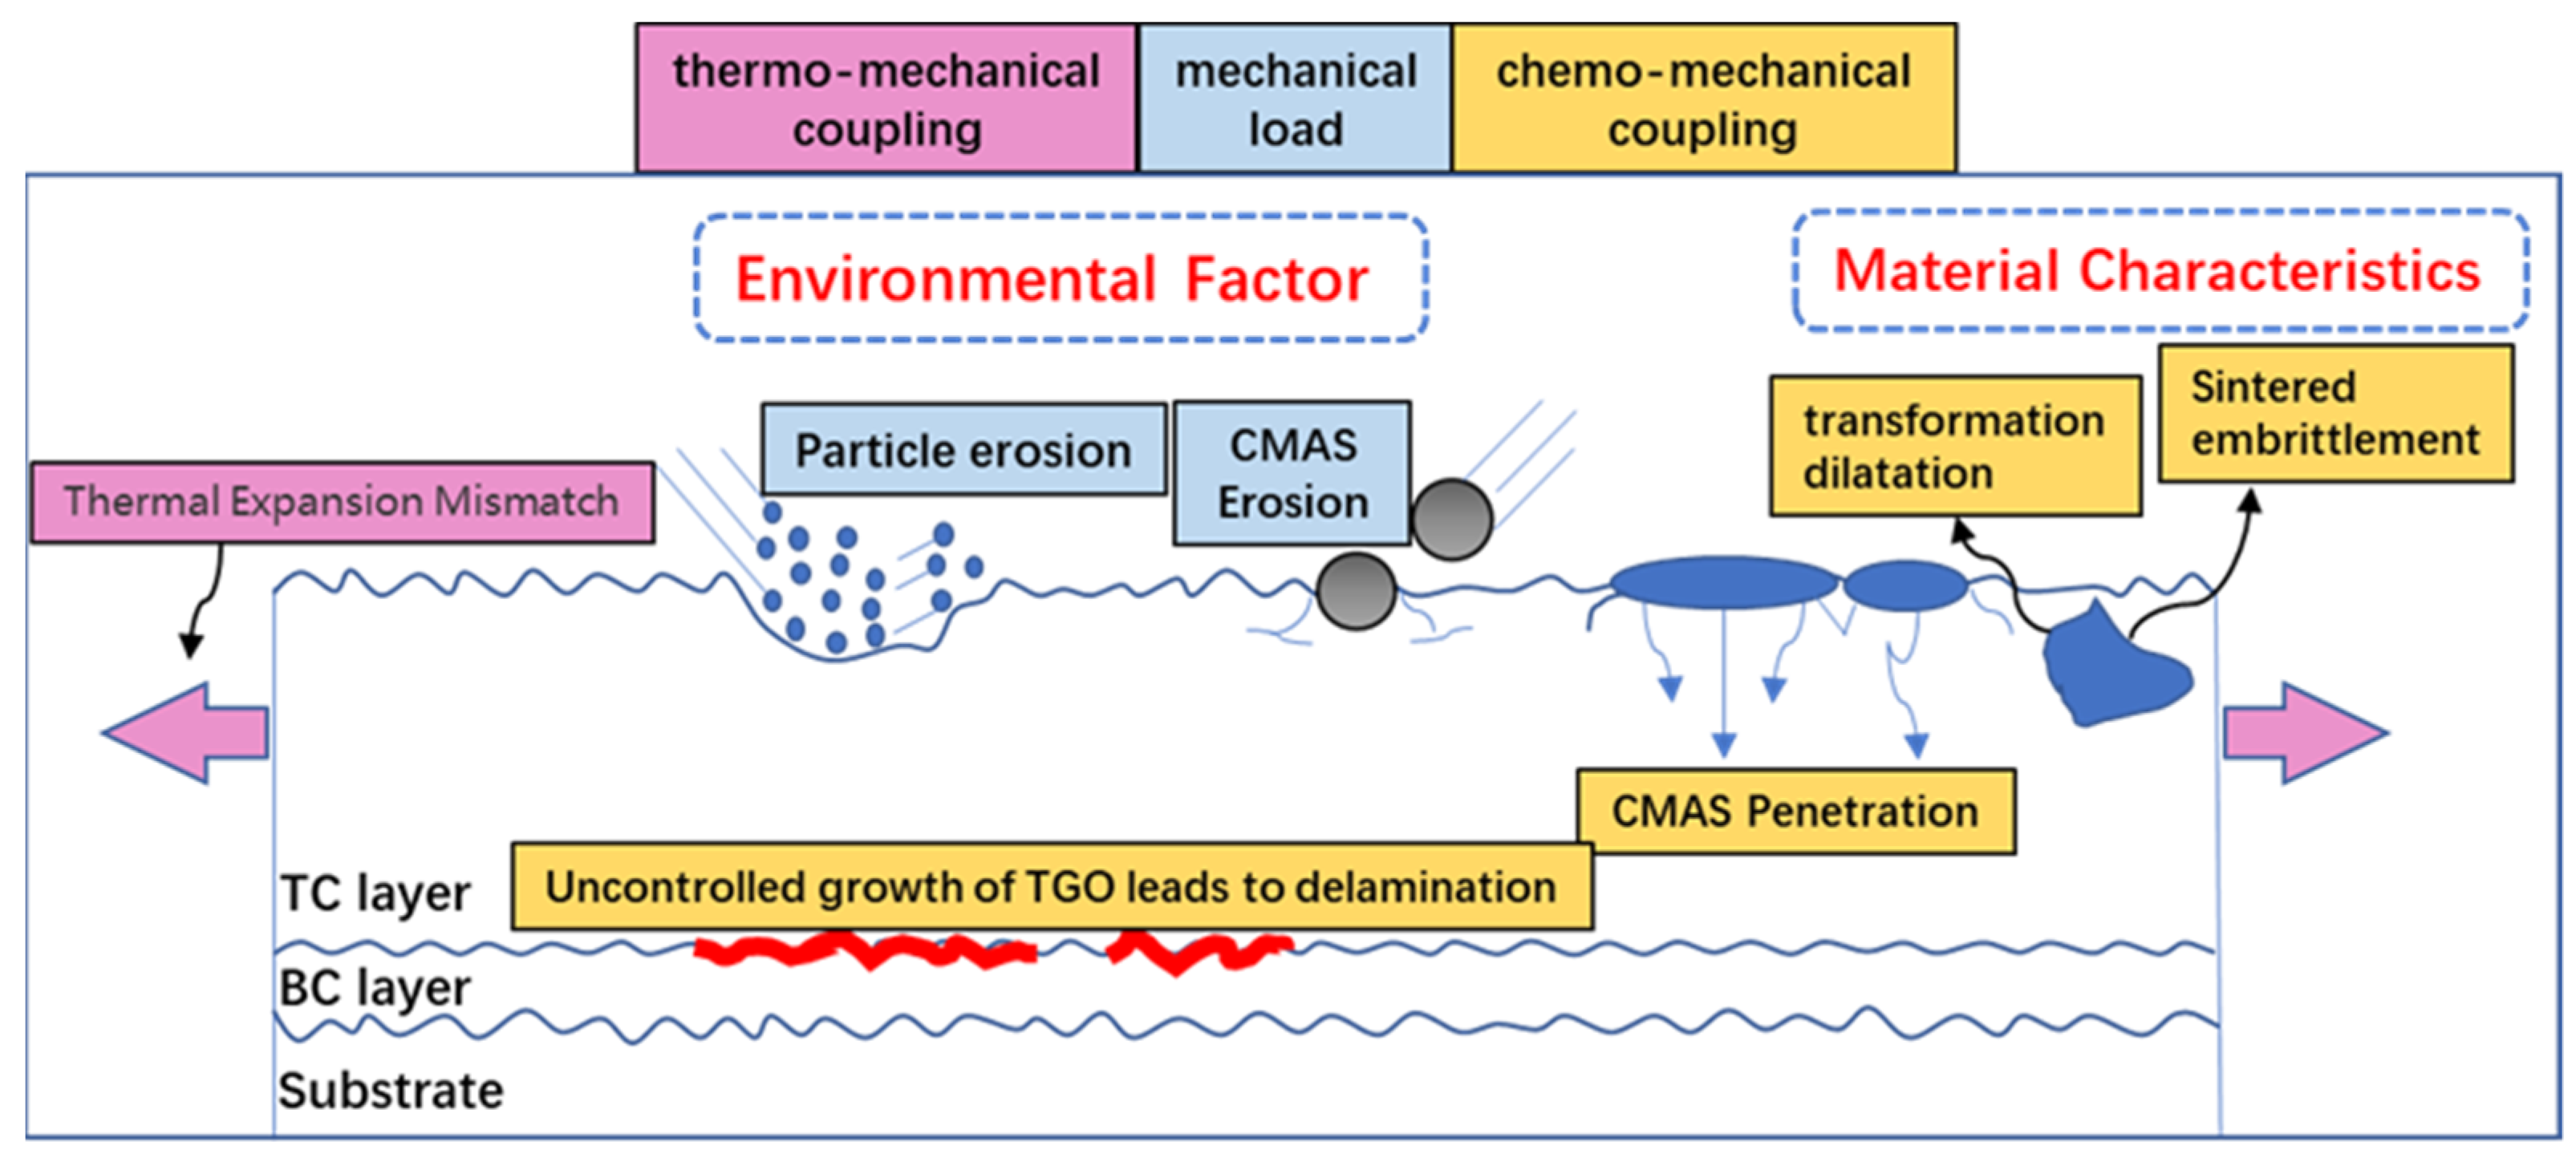
There are many factors leading to the failure of TBCs, which generally can be categorized into two types: the material properties and the environmental impacts [
3,
4]. The material properties are the layered structure and pores and microcracks on the interior and surface of the coatings. Environmental impacts mainly concern damage of the TBCs by operating conditions, including thermal shock, high-temperature oxidation and particle erosion [
5]. As shown in
Figure 1, regardless of the failure modes of TBCs, it can be attributed to crack propagation and interface delamination [
6].
As for blades in gas turbines applied in aviation propulsion or power generation, when the blades were operated under conditions full of foreign particles, especially silicate based particles in the air (possibly from volcanic ash, sand, concrete dust and other ways), these solid particles are sucked into the compressor together with the air in the engine intake and erode the interior of the engine at a certain speed [
7]. The source of corrosion damage is thus caused by foreign objects hitting the internal parts of the turbine. The high-pressure turbine components in advanced aeroengines are damaged due to CaO-MgO-Al
2O
3-SiO
2 (CMAS) erosion, degrading their service performance [
8]. The design of the emerging gas turbine has always been targeted at increasing the inlet temperature of the engine, for the sake of improving the thermal efficiency. However, the increase of inlet air temperature will bring some adverse effects. With the increase of inlet temperature, the possibility of silicon-based particles being heated above their melting point has also significantly increased [
9]. Yang et al. [
10] have found that the thicker the deposition thickness of CMAS, the easier it is to form cracks at the YSZ/BC interface during cooling. However, during the process of the suction of the engine, the damage of the particle erosion to the engine cannot be ignored. Due to the complexity of the erosion, it becomes difficult to determine the erosion damage mechanism just though experiments. Therefore, the exploration of CMAS particle erosion via finite element simulation becomes more and more important. Cai et al. [
11] have studied the failure mechanism of CMAS corrosion and erosion of TBCs by developing a three-dimensional model of a turbine blade coated with TBCs and summarized the key factors affecting the spalling failure of TBCs. Su et al. [
12] have established the penetration behavior of CMAS during the high-temperature operation of thermal barrier coatings fabricated by electron beam–physical vapor deposition (EB–PVD). They also studied the evolution process of bending of the thermally grown oxide (TGO) during the penetration process and obtained the influence factors of the CMAS erosion on the effective elastic modulus of the TC layer in the EB–PVD TBCs during the penetration process of CMAS. Reducing the impact of CMAS particles on the coating can effectively improve the performance of the coating. The damage effect of CMAS on YSZ coating has attracted extensive attention in the industry. Stefania Morelli et al. [
13] studied the corrosion process of YSZ TBCs prepared by two different techniques (APS, SPS) caused by molten CMAS particles and it was concluded that the molten CMAS preferentially attack and dissolve the boundary between the YSZ grains. Thus, the YSZ grains are completely separated and the coating fails. Wang et al. [
14] have conducted a series of experiments at 1350 °C on three different YSZ TBCs prepared by atmospheric plasma spraying (APS) and found that Y
3+ in YSZ diffused from ceramic layer to CMAS melt, formed Y-poor ZrO
2 and Ca
4Y
6(SiO
4)
6O/Y
4·67(SiO
4)
3O in TBCs and the failure of 8YSZ occurred at the interface between the ceramic layer and the TGO/ bond-coat layer. Molten CMAS particles entered the coating via cracks on the surface of the ceramic coating, resulting in coating failure. Note that the incompletely melted or unmelted CMAS particles cause damage to the coating when the YSZ suffered impact erosion at high speeds, resulting in more cracks, which shorten the service time of the YSZ. However, the reported research methods are not enough to determine the change of the internal residual stress of the coating during erosion, as well as the distribution and evolution characteristics of the residual stress of TBCs. What is more, the numerical simulation method can be used to systematically study the characteristics of the residual stress of the TBCs.
Finite element simulation methods were used to study the impact erosion behavior of CMAS particles. Controllable parameters were chosen, including the impact velocity, impact angle and morphology of the CMAS particles. Through the analysis of the simulation results, the critical factors leading to the coating failure were uncovered, and the effects of the impact velocity and angle on the residual stress of TBCs were also investigated systematically in this work.
3. Results and Discussion
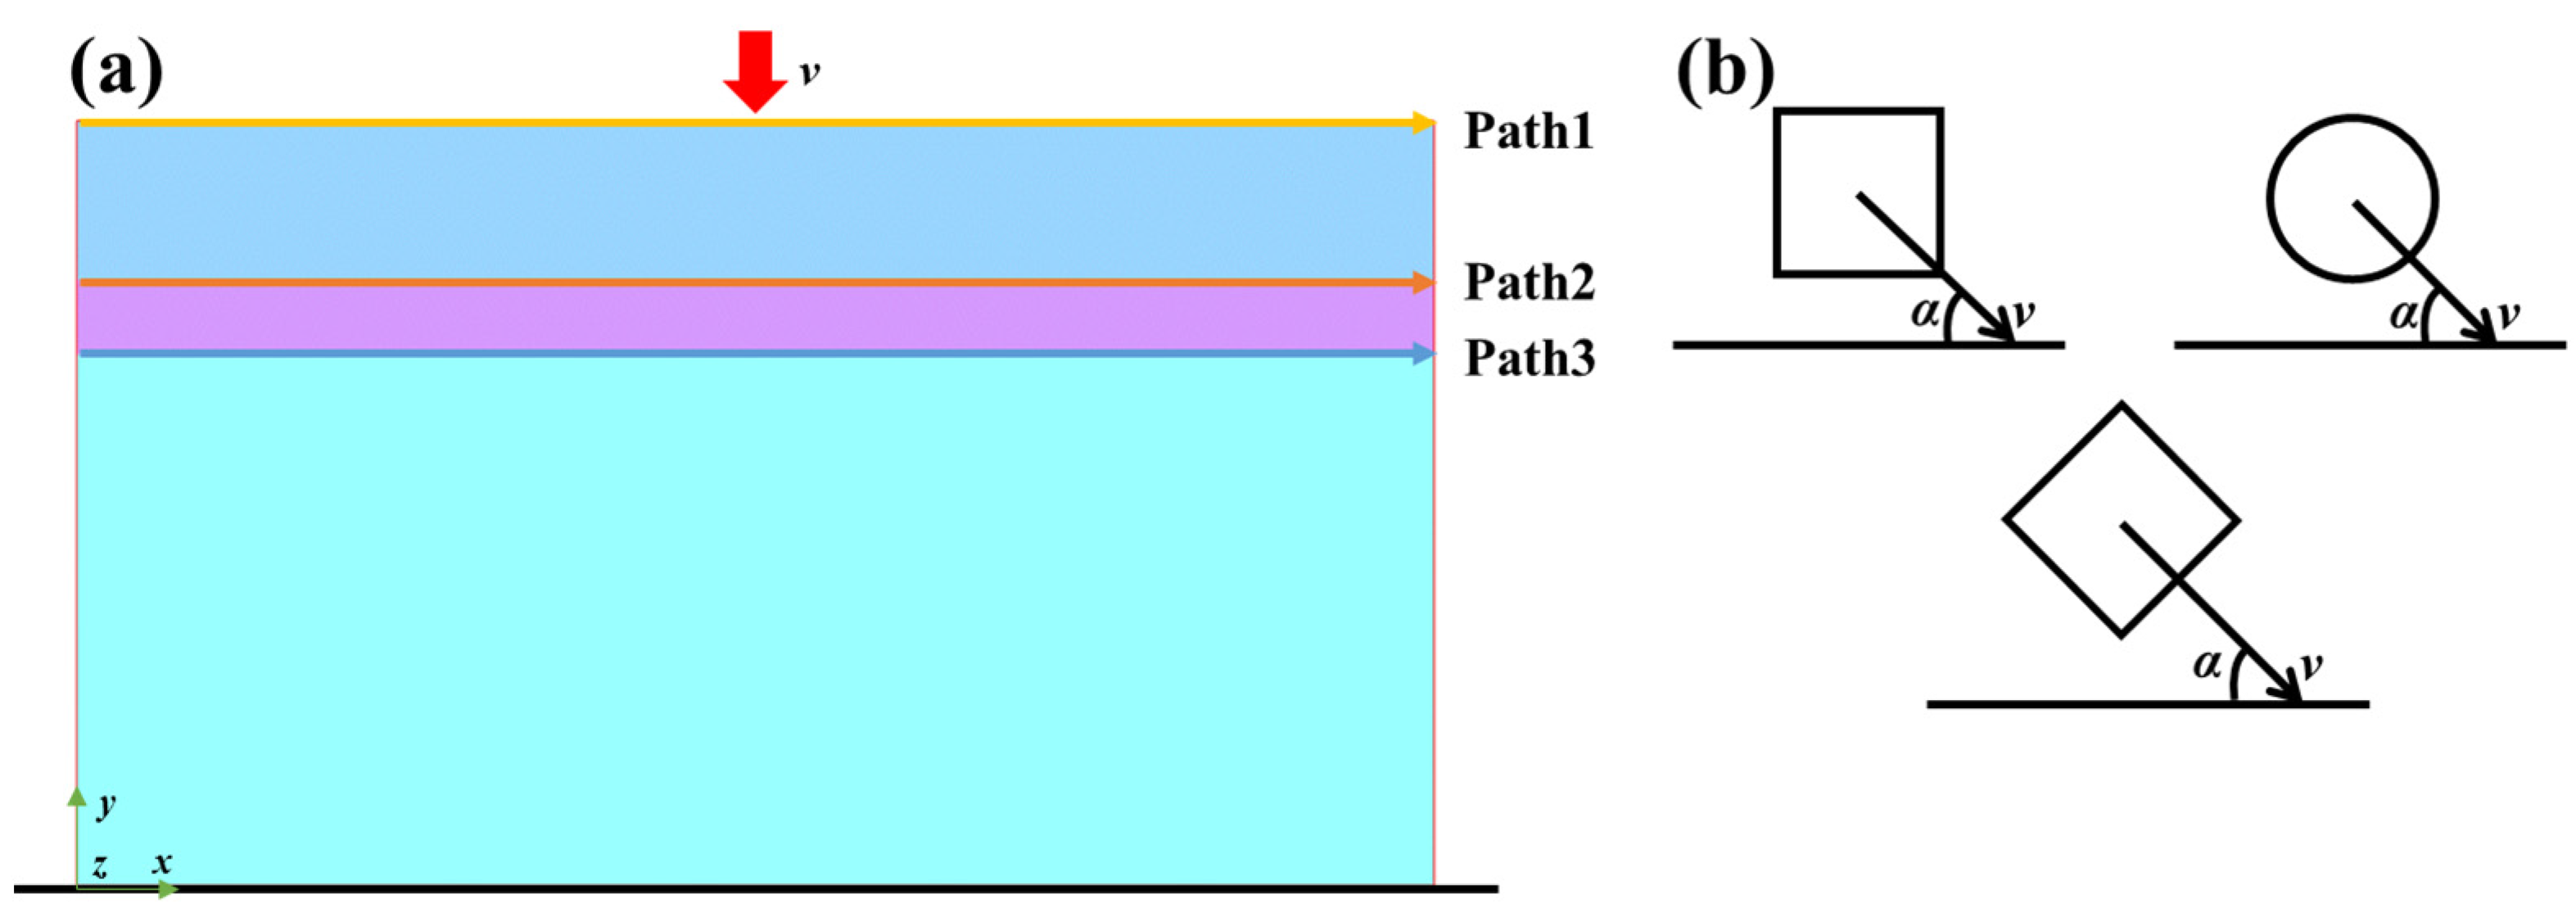
As shown in
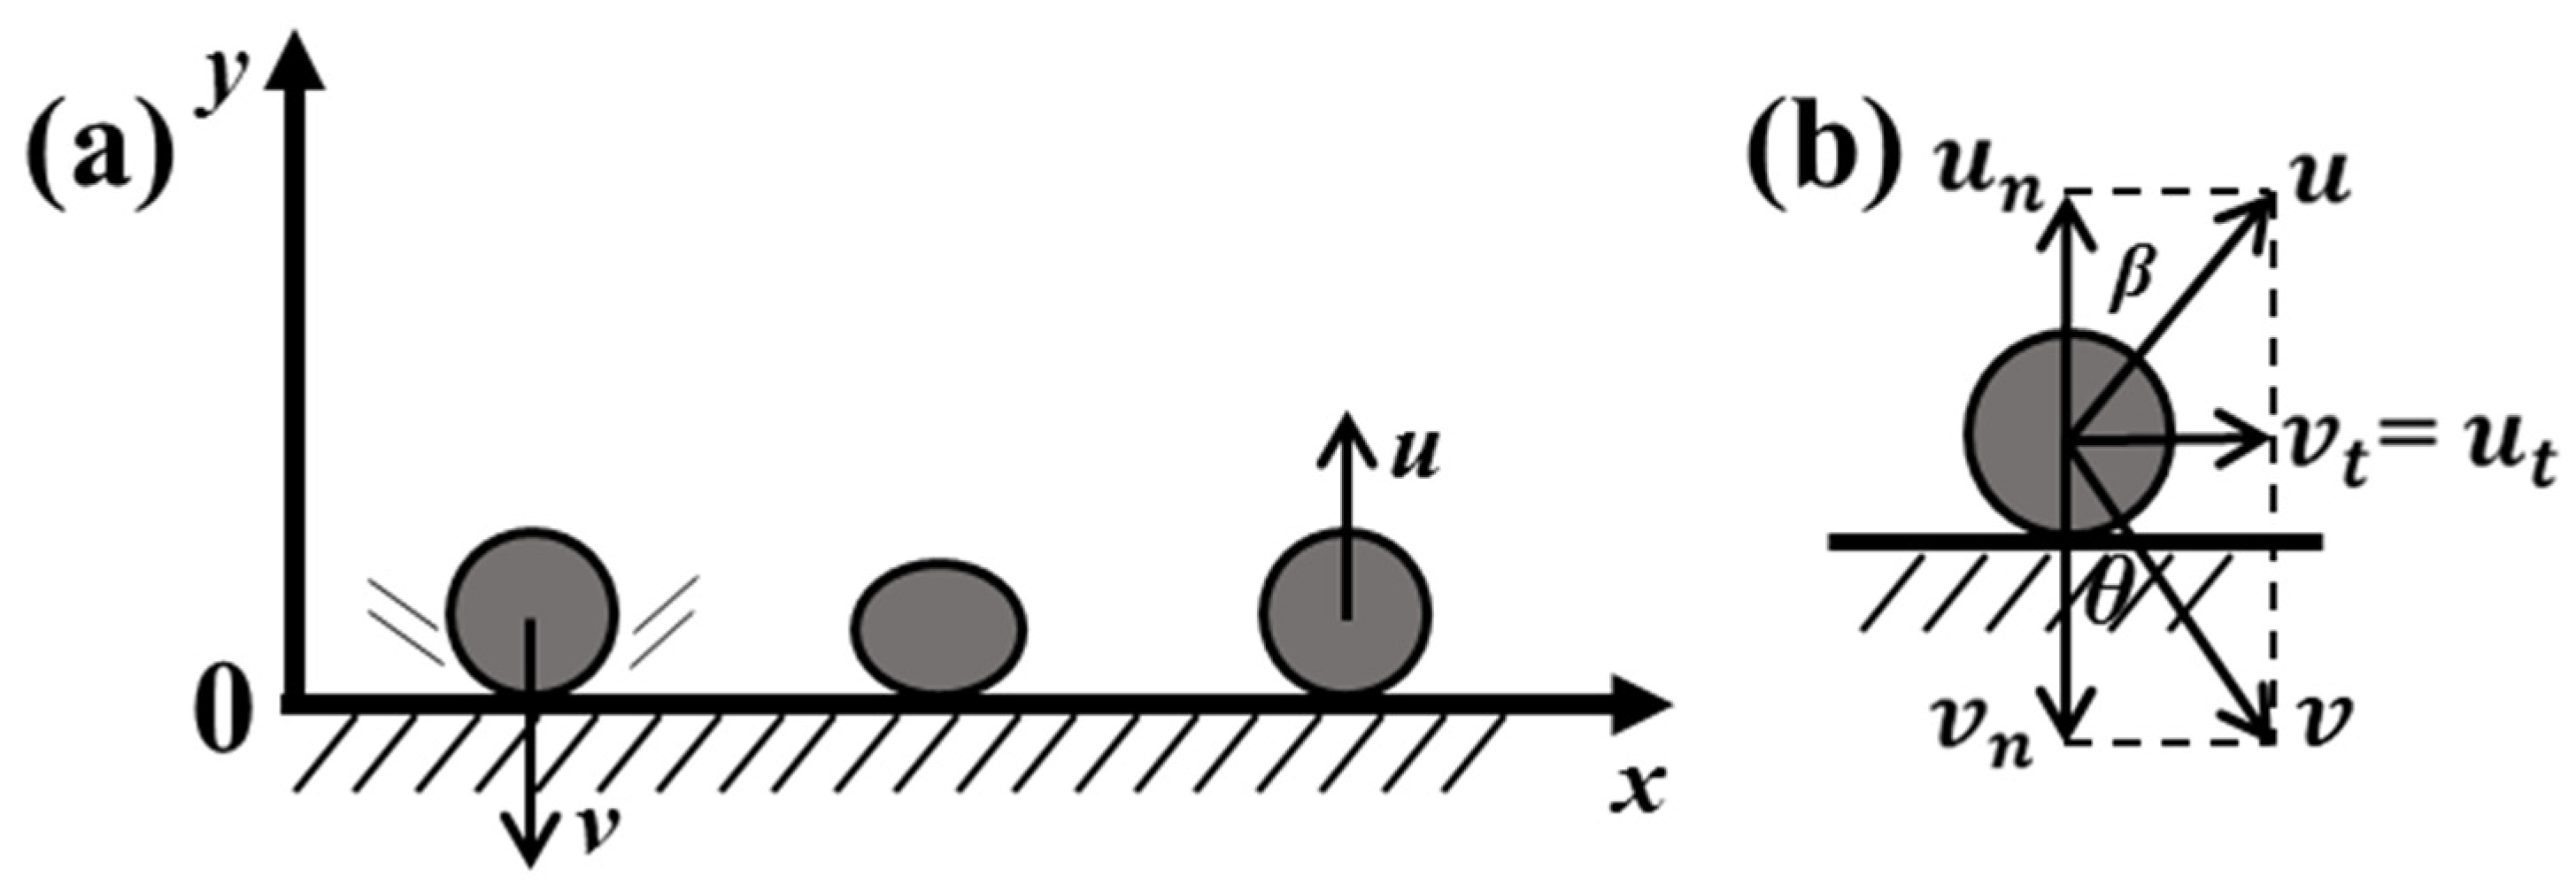
Figure 4a, in order to facilitate comparison and understand the damage of impact on the TBCs and the interfaces of each coating layer, three paths are defined. The contact layer between the YSZ top layer and the CMAS particles is defined as “path 1”, the interface between the YSZ layer and the NiCoCrAlY layer is defined as “path 2” and the interface between the NiCoCrAlY layer and the substrate is defined as “path 3”. The default direction of each coating is from left to right. In order to ensure the continuity of data, we took a stress point every 0.01 mm on the path and connected each stress point, i.e., the stress distribution along the path. Based on the combination of the velocity of CMAS particles moving in the X and Y directions, several parameters (erosion velocity, erosion angle and particle shape) under the high-speed erosion damage of CMAS to YSZ coating can be studied by using the controlled variable method. The erosion angles are respectively 30°, 45°, 60° and 90°. The particle erosion velocities of CMAS are, respectively, 20 m/s, 50 m/s and 100 m/s, with three contact types: surface contact, line contact and point contact. Erosion angle α, the definition of erosion velocity v and the CMAS particle shape are shown in
Figure 4b.
When the CMAS particle impacts on the coated surface, the positive collision of the particle on the coating is considered, i.e., α = 90°, and this collision process can be divided into two stages: deformation and recovery. In the deformation phase, the particle impacts on the coating with a certain velocity, v, as during the normal phase, and the object deformation increases rapidly due to the received collision impulse I
1 on the surface of the coating, while its velocity decreases rapidly to zero, as shown in
Figure 5a. When applying the impulse theorem on the
y-axis at this stage the projection equation is:
In the second stage, the elastic deformation of the object is gradually restored and the reverse speed is obtained. When the object leaves the fixed surface with the velocity u, it marks the end of the collision process. Suppose the collision impulse of the second stage is I
2 and the projection formula of the impulse theorem on the
y-axis is applied to the second stage:
Then, due to the momentum loss during the collision, the speed u of the object after the collision is always less than the speed v before the collision. When studying the collision process, it was found that for an object determined by the material, regardless of the speed before and after the collision, the ratio of the speed before and after the collision was a constant as related to the material. This constant is called the recovery factor and is defined as:
The recovery factor reflects the degree of loss of kinetic energy of the object before and after the collision, and also the degree of recovery of the object after deformation. Therefore, we note that the velocity before and after the collision is related to the collision impulse in the two phases of the collision process, which is derived from Equations (3)–(5) and can be expressed as:
The recovery factor is a constant that relates to the nature of the material collision. In general, the collision process experiences kinetic energy loss, so when 0 < k < 1, it is called elastic collision. In an ideal situation, if the kinetic energy loss were negligible, then k = 1, and this collision could be called a completely elastic collision. In the worst scenario, if the collision deformation did not return at all, then k = 0, and this collision would be called a plastic collision. From the simulation results, it can be seen that the velocity of the second stage in the collision process, u, is less than the velocity of the first stage, v; that k < 1 and must be greater than 0, so the erosion process is an elastic collision one.
When the particle strikes the coating with velocity v at an angle of θ in the normal direction, the collision ends with a velocity u tuned away from the normal direction at an angle of β, as in F
Figure 5b, assuming that the collision occurs only in the normal direction.
where u
n and v
n are the projections of u and v in the normal direction.
Suppose the magnitude of the tangential velocity is represented by u
t and v
t, respectively, then
Due to the conservation of momentum in the tangent direction, there is
Thus, from Equations (9) and (10), the recovery factor can be expressed as
since k < 1, θ < β when the surface of the collision object tends to be smooth.
3.1. Protection of Coating to Substrate
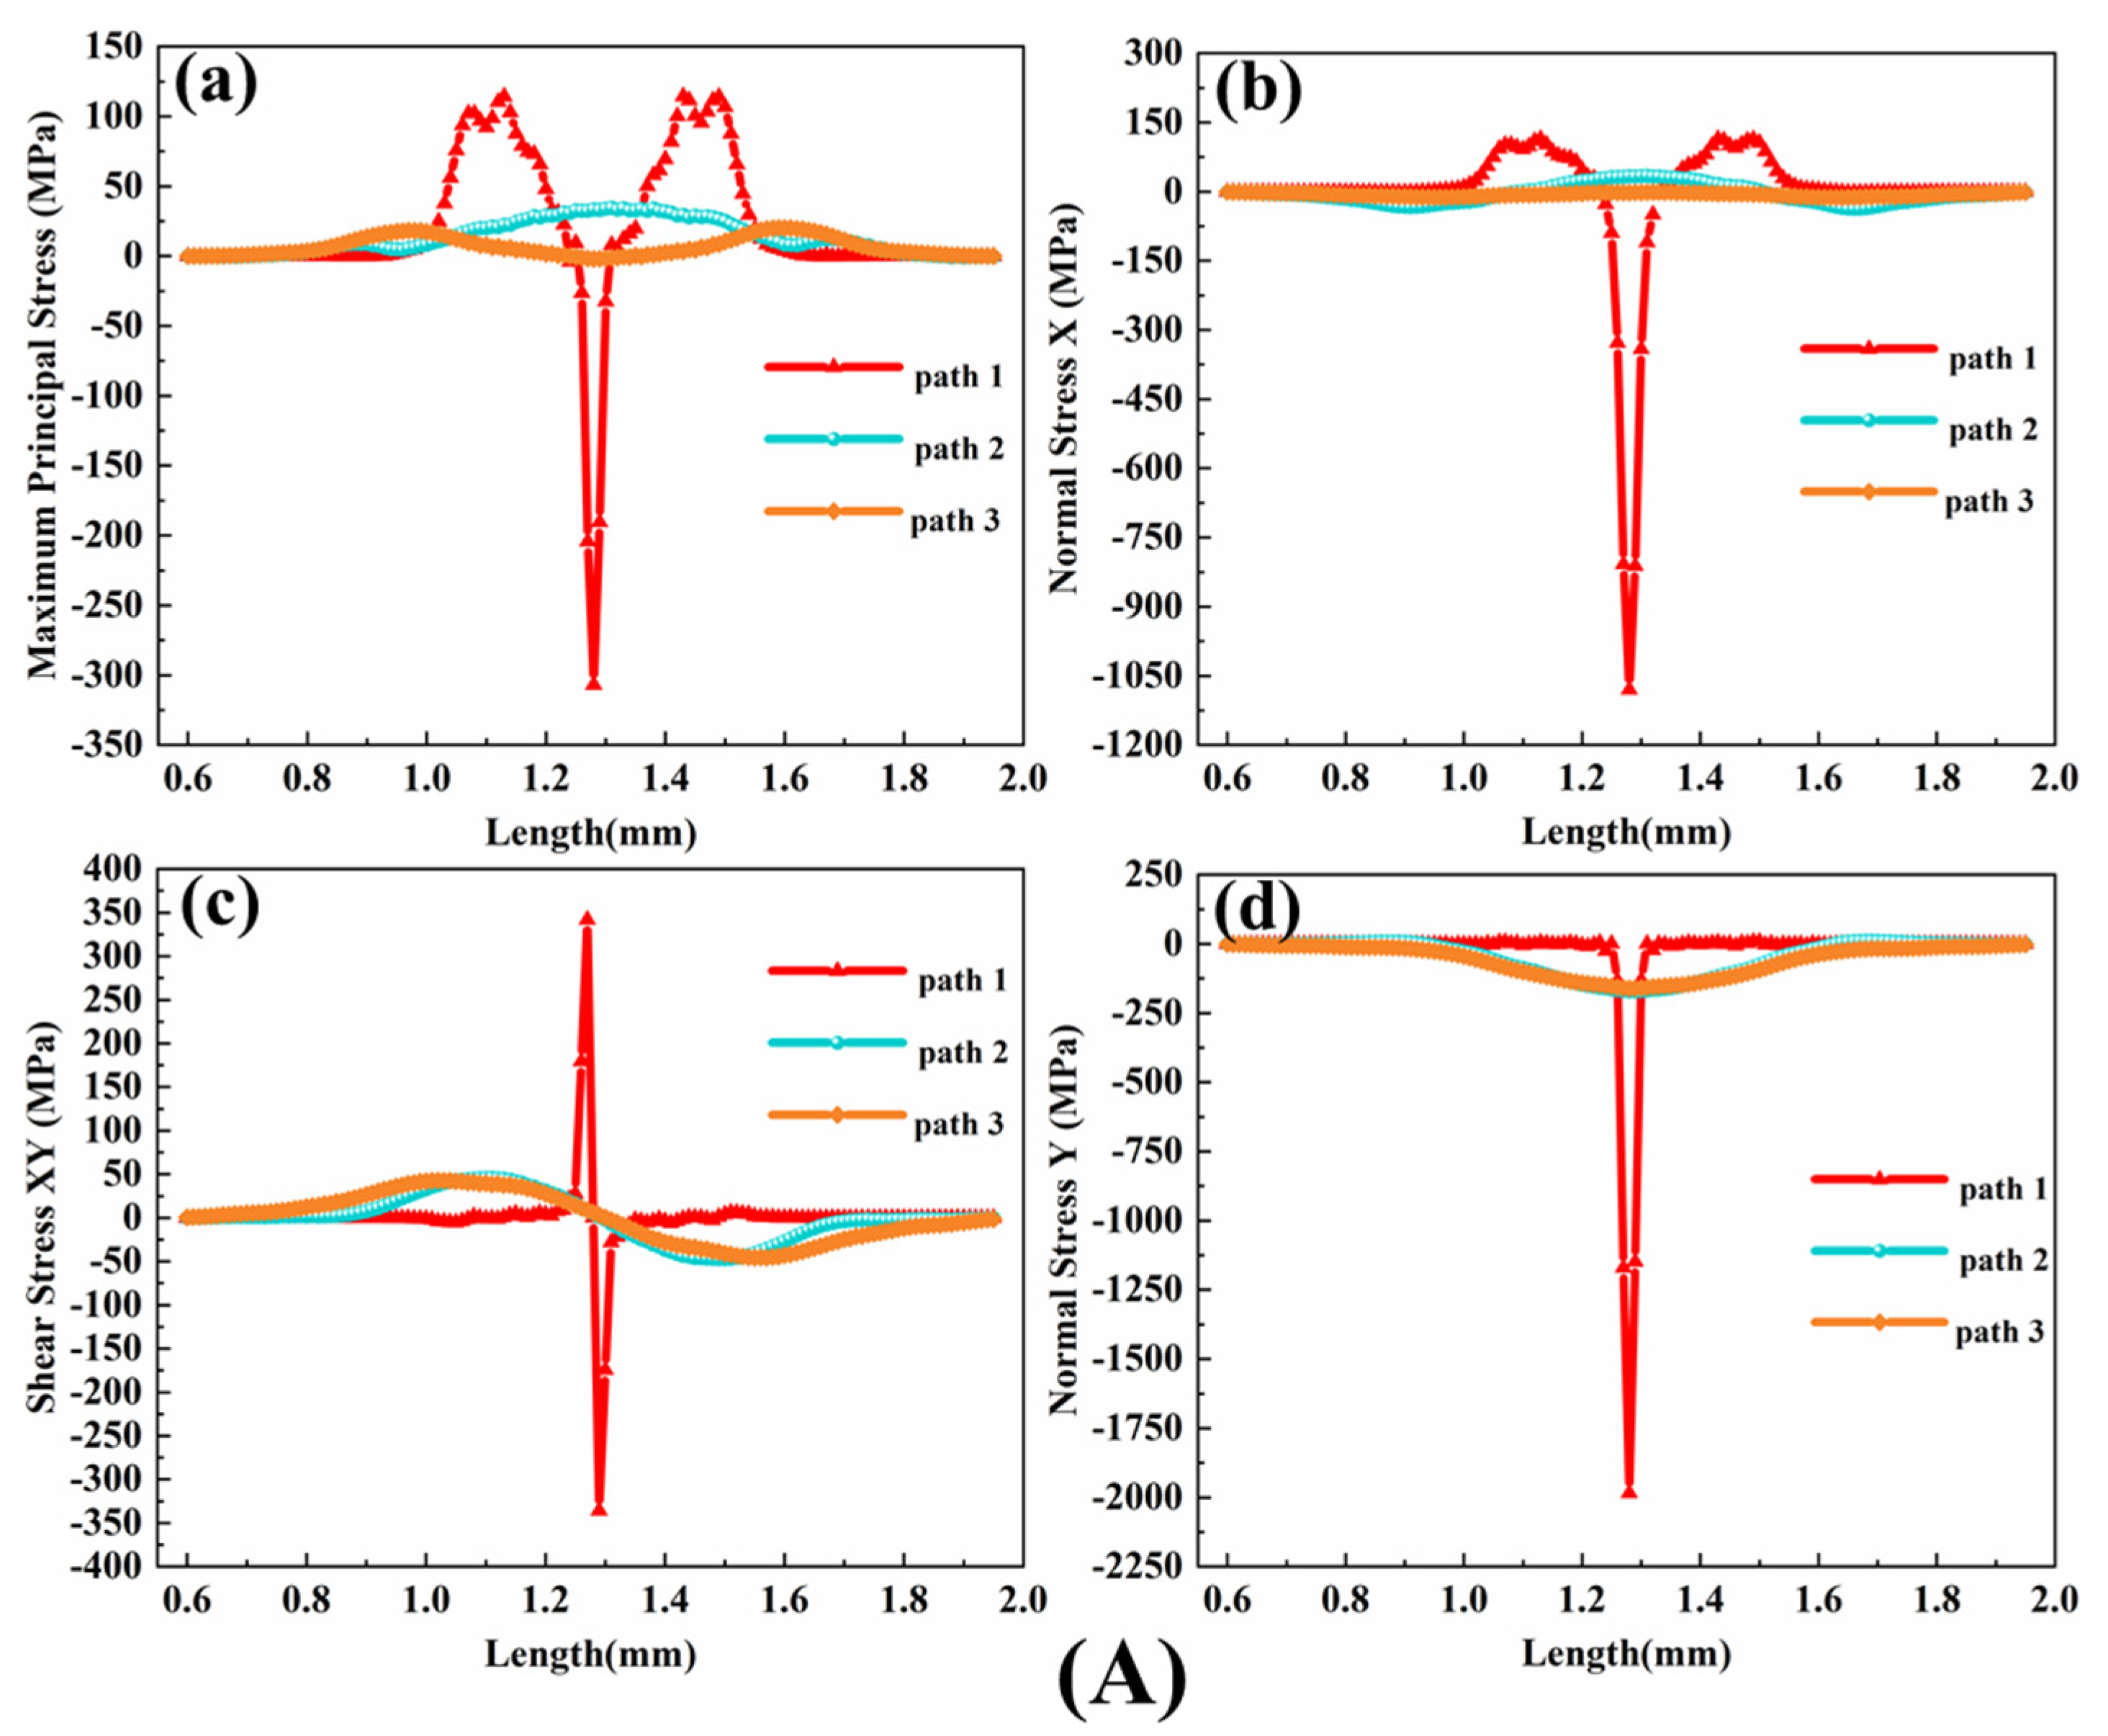
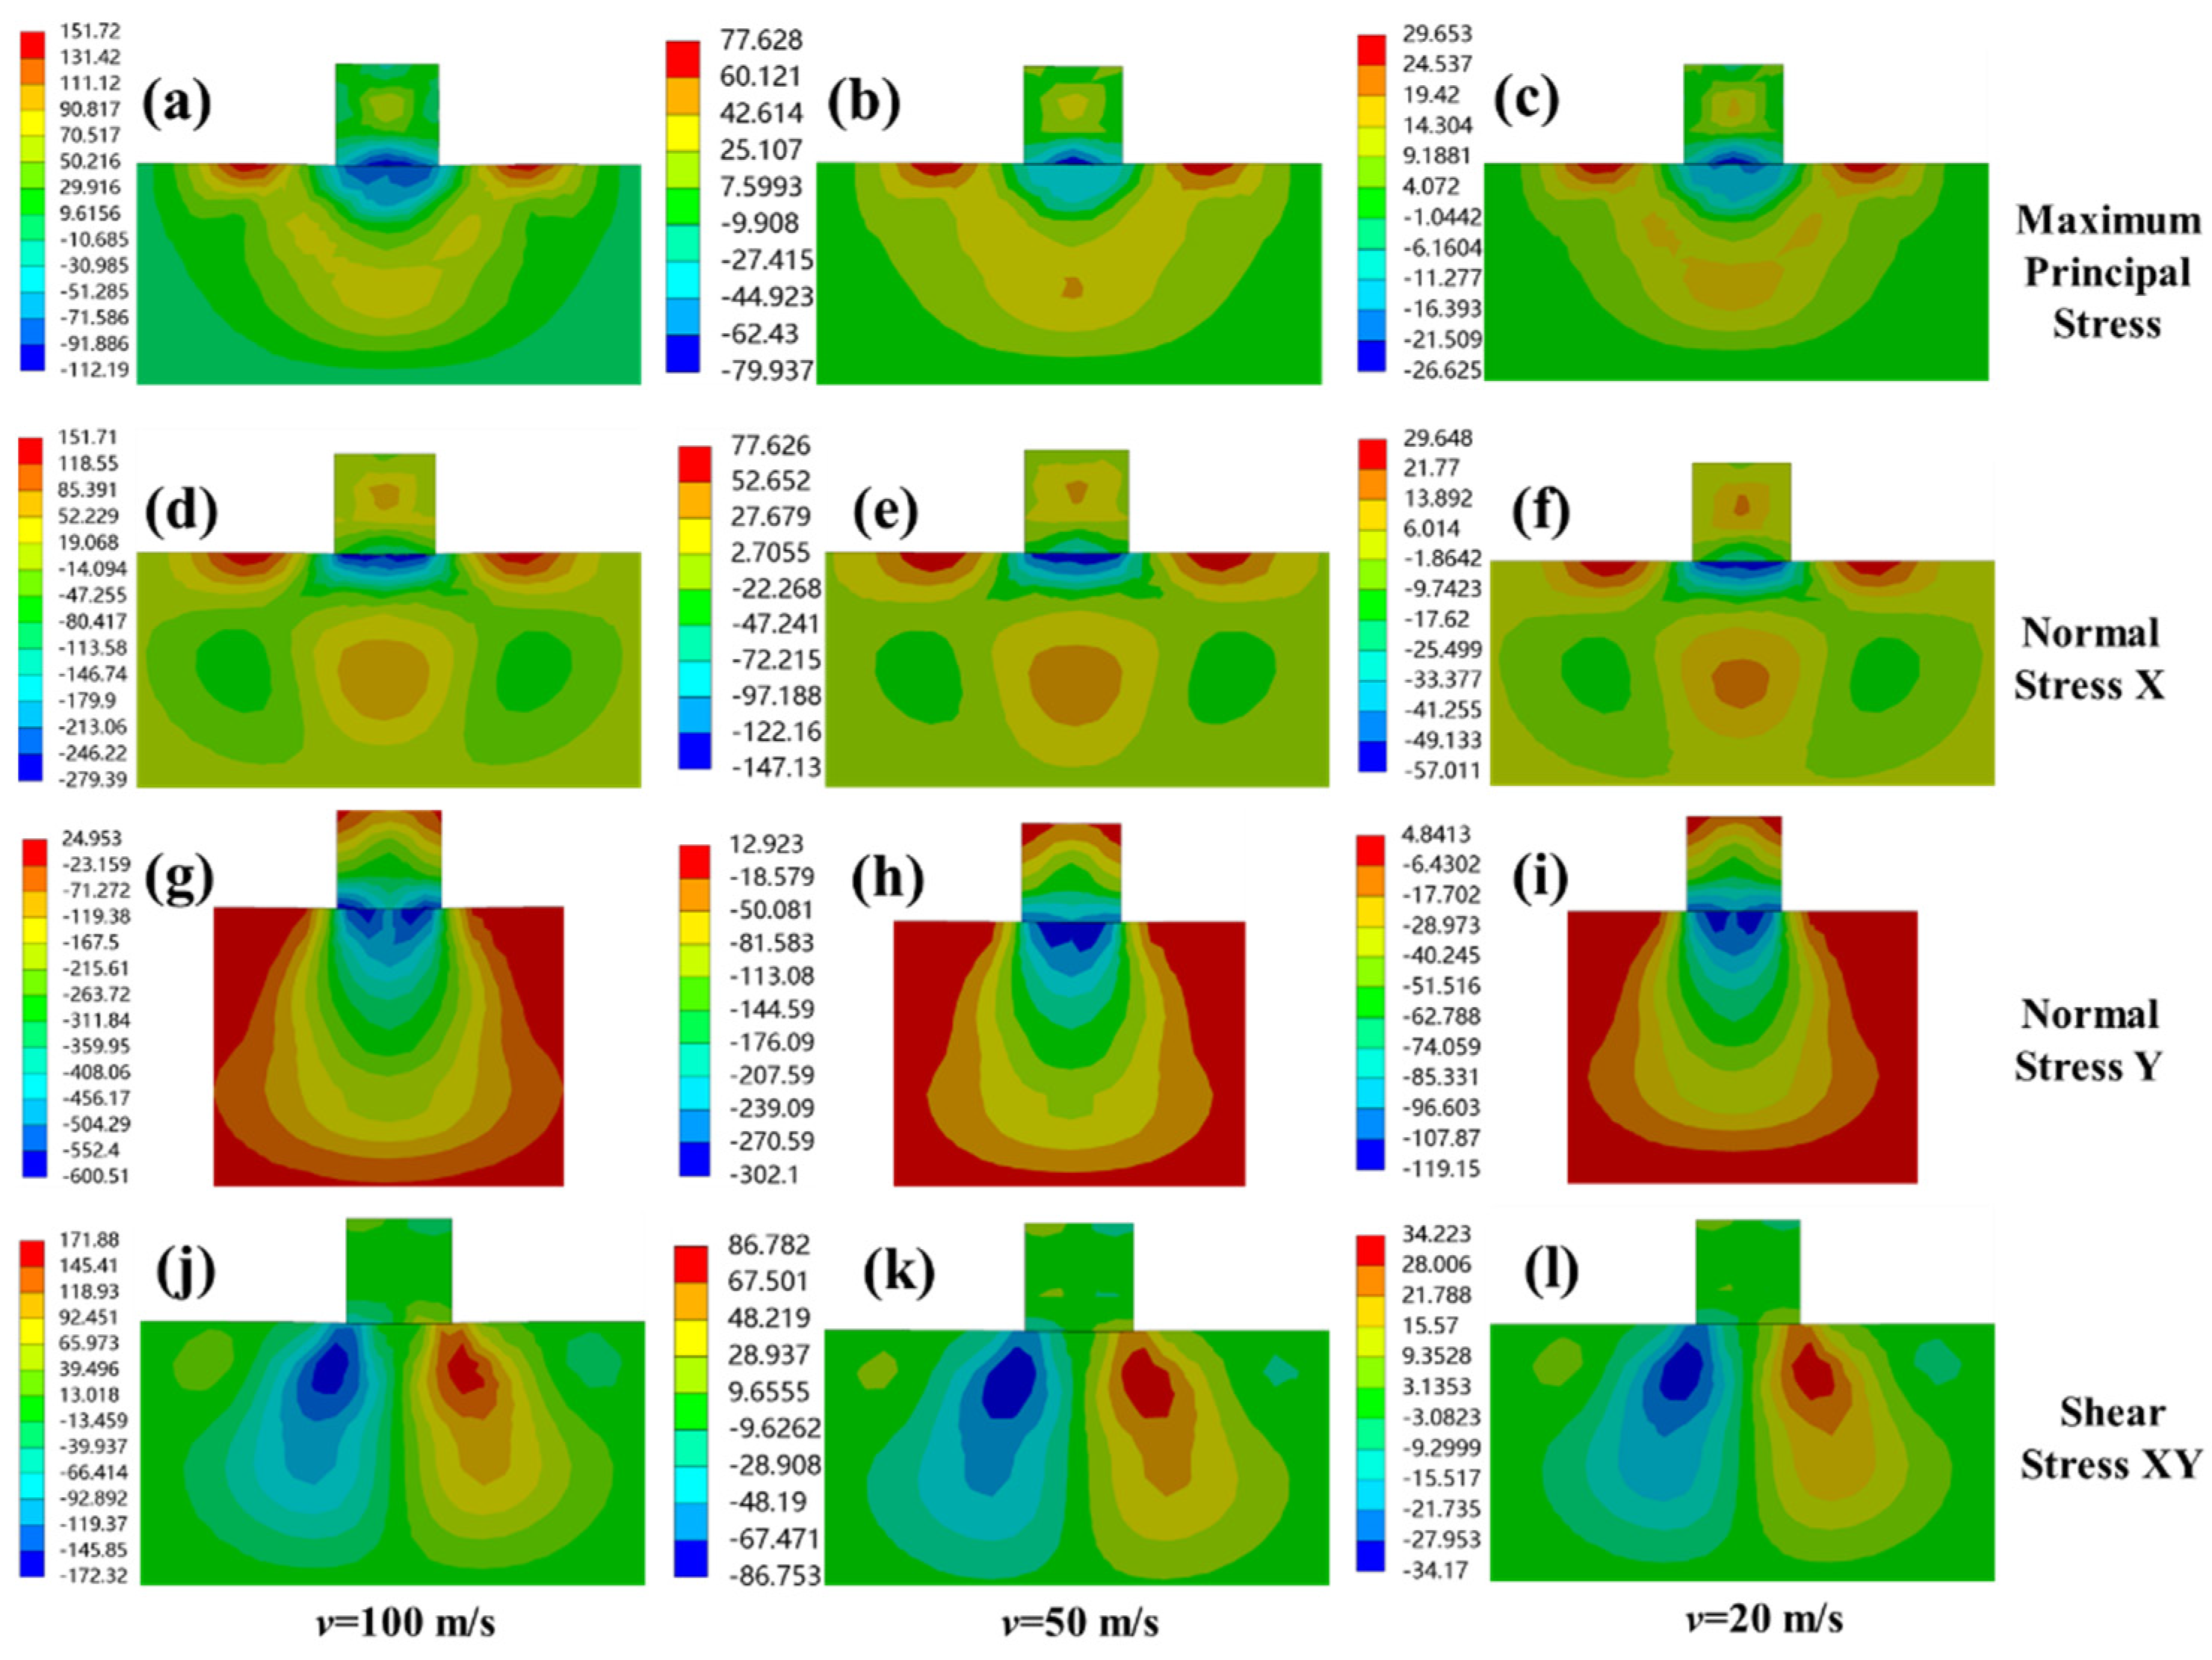
When CMAS particles impact on the surface of the TBC and when all the kinetic energy from the velocity is released, that is, when the velocity is 0, the residual stress in path 1 reaches the maximum value, as shown in
Figure 6. The time taken for the stress curve of path 1 is the time point when the velocity of the CMAS particle is 0. Because the stress wave is transmitted in the coating, as shown in
Figure 7, the surface contact, v = 100 m/s, α = 90° for the stress nephogram of equivalent stress at 90°, when the time is 6.93 × 10
−7 s, v = 0 m/s, and the sampling time of path 2 and path 3 correspond to the maximum stress value, i.e., 1.134 × 10
−6 s and 1.215 × 10
−6 s, respectively, so as to compare the stress on each path. Through the study of the stress of the three paths, it was found that the stress is significantly weakened in the transmission process, and the maximum residual stress on path 2 and path 3 is far less than the stress on path 1, indicating that the coating plays a good protective role on the turbine blade. According to the theory of fracture mechanics, the maximum principal stress is the main factor for crack nucleation [
27], that is, erosion cracks are more likely to occur in the area where the value of the maximum principal stress reaches or exceeds the limit stress required for the material fracture, and when the stress in the contact position area on path 1 fluctuates, it is symmetrically distributed. The magnitude of the stress at the contact point is −323 MPa, which increases with a large gradient on both sides, approaches 0 MPa at 0.03 mm from the contact point and slowly increases outward, with a maximum of 112 MPa, which is less than the ultimate stress that YSZ can bear [
28]. Near the contact position, due to the large changes of compressive stress and tensile stress, the coating breaks and peels off.
Figure 6A(b) shows a comparison case of axial stress along the defined paths where the maximum stress is −1124 MPa. When exploring the erosion problem of TBCs, Chen et al. [
29] showed that the radial stress perpendicular to the interface affects the coating delamination and the shear stress determines the position of the shear band. These two stresses are closely related to the failure of TBCs. This corresponds to
Figure 6A(c,d), in which the radial stress plays a decisive role. The maximum radial stress on path 1 is −2103 MPa. Therefore, the radial stress and shear stress were studied.
Figure 7 shows the stress nephogram of shear stress, radial stress and axial stress in detail.
From the beginning of contact to the end of particle springing, when the velocity of the particle v = 0 m/s, i.e., 6.93 × 10
−7 s, (the contour plot of the stress at different time is shown in
Figure 7a) the stress at the contact position is −2254.2 MPa. In this case, the YSZ coating produces deformation and internal stresses due to the extrusion of CMAS particles, making the coating denser [
30]. This produces a large angle indentation, which also may lead to conical cracks and is consistent with the results obtained by Cai et al. [
31], i.e., the cracks caused by CMAS erosion only appear around the tissue near the CMAS penetration interface, where the stress state is the most serious, accelerating the initiation and propagation of cracks. Through the comparison of the related data, it was found that the impact of spherical particles produces larger stress, so it is easier to make this crack.
Figure 7b,c shows the radial stress nephogram during CMAS particle rebound. Along with the progress of the impact, the stress penetrates the coating. During the penetration process, a compact area compressed into an ellipse is formed, which causes the stress to begin transferring to the YSZ/bond-coat layer and the bond-coat layer substrate interface, consistent with the research results of Chen et al. [
25]. In the process of stress penetration, the residual stress is concentrated at the interface of the coating, where the maximum radial stress at the YSZ/bond-coat layer is −170.99 MPa and the maximum radial stress at the bond-coat layer/substrate interface is −160.13 MPa, due to the protection of the YSZ coating.
The displacement of CMAS particles causes the TBCs in this region to form a strong shear region, as shown in
Figure 7d. The shear stress region expands into the coating with the movement of particles, but the shear stress decreases immediately after the particle rebound and the residual stress is less than half the peak value. When the stress penetrates the coating, the stress builds up at the coating interface but only some residual stress is retained, which is less than the bonding strength of the damaged coating [
32]. It can be seen that the coating greatly reduces the accumulation of residual stress among interfaces and avoids the premature failure of TBCs.
3.2. Effect of CMAS Morphology on Coating
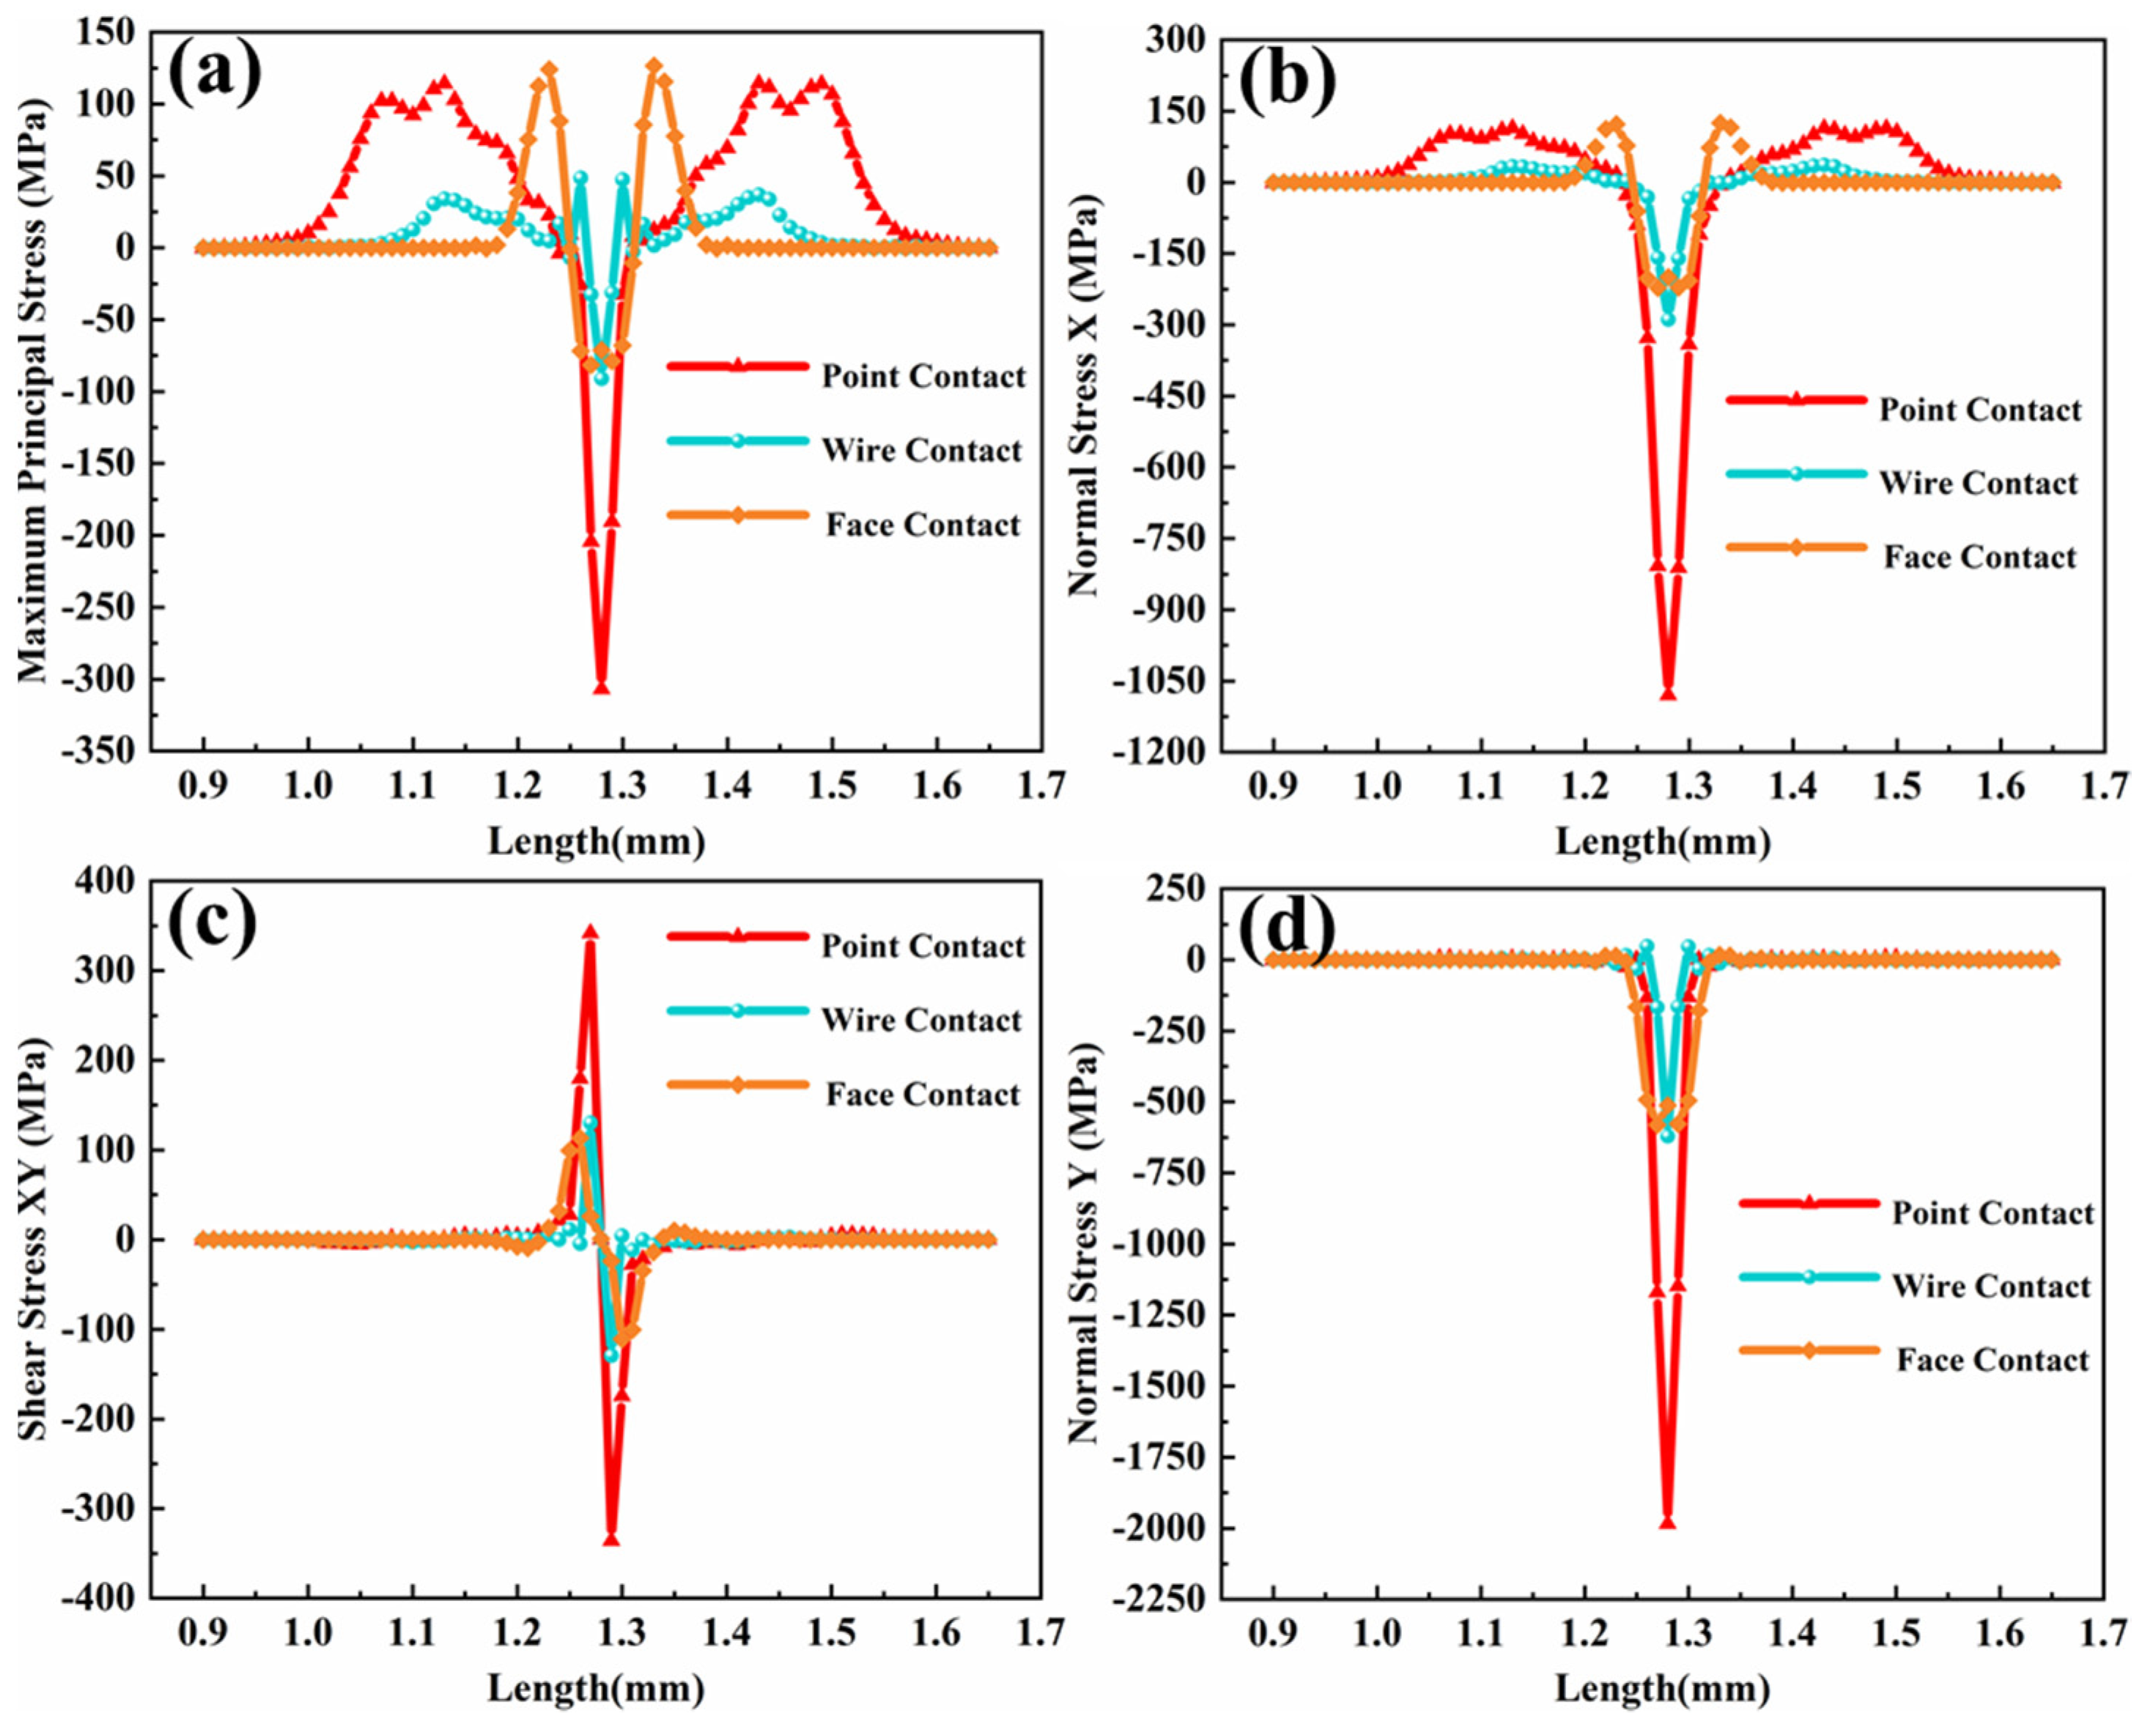
The service environment of the engine is complex and dynamic, and the sources of particles causing damage to the coating are different, as are the shapes and sizes of particles. In this section, CMAS particles with two different shapes (cube and sphere) are studied. These two particles can be divided into three contact modes: point, line and surface contact. By only changing the morphology of the particles, selecting the particle velocity of 100 m/s and the erosion angle of 90°, the damage of the coating by different contact surfaces during erosion is explored. Since the stress state at the contact position is the most serious during particle erosion, only the stress on path 1 was studied.
In the contact process, the larger the contact area and the larger the stress area of the coating, the more nodes make contact with the TC layer, that is, the larger the contact area under the same energy, the smaller the energy borne by each node. On the other hand, the smaller the contact area, the greater the energy borne by each node and the greater the damage and damage suffered from the contact position at the same speed and angle. Therefore, the damage to the coating caused by point contact is the largest, which is consistent with the simulation results in
Figure 8. It can be seen from
Figure 8a that the wound surface caused by point contact is larger and the maximum principal stress (compressive stress) presents the highest stress at the contact position and generates tensile stress at a certain distance from the contact point. Therefore, the crack can be generated at the initial contact point (due to compressive stress) and the crack expands radially along the stress edge due to the edge effect.
3.3. Effect of Particle Speed on Coating
When the CMAS erodes the coating, the energy carried by the particles is different under different speeds and the energy transmitted to the coating when the particles come into contact with the TC layer is different, so the damage degree to the coating is also different. Therefore, it is very important to study the effects of erosion speed in the erosion process on the failure modes of the TBCs. If the erosion speed is too small and the energy of the particles hitting the coating is too low, it is not enough to cause the plastic deformation or crack initiation of the material. Because the ceramic layer is brittle, low erosion speed will not affect the ceramic layer. In this section, the impact of erosion particles on TC layer, which are set to the particle speeds of 20 m/s, 50 m/s and 100 m/s, will be compared, when the impact angle of CMAS particles is 90° and the contact form is the surface contact. Deng et al. [
33] and others proposed that the minimum speed of erosion wear damage to the target after erosion is the first critical speed,
. When the velocity of the particle erosion is greater than
, the target will be eroded and worn.
where σ is the maximum elastic limit load of the ceramic material, and where the approximate value is
σb is the bending strength of the material. Applying the bending strength, the elastic modulus and Poisson’s ratio of the YSZ coating to Formulas (4) and (5), it can be ascertained that the first critical speed of erosion wear is 0.034~0.39 m/s. If the defined simulation speed is far greater than this limit, erosion will occur.
Due to the uncertainty of the angle between the particle velocity direction and the coating in the service environment, there is a connection between the critical velocity and the incidence angle of CMAS. As shown in
Figure 4b, the angle between the velocity direction and the coating is α (α < 90°) and the critical velocity, V
pc, can be expressed as
It can be seen from the equation that the critical velocity required to cause damage to the coating is larger when α is smaller and tends to infinity when α tends to 0.
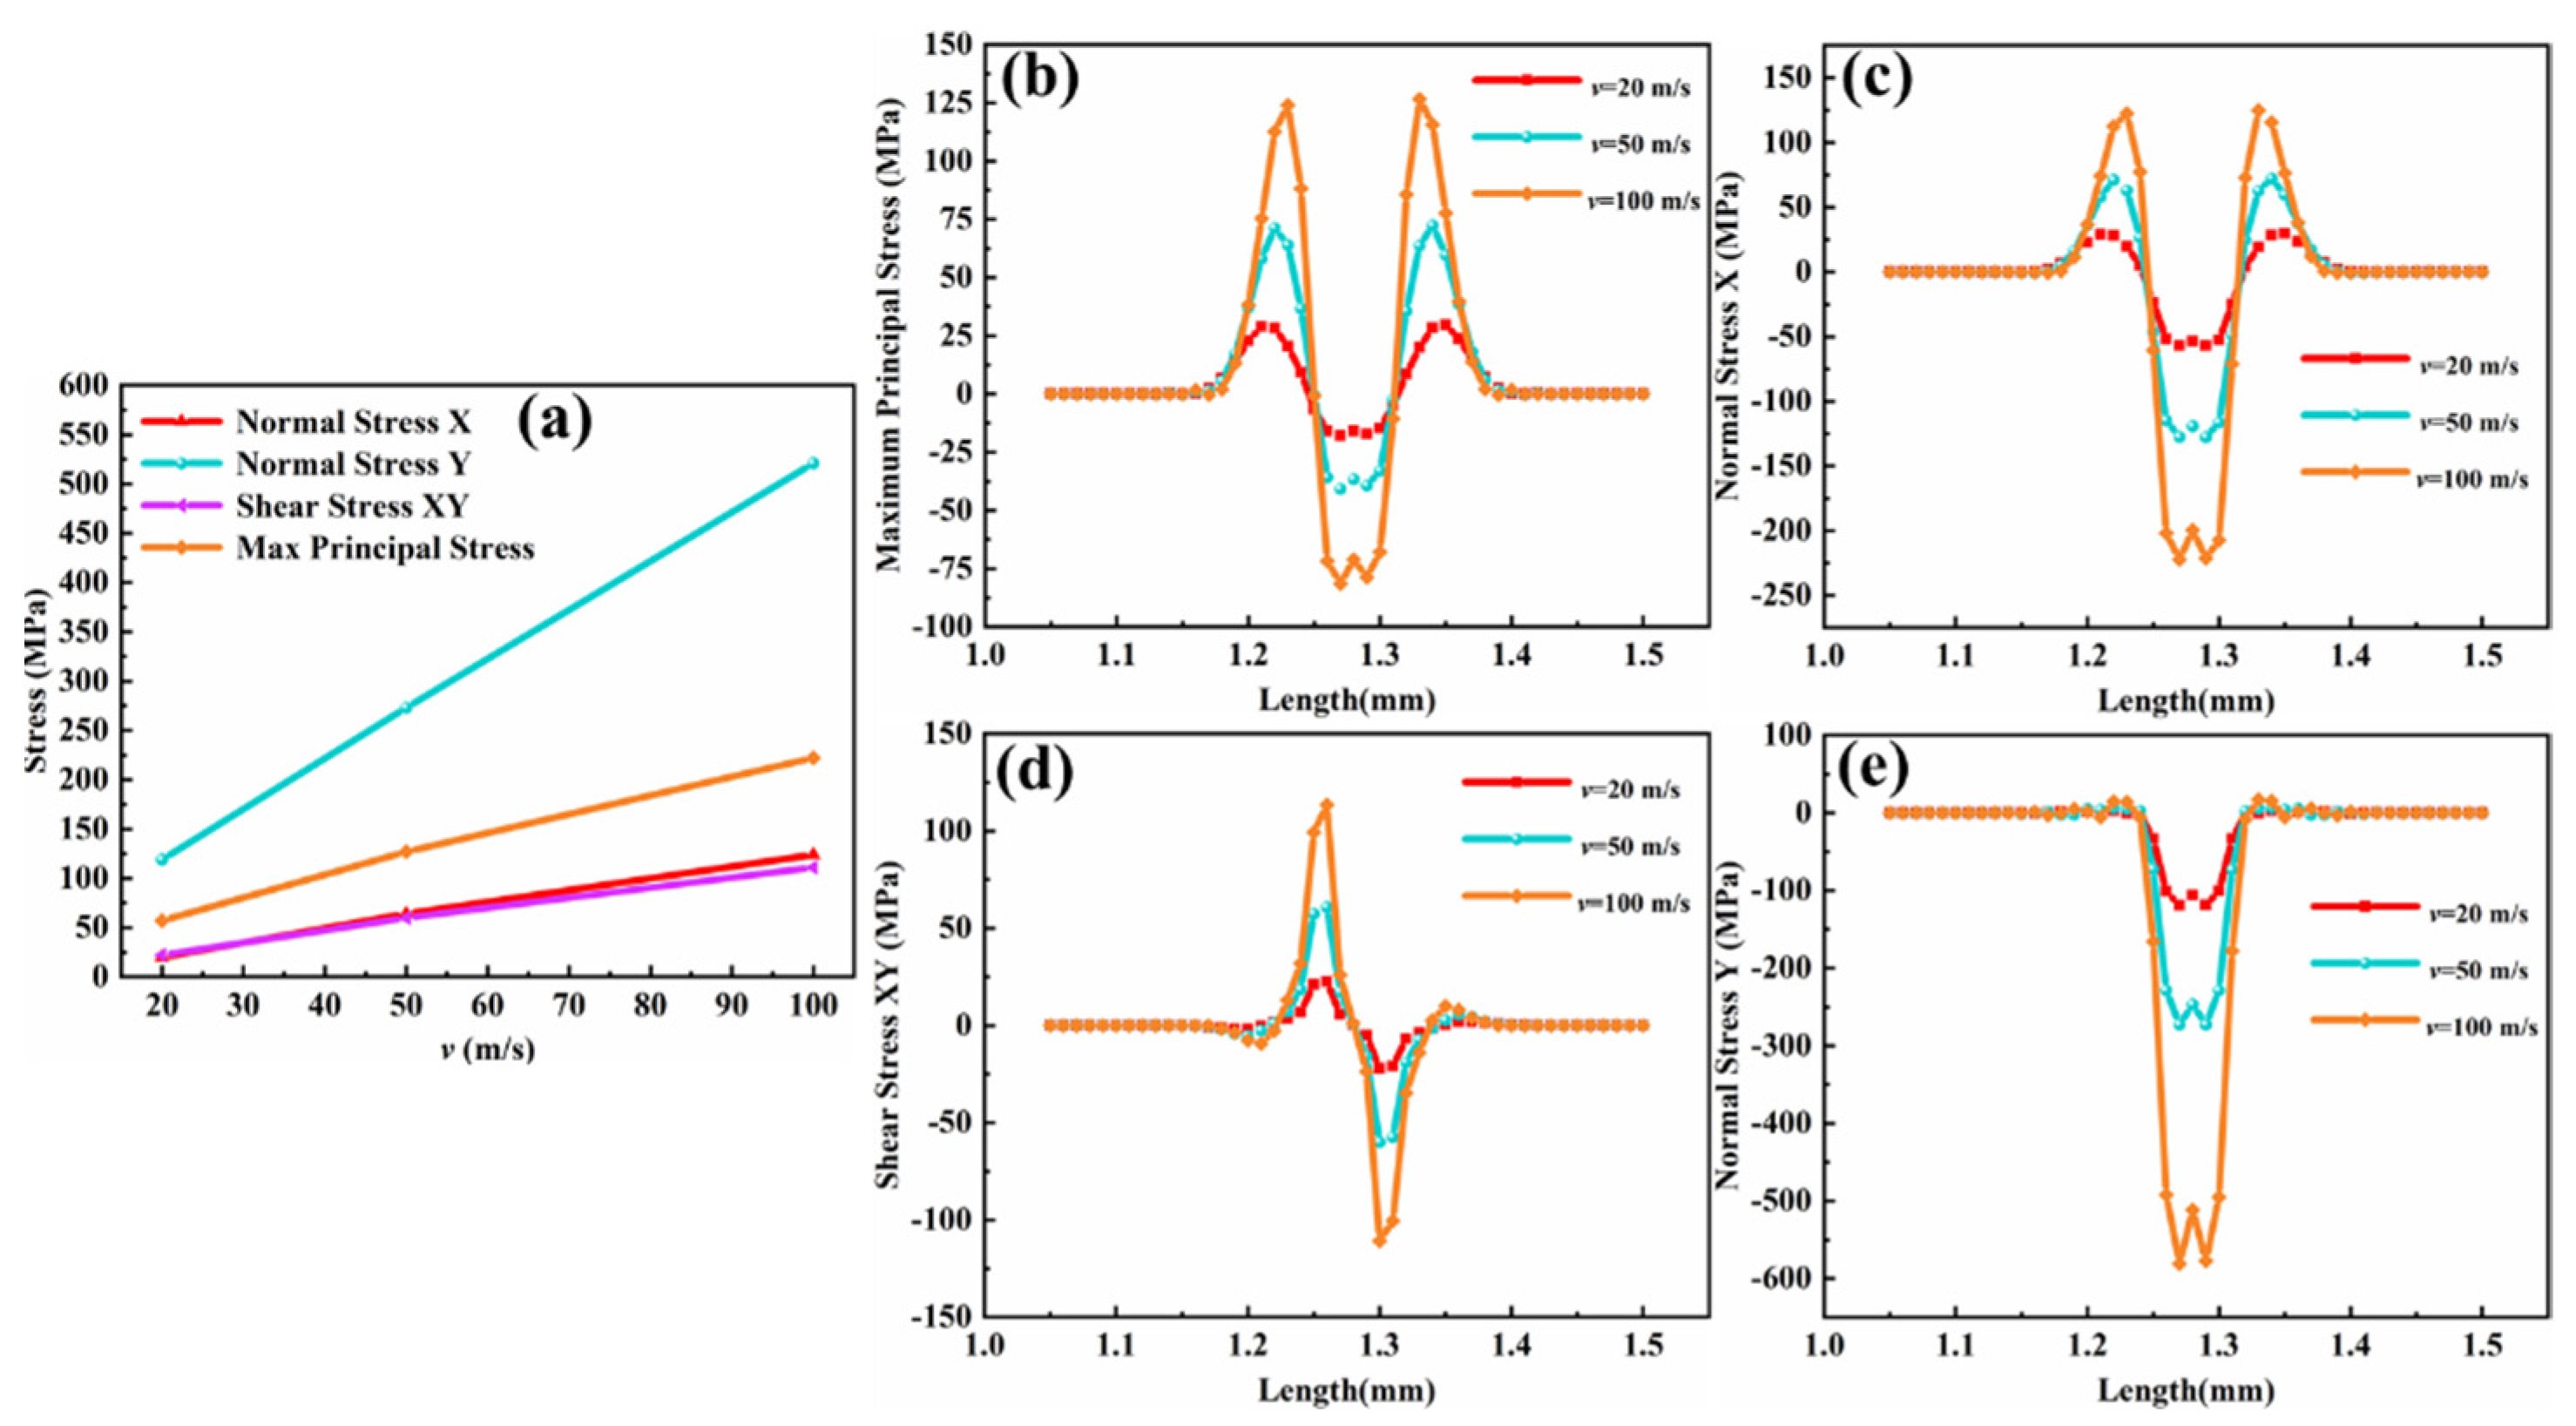
Figure 9a shows the relationship between the particle erosion speed and the maximum residual stress along path 1. It can be seen that when the particle speed increases, the stress increases approximately linearly and that the growth rate of the shear stress and axial stress is almost the same. According to this characteristic, we can roughly infer the approximate stress range at each speed. According to the comparison figure of the axial stress in
Figure 9c, during the erosion process the contact position is squeezed by the CMAS particles and the compressive stress is concentrated. The axial stress on the coating surface is concentrated near the contact position in the form of tensile stress on the coating surface and diffuses to both sides in the continued erosion process. When the energy from particles with the speed of v = 100 m/s is fully released, the compressive stress at the contact position increases. At the same time, the tensile stress is concentrated at about 0.04 mm from the erosion position, as shown in
Figure 9d. When the stress difference is too large, under the action of axial tensile stress and axial compressive stress, it is easier to initiate transverse cracks along the surface of the coatings, where the tensile and compressive stress are destructed at the contact position, resulting in the spalling failure of the coating’s surface. It can be also seen from
Figure 9a that radial stress plays a dominant role in this erosion process, mainly concentrated at the right angle of the particle boundary. Through the comparison of the stress nephograms in
Figure 10g–i, it can be seen that the stress at the boundary of square CMAS particles in surface contact is greater than that at the center of contact. As shown in
Figure 9e, the stress at the contact corner is about 10% higher than that at the middle position, which is due to the shear effect of the right-angle boundary on the coating. When the particles rebound, it may cause secondary damage to the coating, as the TC layer is more prone to produce longitudinal cracks. At high temperature, molten CMAS particles will erode the YSZ coating through the longitudinal cracks, resulting in its failure. The distribution of the maximum principal stress is shown in
Figure 10a–c. During particle erosion, the maximum principal stress on the surface of TC layer is mainly distributed at and around the contact position, and the stress concentration is obvious. The direction of the maximum principal stress at the contact position is the same as the stress direction, forming an “extrusion” effect on the coating. Because the ceramic coating has a certain shape, the contact position has a “pull” effect on the surrounding coating, The maximum tensile stress is formed around it, causing it to deform, making the junction area prone to cracks. The stress trend is the same at different speeds, that is, when the speed increases, the greater the damage to the coating, and the greater the possibility of crack initiation at the contact area.
3.4. Effect of Erosion Angle on Coating
The turbine blade of the aeroengine is affected by erosion through foreign particles and particles produced by the combustion chamber during service and the erosion angle that changes with time. Therefore, this section will examine the effects of different erosion angles on the failure modes of TC layer.
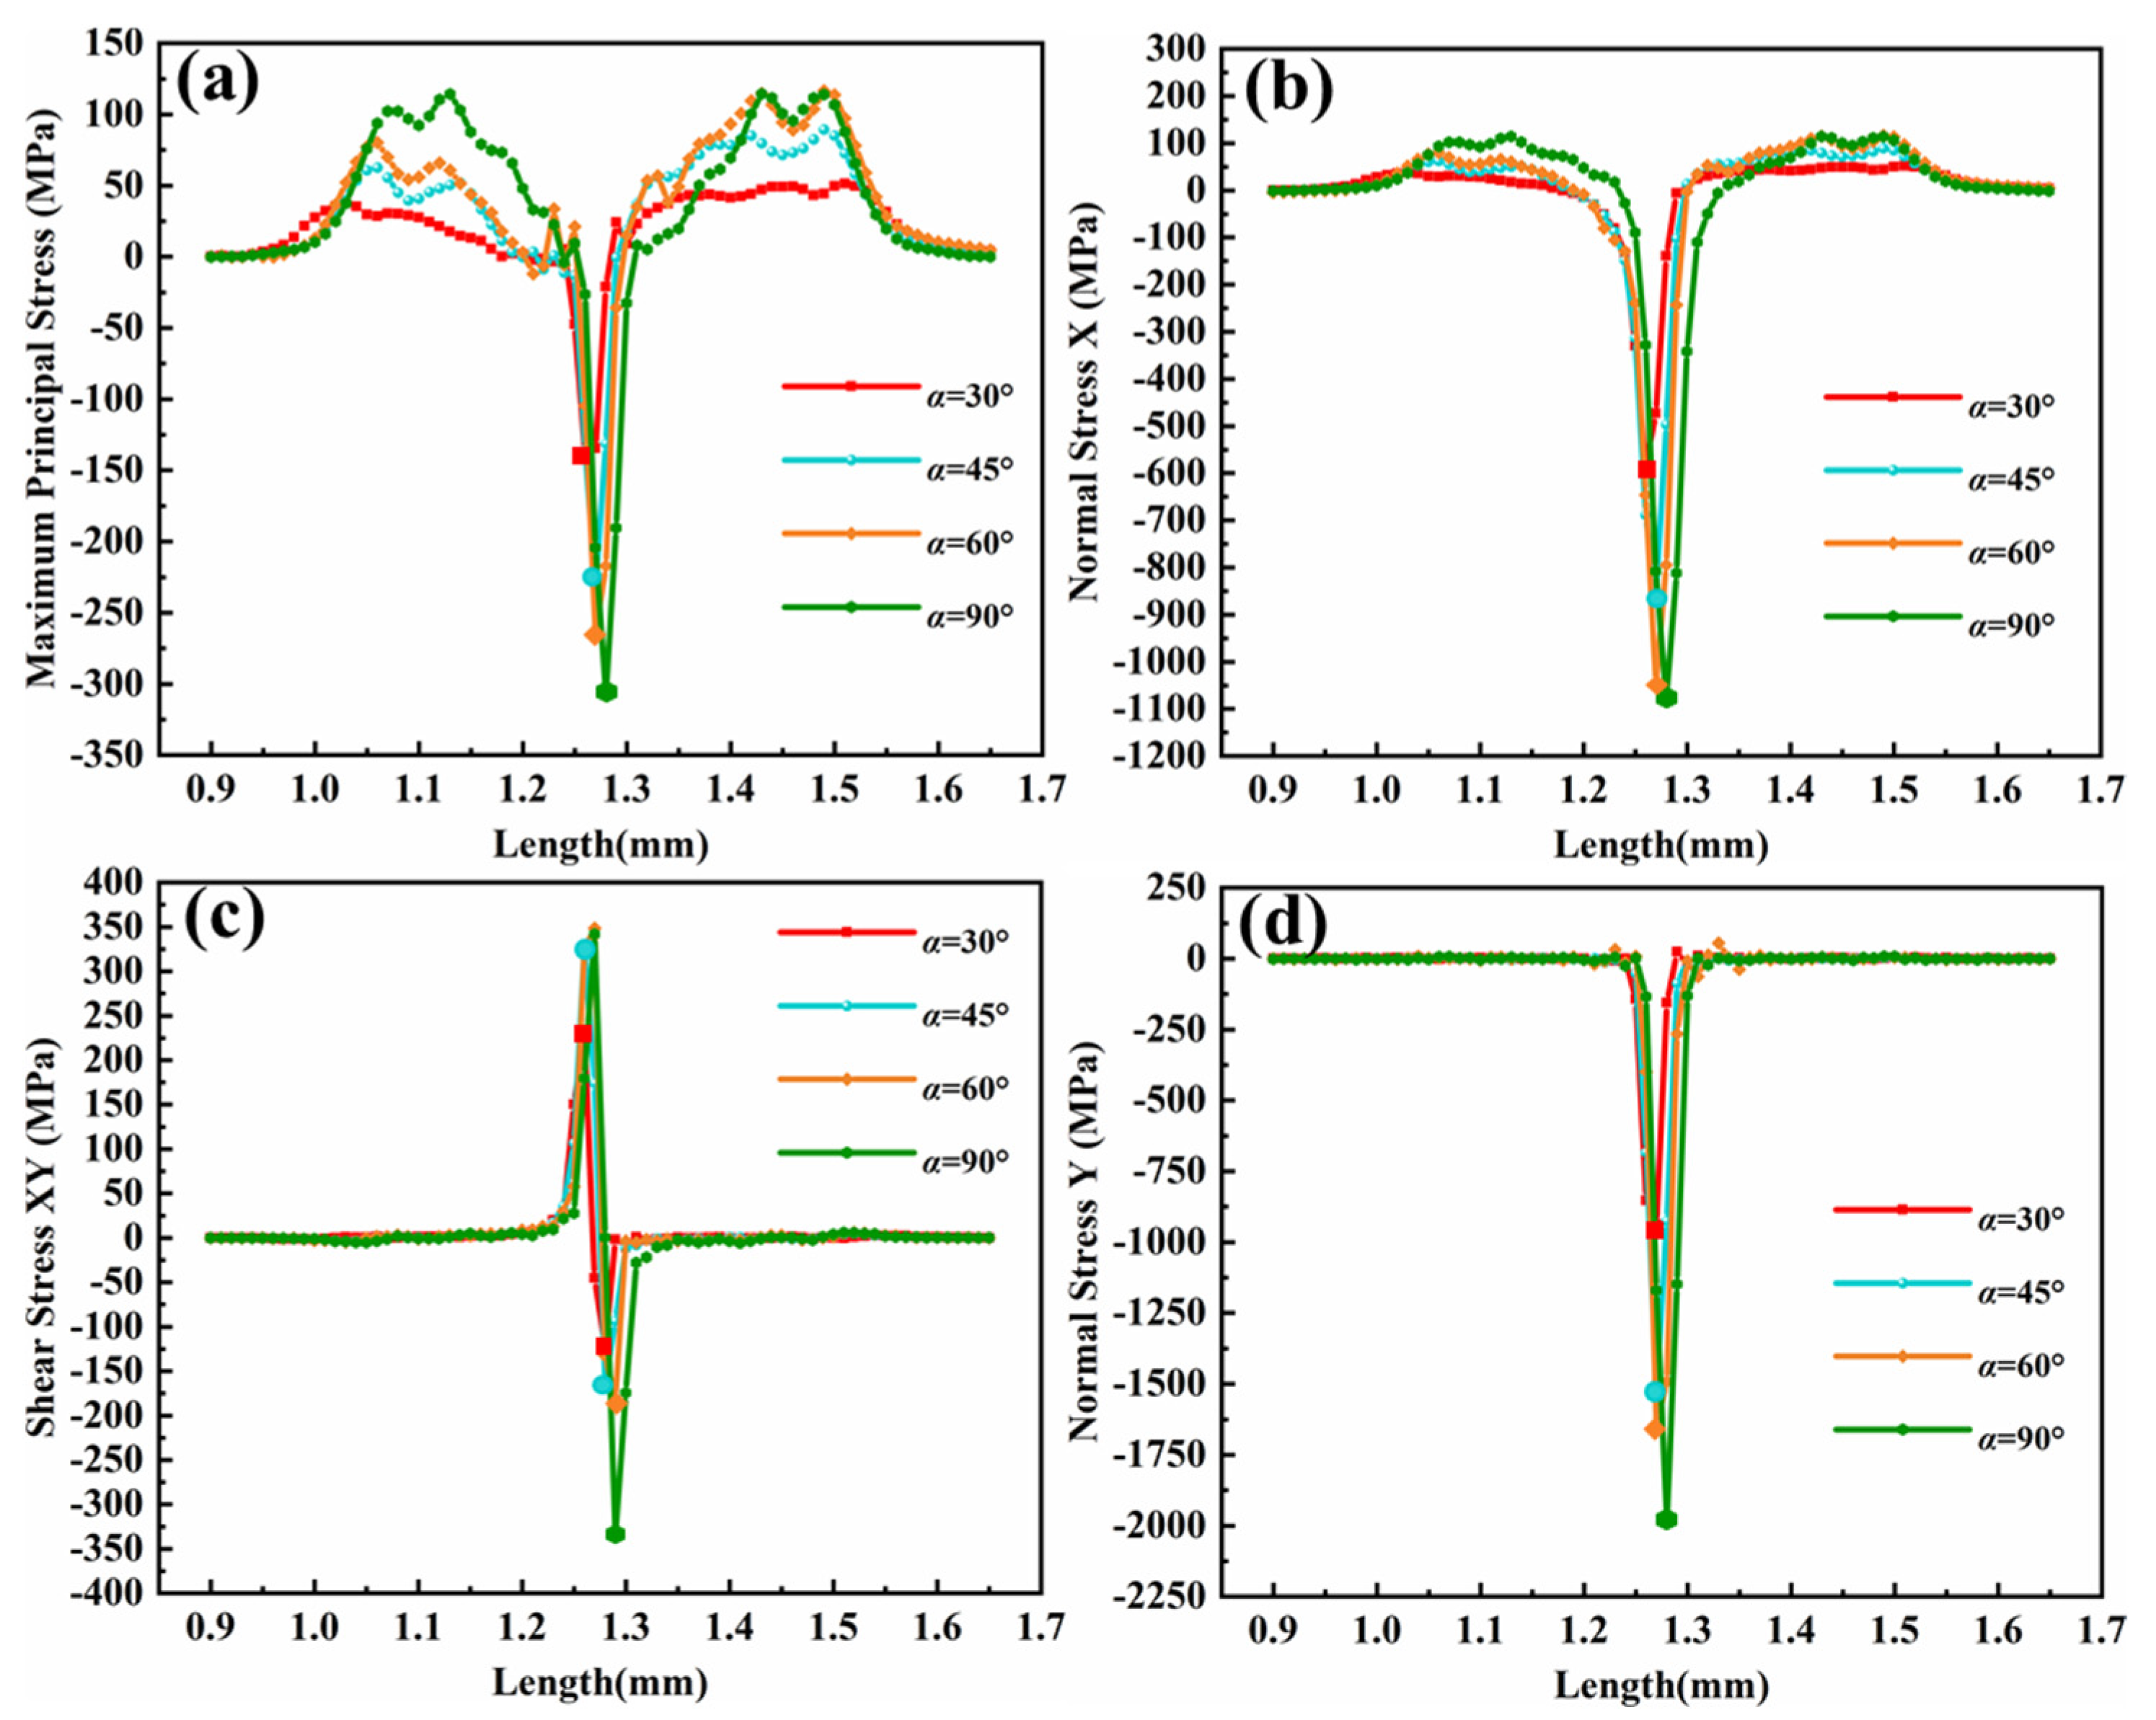
When the erosion angle changes, the stress state of path 1 changes with the erosion angle α; as the velocity decreases, the stress next to the contact point begins to shift to the other side, which makes the TC layer subject to a large strain, both in the X and Y direction. The energy of CMAS particles in the Y direction decreases and the energy in the X direction increases. However, when the particles hit the TC layer, the particles rebound rapidly due to the smaller velocity in the Y direction. The smaller the erosion angle, the less damage to the coating. This is consistent with the study by Wang et al. [
34] about the effects of particle erosion on brittle and ductile materials. The research results show that the erosion angle of particle erosion causing the maximum erosion damage to metal materials is 20°~30°, which is mainly ploughing failure, while damage to ceramic materials occurs at 90°, where the main failure mode is crack generation and propagation, resulting in eventual fracture.
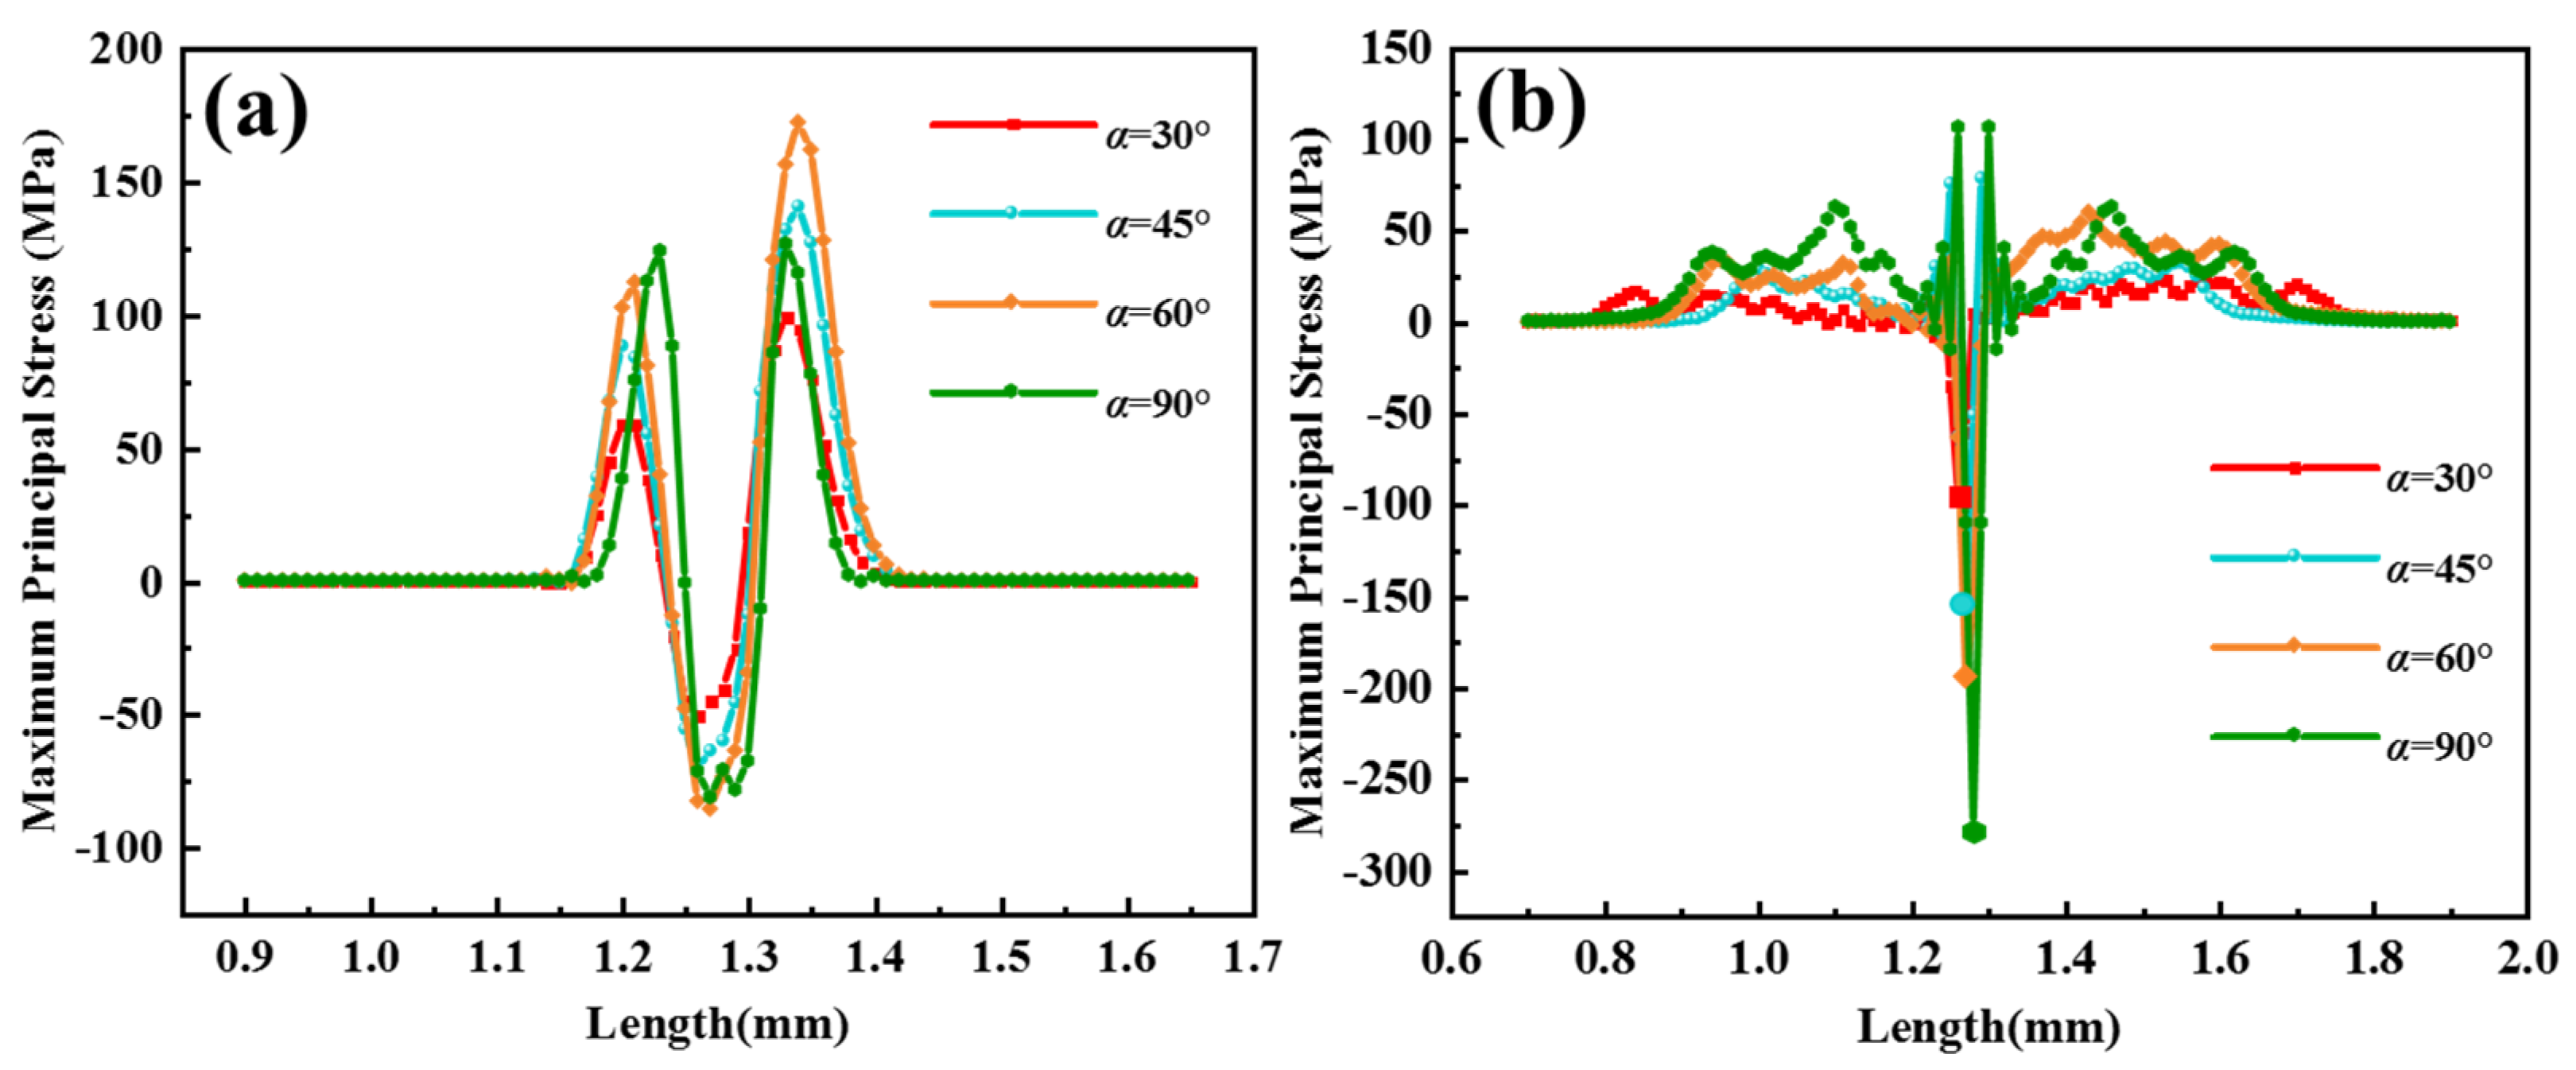
Maximum principal stress is the main factor for crack nucleation [
27]. In order to visualize the effect of particle erosion angle on the coating under different contact forms, the stress distribution of the maximum principal stress of the coating “path 1” under surface contact and line contact was extracted. All three contact forms caused cutting on the coating, and the comparison between
Figure 11a and
Figure 12a,b shows that the stress on the right side of the erosion position is greater than the stress on the left side when the erosion angle decreases.
Figure 12a shows the maximum principal stress distribution curve for path 1 at face contact, with the contact position as compressive stress, and the maximum compressive stress approximately the same for α at 60° and 90°. The maximum principal stress on the right side of the erosion position at α = 45° and 60° is greater than the value of α = 90°, which is caused by the particles cutting the coating at 45° ≤ α < 90°, so that the stress in the coating is severely concentrated in the cut part, and it is very easy to produce cracks and peeling on the surface of the coating. The residual stress is the smallest at α = 30°, and it is presumed that the component of velocity v
y < v
x, resulting in weaker cutting ability. This part of the study lays the foundation for future investigations of the damage effect of particle chamfering on the coating.
3.5. Analysis of Erosion Failure
In the erosion of TBCs by CMAS particles, the damage caused to the coating is controlled by many factors, such as different material properties, debris properties and engine conditions (e.g., temperature), but the particle morphology, erosion speed and erosion angle of the CMAS particles are among the dominant ones. When the morphology is fixed, changing the erosion speed and erosion angle only changes the degree of damage caused by particles to the coating. When the contact mode changes, the type of coating damage will also change.
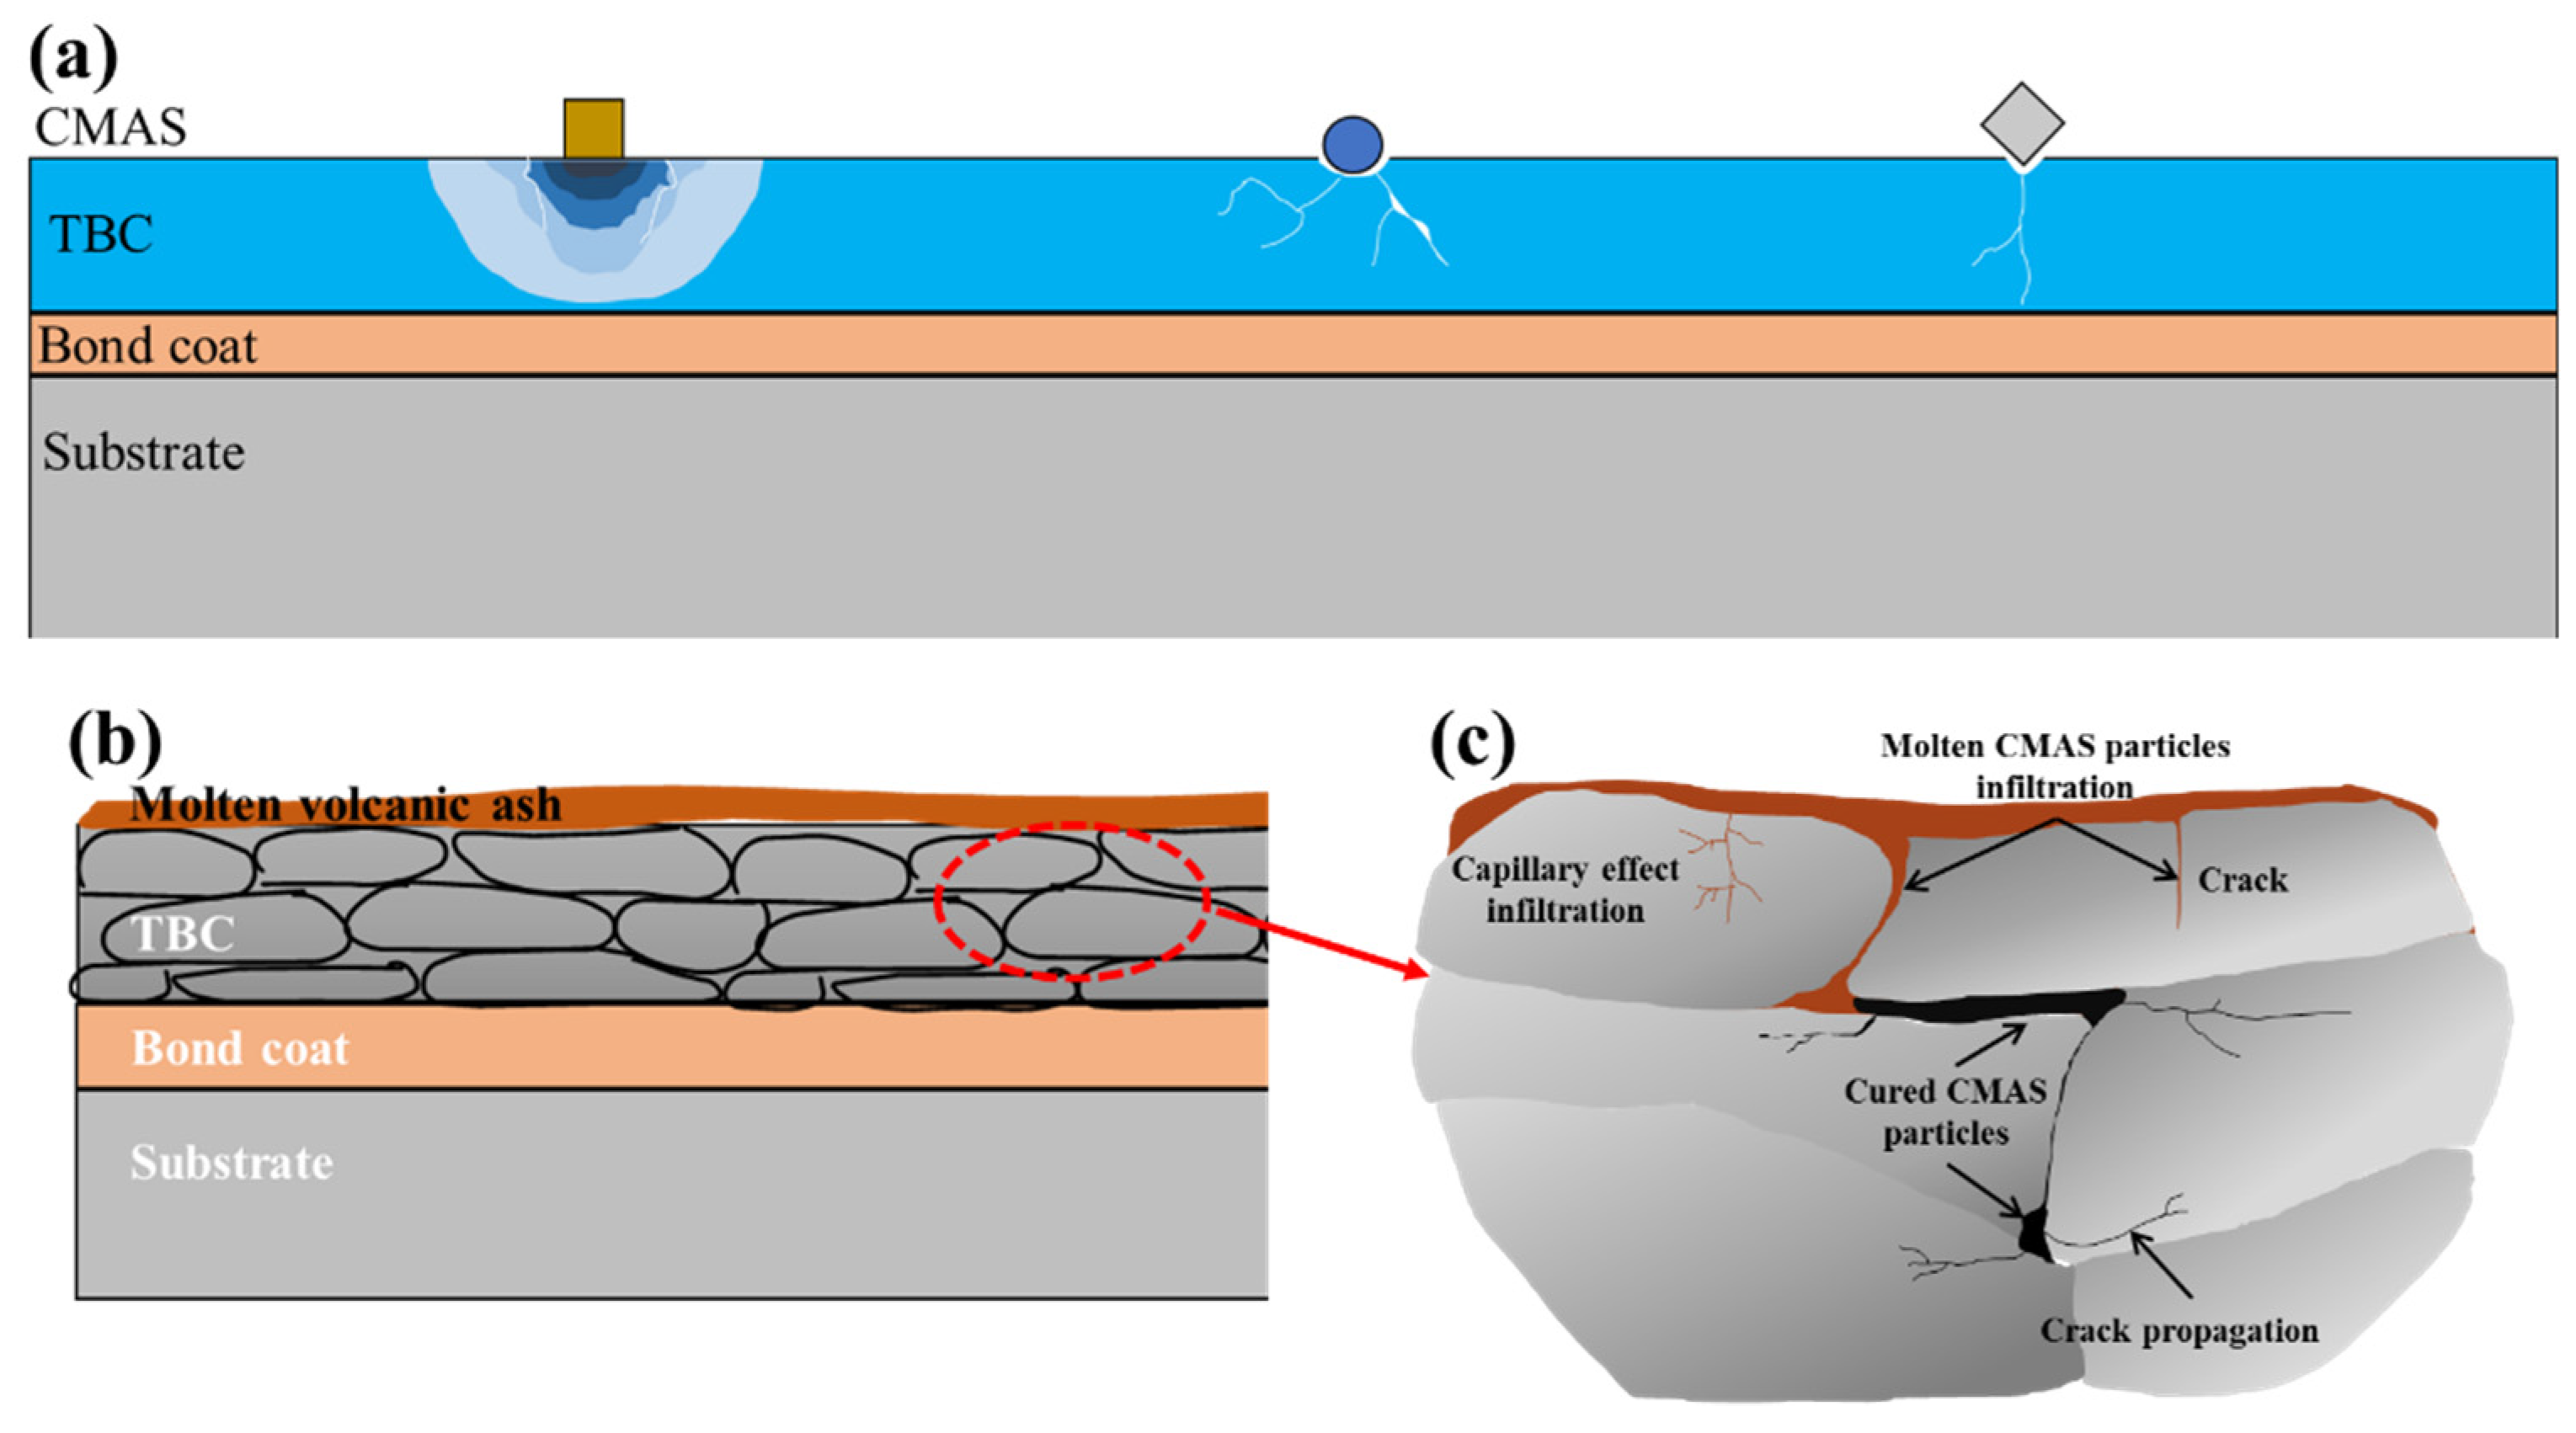
Figure 13a shows the failure modes of TBCs under different contact surfaces when CMAS particles erode coating. When a CMAS particle impacts the TBCs with surface contact, the particle will “extrude” at the contact location, i.e., the contact location is subjected to compressive stresses and tensile stresses on the periphery of the extruded area but when the deformation degree exceeds its yield strength, the coating will be prone to fracture and cracks will thus from at the boundary of the compressed area and extend longitudinally along this junction. In point and line contact configurations, the coating at the contact position may fall off during erosion, accompanied by the occurrence of microcracks. The damage of the coating is largest at point contact, where the coating may be broken and horizontal and longitudinal cracks may occur, which provides a channel for the molten CMAS particles to corrode the coating. The YSZ sprayed with APS has a layered structure. When molten CMAS is deposited on the surface of the TBCs, the molten CMAS erode into the TBCs through the gaps between the layers, the defects generated during the spraying process and the cracks generated after the CMAS erosion, as shown in
Figure 13c, the further hardening of the infiltrated molten CMAS leads to the growth of cracks in the coating, which may cause the coating to peel off at several points.


