Article

WO3 Films Grown by Spray Pyrolysis for Smart Windows Applications

by
Kyriakos Mouratis
1,2,3,
Ioan Valentin Tudose
1,4,
Cosmin Romanitan
5,
Cristina Pachiu
5,
Marian Popescu
5,
Georgios Simistiras
1,2,
Stelios Couris
3,
Mirela Petruta Suchea
1,2,5,* and
Emmanuel Koudoumas
1,2,*
1
Center of Materials Technology and Photonics, School of Engineering, Hellenic Mediterranean University, 71410 Heraklion, Crete, Greece
2
Department of Electrical and Computer Engineering, School of Engineering, Hellenic Mediterranean University, 71410 Heraklion, Crete, Greece
3
Physics Department, University of Patras, 26504 Patras, Peloponnese, Greece
4
Chemistry Department, University of Crete, 70013 Heraklion, Crete, Greece
5
National Institute for Research and Development in Microtechnologies-IMT Bucharest, 126A, Erou Iancu Nicolae Street, 077190 Bucharest, Romania
*
Authors to whom correspondence should be addressed.
Coatings 2022, 12(4), 545; https://doi.org/10.3390/coatings12040545
Submission received: 30 March 2022 / Revised: 14 April 2022 / Accepted: 15 April 2022 / Published: 18 April 2022
(This article belongs to the Special Issue New Trends in Functional Materials and Devices)

Abstract

:
WO3 nanostructured thin films were grown using spray deposition on FTO coated glass. The effect of the precursor concentration and the solution quantity, which determines the deposition time, on the electrochemical, electrochromic and optical properties of the WO3 films was investigated. The films were found to exhibit a good electrochromic activity with a reasonably good durability of charge exchange and optical modulation under harsh electrochemical cycling in Li-ion-conducting electrolyte. Associated compositional and structural characteristics were probed by several techniques, indicating that the observed improved durability may be due to the unique WO3 thin films’ structuring, the surface of the films consisting of wall-like structures combined with bubble-like islands on a polycrystalline WO3 granular background, that requires further study in greater detail.

1. Introduction

Electrochromic materials are a topic of intense research around the world due to their intriguing practical uses in architectural applications (i.e., smart windows), electronic displays, and variable-reflective mirrors, among a larger number of applications [1,2,3,4,5,6,7,8,9,10,11]. Tungsten oxide (WO3) has been methodically examined for its use in applications such as electrochromic (EC) windows [12,13], switchable mirrors, displays, and gas sensors, and some of these applications are finding commercial use presently [6]. Regarding electrochromic applications, WO3 is a nontoxic n-type wide band gap semiconductor material, with a fast response time, good intercalation properties (H+, Li+, Na+ and K+), favorable coloration efficiency and necessary optical properties. Its band gap energy has been mostly estimated from optical absorption experiments and varies from about 2.6 to 3.0 eV. [14] Nonetheless, regarding the deposition techniques, the deposition parameters have been proved to have a major influence on the structure and morphology of the thin films, with direct attestations of their electrical and optical properties [13]. Films with high porosity or large grain boundaries are preferred for EC applications because they allow for faster ion insertion–extraction, which results in improved coloring efficiency and faster switching rates between the bleached and the colored phases [13]. Consequently, to ensure a high performance of the EC films, thickness, porosity reproducibility and crystallinity over a large area are crucial [13].
Spray pyrolysis is frequently a desirable alternative for the development of thin films, since affordable precursor materials and low-cost equipment can be employed in order to assist large-area industrial applications [13]. In the case of this technique, the composition of the initial solution, the substrate temperature and the growth rate can determine the final outcome regarding the basic characteristics of the grown films. [13]. The rate of evaporation of the solvent can be affected by the precursor in use and pressure of the carrier gas, while changes in surface tension can speed up the droplets’ formation [13]. WO3 EC thin films have been fabricated using various deposition techniques, including thermal evaporation [15], thermal reactive evaporation [16], DC magnetron sputtering [17], RF magnetron sputtering [18], chemical vapor deposition [19], electrodeposition [20], sol-gel [21], pulsed spray pyrolysis [1,22], direct thermal oxidation of W metal films [23], physical vapor deposition [24], hydrothermal methods [25], etc. Spray deposition assortments have not been frequently used, and when used the results are polycrystalline films with granular or porous morphology, more or less compact. Among the publications regarding spray deposition, only a very small number concern simple spray deposition of air carrier type [4,6] or other spray forms [26,27,28,29,30,31] of pure WO3 films with good electrochromic properties.
Based on the limited number of studies on the deposition of EC thin WO3 films using air carrier spray deposition, the present study was performed in order to investigate the possibility of achieving good EC WO3 coatings by using this facile deposition method, so that this can then be transferred to large scale applications. WO3 nanostructured thin films were grown using spray deposition on FTO coated glass, employing as precursor tungstic acid (H2O4W) powder dissolved in distilled water. Deposition was performed in air at 250 °C. These preliminary results showed that EC WO3 coatings with unique morphology and very good stability can be obtained.

2. Materials and Methods

2.1. Materials

Tungstic acid (H2WO4), ≥99.0% (calcined substance, T) powder (Sigma-Aldrich, St. Louis, MO, USA), was diluted in distilled water so that the precursor solution could be obtained. Lithium perchlorate LiClO4 (Sigma-Aldrich ACS reagent, ≥95.0%) was employed as electrolyte, the respective solvent being propylene carbonate (Sigma-Aldrich anhydrous, 99.7%). As substrates, Fluorine-doped Tin Oxide FTO –F:SnO2 (Pilkington UK) coated glass was used.

2.2. Preparation of WO3 Samples

A custom-made air carrier flow static spray pyrolysis device was employed for WO3 thin films’ deposition. The films’ growth was carried out at a vertical position and at a 30 cm distance between the spray gun and the substrate, which was kept at a temperature of 250 °C. The precursor solution was prepared by dissolving the required amount of tungstic acid H2WO4 in distilled water. For the parametric study, 0.1 M and 0.05 M solutions were employed at three different quantities (5, 10 and 15 mL), since the thickness of the films can be controlled by the volume of the solution, which could be measured to an accurate level due to the complex surface morphology of the films. The growth time increased with increase in the volume of solution, while the flow of the air carrier remained constant to ensure a constant deposition rate.

2.3. Characterization Methods

X-ray diffraction (XRD, Rigaku, Tokyo, Japan) was performed using a Rigaku ultra high-resolution triple axis multiple reflection SmartLab X-ray Diffraction System, Tokyo, Japan. Scanning electron microscopy (SEM) characterization took place using a field emission Nova NanoSEM 630 (FEI Company, Hillsborough, OR, USA) and a field emission scanning electron microscope (FE-SEM). Raman spectroscopy took place using a Witec Raman spectrometer (Alpha-SNOM 300 S, WiTec GmbH, Ulm, Germany); and UV-Vis transmittance spectra with a UV−2401PC (Shimadzu Corporation, Kyoto, Japan) spectrophotometer. Electrochemical experiments were performed using a PGSTAT302N Autolab (Metrohm AG, Herisau, Switzerland) potentiostat/galvanostat in a three-electrode cell setup using as the working electrode the WO3 layer on the Fluorine-doped tin oxide (FTO) coated glass substrate, in similar conditions as those described in our previously reported work [32].

3. Results and Discussion

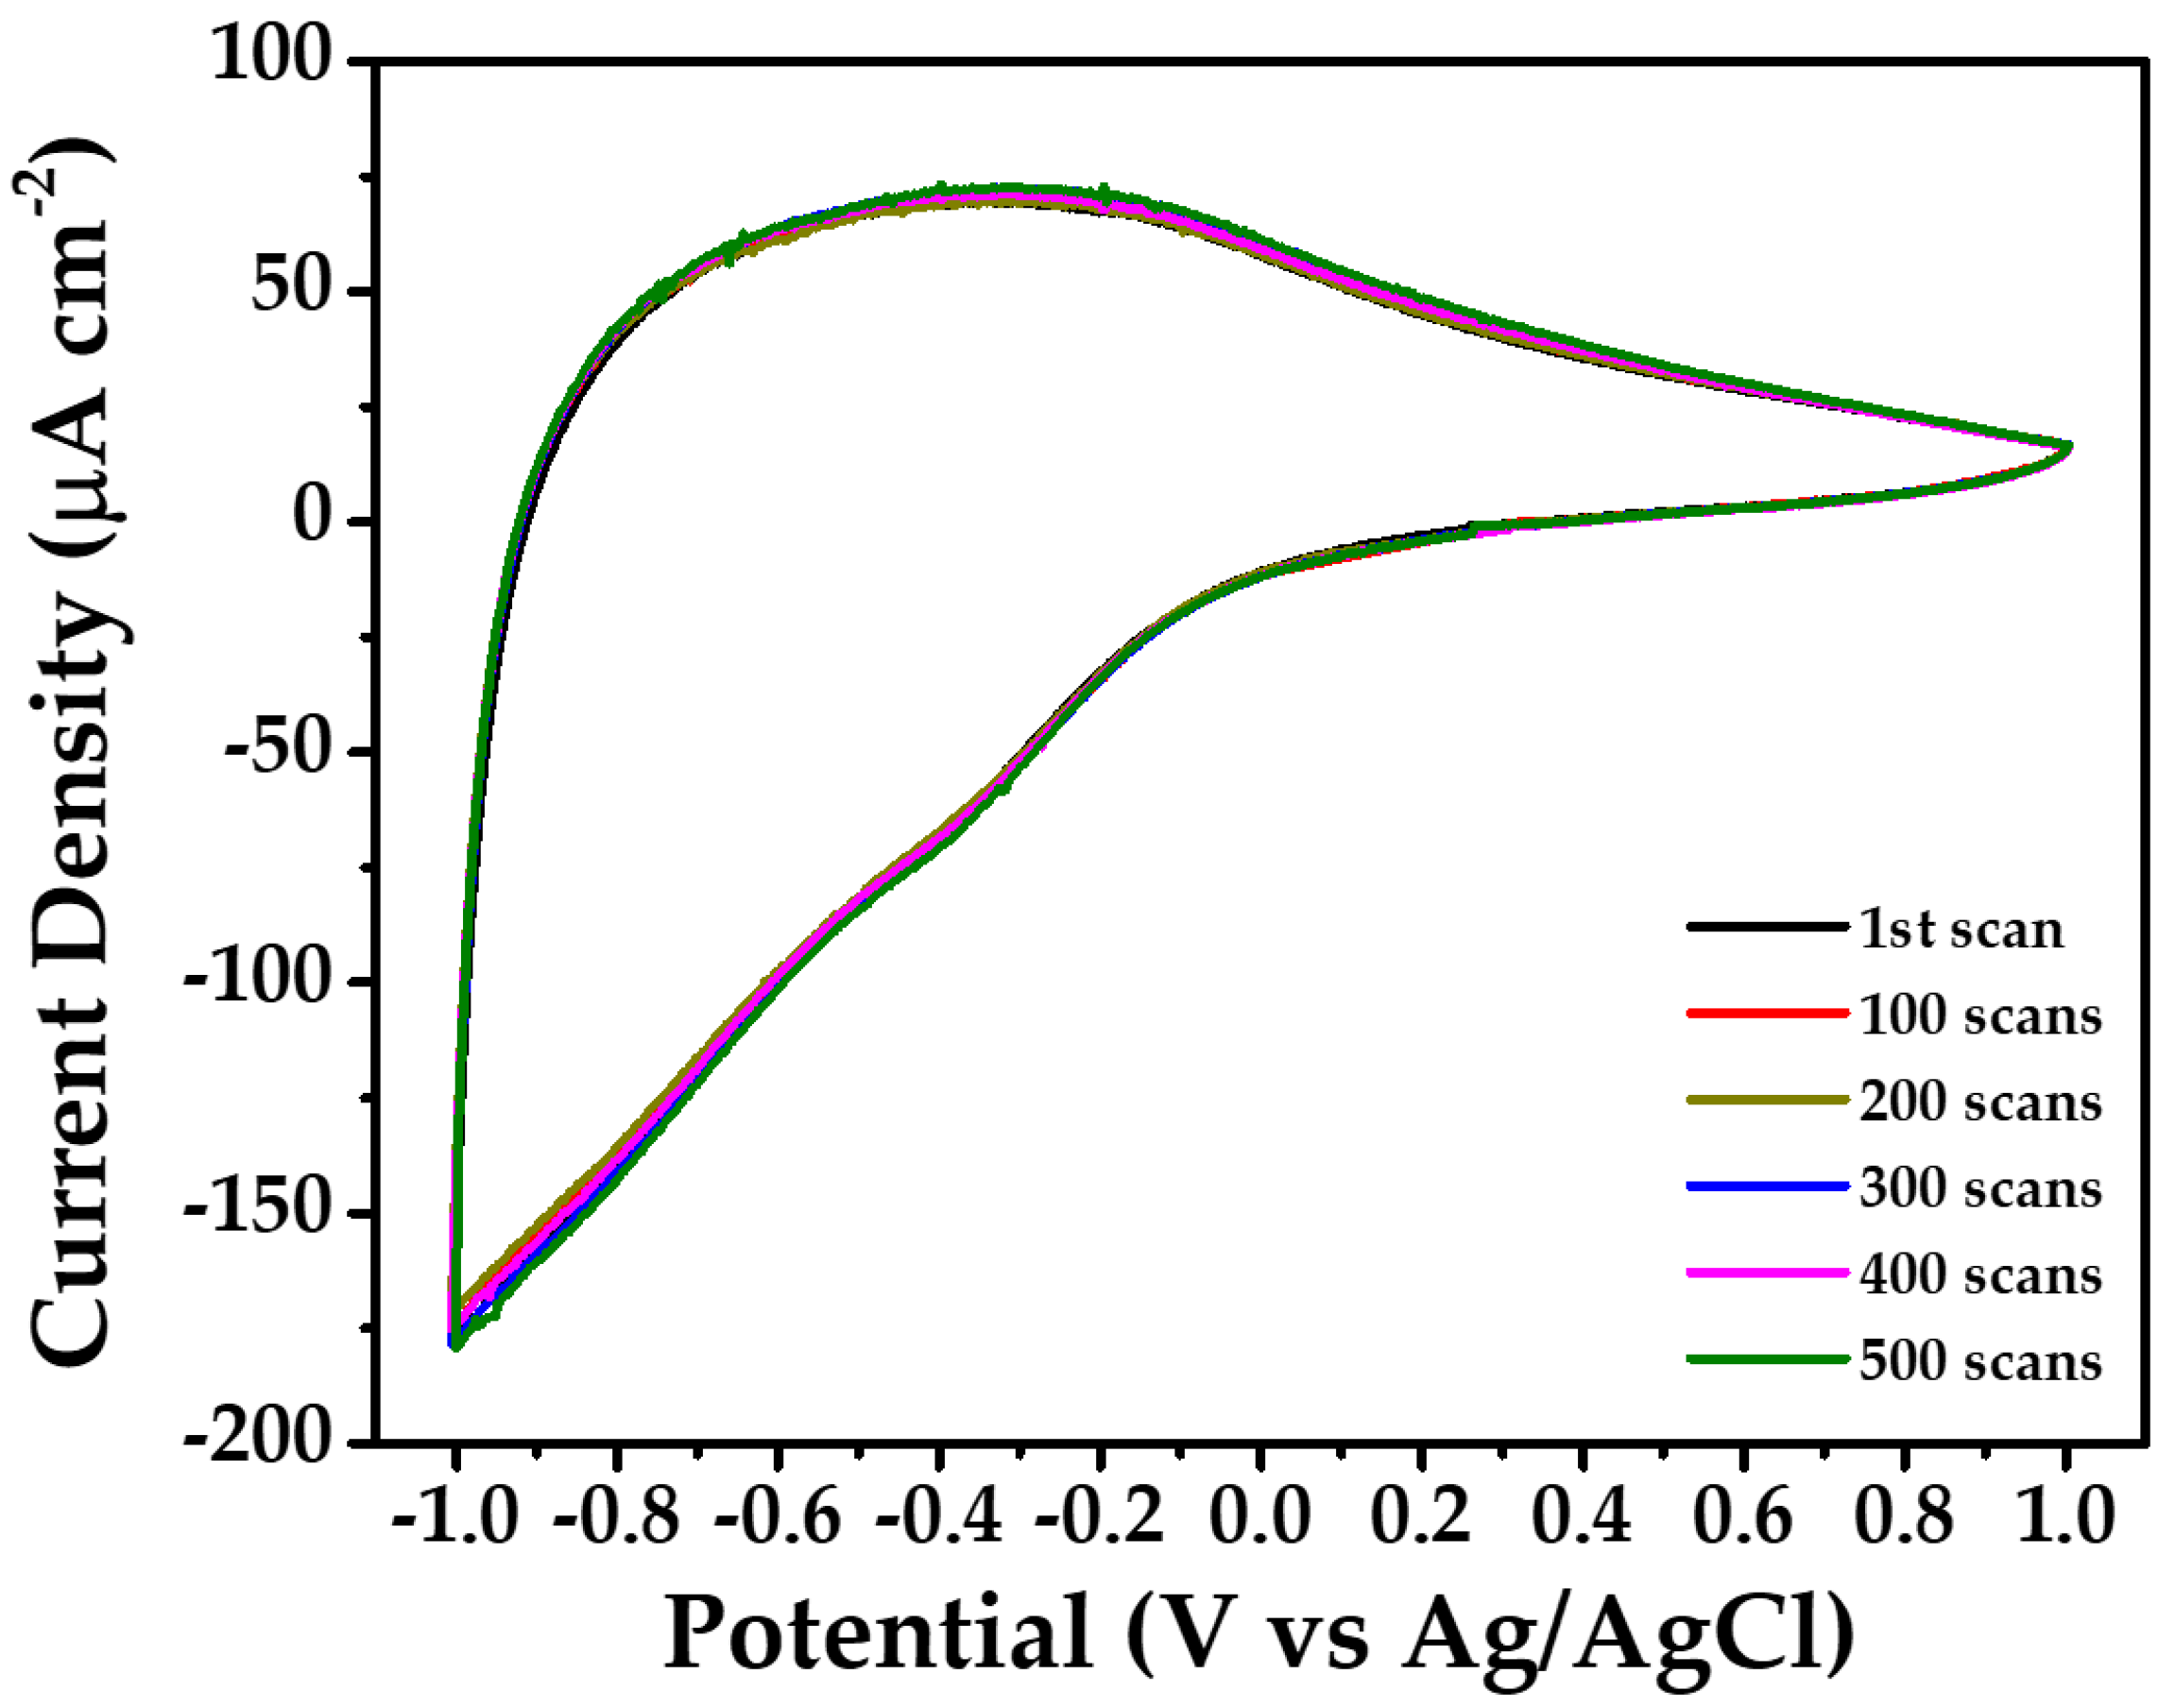
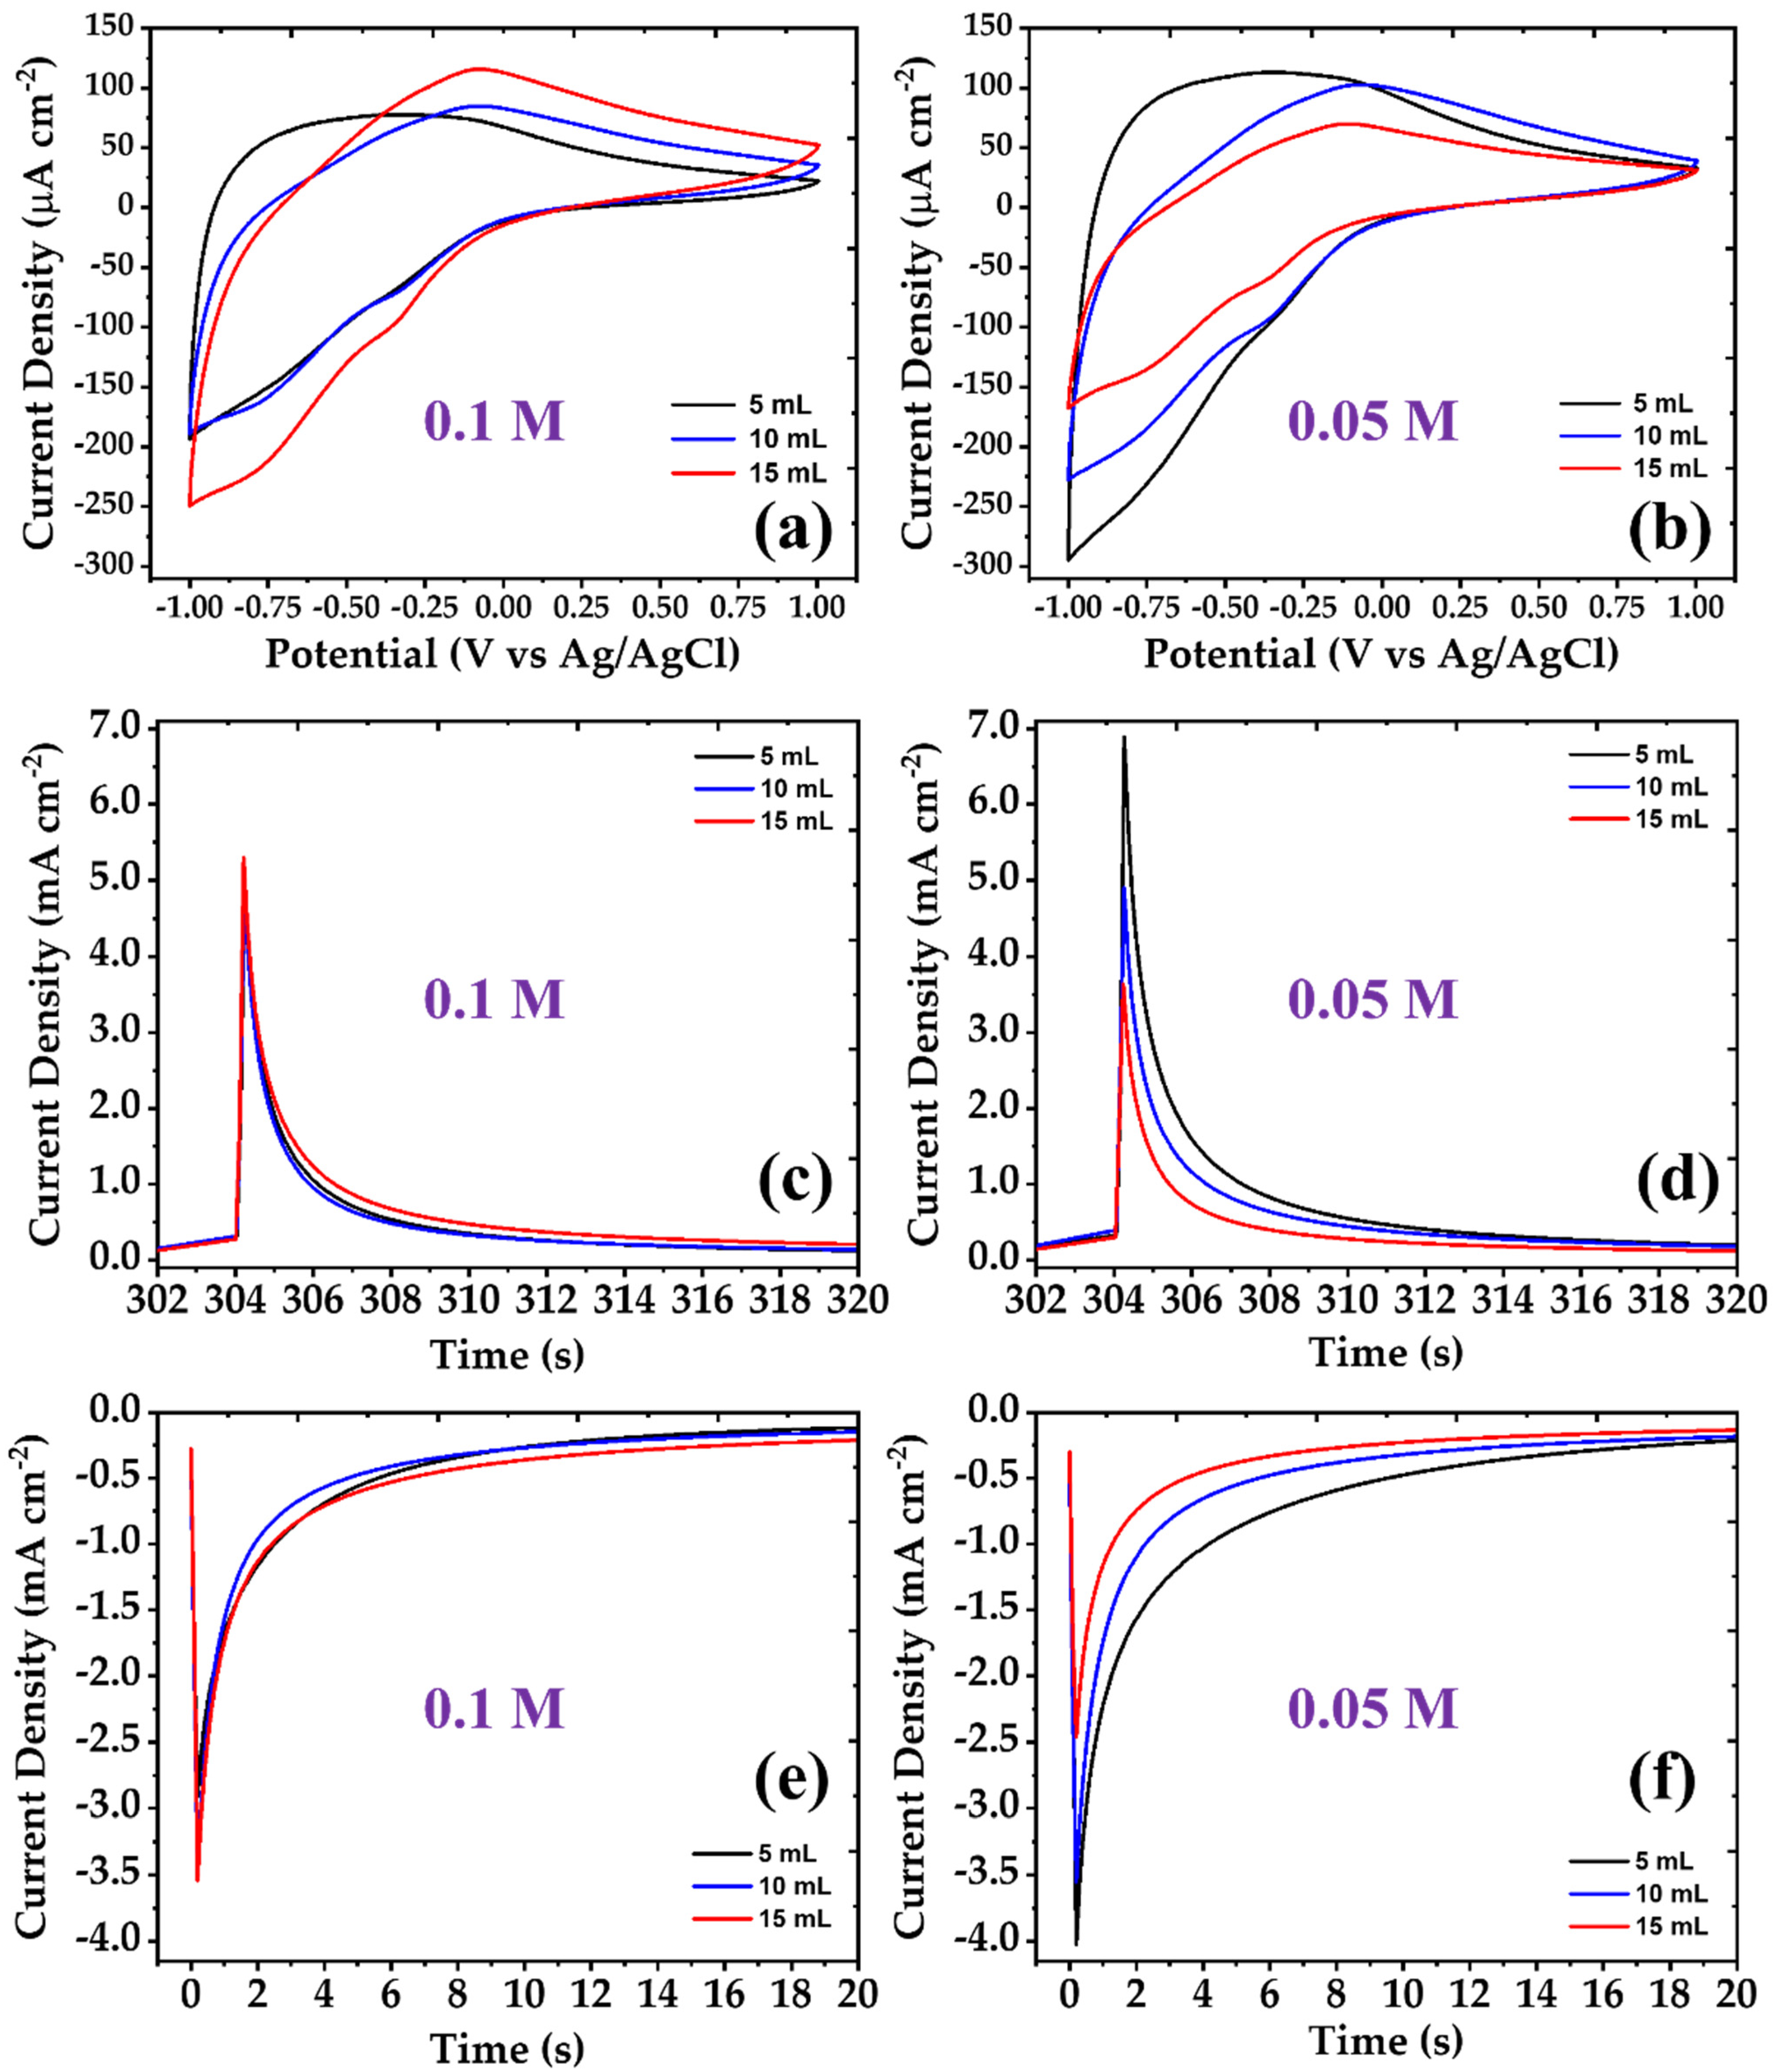
3.1. Electrochemical Characterization

The electrochemical performance of the samples was studied in a three-electrode cell, by cycling the potential between −1 V and +1 V at a scan rate of 10 mV s−1, using 1 M LiClO4 in propylene carbonate as electrolyte (Figure 1a,b). As the concentration and the precursor volume changes, the shape of the respective curves also changes. In particular, in the samples made with the 0.1 M solution, as the precursor volume increases, the current density also increases, while, the opposite behavior was observed with the samples of the 0.05 Μ solution. Regarding the shape of the electrochemical curves, the lowest precursor volume samples (5 mL) in both series exhibit small peak values in the cathode, in contrast to the samples made with larger precursor volumes. The coatings in all series exhibit one large anodic peak and two smaller cathodic peaks, which are attributed to ions’ intercalation and deintercalation, respectively, accompanying the gain and the loss of an e. In the case of films grown from the higher precursor concentration, the anodic peak occurs at −0.345 V (5 mL) and −0.096 V (10 and 15 mL), while for the films grown from the 0.05 M precursor concentration, at −0.37 V (5 mL), −0.086 V (10 mL) and −0.128 V (15 mL), respectively. On the other hand, the cathodic peaks for the films of the 0.1 M series are at approximately −0.732 and −0.322 V (5, 10, 15 mL) for all precursor volumes, while for the films grown from the 0.05 M precursor concentration, the cathodic peaks occur at: −0.733 and −0.298 V (5 mL), −0.762 and −0.361 V (10 mL) and −0.763 and −0.347 V (15 mL).
Chronoamperometry measurements were also performed in order to investigate the time evolution of the coloring/bleaching processes. Figure 1c,d depict the results of the chronoamperometry studies. The time constant has been calculated at 90% from the maximum to the final value at each chronoamperometric curve, separately. Based on these I-t measurements, the time response for the coloring of the films was found to be approximately 9 s, while, for bleaching, it was approximately 4 s. Table 1 presents in detail the response times as well as the charge densities for each type of developed sample, the respective charge density values being estimated by integrating the coloring and bleaching current densities. Comparing the results of Table 1, one can conclude that in samples made with the 0.1 M solution, the charge density increases as the precursor volume (thickness) increases, in contrast to the samples made with the solution of 0.05 M, where the opposite relation appeared. This may be due to the films’ formation onto the substrate during growth and their morphology. At lower precursor concentration, the films’ growth is slower, resulting in a more compact structuring and lower density of features on the surface compared to films grown from identical concentrated solution volume, as can be observed from the SEM characterization further on. Regarding the time constants, the range of their values presents small variations without any particular tendency, with respect to the variations of precursor concentration and volume. It should be mentioned here, that while the graphs of Figure 1 show the time constant to have a linear behavior in relation to the precursor volume, the actual values of the time constants are differentiated (as shown in Table 1) as their final values are also affected by the maximum values of the chronoamperometric diagrams. As can be seen in the results of Table 1, the samples bleach faster than they color. Moreover, it seems that the ions leaving the surface of the sample are not the same as those entering, therefore there is some ion retention in the sample. This is actually the reason why the samples do not recover their initial transparency and retain a greenish/bluish tint, a fact that can be attributed to WO3 hydration since the measurements are performed without any special dehydration conditions, as one can see from the color change of the samples (see Figure 2).

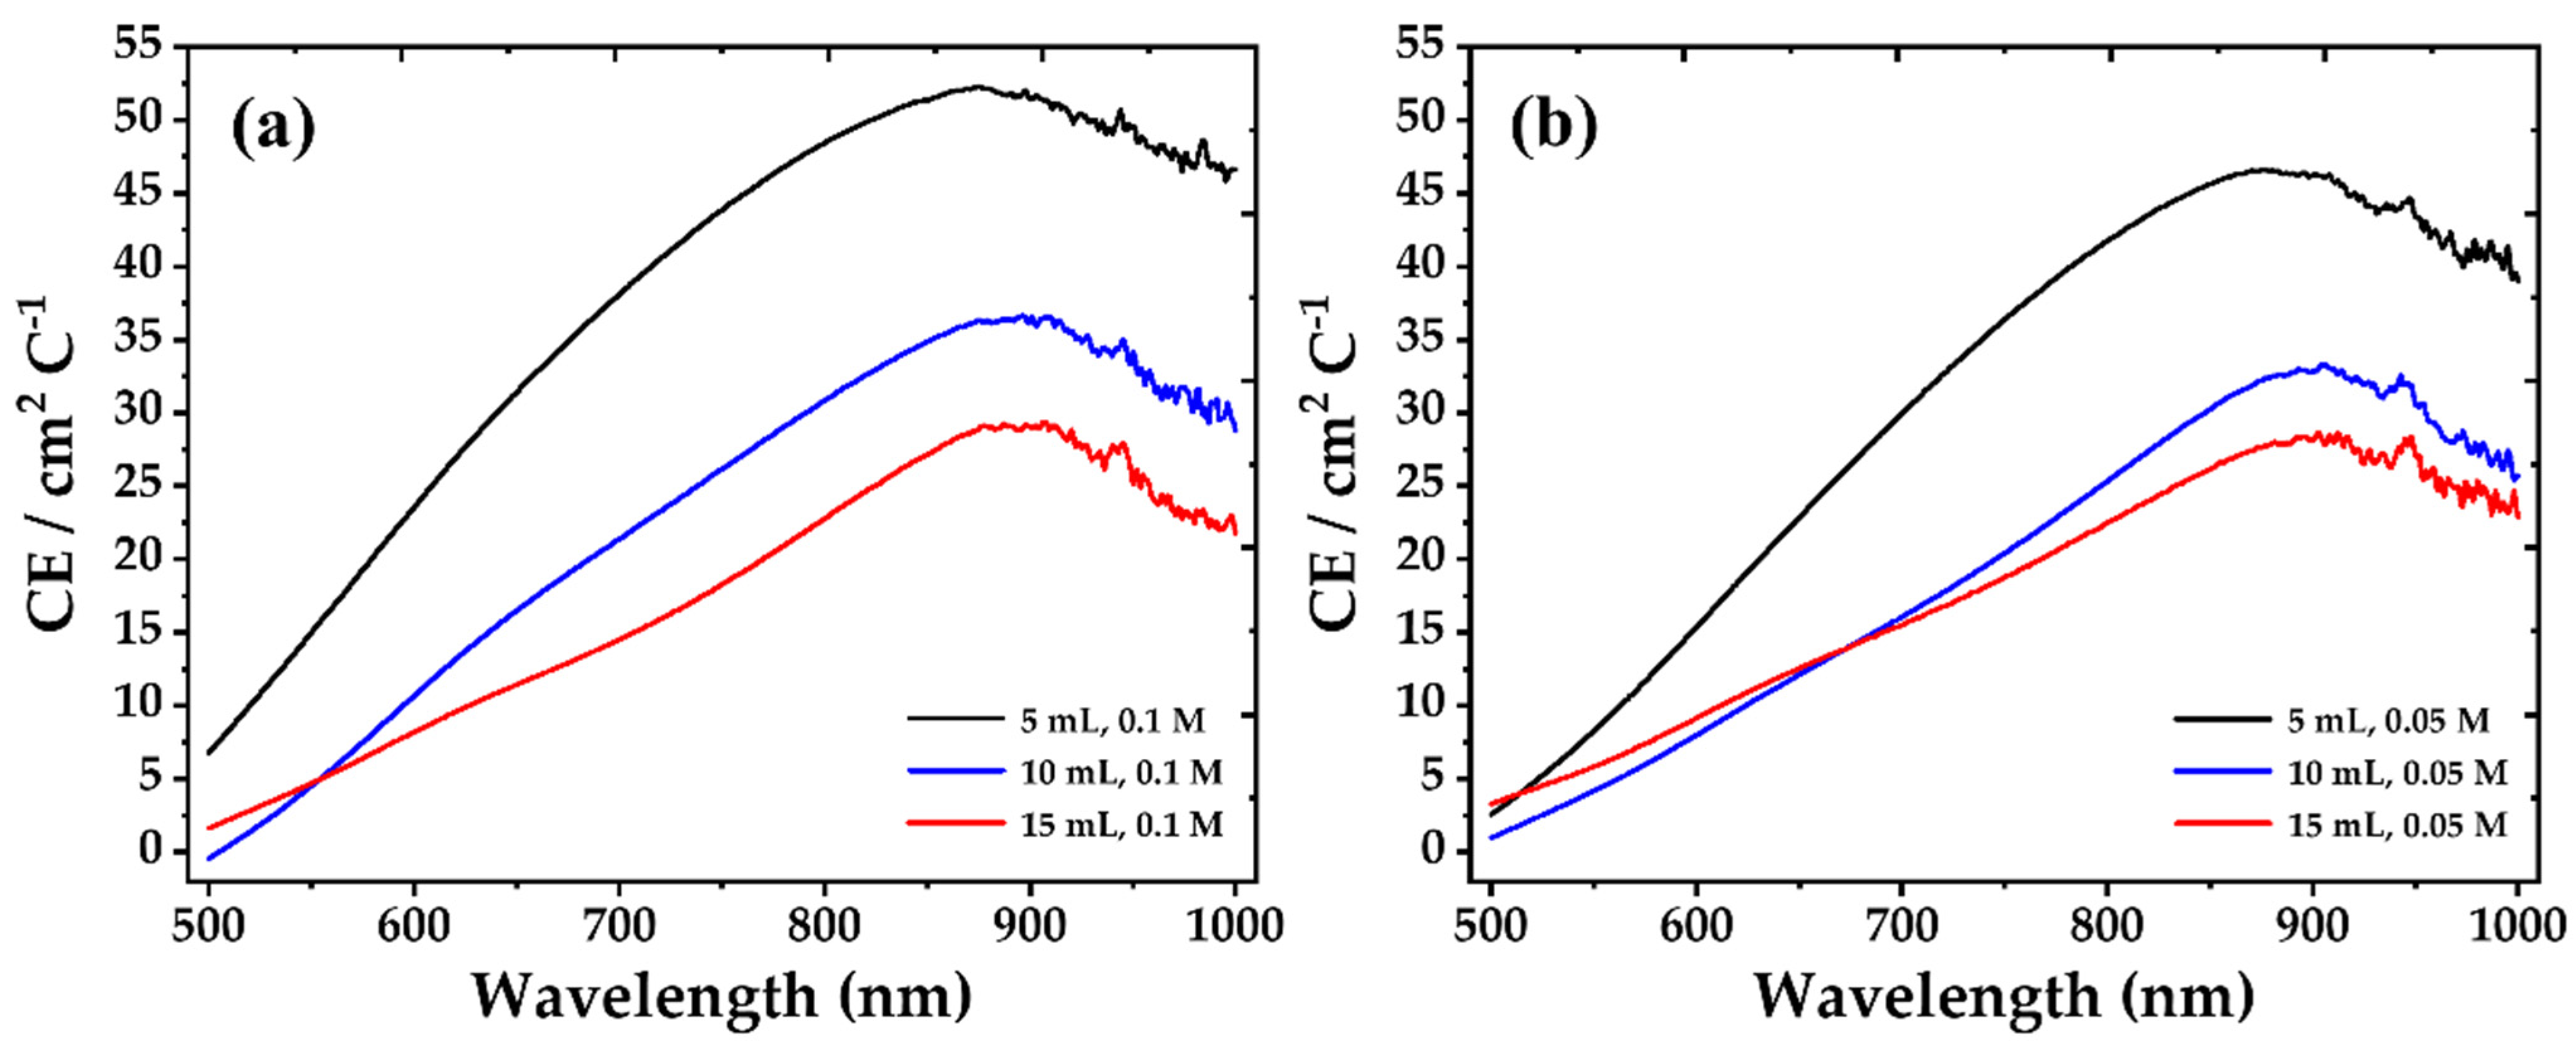
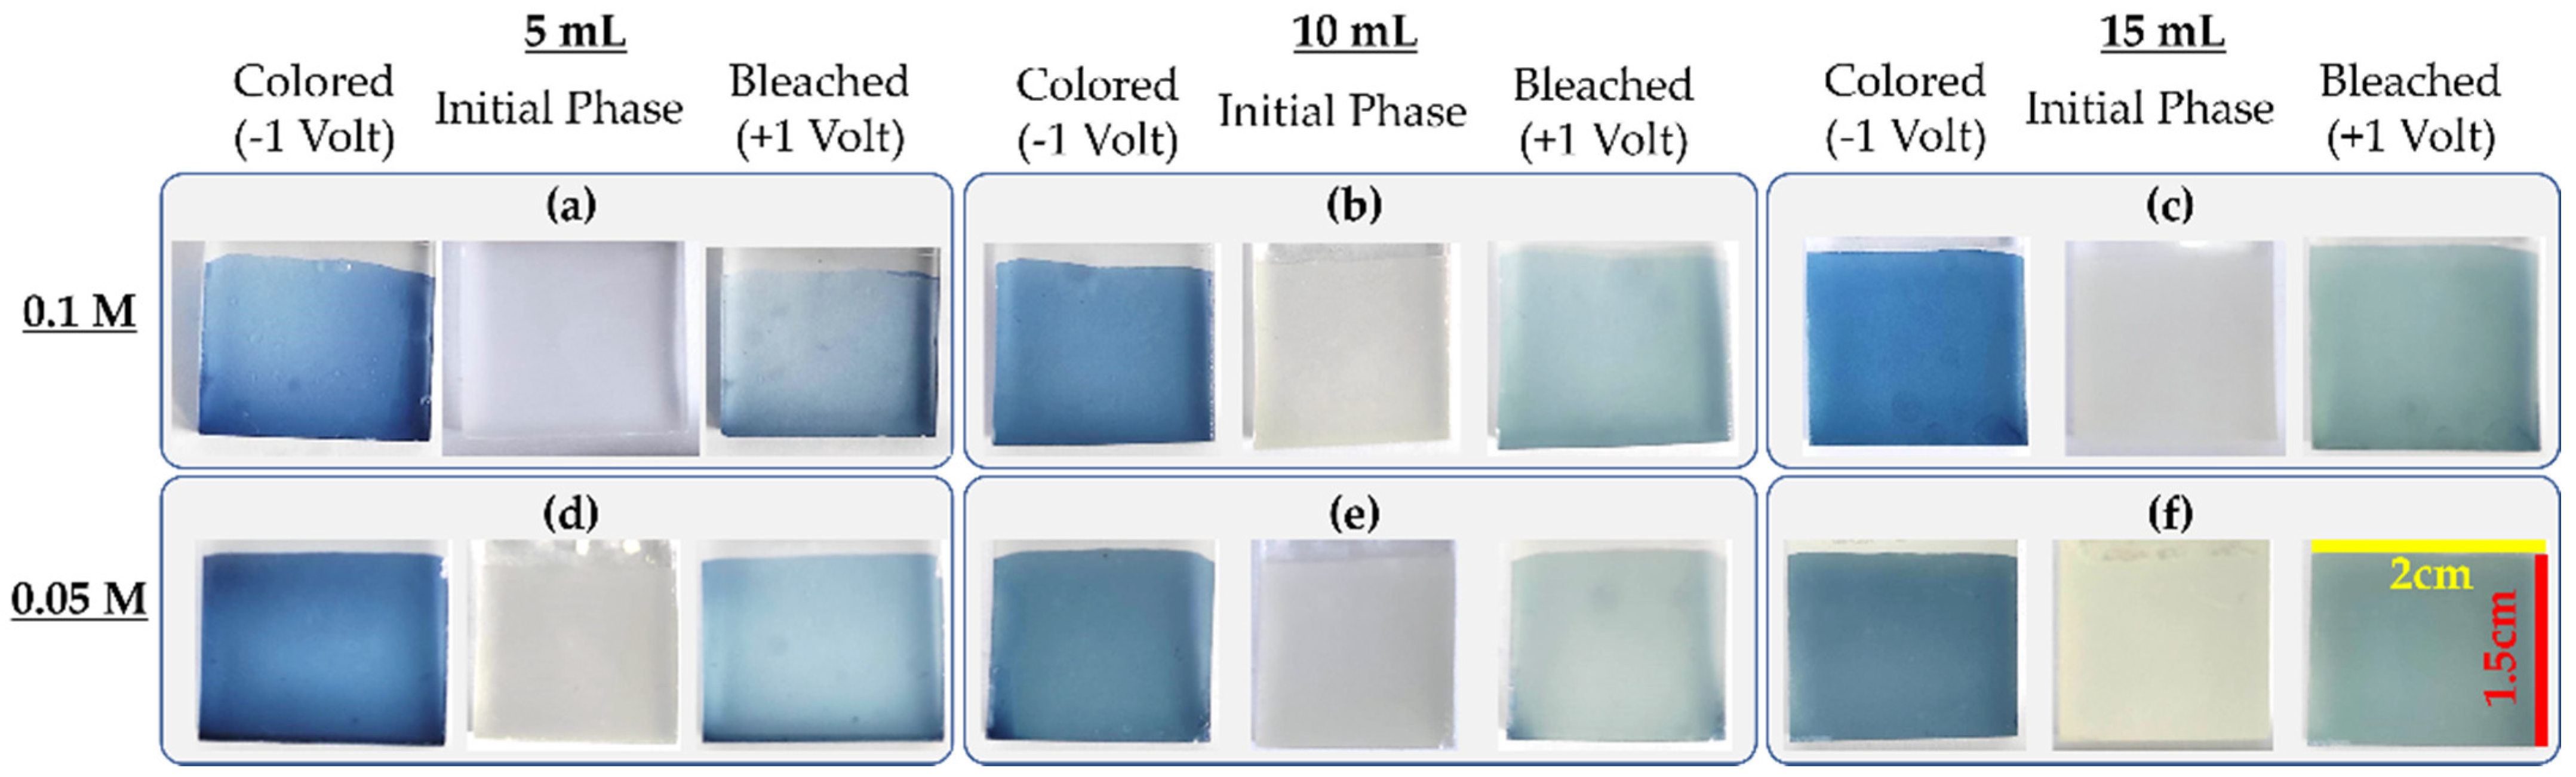
3.2. Electrochromic Characterization

As known, an electrochromic device consists of several thin layers including a transparent electrode, the electrochromic materials and an electrolyte layer, which are capable of changing the optical transmittance of the device on switching the voltage. The resulting optical transmittance changes back to the original state when the polarity of the voltage is reversed. This phenomenon pertains to the injection and extraction of electrons and ions, due to the oxidation and reduction mechanism after applying different voltages. In the case of our WO3 thin films, when a negative voltage (−1 V) was applied, the color of the WO3 coating changed from transparent to blue. When the applied voltage was reversed (+1 V), the film returned to a lighter blue shade state, less transparent than the as deposited ones. Below, in Figure 2, one can see all the shades that appeared in the samples under investigation, with the blue tint dominating at −1 V (colored phase) and the shades becoming very light blue to very light green at +1 V (bleached phase).
This behavior can also be seen in the graphs of Figure 3, where the initial phase (transparent) curve is different from the bleached one at +1 V; this behavior is attributed to the retention of some ions on the samples. In particular, the color difference increases as the wavelength increases above 500 nm, demonstrating that the electrochromic performance of the samples begins in the visible spectral region and peaks in the near infrared. Another feature that is evident from UV-Vis diagrams is the reduction of transmittance as the deposited precursor volume increases in both the initial, the colored and the bleached state, with small variations in the general behavior of the diagrams. This behavior initially confirms that as the precursor volume increases, the samples become thicker, and for this reason, we observe a decrease in their transmittance. Another observation regarding the optical characterization is the reduced transmittance of the low concentration compared to the higher one. This behavior may be due to the fact that at lower concentration, the films develop a more compact structure during deposition, as can be observed also from SEM characterization further on.
In order to quantify the electrochromic response of the films, their coloration efficiency (CE) factor was determined. This is defined as the change in the optical density (ΔOD) per unit of charge density (Q), and is an important electrochromic characteristic. It can be computed using the following equation:
C E λ = Δ O D λ Q i
where ∆OD is the change in optical density (change in the transmission between the bleached and colored states of the film), that is:
Δ O D λ = ln T b T c
where Tb and Tc are the transmittances at bleached and colored states, respectively. Qi is the charge density and λ denotes a certain wavelength. Table 2 presents the results of the calculations of the coloration efficiency at 700 nm, which is a typical wavelength used to define this parameter. Comparing the results in this table, it seems that the concentration as well as the precursor volume can play an important role in the performance of the samples. In particular, the samples made with the lowest precursor volume (5 mL) of the solution with the highest concentration exhibit the highest coloration efficiency.
The overall electrochromic performance of the samples can be seen in Figure 4, which presents the variation of the coloration efficiency as a function of the wavelength. As can be observed, as the wavelength increases the coloration efficiency increases up to a maximum at around 900 nm (for the samples with 10 and 15 mL) and around 880 nm (for the samples with 5 mL). Therefore, it is clear that these samples have an electrochromic behavior which starts in the visible spectral region and peaks in the near-infrared. The maximum coloration efficiency of the WO3 films under investigation in the near-infrared region for the samples made with the 0.1 M concentration is 52.27 cm2 C−1 (5 mL), 36.64 cm2 C−1 (10 mL) and 29.38 cm2 C−1 (15 mL), respectively. For the samples made with the 0.05 M concentration, the coloration efficiency was found slightly lower, that is 46.61 cm2 C−1 (5 mL), 33.29 cm2 C−1 (10 mL) and 28.67 cm2 C−1 (15 mL).
According to the recorded results and the values in Table 2, the coloration efficiency of the samples depends on the precursor solution volume used in the deposition process as well as the concentration of the solution in use. Following these results, it seems that the lower the thickness, the better the electrochromic behavior of the samples, a fact that requires investigation.
Multiple scans of cyclic voltammetry were performed for each sample in order to verify their stability, where the applied voltage was scanned between −1 V and +1 V and at a scanning rate of 10 mV sec−1. Figure 5 presents the results of this study, where one can see that the samples maintain their original cyclic voltammetry curve without any particular obvious modification in the current density or the shape of the curve, even after 500 scanning cycles. The differences in the curves are so small that they reach the limits of statistical error of the instrument, as can be seen in Figure 5, where one curve overlaps the other. Based on these, one can conclude that these WO3 films have very good stability over time.
As mentioned in the introduction, as far as we know, there are not many reports in the literature regarding WO3 films grown by simple air-carrier spray for electrochromic applications, in order to compare results. One of the first reports on using air-carrier spray deposition for WO3 deposition was published in 2014 by Leftheriotis et. al. [6], who reported electrochromic films’ deposition using WO3 in H2O2 as precursor. Their as deposited films were amorphous, but after annealing were found to consist of nanorods. They exhibit favorable electrochromic properties, such as a coloration efficiency of 52.4 cm2 C−1 at 800 nm, but the films’ mechanical properties and adherence were not suitable for practical applications. In 2015, Park et. al. [4] presented the deposition of WO3 thin films on FTO and ITO glass substrates, using simple air carrier spray at room temperature under low-vacuum conditions. The WO3 film coated onto FTO glass exhibited an electrochromic contrast of 50% at 800 nm, with Tmin = 7% and Tmax = 57%. XRD and SEM study revealed that the WO3 formed polycrystalline granular compact thin films with monoclinic crystalline structure. Cyclic voltammetry measurements revealed that a small applied bias was required for color switching from slight yellow to dark blue. Pure WO3 electrochromic films deposited by other growth techniques were often reported in the literature and in all cases, a more or less similar correlation efficiency has been reported. In contrast, the information regarding stability is rather limited. [18,19,20,21,22,23,24,25,26,27,28]. Since the films’ structuring are very different, even if the electrochromic behavior may be comparable to the one reported by other works, direct comparison wouldn’t be useful.

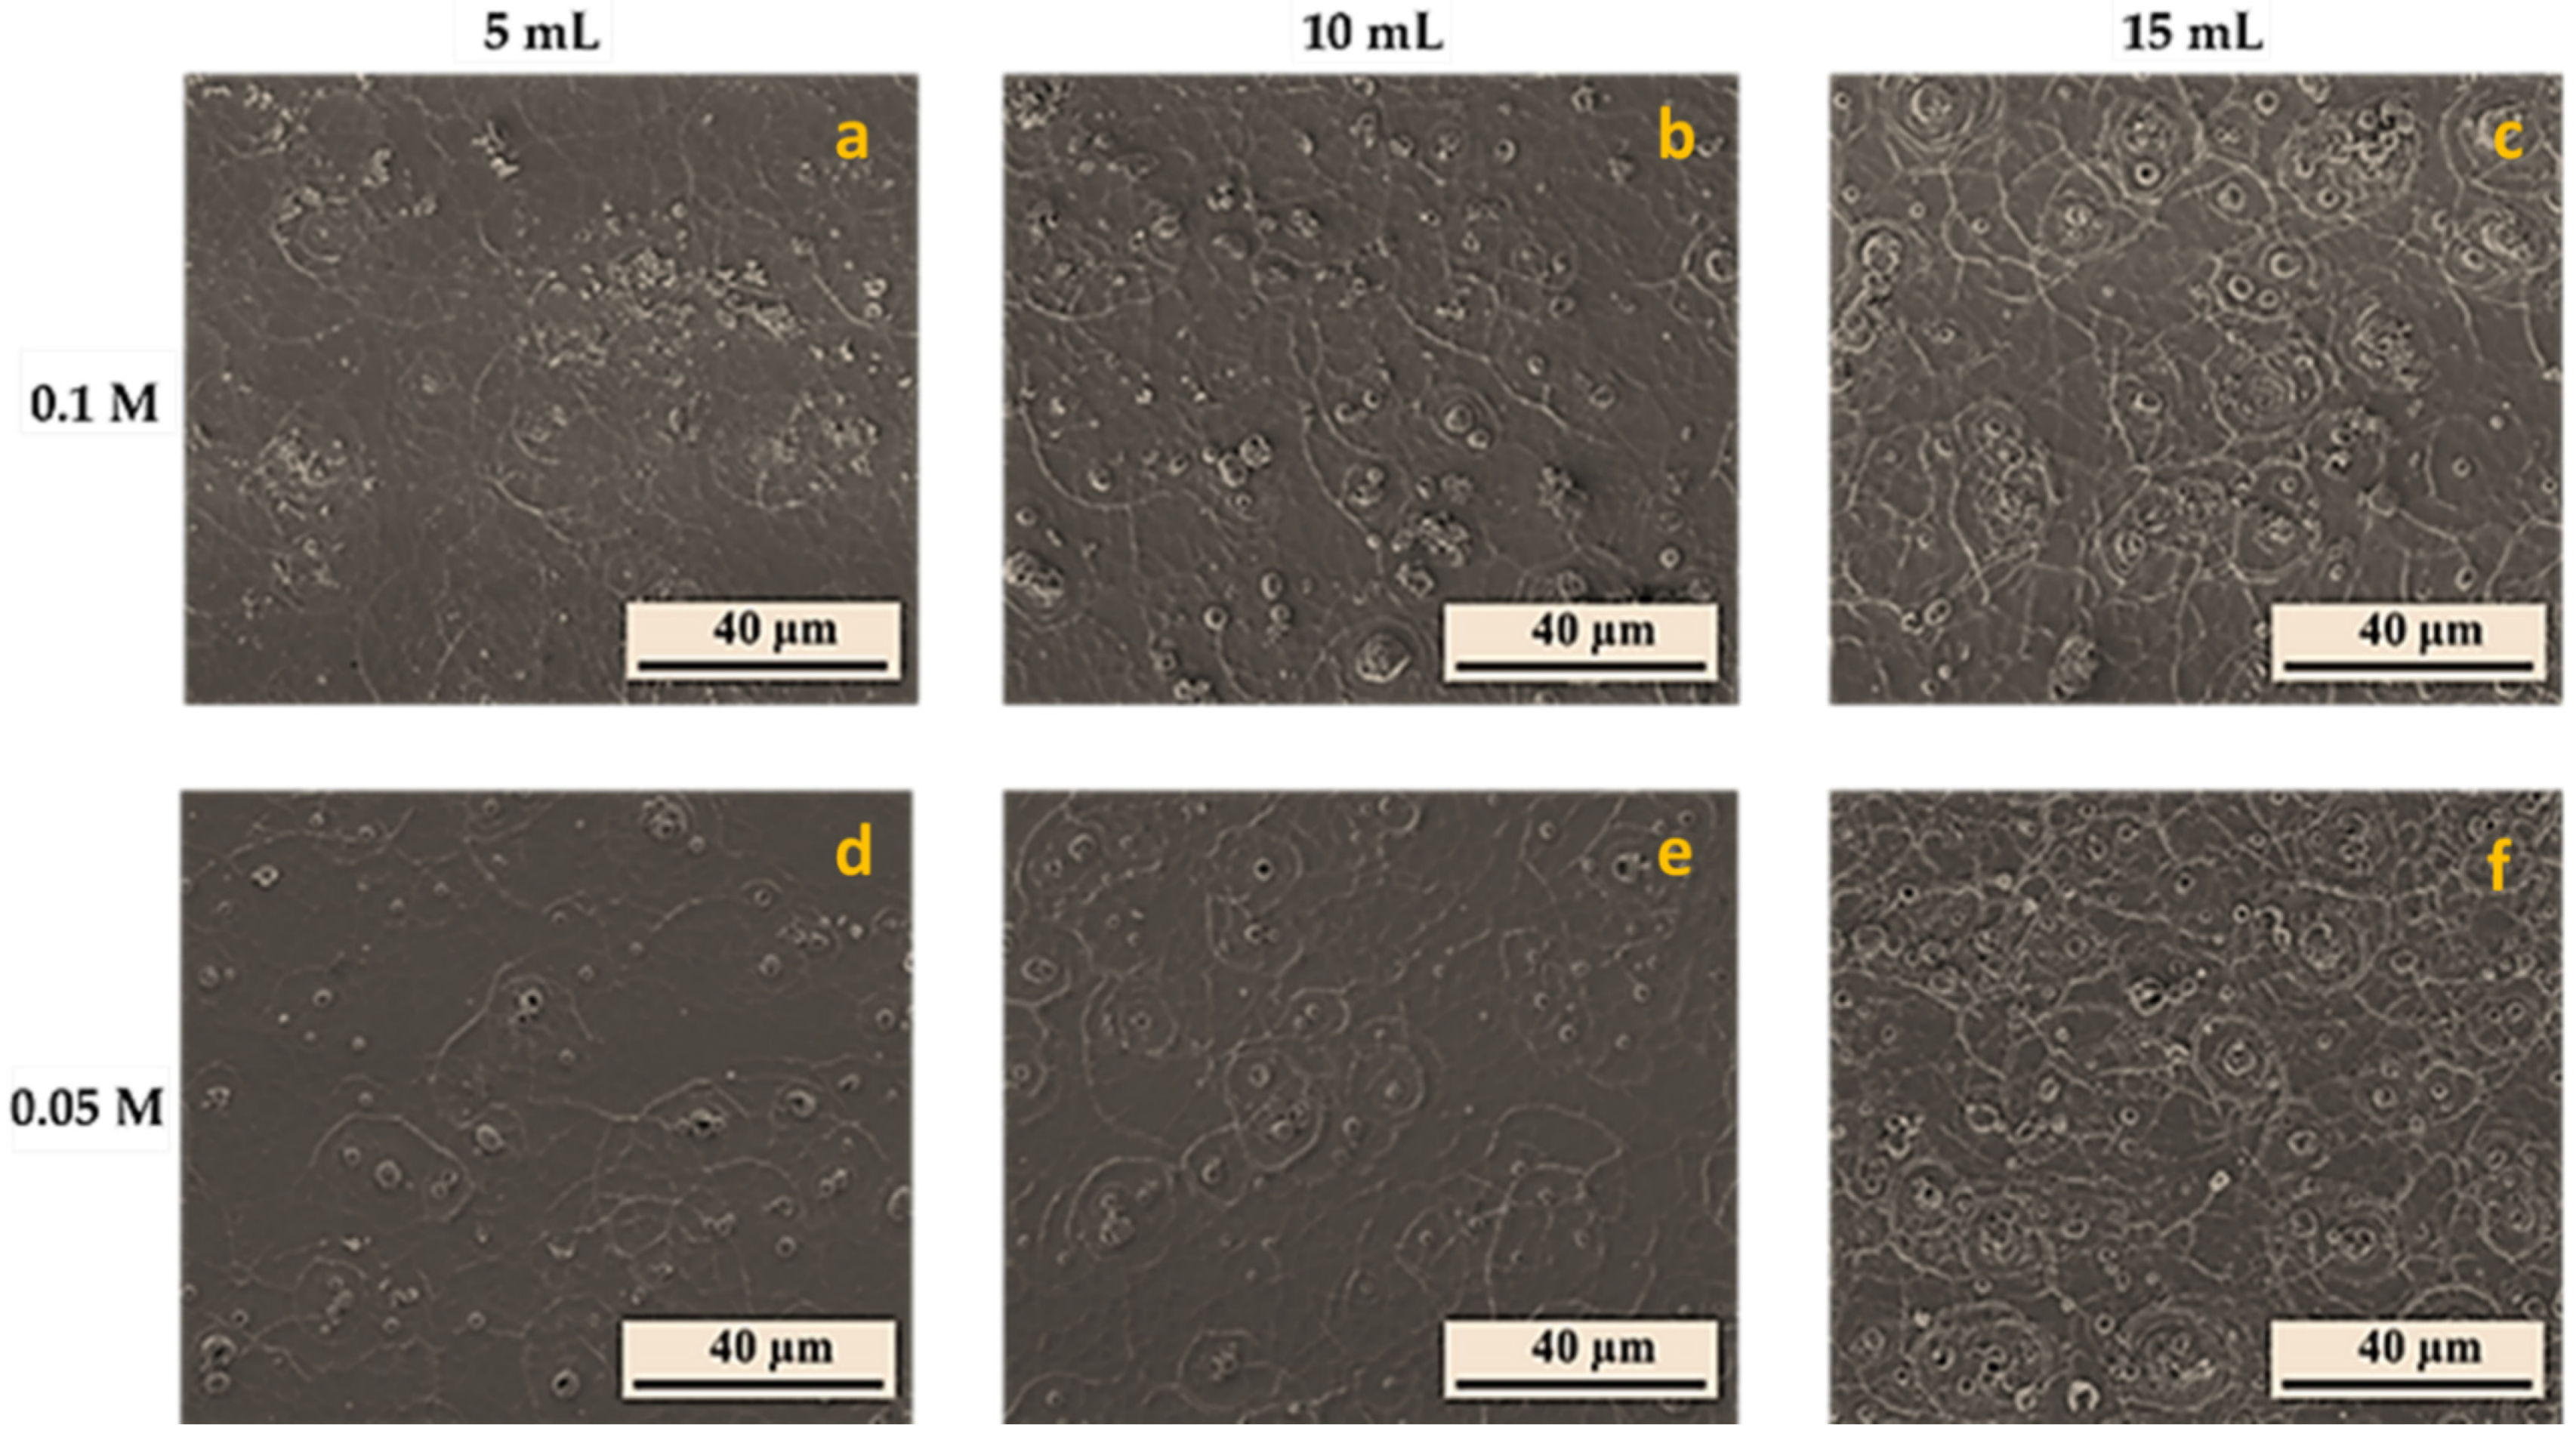
3.3. Morphological Characterization

SEM characterization shows that the WO3 thin films have a unique micro-structured morphology consisting of wall-like structures combined with bubble-like islands randomly distributed on a polycrystalline WO3 granular nanocrystalline background. WO3 thin film morphology of the fabricated samples is shown in Figure 6. As far as we know, this structuring for WO3 films has never been reported in the literature and further detailed studies are required in order to understand the growth process and the effect of this morphology on electrochromic characteristics. Regarding the effects of thickness and concentration on the surface morphology and structuring, it was observed that only slight variations of size and feature density on the films’ surfaces are present. According to these preliminary SEM observations, it seems that increasing thickness at lower precursor concentration leads to films with more compact features. Then, following the results of Table 1 and Table 2, it seems that lower thickness films with a less compact morphology favor the electrochromic response. Therefore, more detailed studies regarding the evolution of the films’ morphology and texturing, as well as their relation with the electrochromic behavior of these materials, is required for both a better understanding of the underlying mechanisms and further improvement of the performance of the films.

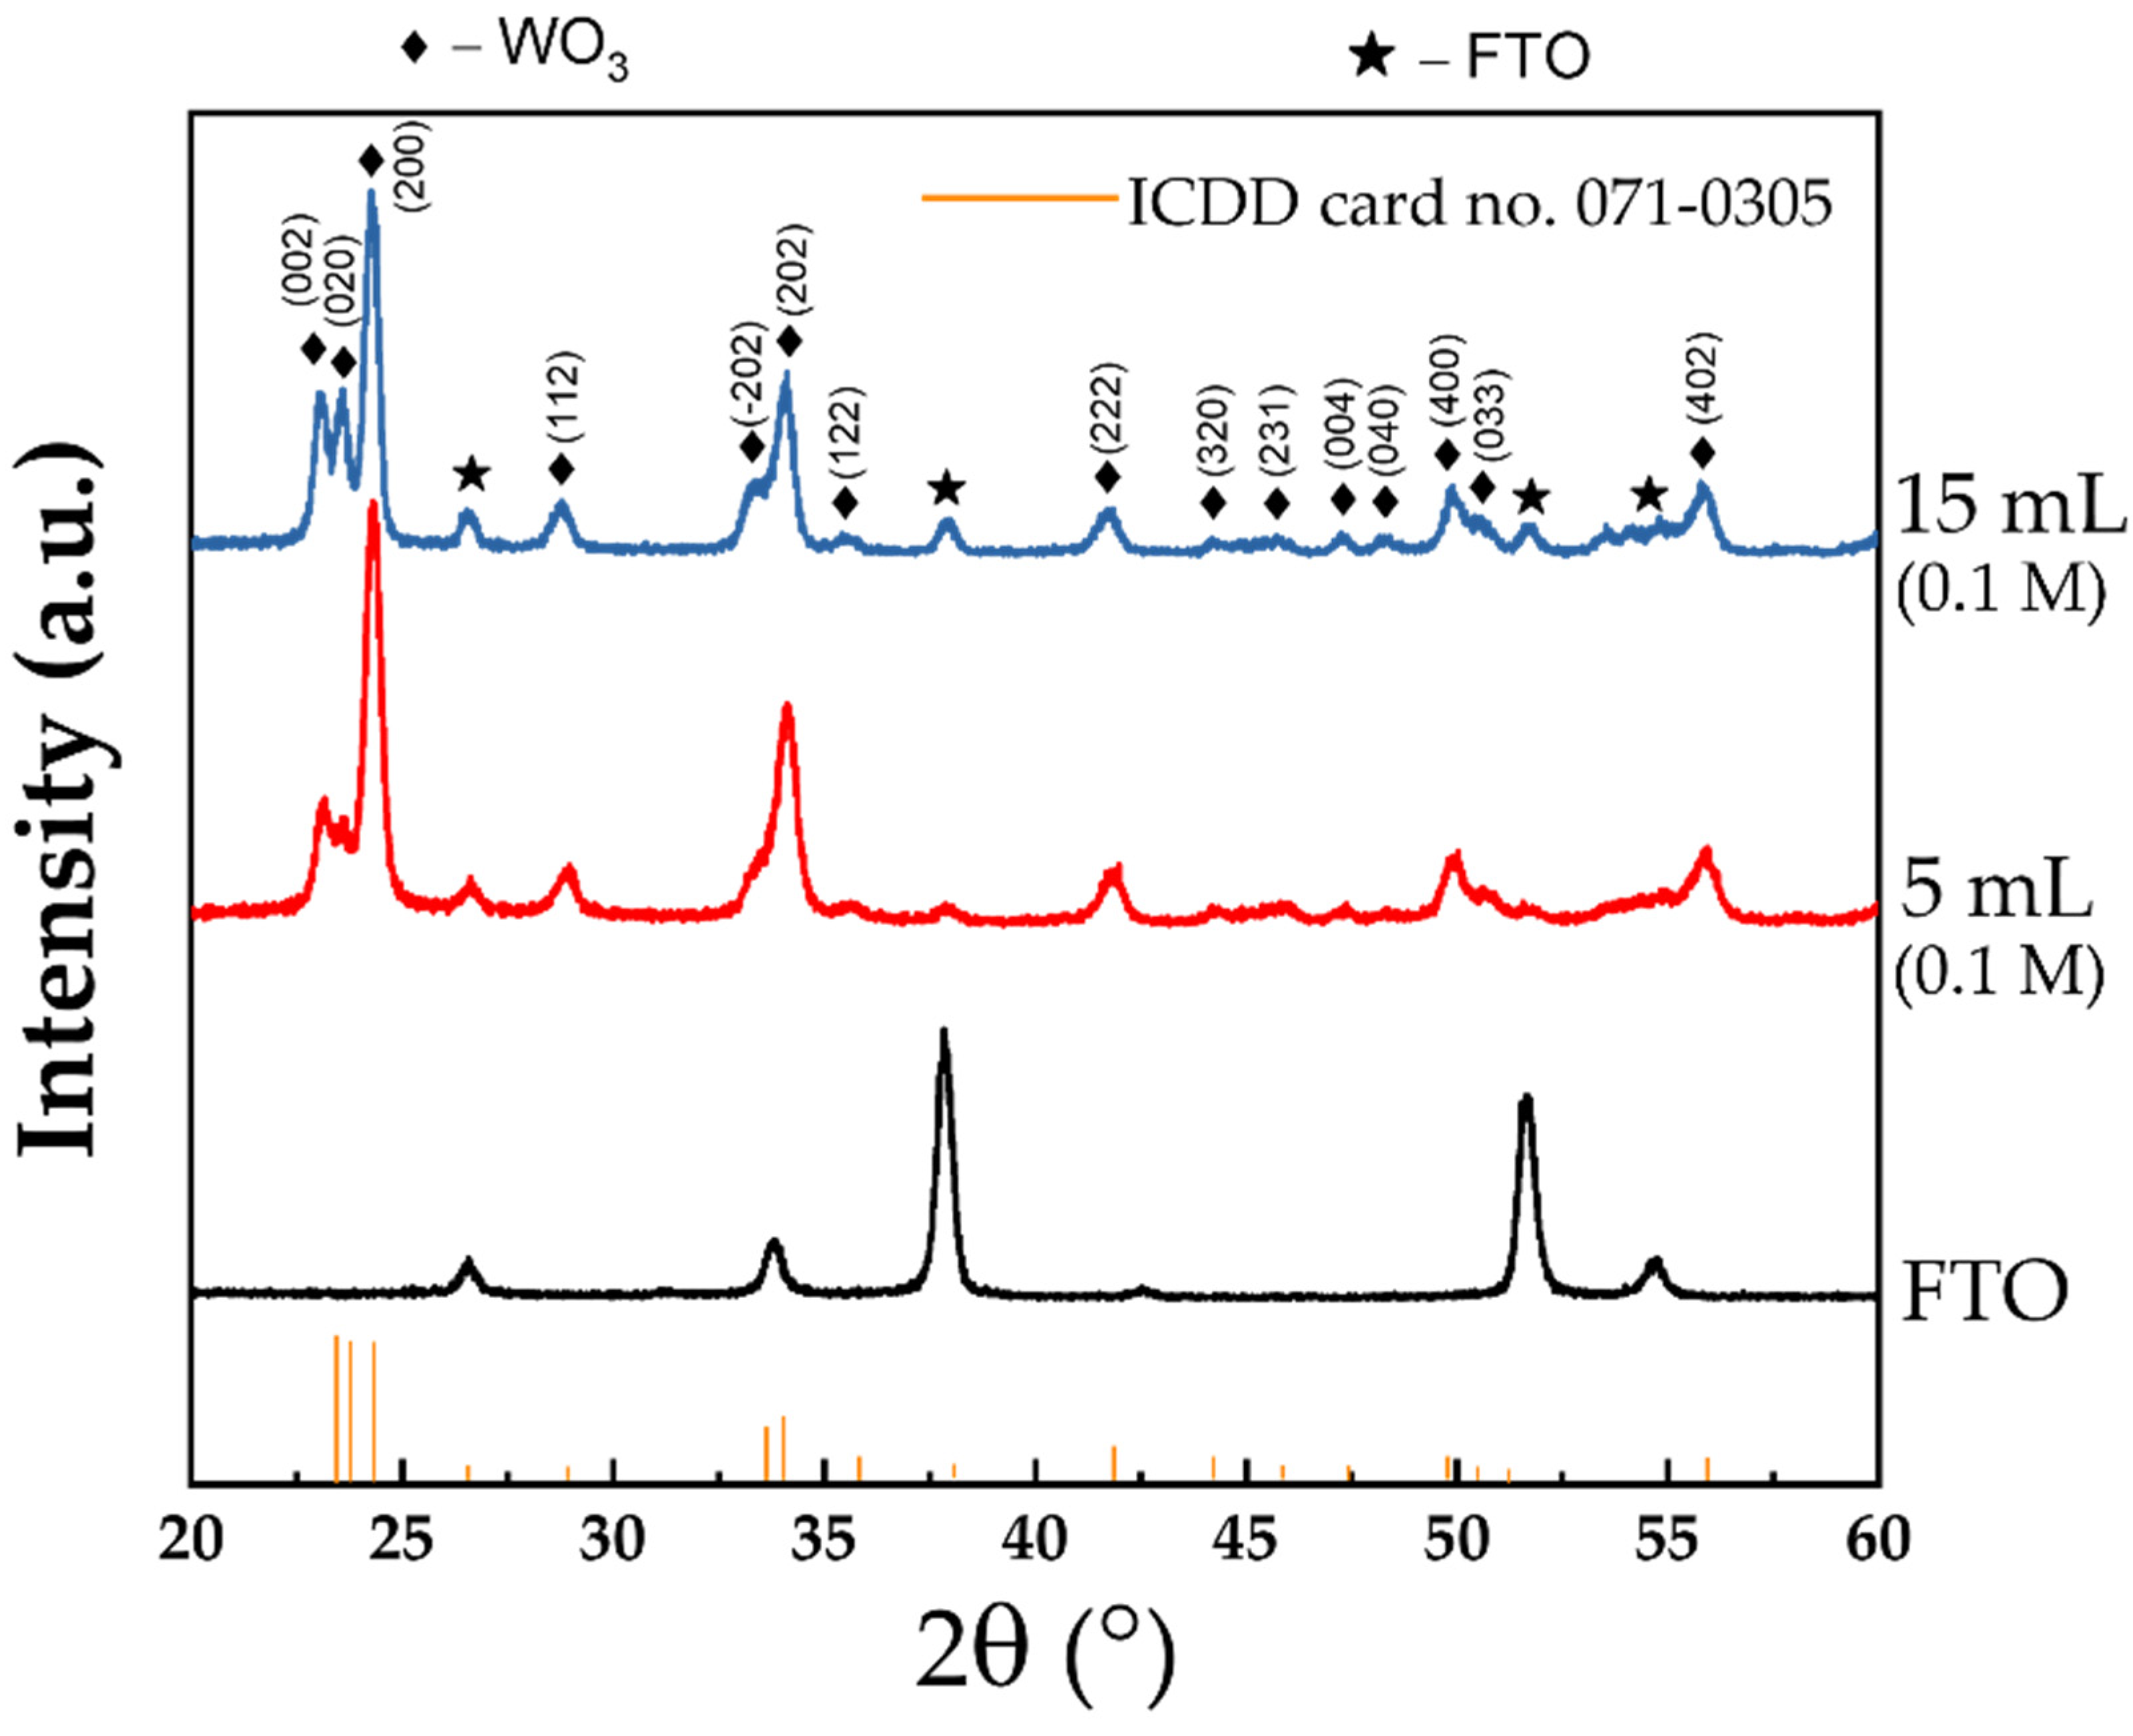
3.4. Structural Characterization

In order to study the crystallinity of the WO3 films, grazing incidence X-ray diffraction was employed. The incidence angle was kept at 0.5°, while the X-ray pattern was recorded in the 2θ range of 20–60°, as shown in Figure 7, for two WO3 films’ cases and the substrate.
Each diffraction pattern of the WO3 samples presents a set of diffraction features with different intensities located at 23.1, 23.5, 24.2, 26.5, 28.7, 33.3, 34.1, 35.4, 41.7, 44.4, 45.6, 47.2, 48.3, 49.9, 50.7 and 55.8°, assigned with different (hkl) Miller indices, using ICDD database–International Center for Diffraction Data, that is (002), (020), (200), (−120), (112), (−202), (202), (122), (222), (320), (231), (004), (040), (400), (033) and (402). These are all attributed to WO3 with monoclinic crystal structure, belonging to the P21/n(14) space group with the following lattice parameters and angles: a = 0.73 nm; b = 0.75 nm; c = 0.76 nm;   α = 90°; β = 90.9°; γ = 90°, according to card no. 05–0363. No impurity peaks were detected in the XRD patterns. Thickness variation and precursor concentration seem to affect only the peak intensities, the films exhibiting better crystallinity. Further studies of films’ structuring are ongoing so that these, in correlation with the SEM studies, can provide more information about the characteristics that can favor electrochromic performance and its stability.

3.5. Raman Analysis

Typical Raman spectra of the developed WO3 films can be observed from Figure 8, where the peaks at 269 and 326 cm−1 correspond to the O–W–O bending modes of binding oxygen of WO3, while those between 600–1000 cm−1 to the W–O stretching modes. The strong peaks in each spectrum at 269 cm−1 δ (O-W-O stretching), and at 711 and 803 cm−1 (W-O-W anti-symmetric stretch) are due to monoclinic structure WO3 (δ -WO3 only modes). Peaks associated with the ε phase appear at 326, 421 and 679 wavenumbers. A band corresponding to the lattice vibration is present at 120 cm−1.
These results are in good agreement with the XRD characterization observations. Following the structural and morphological characterization, it is clear that a more detailed study of the dependence of these basic characteristics on the growth conditions is necessary, so that the electrochemical and electrochromic behavior shown in these materials can be better understood. A deep understanding of growth-structuring functionality correlation would allow further tuning of growth, achieving enhanced functionality.

4. Conclusions

WO3 micro-structured thin films with a unique surface structuring morphology were successfully grown on FTO coated glass using spray deposition and the effect of precursor concentration and deposition time on the electrochemical, electrochromic and optical properties of the WO3 films was investigated. The films were found to exhibit a good electrochromic activity associated with a reasonably good durability of charge exchange and optical modulation under harsh electrochemical cycling in Li-ion-conducting electrolyte, even after 500 cycles. Associated compositional and structural characteristics were conserved in all the samples, indicating that the improved durability observed may be due to the unique WO3 thin films’ structuring. In particular, the surface of the films was found to consist of wall-like structures combined with bubble-like islands on a polycrystalline WO3 granular background, crystallized in the monoclinic crystal system structure. Since these are preliminary results, further research efforts are ongoing in order to explore in detail the films’ structuring and to tailor the growth parameters in order to improve the coloration efficiency and its stability.

Author Contributions

Conceptualization, I.V.T., S.C., M.P.S. and E.K.; Data curation, C.R., M.P., G.S., M.P.S. and E.K.; Formal analysis, K.M., I.V.T., C.R., C.P., M.P., M.P.S. and E.K.; Funding acquisition, E.K.; Investigation, K.M., I.V.T., C.R., C.P., M.P., G.S. and M.P.S.; Methodology, K.M., I.V.T., S.C., M.P.S. and E.K.; Project administration, S.C., M.P.S. and E.K.; Resources, M.P.S. and E.K.; Supervision, S.C., M.P.S. and E.K.; Validation, I.V.T., C.P., C.R., S.C., M.P.S. and E.K.; Visualization, K.M., C.R., C.P. and M.P.; Writing–original draft, K.M., I.V.T., C.R., C.P., M.P., G.S., S.C., M.P.S. and E.K.; Writing–review & editing, C.R., K.M., M.P.S. and E.K. All authors have read and agreed to the published version of the manuscript.

Funding

This research is co-financed by Greece and the European Union (European Social Fund-ESF) through the Operational Programme «Human Resources Development, Education and Lifelong Learning» in the context of the project “Strengthening Human Resources Research Potential via Doctorate Research–2nd Cycle” (MIS−5000432), implemented by the State Scholarships Foundation (ΙΚΥ).

Institutional Review Board Statement

Not applicable.

Informed Consent Statement

Not applicable.

Data Availability Statement

The raw and processed data required to reproduce these findings cannot be shared at this time due to technical or time limitations. The raw and processed data will be provided upon reasonable request to anyone interested once the technical problems have been solved.

Acknowledgments

M.P.S.: C.P. and C.R. contributions were partially financed by the Romanian Ministry of Research, Innovation and Digitalisation thorough “MICRO-NANO-SIS PLUS” core Programme.

Conflicts of Interest

The authors declare that they have no known competing financial interests or personal relationships that could have appeared to influence the work reported in this paper.

References

  1. Ortega, J.M.; Martínez, A.I.; Acosta, D.R.; Magaña, C.R. Structural and Electrochemical Studies of WO3 Films Deposited by Pulsed Spray Pyrolysis. Sol. Energy Mater. Sol. Cells 2006, 90, 2471–2479. [Google Scholar] [CrossRef]
  2. Jeong, C.Y.; Kubota, T.; Tajima, K. Flexible Electrochromic Devices Based on Tungsten Oxide and Prussian Blue Nanoparticles for Automobile Applications. RSC Adv. 2021, 11, 28614–28620. [Google Scholar] [CrossRef]
  3. Yao, M.; Li, T.; Long, Y.; Shen, P.; Wang, G.; Li, C.; Liu, J.; Guo, W.; Wang, Y.; Shen, L.; et al. Color and Transparency-Switchable Semitransparent Polymer Solar Cells towards Smart Windows. Sci. Bull. 2020, 65, 217–224. [Google Scholar] [CrossRef]
  4. Park, S.I.; Kim, S.; Choi, J.O.; Song, J.H.; Taya, M.; Ahn, S.H. Low-Cost Fabrication of WO3 Films Using a Room Temperature and Low-Vacuum Air-Spray Based Deposition System for Inorganic Electrochromic Device Applications. Thin Solid Films 2015, 589, 412–418. [Google Scholar] [CrossRef]
  5. Dhandayuthapani, T.; Sivakumar, R.; Zheng, D.; Xu, H.; Ilangovan, R.; Sanjeeviraja, C.; Lin, J. WO3/TiO2 Hierarchical Nanostructures for Electrochromic Applications. Mater. Sci. Semicond. Process. 2021, 123, 105515. [Google Scholar] [CrossRef]
  6. Leftheriotis, G.; Liveri, M.; Galanopoulou, M.; Manariotis, I.D.; Yianoulis, P. A Simple Method for the Fabrication of WO3 Films with Electrochromic and Photocatalytic Properties. Thin Solid Films 2014, 573, 6–13. [Google Scholar] [CrossRef]
  7. Purushothaman, K.K.; Muralidharan, G.; Vijayakumar, S. Sol-Gel Coated WO3 Thin Films Based Complementary Electrochromic Smart Windows. Mater. Lett. 2021, 296, 129881. [Google Scholar] [CrossRef]
  8. Xue, S.; Gao, G.; Zhang, Z.; Jiang, X.; Shen, J.; Wu, G.; Dai, H.; Xu, Y.; Xiao, Y. Nanoporous WO3 Gasochromic Films for Gas Sensing. ACS Appl. Nano Mater. 2021, 4, 8368–8375. [Google Scholar] [CrossRef]
  9. Chang-Jian, C.W.; Cho, E.C.; Yen, S.C.; Ho, B.C.; Lee, K.C.; Huang, J.H.; Hsiao, Y.S. Facile Preparation of WO3/PEDOT:PSS Composite for Inkjet Printed Electrochromic Window and Its Performance for Heat Shielding. Dye. Pigment. 2018, 148, 465–473. [Google Scholar] [CrossRef]
  10. Parshina, L.S.; Novodvorsky, O.A. Low-Temperature Laser Synthesis of LiCoO2 and WO3 Films for Electrochromic Application. Russ. J. Inorg. Chem. 2021, 66, 1234–1238. [Google Scholar] [CrossRef]
  11. Shchegolkov, A.V.; Jang, S.-H.; Shchegolkov, A.V.; Rodionov, Y.V.; Sukhova, A.O.; Lipkin, M.S. A Brief Overview of Electrochromic Materials and Related Devices: A Nanostructured Materials Perspective. Nanomaterials 2021, 11, 2376. [Google Scholar] [CrossRef] [PubMed]
  12. Granqvist, C.G. Handbook of Inorganic Electrochromic Materials; Elsevier: Amsterdam, The Netherlands, 1995; p. 633. [Google Scholar]
  13. Bertus, L.M.; Enesca, A.; Duta, A. Influence of Spray Pyrolysis Deposition Parameters on the Optoelectronic Properties of WO3 Thin Films. Thin Solid Films 2012, 520, 4282–4290. [Google Scholar] [CrossRef]
  14. González-Borrero, P.P.; Sato, F.; Medina, A.N.; Baesso, M.L.; Bento, A.C.; Baldissera, G.; Persson, C.; Niklasson, G.A.; Granqvist, C.G.; Ferreira Da Silva, A. Optical Band-Gap Determination of Nanostructured WO3 Film. Appl. Phys. Lett. 2010, 96, 061909. [Google Scholar] [CrossRef]
  15. Jayatissa, A.H.; Cheng, S.T.; Gupta, T. Annealing Effect on the Formation of Nanocrystals in Thermally Evaporated Tungsten Oxide Thin Films. Mater. Sci. Eng. B 2004, 109, 269–275. [Google Scholar] [CrossRef]
  16. Porqueras, I.; Bertran, E. Optical Properties of Li+ Doped Electrochromic WO3 Thin Films. Thin Solid Films 2000, 377–378, 8–13. [Google Scholar] [CrossRef]
  17. Subrahmanyam, A.; Karuppasamy, A. Optical and Electrochromic Properties of Oxygen Sputtered Tungsten Oxide (WO3) Thin Films. Sol. Energy Mater. Sol. Cells 2007, 91, 266–274. [Google Scholar] [CrossRef]
  18. Washizu, E.; Yamamoto, A.; Abe, Y.; Kawamura, M.; Sasaki, K. Optical and Electrochromic Properties of RF Reactively Sputtered WO3 Films. Solid State Ion. 2003, 165, 175–180. [Google Scholar] [CrossRef]
  19. Gesheva, K.A.; Ivanova, T.M.; Bodurov, G.K. APCVD Transition Metal Oxides—Functional Layers in “Smart Windows”. J. Phys. Conf. Ser. 2014, 559, 012002. [Google Scholar] [CrossRef] [Green Version]
  20. Deepa, M.; Srivastava, A.K.; Saxena, T.K.; Agnihotry, S.A. Annealing Induced Microstructural Evolution of Electrodeposited Electrochromic Tungsten Oxide Films. Appl. Surf. Sci. 2005, 252, 1568–1580. [Google Scholar] [CrossRef]
  21. Livage, J.; Ganguli, D. Sol–Gel Electrochromic Coatings and Devices: A Review. Sol. Energy Mater. Sol. Cells 2001, 68, 365–381. [Google Scholar] [CrossRef]
  22. Bathe, S.R.; Patil, P.S. Electrochromic Characteristics of Fibrous Reticulated WO3 Thin Films Prepared by Pulsed Spray Pyrolysis Technique. Sol. Energy Mater. Sol. Cells 2007, 91, 1097–1101. [Google Scholar] [CrossRef]
  23. Spanu, D.; Recchia, S.; Schmuki, P.; Altomare, M. Thermal-Oxidative Growth of Substoichiometric WO3–x Nanowires at Mild Conditions. Phys. Status Solidi RRL 2020, 14, 20002352000235. [Google Scholar] [CrossRef]
  24. Gutpa, J.; Shaik, H.; Kumar, K.N.; Sattar, S.A. PVD techniques proffering avenues for fabrication of porous tungsten oxide (WO3) thin films: A review. Mater. Sci. Semicond. Processing 2022, 143, 106534. [Google Scholar] [CrossRef]
  25. Kondalkar, V.V.; Kharade, R.R.; Mali, S.S.; Mane, R.M.; Patil, P.B.; Patil, P.S.; Choudhury, S.; Bhosale, P.N. Nanobrick-like WO3 thin films: Hydrothermal synthesis and electrochromic application. Superlattices Microstruct. 2014, 73, 290–295. [Google Scholar] [CrossRef]
  26. Chatzikyriakou, D.; Maho, A.; Cloots, R.; Henrist, C. Ultrasonic Spray Pyrolysis as a Processing Route for Templated Electrochromic Tungsten Oxide Films. Microporous Mesoporous Mater. 2017, 240, 31–38. [Google Scholar] [CrossRef]
  27. Liao, C.C.; Chen, F.R.; Kai, J.J. Electrochromic Properties of Nanocomposite WO3 Films. Sol. Energy Mater. Sol. Cells 2007, 91, 1282–1288. [Google Scholar] [CrossRef]
  28. Regragui, M.; Addou, M.; Outzourhit, A.; El Idrissi, E.; Kachouane, A.; Bougrine, A. Electrochromic Effect in WO3 Thin Films Prepared by Spray Pyrolysis. Sol. Energy Mater. Sol. Cells 2003, 77, 341–350. [Google Scholar] [CrossRef]
  29. Bertus, L.M.; Faure, C.; Danine, A.; Labrugere, C.; Campet, G.; Rougier, A.; Duta, A. Synthesis and Characterization of WO3 Thin Films by Surfactant Assisted Spray Pyrolysis for Electrochromic Applications. Mater. Chem. Phys. 2013, 140, 49–59. [Google Scholar] [CrossRef]
  30. Sivakumar, R.; Raj, A.M.E.; Subramanian, B.; Jayachandran, M.; Trivedi, D.C.; Sanjeeviraja, C. Preparation and Characterization of Spray Deposited N-Type WO3 Thin Films for Electrochromic Devices. Mater. Res. Bull. 2004, 39, 1479–1489. [Google Scholar] [CrossRef]
  31. Buch, V.R.; Chawla, A.K.; Rawal, S.K. Review on Electrochromic Property for WO3 Thin Films Using Different Deposition Techniques. Mater. Today Proc. 2016, 3, 1429–1437. [Google Scholar] [CrossRef]
  32. Mouratis, K.; Tudose, V.; Romanitan, C.; Pachiu, C.; Tutunaru, O.; Suchea, M.; Couris, S.; Vernardou, D.; Emmanouel, K. Electrochromic Performance of V2O5 Thin Films Grown by Spray Pyrolysis. Materials 2020, 13, 3859. [Google Scholar] [CrossRef] [PubMed]
Figure 1. Electrochemical characterization of the 1st cycle of the WO3 films. (a) Cyclic voltammograms of WO3 films with 0.1 M at a scanning speed of 10 mV sec−1; (b) cyclic voltammograms of WO3 films with 0.05 M at a scanning speed of 10 mV sec−1; (c) chronoamperometry of WO3 films with 0.1 M at a step potential of +1 V (bleaching); (d) chronoamperometry of WO3 films with 0.05 M at a step potential of +1 V (bleaching); (e) chronoamperometry of WO3 films with 0.1 M at a step potential of −1 V (coloring); (f) chronoamperometry of WO3 films with 0.05 M at a step potential of −1 V (coloring).
Coatings 12 00545 g001
Figure 2. Color shades of the initial, bleached and colored state of the WO3 coatings with an active area of 2 cm × 1.5 cm: (a) 5 mL with 0.1 M; (b) 10 mL with 0.1 M; (c) 15 mL with 0.1 M; (d) 5 mL with 0.05 M; (e) 10 mL with 0.05 M; (f) 15 mL with 0.05 M.
Coatings 12 00545 g002
Figure 3. UV-Vis transmittance comparison of the initial, bleached and colored state of the 1st cycle of WO3 coatings: (a) 5 mL with 0.1 M; (b) 10 mL with 0.1 M; (c) 15 mL with 0.1 M; (d) 5 mL with 0.05 M; (e) 10 mL with 0.05 M; (f) 15 mL with 0.05 M.
Coatings 12 00545 g003
Figure 4. Coloration efficiency comparison as a function of the measured wavelengths: (a) 5, 10 and 15 mL with 0.1 M; (b) 5, 10 and 15 mL with 0.05 M.
Coatings 12 00545 g004
Figure 5. Multiple cyclic voltammetry experiments (scans) of WO3 film with 0.1 M (5 mL) at a scanning speed of 10 mV sec−1 (stability experiment).
Coatings 12 00545 g005
Figure 6. Surface morphology of WO3 thin films studied in this work–FE-SEM images of WO3 coatings grown from precursors: (a) 5 mL with 0.1 M; (b) 10 mL with 0.1 M; (c) 15 mL with 0.1 M; (d) 5 mL with 0.05 M; (e) 10 mL with 0.05 M; (f) 15 mL with 0.05 M.
Coatings 12 00545 g006
Figure 7. Typical XRD patterns for the WO3 thin films studied in this work.
Coatings 12 00545 g007
Figure 8. Typical Raman spectra of WO3 thin films studied in this work.
Coatings 12 00545 g008
Table 1. Electrochemical properties of WO3 films.
ConcentrationPrecursor
Volume (mL)
Ip,a
(μA cm−2)
Ip,c
(μA cm−2)
Qd
(mC cm−2)
Qi
(mC cm−2)
tb
(sec)
tc
(sec)
0.1 M577.82−193.4514.04−15.234.229.22
1084.68−189.1016.65−18.473.756.84
15115.43−249.3723.26−25.765.209.77
0.05 M5112.99−294.7021.45−23.144.6611.58
10102.61−227.5620.04−22.295.258.40
1569.89−167.6114.03−16.844.268.05
Table 2. Optical and electrochromic properties of the WO3 films at λ = 700 nm.
ConcentrationPrecursor
Volume (mL)
Tb(λ)
(%)
Tc(λ)
(%)
ΔΤ(λ)
(%)
ΔOD
(λ)
CE(λ)
(cm2 C−1)
0.1 M540.6522.7417.900.58038.11
1026.7718.048.730.39421.37
1510.357.123.220.37314.48
0.05 M528.3914.1914.200.69329.95
1025.4217.777.650.35816.06
1510.788.312.470.26015.49
Publisher’s Note: MDPI stays neutral with regard to jurisdictional claims in published maps and institutional affiliations.

