
Synthesis and Characterization of Epoxy-Rich TMOs Deposited on Stainless Steel for Corrosion Applications

 and
and 
Abstract
:1. Introduction
2. Materials and Methods
2.1. Synthesis of the Trimetallic Oxide Compounds
2.2. Characterization
3. Results and Discussion
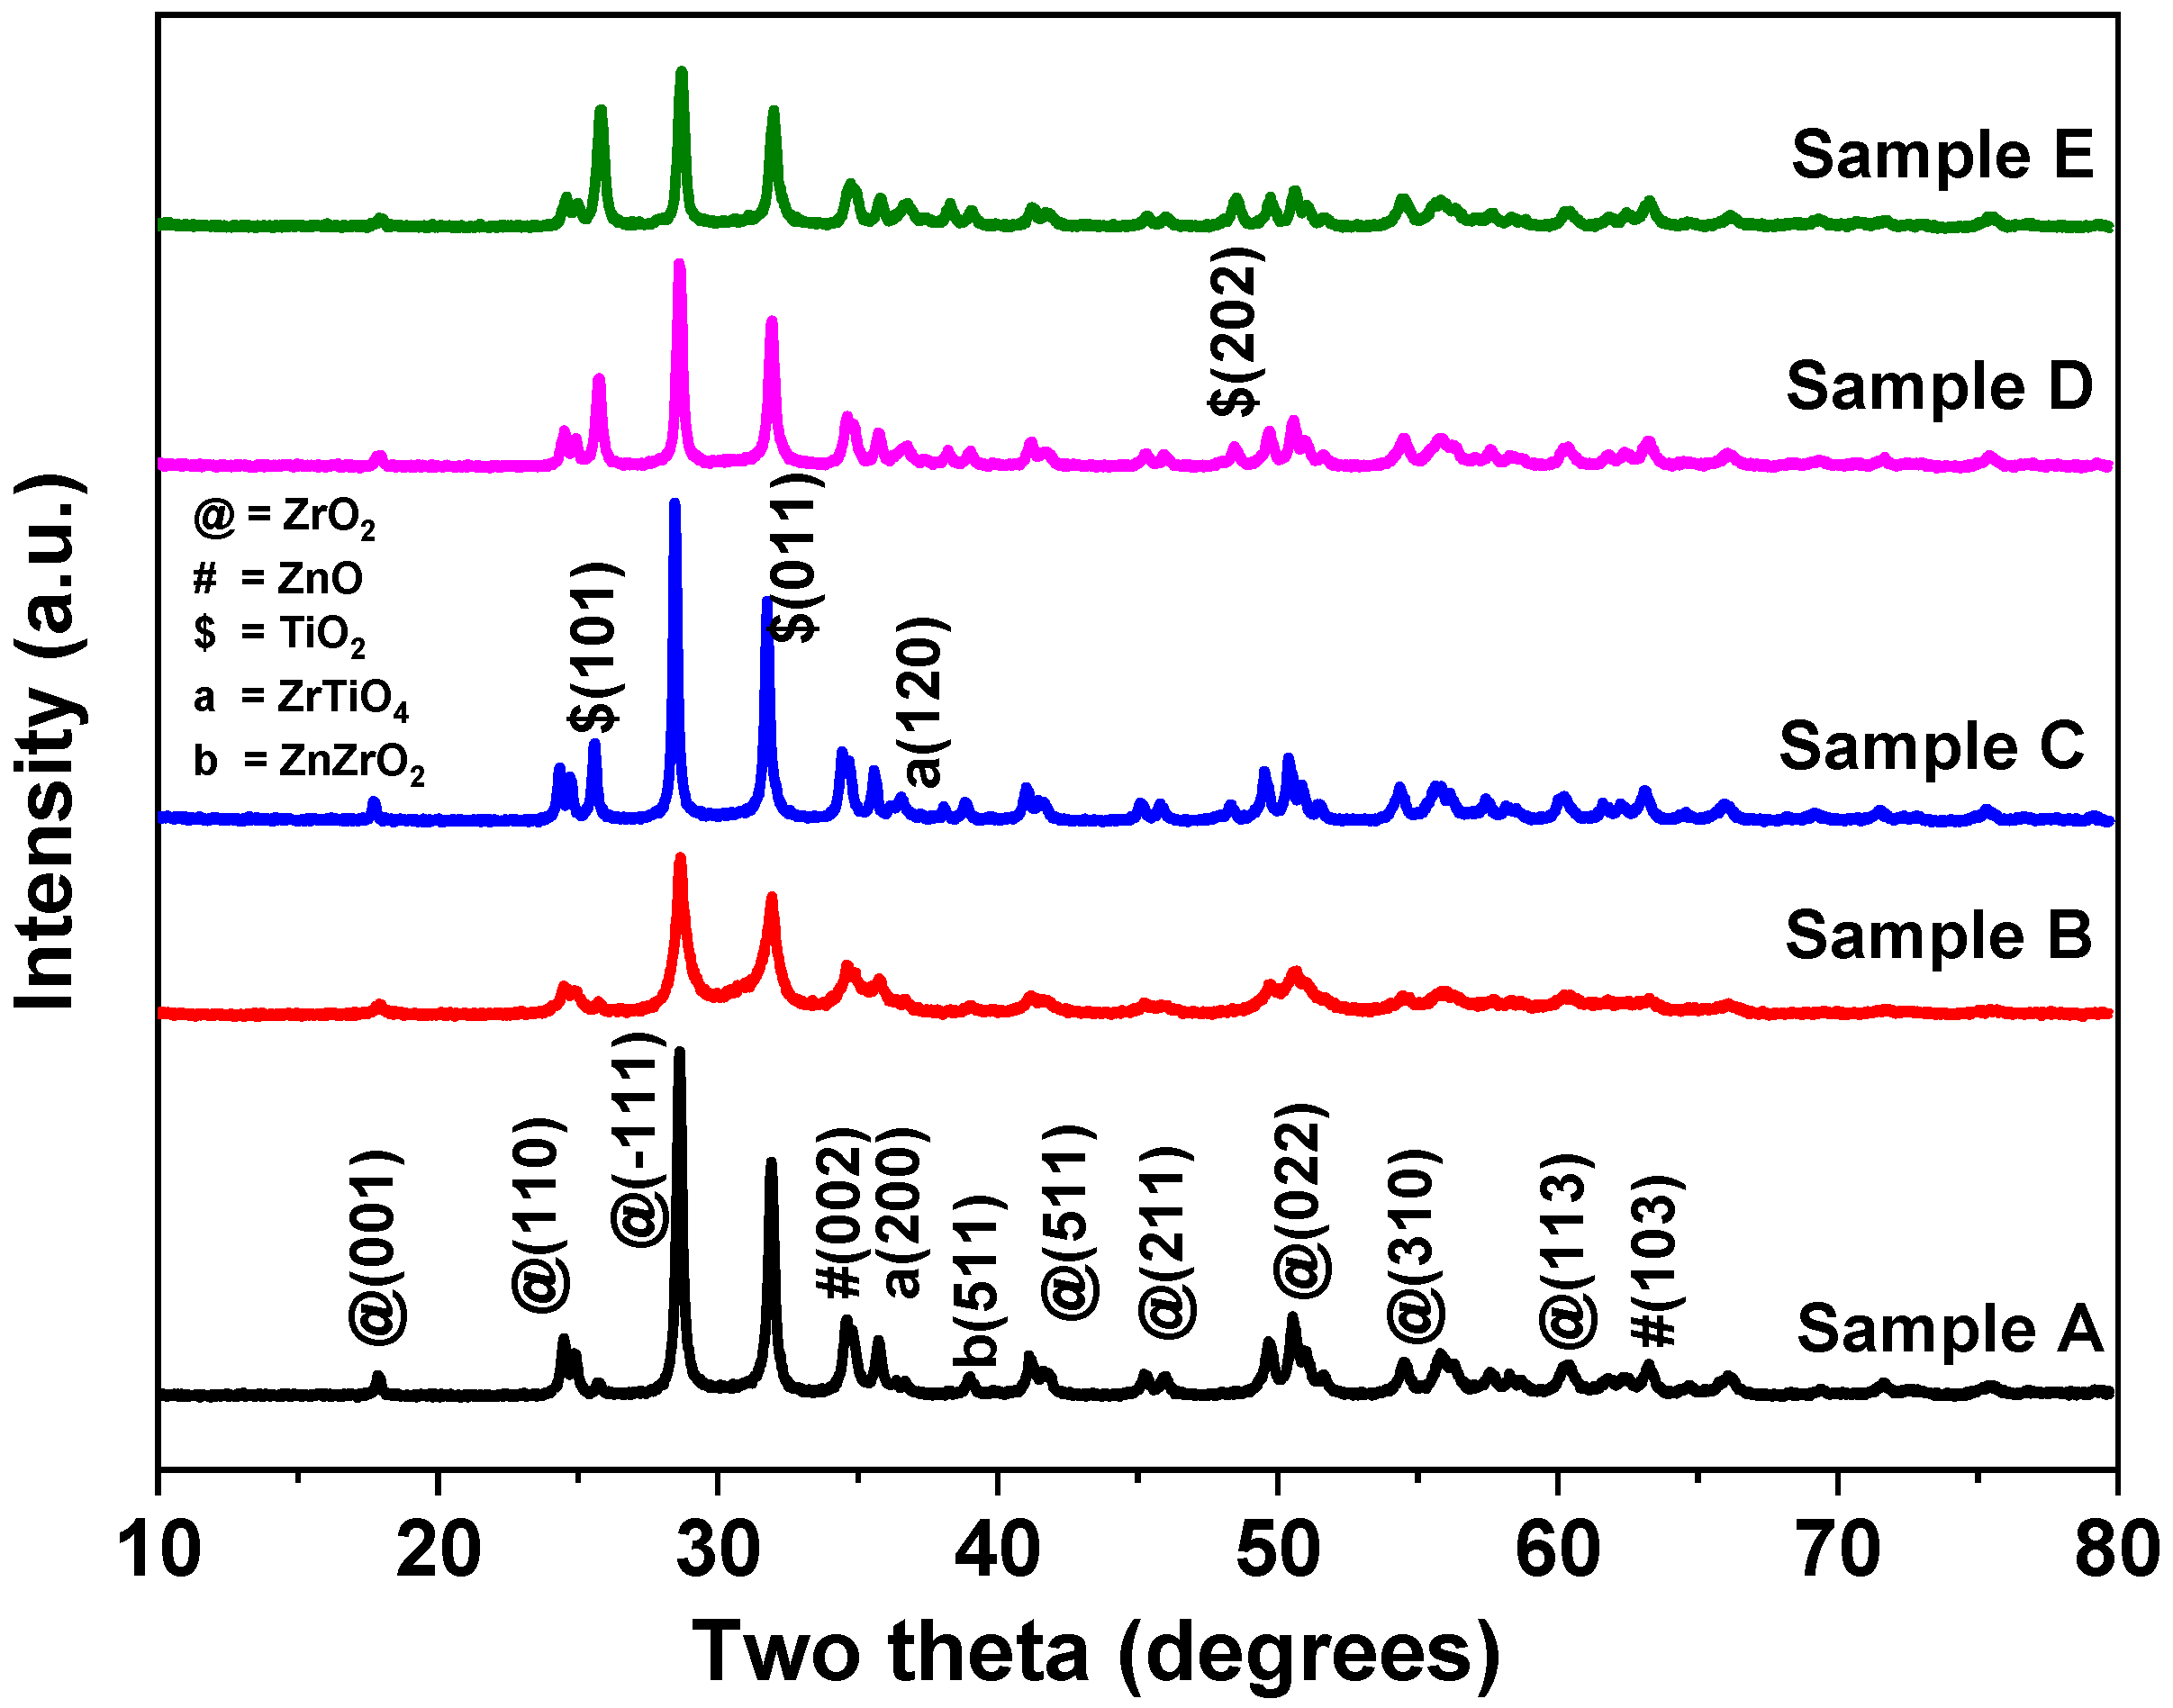
3.1. XRD
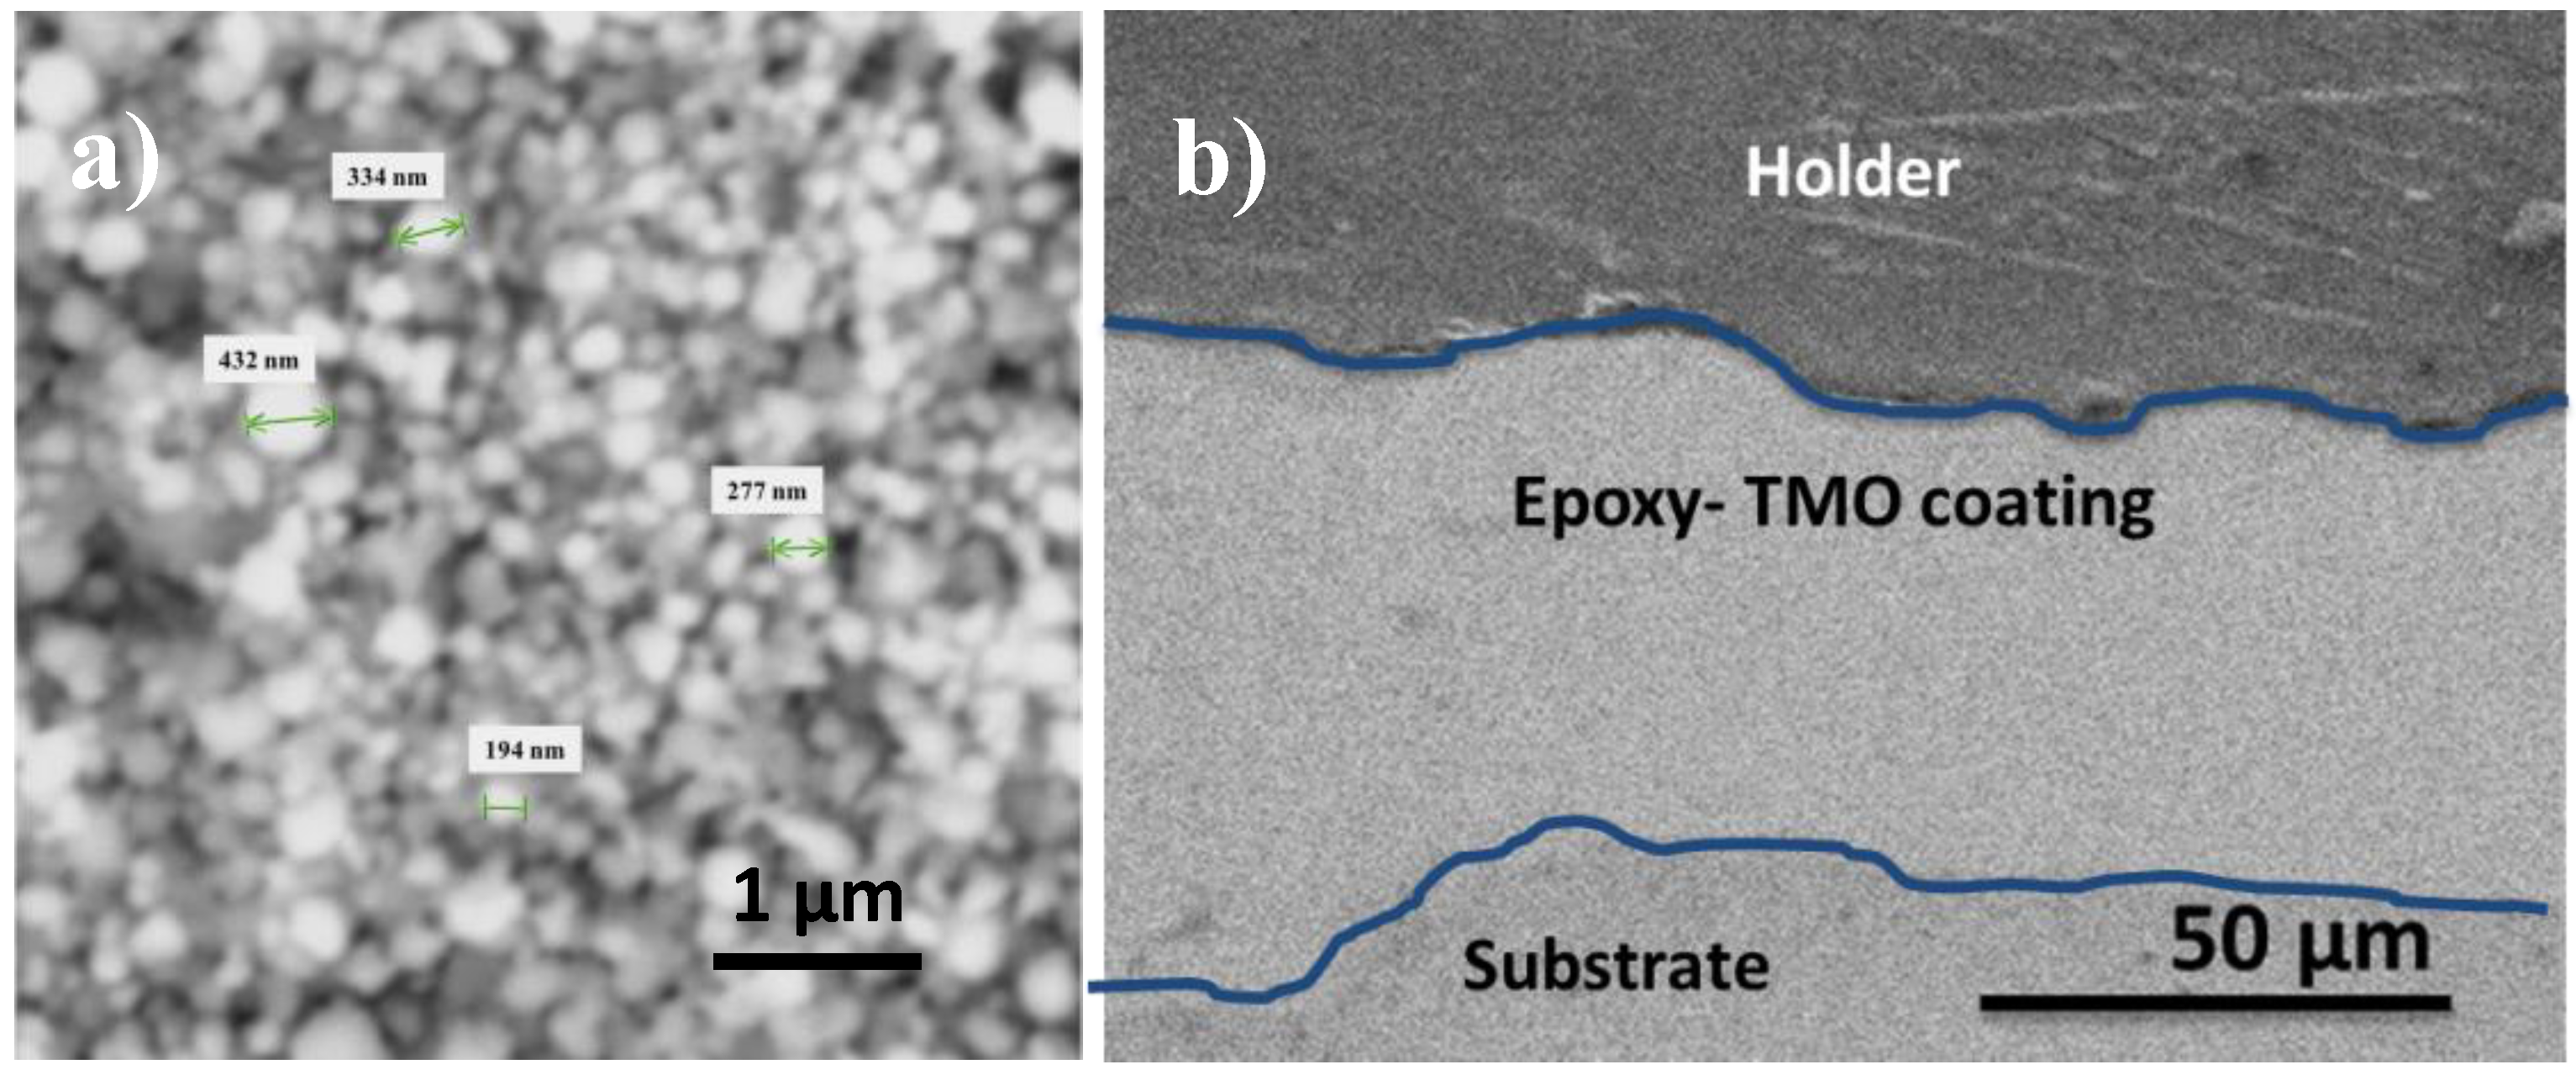
3.2. Morphological Characterization
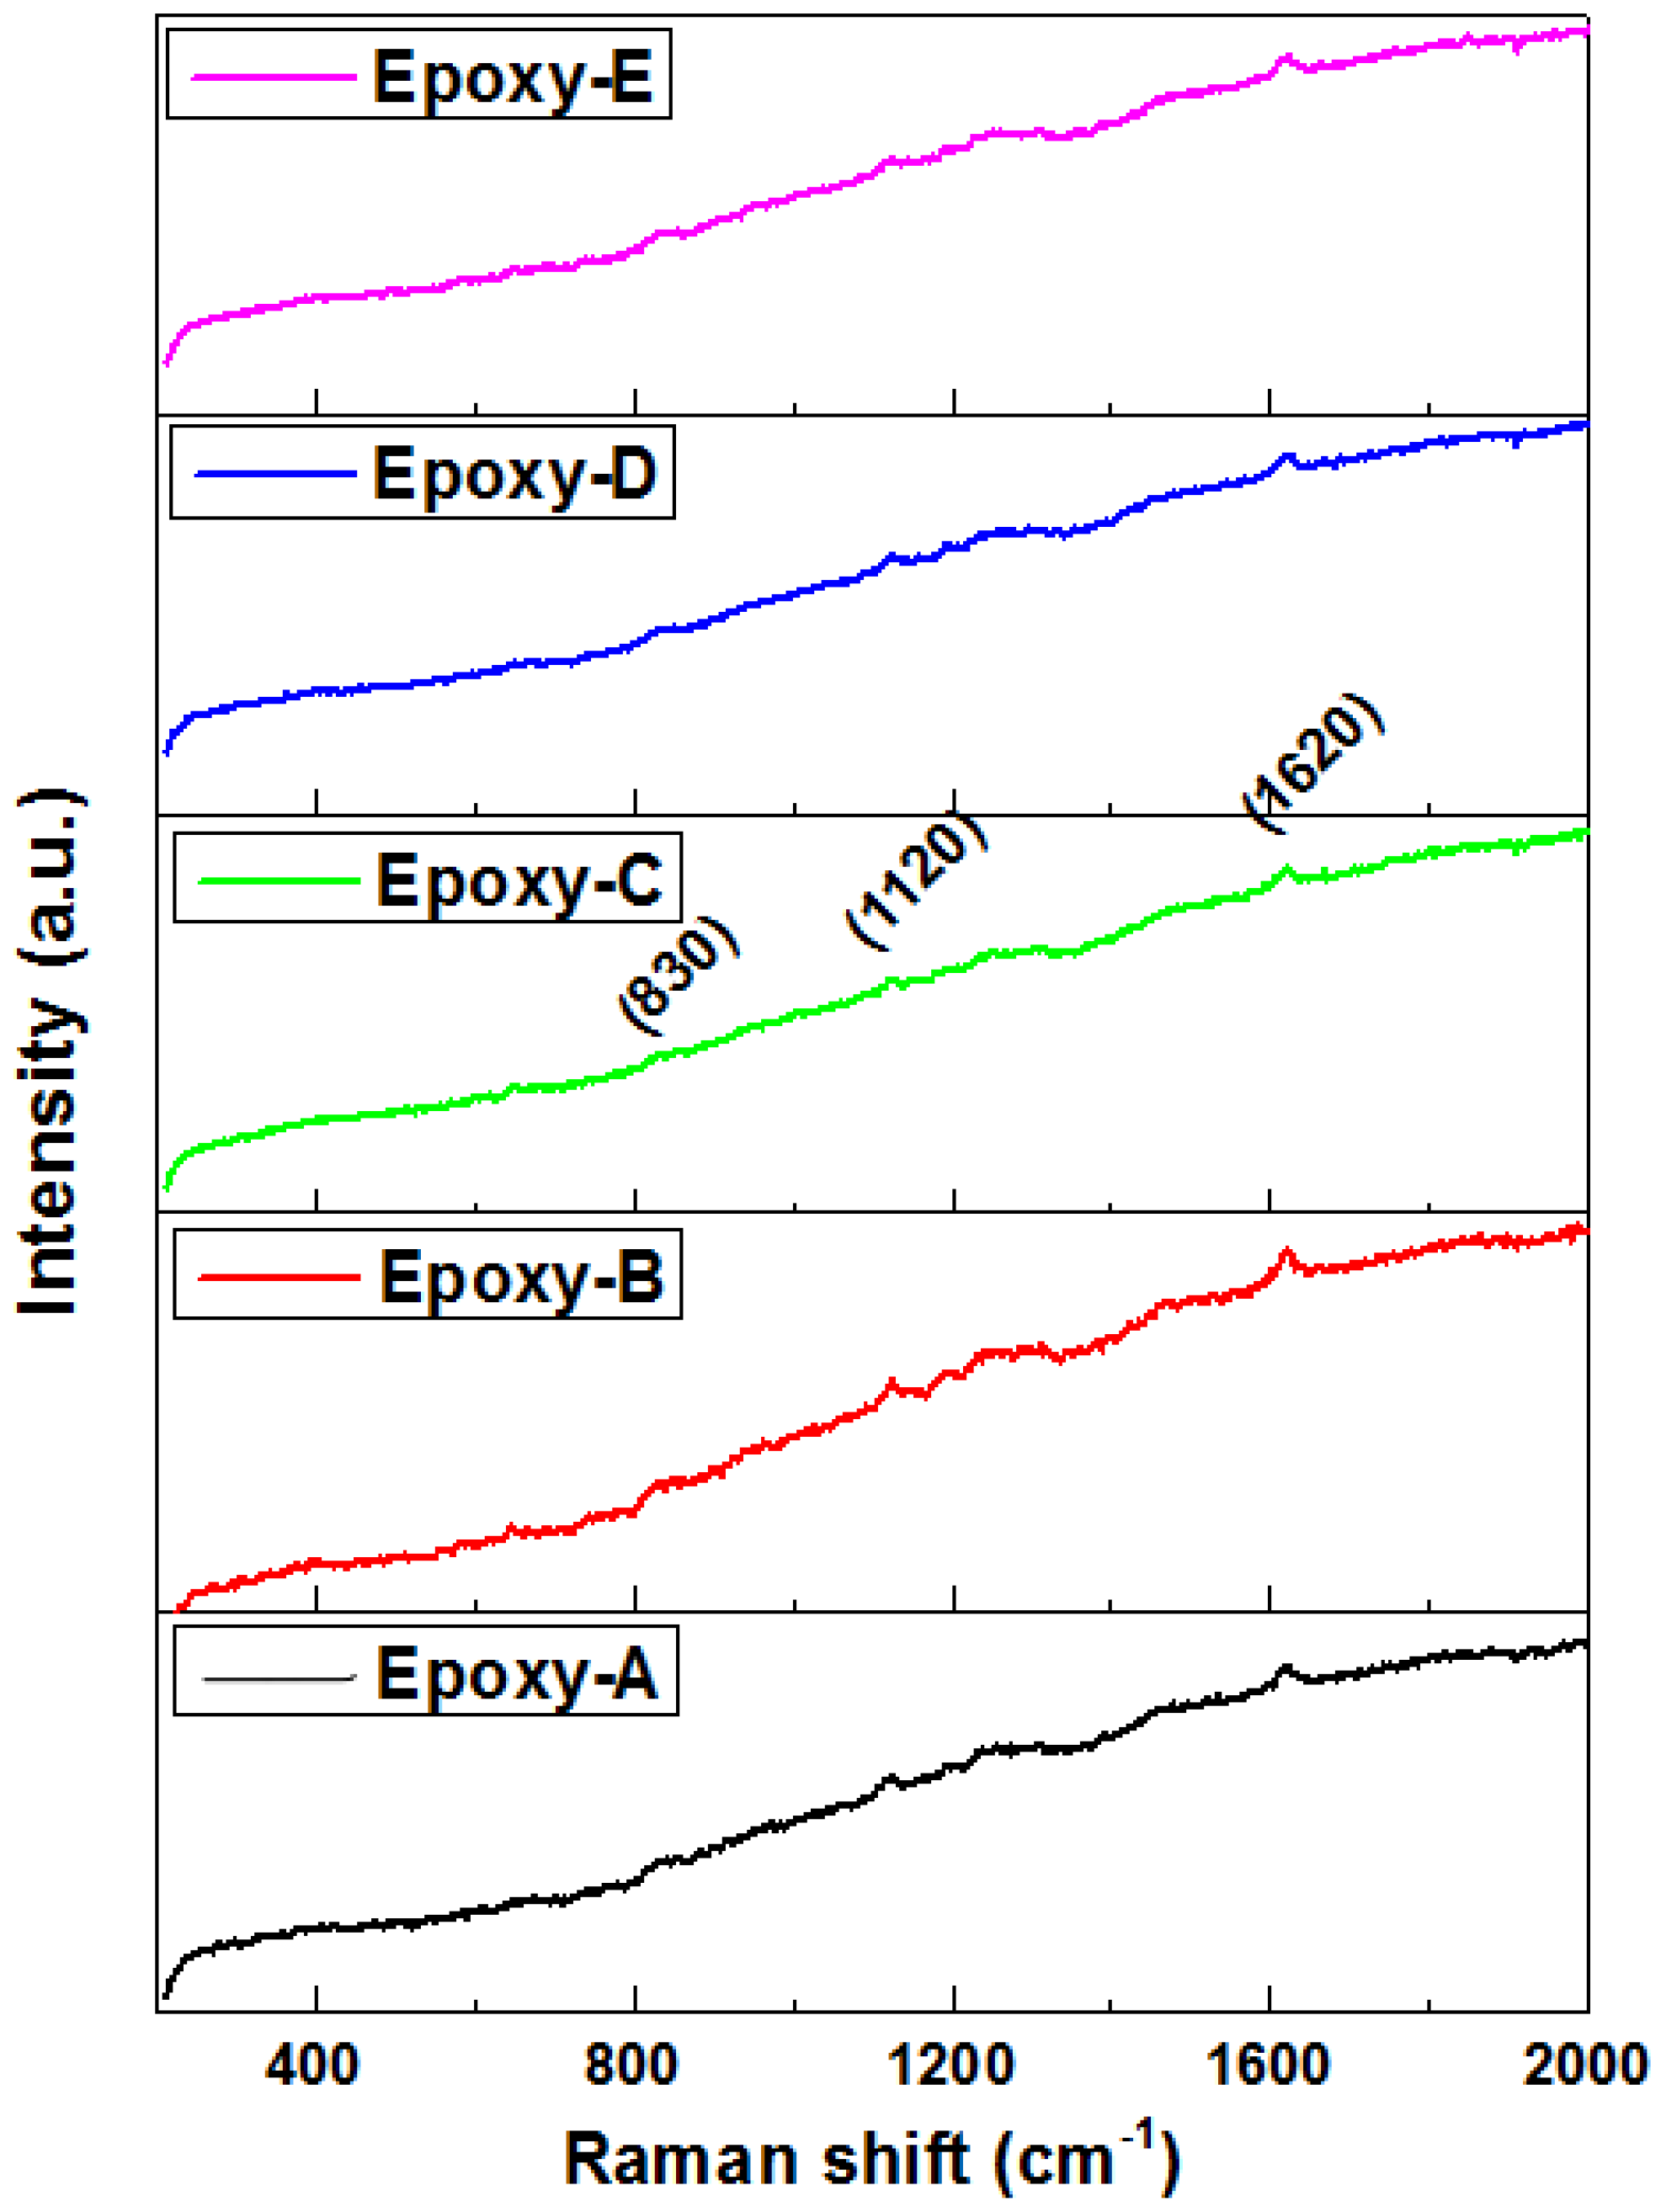
3.3. Raman Analysis
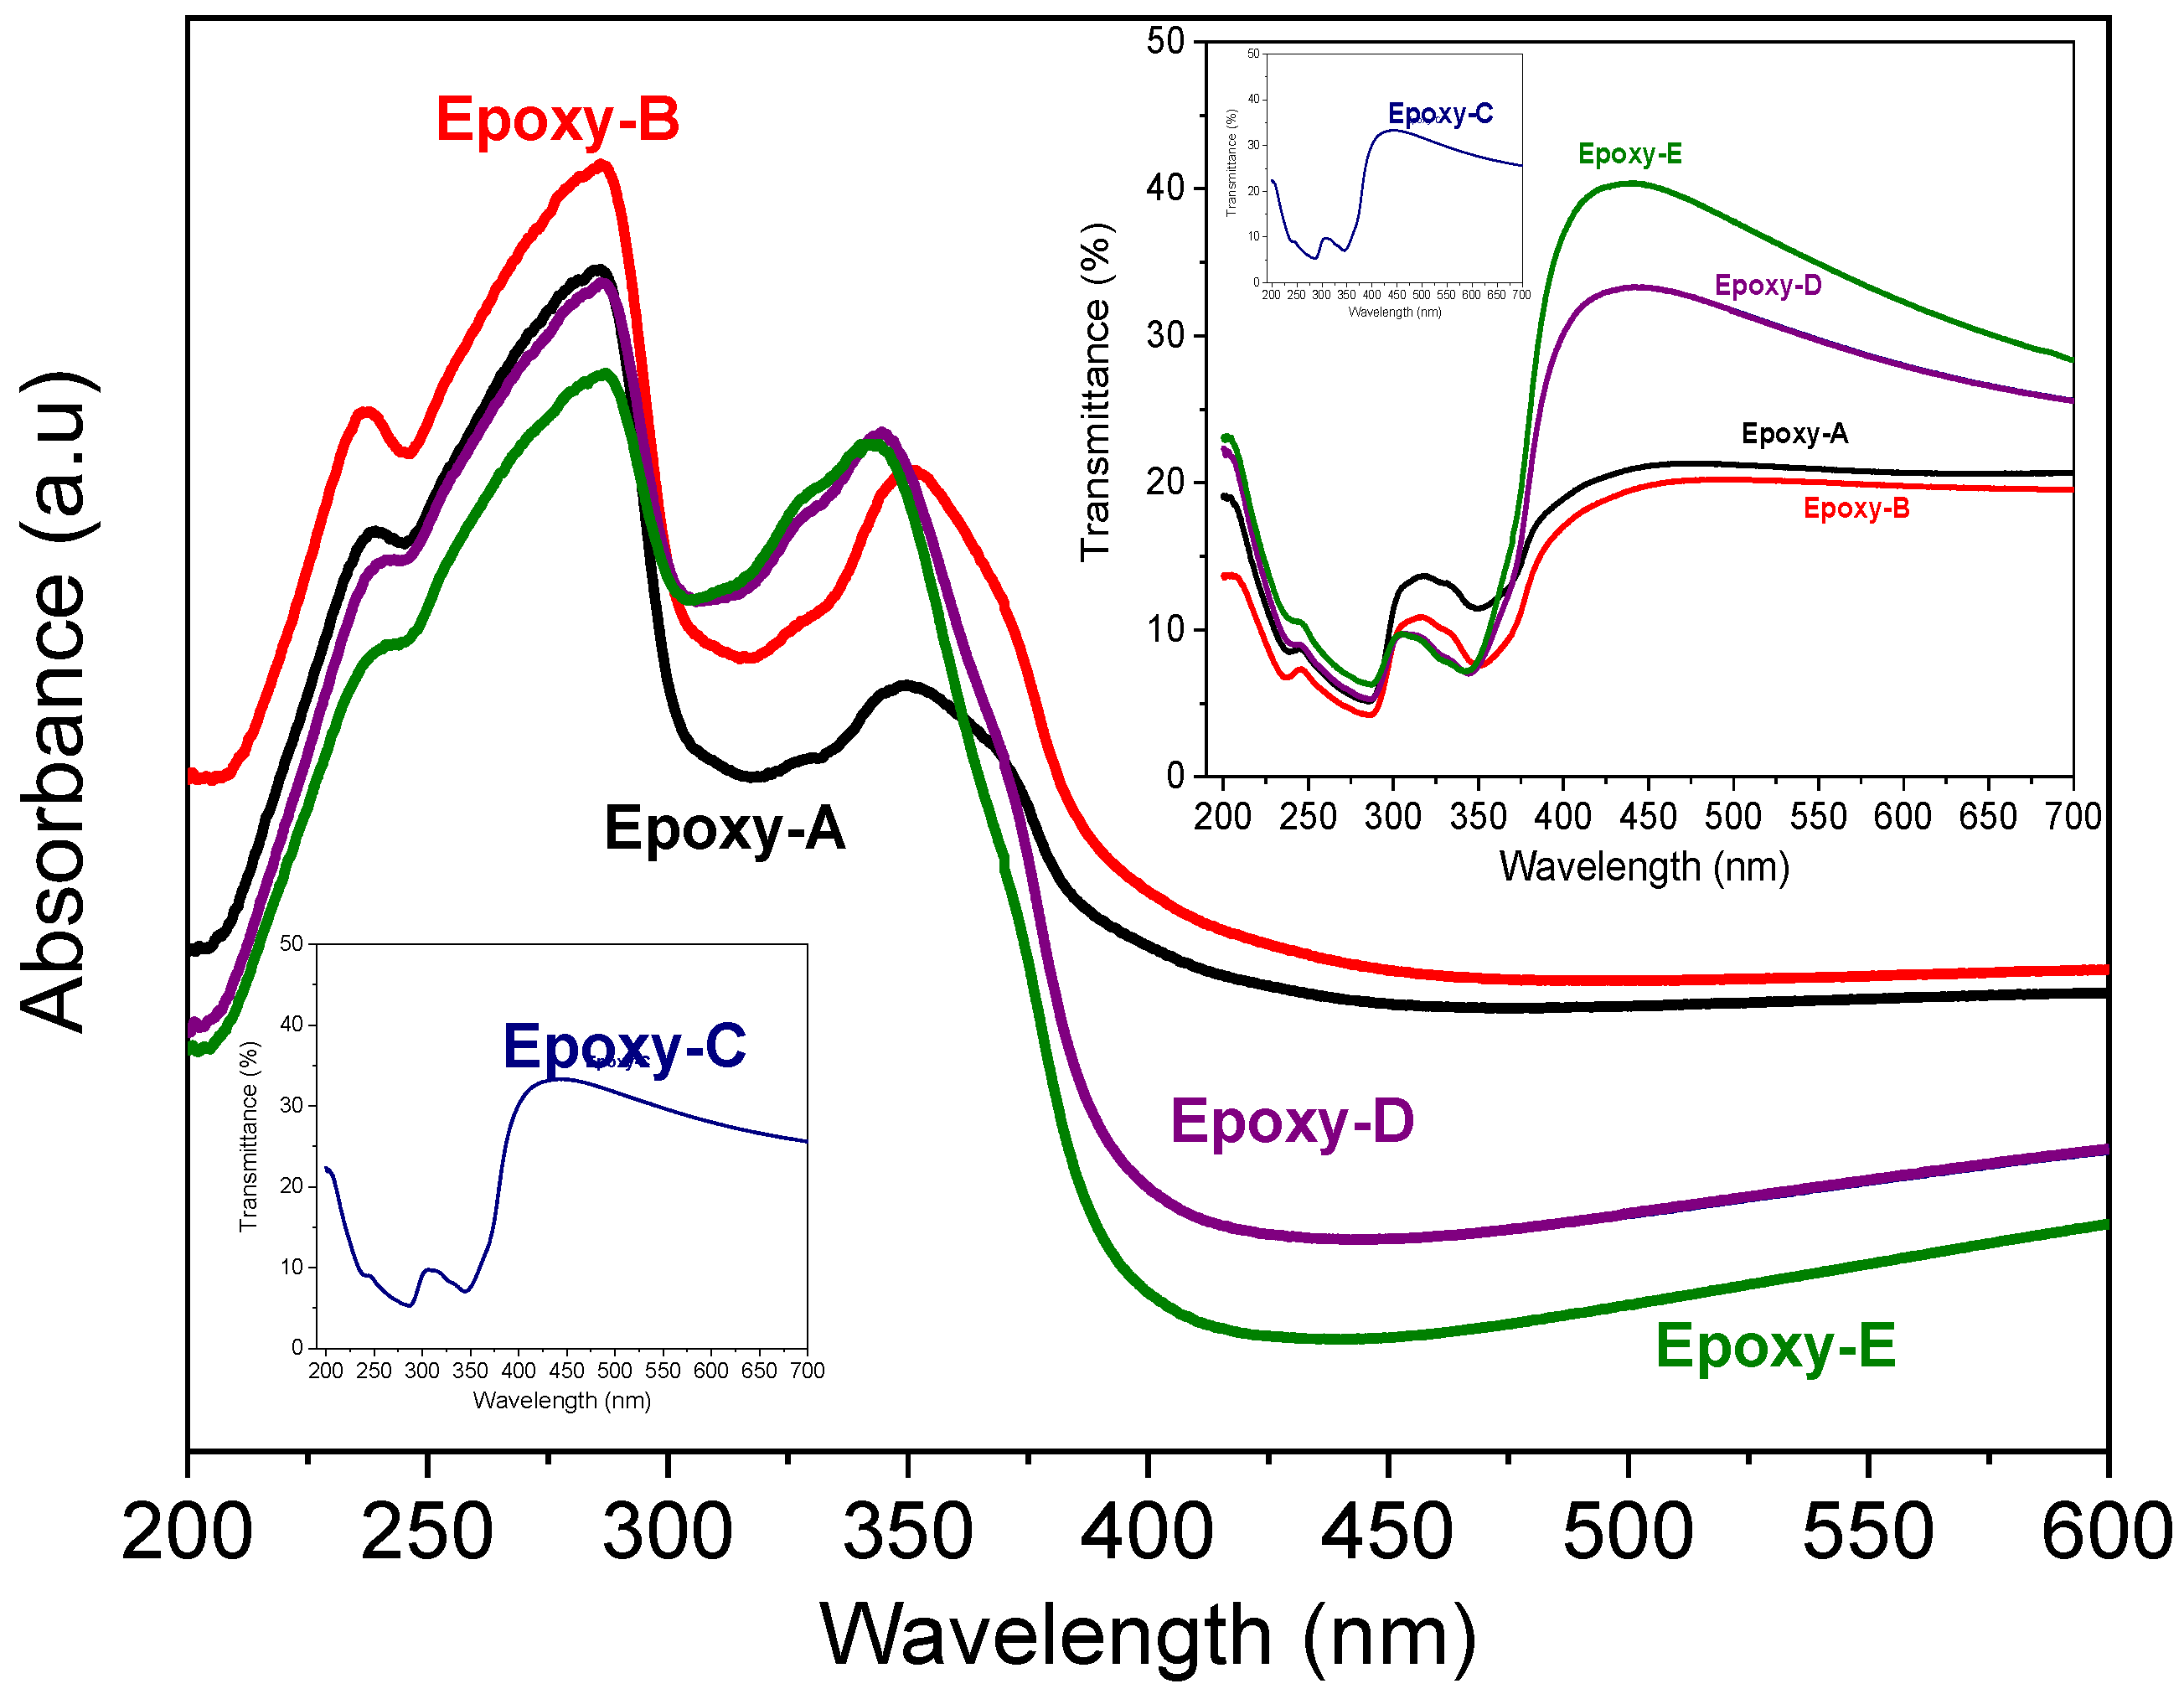
3.4. Optical Analysis of Epoxy-Rich Coatings
3.5. Contact Angle Measurement
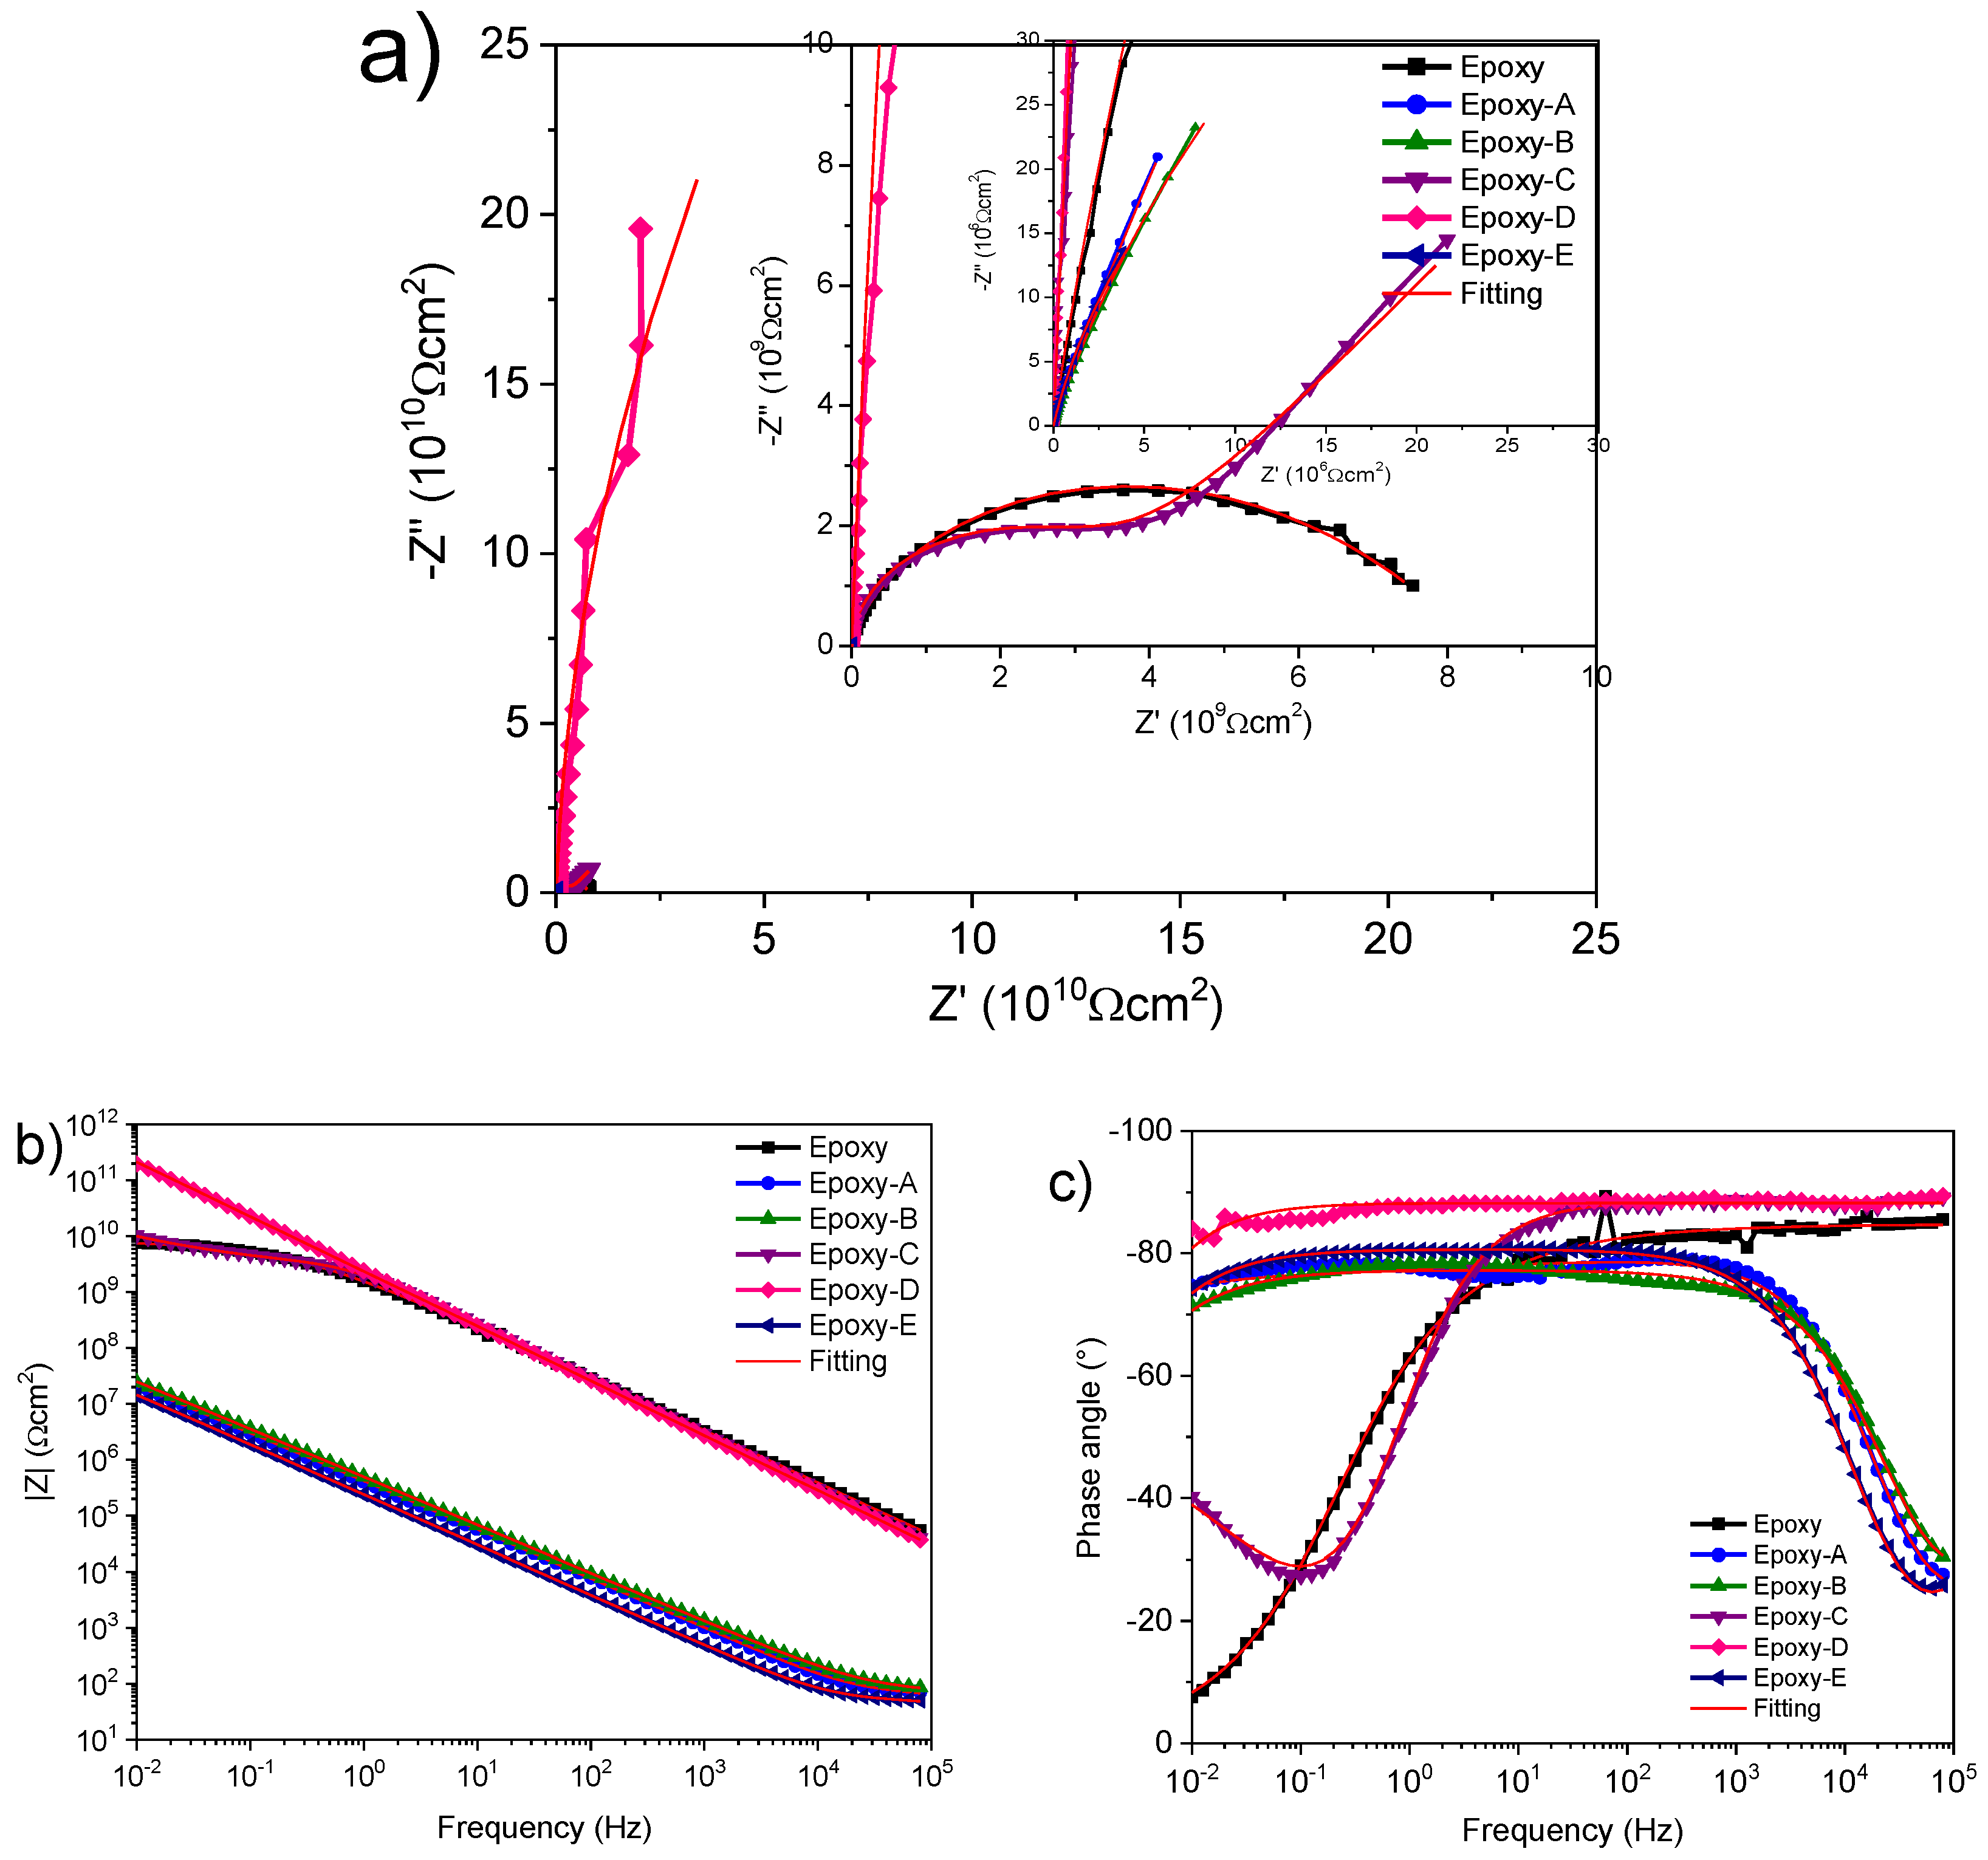
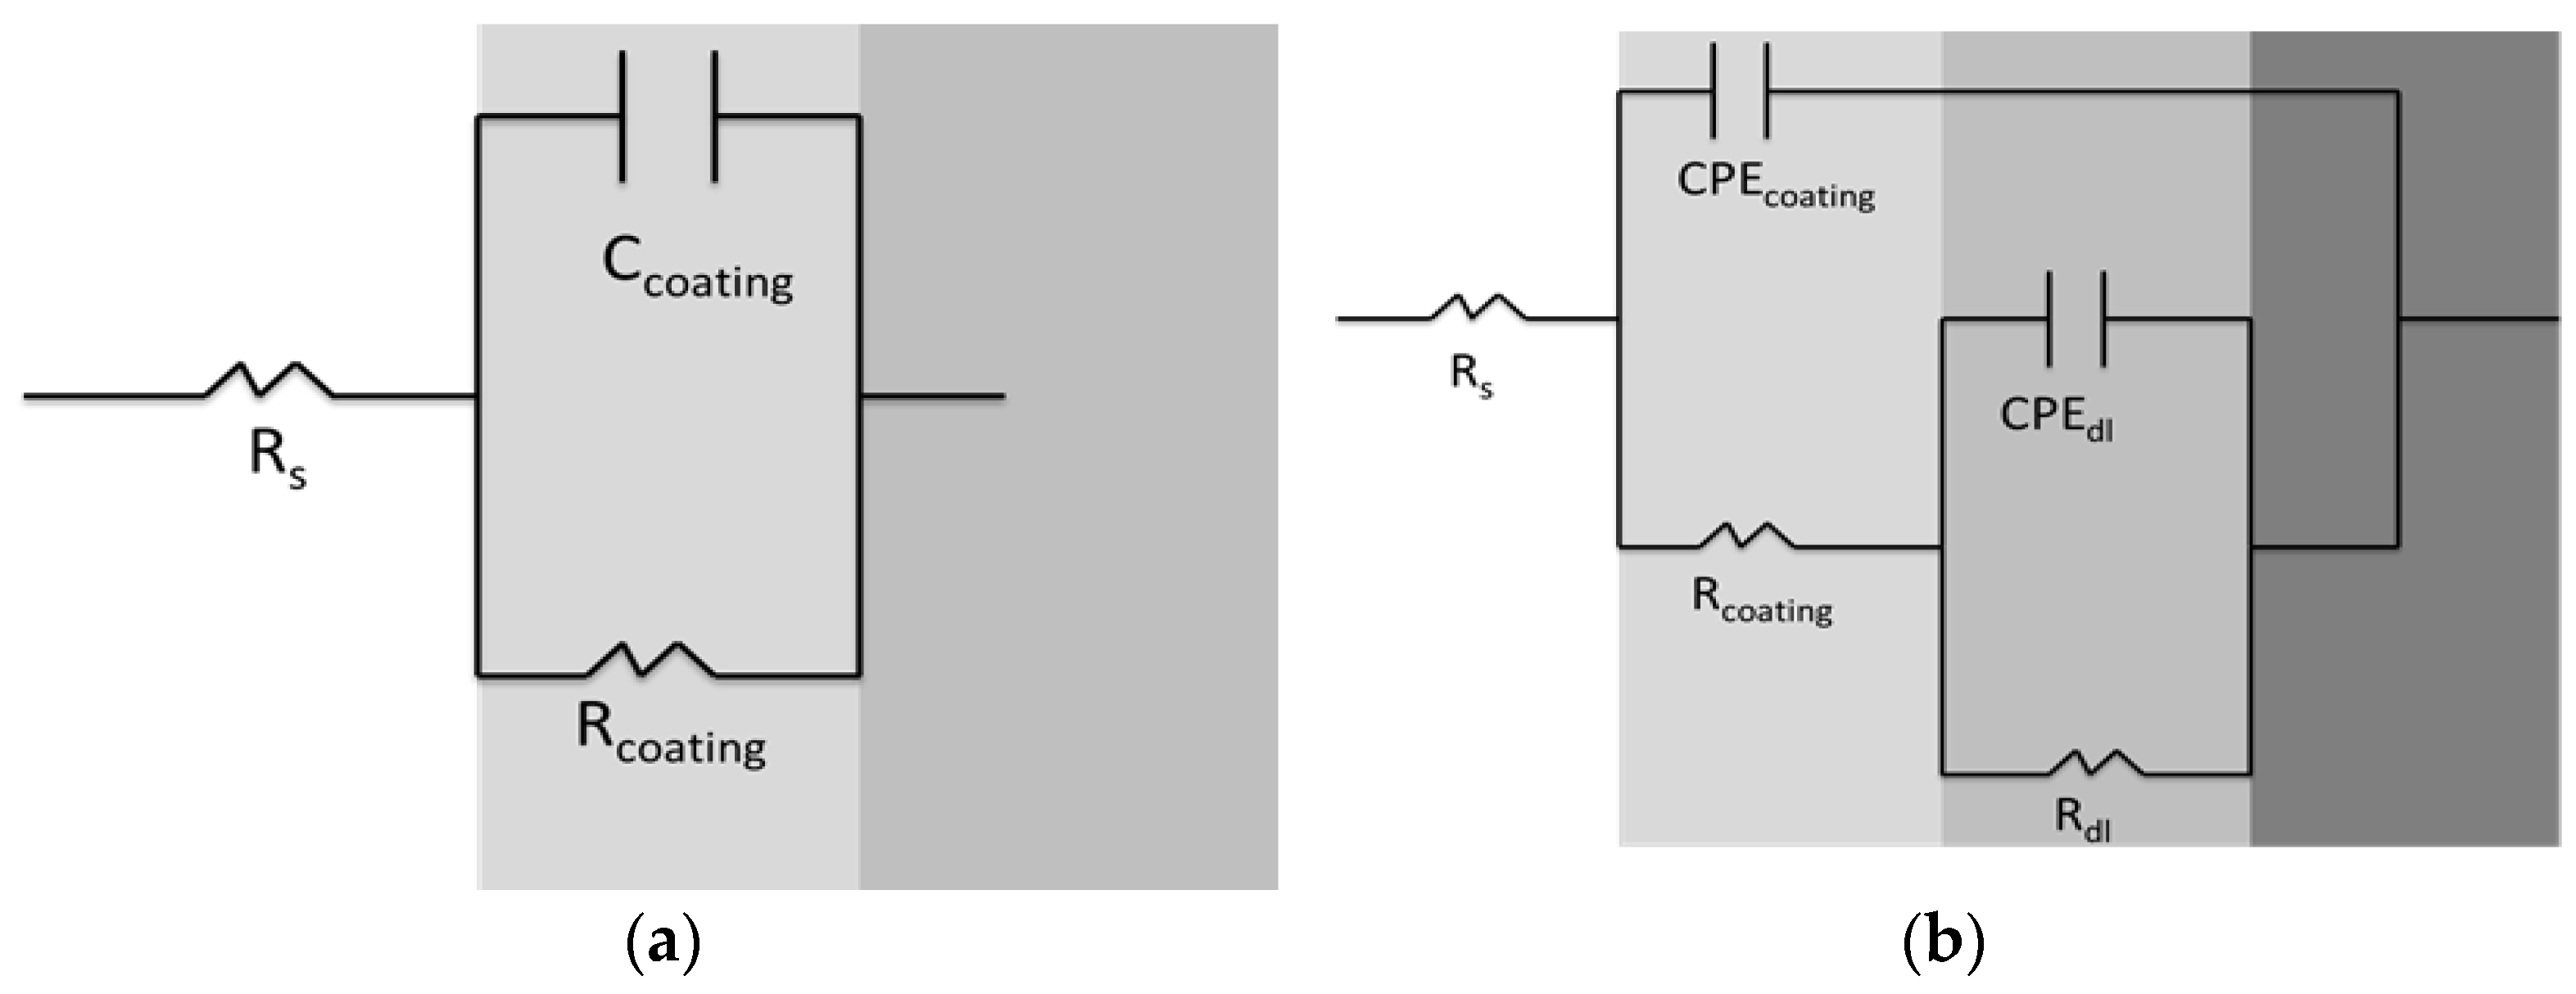
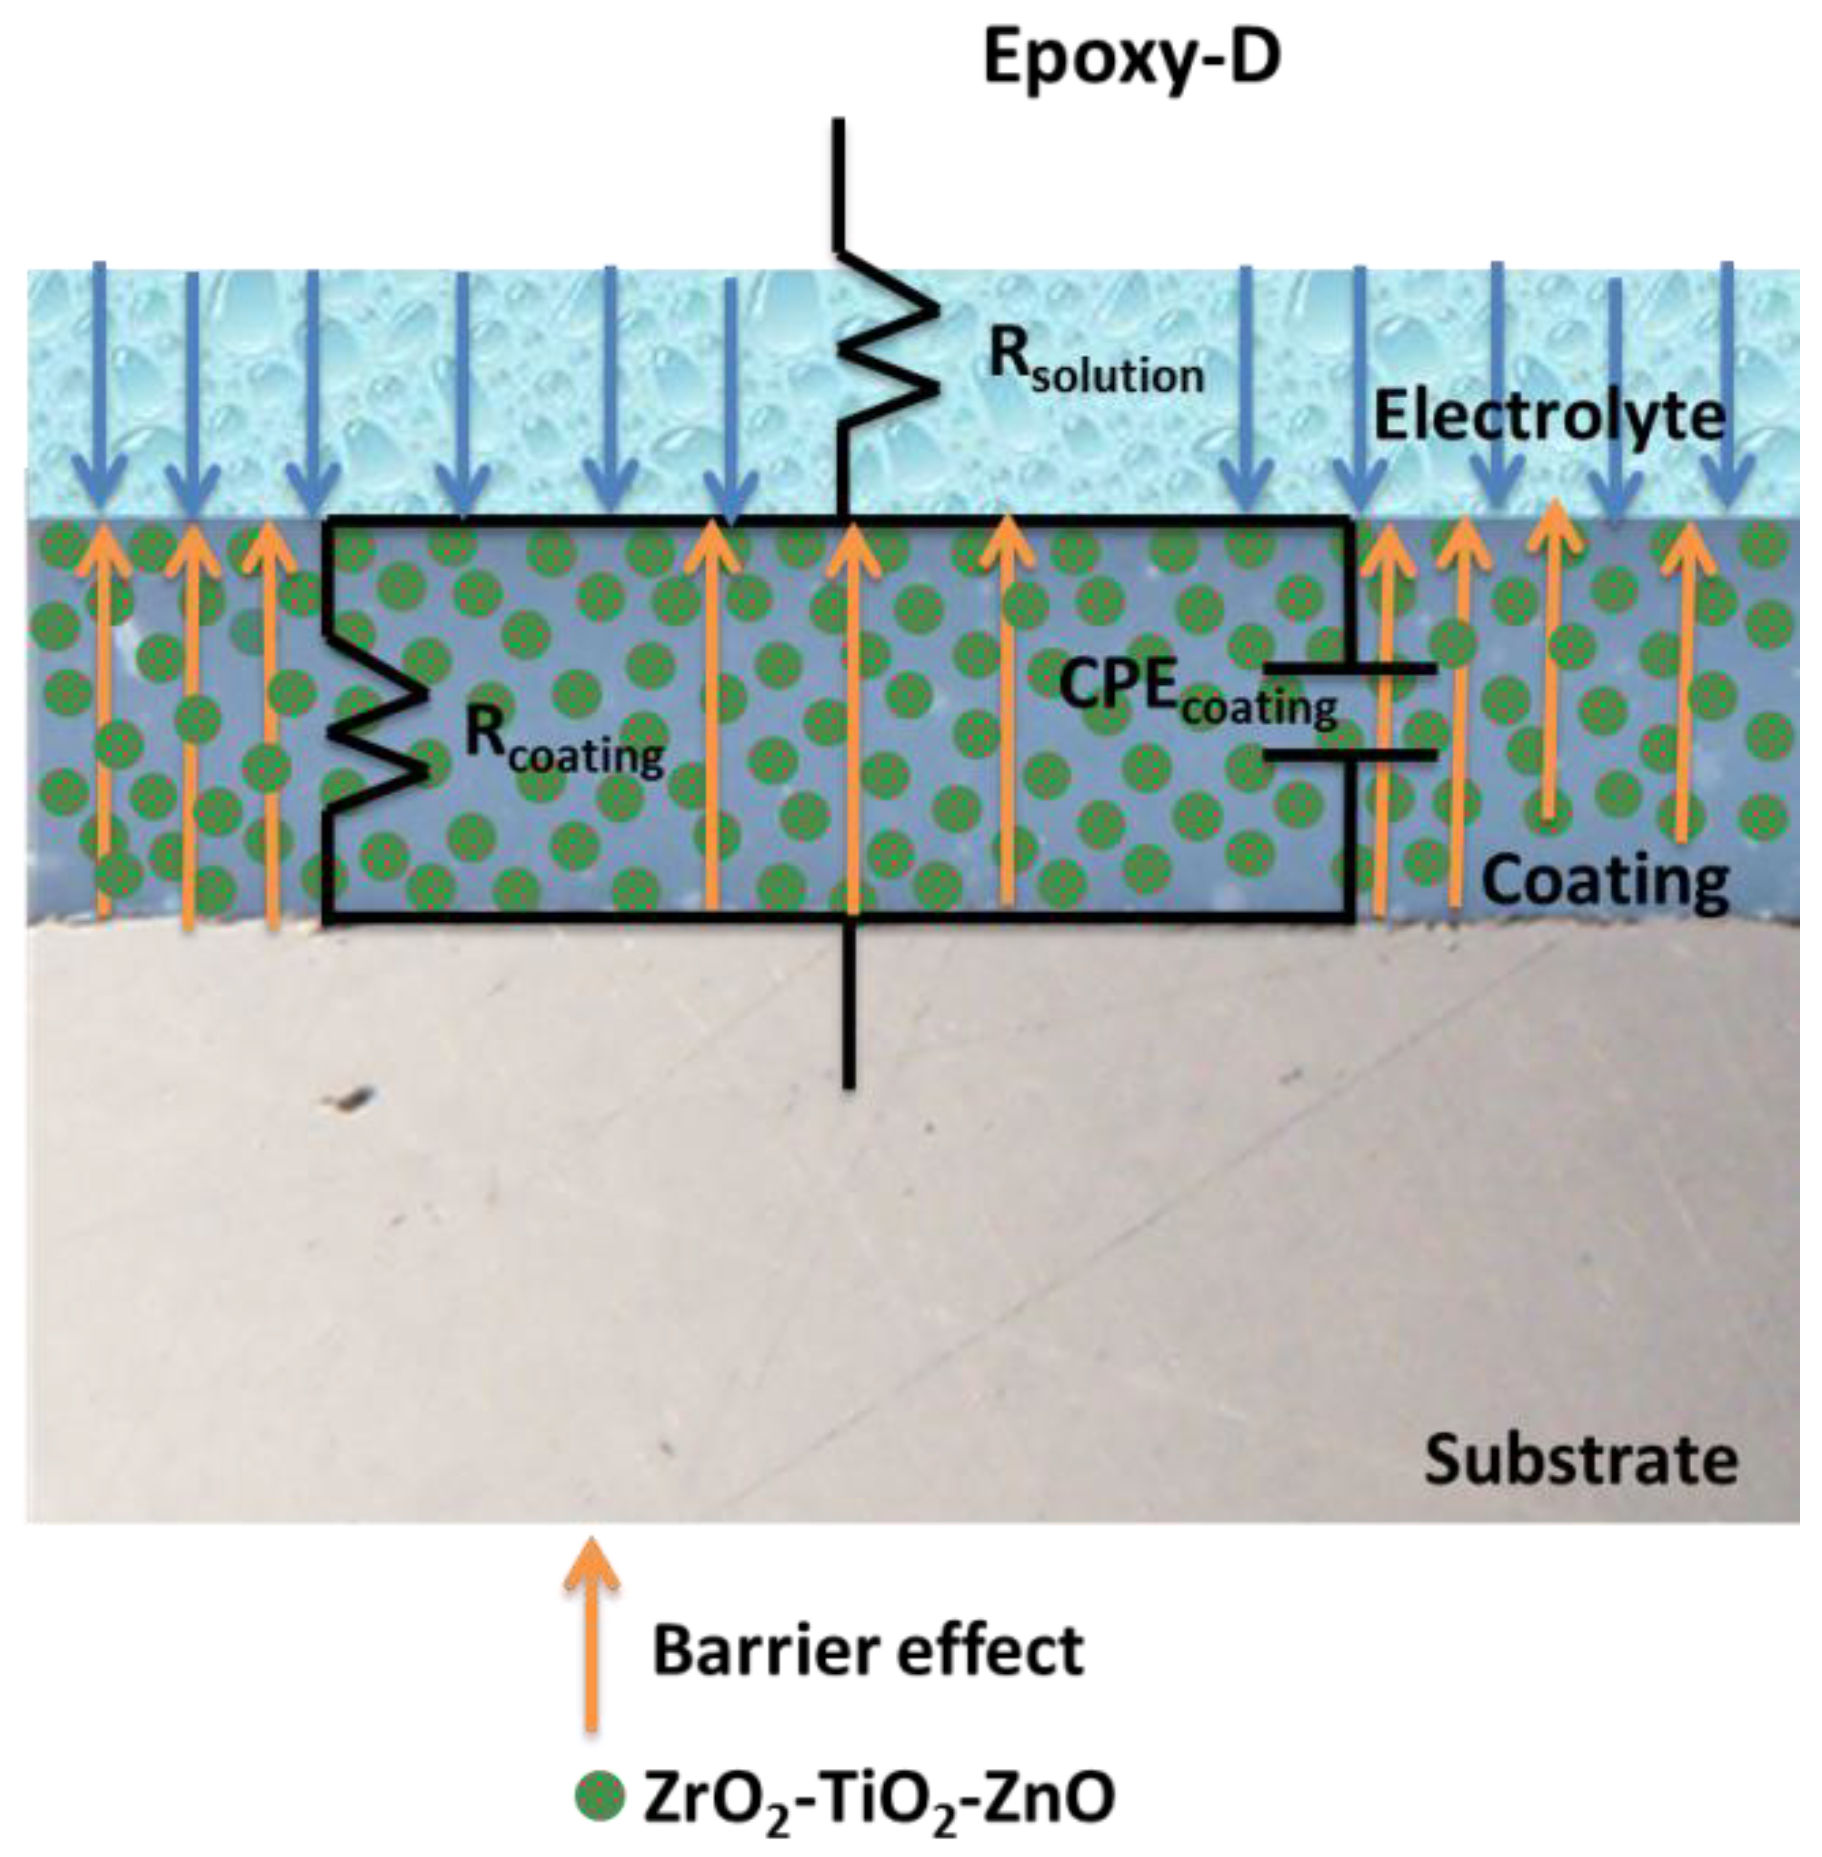
3.6. Electrochemical Characterization
4. Conclusions
Author Contributions
Funding
Institutional Review Board Statement
Informed Consent Statement
Data Availability Statement
Acknowledgments
Conflicts of Interest
References
- Cai, Y.; Quan, X.; Li, G.; Gao, N. Anticorrosion and Scale Behaviors of Nanostructured ZrO2–TiO2 Coatings in Simulated Geothermal Water. Ind. Eng. Chem. Res. 2016, 55, 11480–11494. [Google Scholar] [CrossRef]
- Lyon, S.B.; Bingham, R.; Mills, D.J. Advances in corrosion protection by organic coatings: What we know and what we would like to know. Prog. Org. Coat. 2017, 108, 2–7. [Google Scholar] [CrossRef] [Green Version]
- Ibrahim, M.; Kannan, K.; Parangusan, H.; Eldeib, S.; Shehata, O.; Ismail, M.; Zarandah, R.; Sadasivuni, K.K. Enhanced Corrosion Protection of Epoxy/ZnO-NiO Nanocomposite Coatings on Steel. Coatings 2020, 10, 783. [Google Scholar] [CrossRef]
- Ma, X.; Peng, C.; Zhou, D.; Wu, Z.; Li, S.; Wang, J.; Sun, N. Synthesis and mechanical properties of the epoxy resin composites filled with sol-gel derived ZrO2 nanoparticles. J. Sol-Gel Sci. Technol. 2018, 88, 442–453. [Google Scholar] [CrossRef]
- Dastgheib, A.; Zarebidaki, A.; Attar, M.M. Enhanced barrier properties of epoxy coating containing CaCO3 microparticles modified with cerium nitrate. Prog. Org. Coat. 2020, 144, 105660. [Google Scholar] [CrossRef]
- González-García, Y.; González, S.; Souto, R.M. Electrochemical and structural properties of a polyurethane coating on steel substrates for corrosion protection. Corros. Sci. 2007, 49, 3514–3526. [Google Scholar] [CrossRef]
- Pirhady Tavandashti, N.; Molana Almas, S.; Esmaeilzadeh, E. Corrosion protection performance of epoxy coating containing alumina/PANI nanoparticles doped with cerium nitrate inhibitor on Al-2024 substrates Prog. Org. Coat. 2021, 152, 106133. [Google Scholar] [CrossRef]
- Szuch, M. Breadht of dispensing technologies offers a wide variety of conformal coating processing capabilities. Mater. Sci. IMAPS SoCal 2004, 1–13. Available online: https://www.researchgate.net/publication/237269296_Breadth_of_Dispensing_Technologies_Offers_a_Wide_Variety_of_Conformal_Coating_Processing_Capabilities (accessed on 7 February 2022).
- Aslam, J.; Mobin, M.; Aslam, R.; Ansar, F. Corrosion protection of low carbon steel by conducting terpolymer nanocomposite coating in 3.5 wt% NaCl solution. J. Adhes. Sci. Technol. 2020, 34, 443–460. [Google Scholar] [CrossRef]
- Al-Daraghmeh, M.Y.; Hayajneh, M.T.; Almomani, M.A. Corrosion Resistance of TiO2-ZrO2 Nanocomposite Thin Films Spin Coated on AISI 304 Stainless Steel in 3.5 wt. % NaCl Solution. Mater. Res. 2019, 22, e20190014. [Google Scholar] [CrossRef]
- Sopicka-Lizer, M. High Energy Ball Milling: Mechanical Processing of Nano Powders, Woodhead Publishing Materials; CRC Press: Boca Raton, FL, USA, 2010; pp. 1–5. [Google Scholar]
- Velumani, S.; Regmi, G.; Lee, M.; Castaneda, H.; Kuttolamadom, M.; Qian, X.; Kassiba, A. Engineered Zr/Zn/Ti oxide nanocomposite coatings for multifunctionality. Appl. Surf. Sci. 2021, 563, 150353. [Google Scholar] [CrossRef]
- Pandolfelli, V.C.; Rodrigues, J.A.; Stevens, R. Effects of TiO2 addition on the sintering of ZrO2. TiO2 compositions and on the retention of the tetragonal phase of zirconia at room temperature. J. Mat. Sci. 1991, 26, 5327–5334. [Google Scholar] [CrossRef]
- Precious Ayanwale, A.; Reyes-López, S.Y. ZrO2–ZnO Nanoparticles as Antibacterial Agents. ACS Omega 2019, 4, 19216–19224. [Google Scholar] [CrossRef] [PubMed] [Green Version]
- Bavykin, D.V.; Parmon, V.N.; Lapkin, A.A.; Walsh, F.C. The effect of hydrothermal conditions on the mesoporous structure of TiO2 nanotubes. J. Mater. Chem. 2004, 14, 3370–3377. [Google Scholar] [CrossRef]
- Deyab, M.A.; Nada, A.A.; Hamdy, A. Comparative study on the corrosion and mechanical properties of nano-composite coatings incorporated with TiO2 nano-particles, TiO2 nano-tubes, and ZnO nano-flowers. Prog. Org. Coat. 2017, 105, 245–251. [Google Scholar] [CrossRef]
- Xia, Y.; Mou, J.; Deng, G.; Wan, S.; Tieu, K.; Zhu, H.; Xue, Q. Sintered ZrO2-TiO2 ceramic composite and its mechanical appraisal. Ceram. Int. 2020, 46, 775–785. [Google Scholar] [CrossRef]
- Štefanić, G.; Musić, S.; Ivanda, M. Phase development of the ZrO2–ZnO system during the thermal treatments of amorphous precursors. J. Mol. Struct. 2009, 924–926, 225–234. [Google Scholar] [CrossRef]
- Uribe López, M.C.; Alvarez Lemus, M.A.; Hidalgo, M.C.; López González, R.; Quintana Owen, P.; Oros-Ruiz, S.; Uribe López, S.A.; Acosta, J. Synthesis and Characterization of ZnO-ZrO2 Nanocomposites for Photocatalytic Degradation and Mineralization of Phenol. J. Nanomater. 2019, 2019, 1015876. [Google Scholar] [CrossRef] [Green Version]
- Simon, S.M.; Chandran, A.; George, G.; Sajna, M.S.; Valparambil, P.; Kumi-Barmiah, E.; Jose, G.; Biju, P.R.; Joseph, C.; Unnikrishnan, N.V. Development of Thick Superhydrophilic TiO2–ZrO2 Transparent Coatings Realized through the Inclusion of Poly(methyl methacrylate) and Pluronic-F127. ACS Omega 2018, 3, 14924–14932. [Google Scholar] [CrossRef] [PubMed] [Green Version]
- DeBakker, C.J.; George, G.A.; St. John, N.A.; Fredericks, P.M. The kinetics of the cure of an advanced epoxy resin by Fourier transform Raman and near-IR spectroscopy. Spectrochim. Acta A Mol. Spectrosc. 1993, 49, 739–752. [Google Scholar] [CrossRef]
- Nikafshar, S.; Zabihi, O.; Ahmadi, M.; Mirmohseni, A.; Taseidifar, M.; Naebe, M. The Effects of UV Light on the Chemical and Mechanical Properties of a Transparent Epoxy-Diamine System in the Presence of an Organic UV Absorber. Materials 2017, 10, 180. [Google Scholar] [CrossRef] [PubMed]
- Xu, H.; Liu, W.; Cao, L.; Su, G.; Duan, R. Preparation of porous TiO2/ZnO composite film and its photocathodic protection properties for 304 stainless steel. Appl. Surf. Sci. 2014, 301, 508–514. [Google Scholar] [CrossRef]
- Horti, N.C.; Kamatagi, M.D.; Nataraj, S.K.; Wari, M.N.; Inamdar, S.R. Structural and optical properties of zirconium oxide (ZrO2) nanoparticles: Effect of calcination temperature. Nano Express 2020, 1, 010022. [Google Scholar] [CrossRef]
- Sathyaseelan, B.; Manikandan, E.; Baskaran, I.; Senthilnathan, K.; Sivakumar, K.; Moodley, M.K.; Ladchumananandasivam, R.; Maaza, M. Studies on structural and optical properties of ZrO2 nanopowder for opto-electronic applications. J. Alloys Comp. 2017, 694, 556–559. [Google Scholar] [CrossRef]
- Xie, Y.; Jiang, Y.; Zhao, S. Improving the wettability on ZnO and ZrO2 single crystal surface by laser irradiation. J. Laser Appl. 2012, 2012, 943–946. [Google Scholar]
- Nikoomanzari, E.; Fattah-alhosseini, A.; Pajohi Alamoti, M.R.; Keshavarz, M.K. Effect of ZrO2 nanoparticles addition to PEO coatings on Ti–6Al–4V substrate: Microstructural analysis, corrosion behavior and antibacterial effect of coatings in Hank’s physiological solution. Ceram 2020, 46, 13114–13124. [Google Scholar] [CrossRef]
- Banerjee, S.; Dionysiou, D.D.; Pillai, S.C. Self-cleaning applications of TiO2 by photo-induced hydrophilicity and photocatalysis. Appl. Catal. B 2015, 176–177, 396–428. [Google Scholar] [CrossRef] [Green Version]
- Sanu, M.S.; Chandran, A.; Prakashan, V.P.; George, G.; Sajna, M.S.; Biju, P.R.; Joseph, C.; Unnikrishnan, N.V. Synthesis and hydrophilic mechanism of porous TiO2-ZrO2 transparent coatings. AIP Conf. Proceed. 2019, 2082, 030031. [Google Scholar] [CrossRef]
- Elkebir, Y.; Mallarino, S.; Trinh, D.; Touzain, S. Effect of physical ageing onto the water uptake in epoxy coatings. Electrochim. Acta 2020, 337, 135766. [Google Scholar] [CrossRef]
- Ghomi, R.; Khorasani, S.N.; Koochaki, S.; Dinari, M.; Ataei, S.; Enayati, M.H.; Das, O.; Neisiany, R.E. Synthesis of TiO2 nanogel composite for highly efficient self-healing epoxy coating. J. Adv. Res. 2022, 1–10, In Press. [Google Scholar] [CrossRef]
- Xavier, J.R.; Nallaiyan, R. Application of EIS and SECM studies for investigation of anticorrosion properties of epoxy coatings containing ZrO2 nanoparticles on mild steel in 3.5% NaCl solution. J. Fail. Anal. Preven. 2016, 16, 1082–1091. [Google Scholar] [CrossRef]
- Rostami, M.; Rasouli, S.; Ramezanzadeh, B.; Askari, A. Electrochemical investigacion of the properties of Co doped ZnO nanoparticle as a corrosion inhibitive pigment for modifying corrosion resistance of the epoxy coating. Corros. Sci. 2014, 88, 387–399. [Google Scholar] [CrossRef]
- Harb, S.V.; Trentin, A.; Uvida, M.C.; Magnani, M.; Pulcinelli, S.H.; Santilli, C.V.; Hammer, P. A comparative study on PMMA-TiO2 and PMMA-ZrO2 protective coatings. Prog. Org. Coat. 2020, 140, 105477. [Google Scholar] [CrossRef]
- Golnaz, N.A.; Arvin, T.T.; Aghajani, H. Investigation on corrosion behavior of Cu–TiO2 nanocomposite synthesized by the use of SHS method. J. Mater. Res. Technol. 2019, 8, 22116–22222. [Google Scholar] [CrossRef]


| TMO | ZrO2 | TiO2 | ZnO |
|---|---|---|---|
| A | 90 | 5 | 5 |
| B | 80 | 10 | 10 |
| C | 65 | 25 | 10 |
| D | 50 | 40 | 10 |
| E | 40 | 50 | 10 |
| TMO | ZrO2 (nm) | TiO2 (nm) | ZnO (nm) | ZrTiO4 (nm) | ZnZrO2 (nm) |
|---|---|---|---|---|---|
| A | 12 | 21 | 26 | 37 | 35 |
| B | 12 | 15 | 19 | 35 | 34 |
| C | 18 | 17 | 19 | 45 | 34 |
| D | 27 | 16 | 17 | 44 | 31 |
| E | 26 | 16 | 17 | 41 | 34 |
| Samples | C (%) | O (%) | Zr (%) | Zn (%) | Ti (%) | Cr (%) | Fe (%) |
|---|---|---|---|---|---|---|---|
| A | 83.82 | 8.97 | 2.85 | 0.69 | 0.59 | 0.76 | 2.32 |
| B | 86.42 | 5.19 | 3.22 | 0.90 | 1.24 | 0.92 | 2.11 |
| C | 86.91 | 5.91 | 2.15 | 1.04 | 1.45 | 0.63 | 1.91 |
| D | 82.68 | 6.85 | 2.23 | 0.47 | 1.33 | 2.24 | 4.20 |
| E | 82.88 | 7.38 | 1.54 | 0.53 | 1.61 | 2.93 | 3.13 |
| Sample | Thickness (µm) | Contact Angle | Drop Image |
|---|---|---|---|
| Epoxy | 340 | NA | 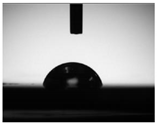 |
| Epoxy-A | 270.8 | 85.7 ± 0.4 |  |
| Epoxy-B | 253.9 | 81.2 ± 0.3 | 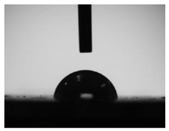 |
| Epoxy-C | 271.2 | 84.6 ± 0.4 |  |
| Epoxy-D | 292.5 | 73.8 ± 0.3 | 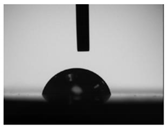 |
| Epoxy-E | 302.6 | 81.9 ± 0.3 | 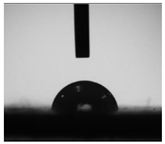 |
| Samples | Rs (Ωcm2) | Rcoat (Ωcm2) | Y0coat (S * s^η) | η | Y0dl (S * s^η) | η | Rct (Ωcm2) | χ2 |
|---|---|---|---|---|---|---|---|---|
| Epoxy | 101.3 | 33.54 × 10⁶ | 77.92 × 10⁻¹² | 0.942 | 76.49 × 10⁻¹² | 0.498 | 8.43 × 10⁹ | 1.232 × 10⁻³ |
| A | 32.60 | 65.28 | 327.5 × 10⁻⁹ | 0.811 | 167.8 × 10⁻⁹ | 0.934 | 3.2 × 10⁶ | 959.2 × 10⁻⁶ |
| B | 10 | 76.77 | 39.44 × 10⁻⁹ | 0.867 | 377.6 × 10⁻⁹ | 0.858 | 211.2 × 10⁶ | 583.6 × 10⁻⁶ |
| C | 1.14 × 10³ | 3.589 × 10⁹ | 62.55 × 10⁻¹² | 0.984 | 633.5 × 10⁻¹² | 0.581 | 169 × 109 | 446.1 × 10⁻⁶ |
| D | 100 | 1.672 × 10¹² | 69.84 × 10⁻¹² | 1 | 699.5 × 10⁻⁶ | |||
| E | 3.57 | 48.20 | 18.09 × 10⁻⁹ | 0.97 | 785.8 × 10⁻⁹ | 0.894 | 114.7 × 10⁶ | 205.4 × 10⁻⁶ |
| Sample | Ecorr (V) | Rp (Ω) | icorr (A/cm2) | vcorr (mpy) |
|---|---|---|---|---|
| SS | −0.232 | 19.95 × 10³ | 1.306 × 10⁻⁶ | 219.9 × 10⁻³ |
| Epoxy | −0.117 | 938 × 106 | 27.78 × 10⁻¹² | 4.68 × 10⁻⁶ |
| Epoxy-A | 0.159 | 59.81 × 10⁶ | 435.6 × 10⁻¹² | 73.34 × 10⁻⁶ |
| Epoxy-B | 0.125 | 54.51 × 10⁶ | 4.77 × 10⁻¹² | 80.46 × 10⁻⁶ |
| Epoxy-C | −0.557 | 1.498 × 10⁹ | 17.39 × 10⁻¹² | 2.93 × 10⁻⁶ |
| Epoxy-D | −3.28 | 1.32 × 10⁹ | 19.79 × 10⁻¹² | 3.33 × 10⁻⁶ |
| Epoxy-E | 0.043 | 40.36 × 10⁶ | 645.5 × 10⁻¹² | 108.7 × 10⁻⁶ |
Publisher’s Note: MDPI stays neutral with regard to jurisdictional claims in published maps and institutional affiliations. |
© 2022 by the authors. Licensee MDPI, Basel, Switzerland. This article is an open access article distributed under the terms and conditions of the Creative Commons Attribution (CC BY) license (https://creativecommons.org/licenses/by/4.0/).
Share and Cite
Ferrel-Alvarez, A.; Galicia, B.B.; Ashok, A.; Regmi, G.; Velumani, S.; Castaneda, H. Synthesis and Characterization of Epoxy-Rich TMOs Deposited on Stainless Steel for Corrosion Applications. Coatings 2022, 12, 387. https://doi.org/10.3390/coatings12030387
Ferrel-Alvarez A, Galicia BB, Ashok A, Regmi G, Velumani S, Castaneda H. Synthesis and Characterization of Epoxy-Rich TMOs Deposited on Stainless Steel for Corrosion Applications. Coatings. 2022; 12(3):387. https://doi.org/10.3390/coatings12030387
Chicago/Turabian StyleFerrel-Alvarez, Atzin, Brenda B. Galicia, Adhikari Ashok, Ganesh Regmi, Subramaniam Velumani, and Homero Castaneda. 2022. "Synthesis and Characterization of Epoxy-Rich TMOs Deposited on Stainless Steel for Corrosion Applications" Coatings 12, no. 3: 387. https://doi.org/10.3390/coatings12030387
APA StyleFerrel-Alvarez, A., Galicia, B. B., Ashok, A., Regmi, G., Velumani, S., & Castaneda, H. (2022). Synthesis and Characterization of Epoxy-Rich TMOs Deposited on Stainless Steel for Corrosion Applications. Coatings, 12(3), 387. https://doi.org/10.3390/coatings12030387