
Optimisation of HVOF Spray Process Parameters to Achieve Minimum Porosity and Maximum Hardness in WC-10Ni-5Cr Coatings

 ,
, 
 , ,
, ,
Abstract
:1. Introduction
2. Experimental Procedure and Methods
3. Developing Empirical Relationships
4. Results and Discussion
5. Confirmation and Validation
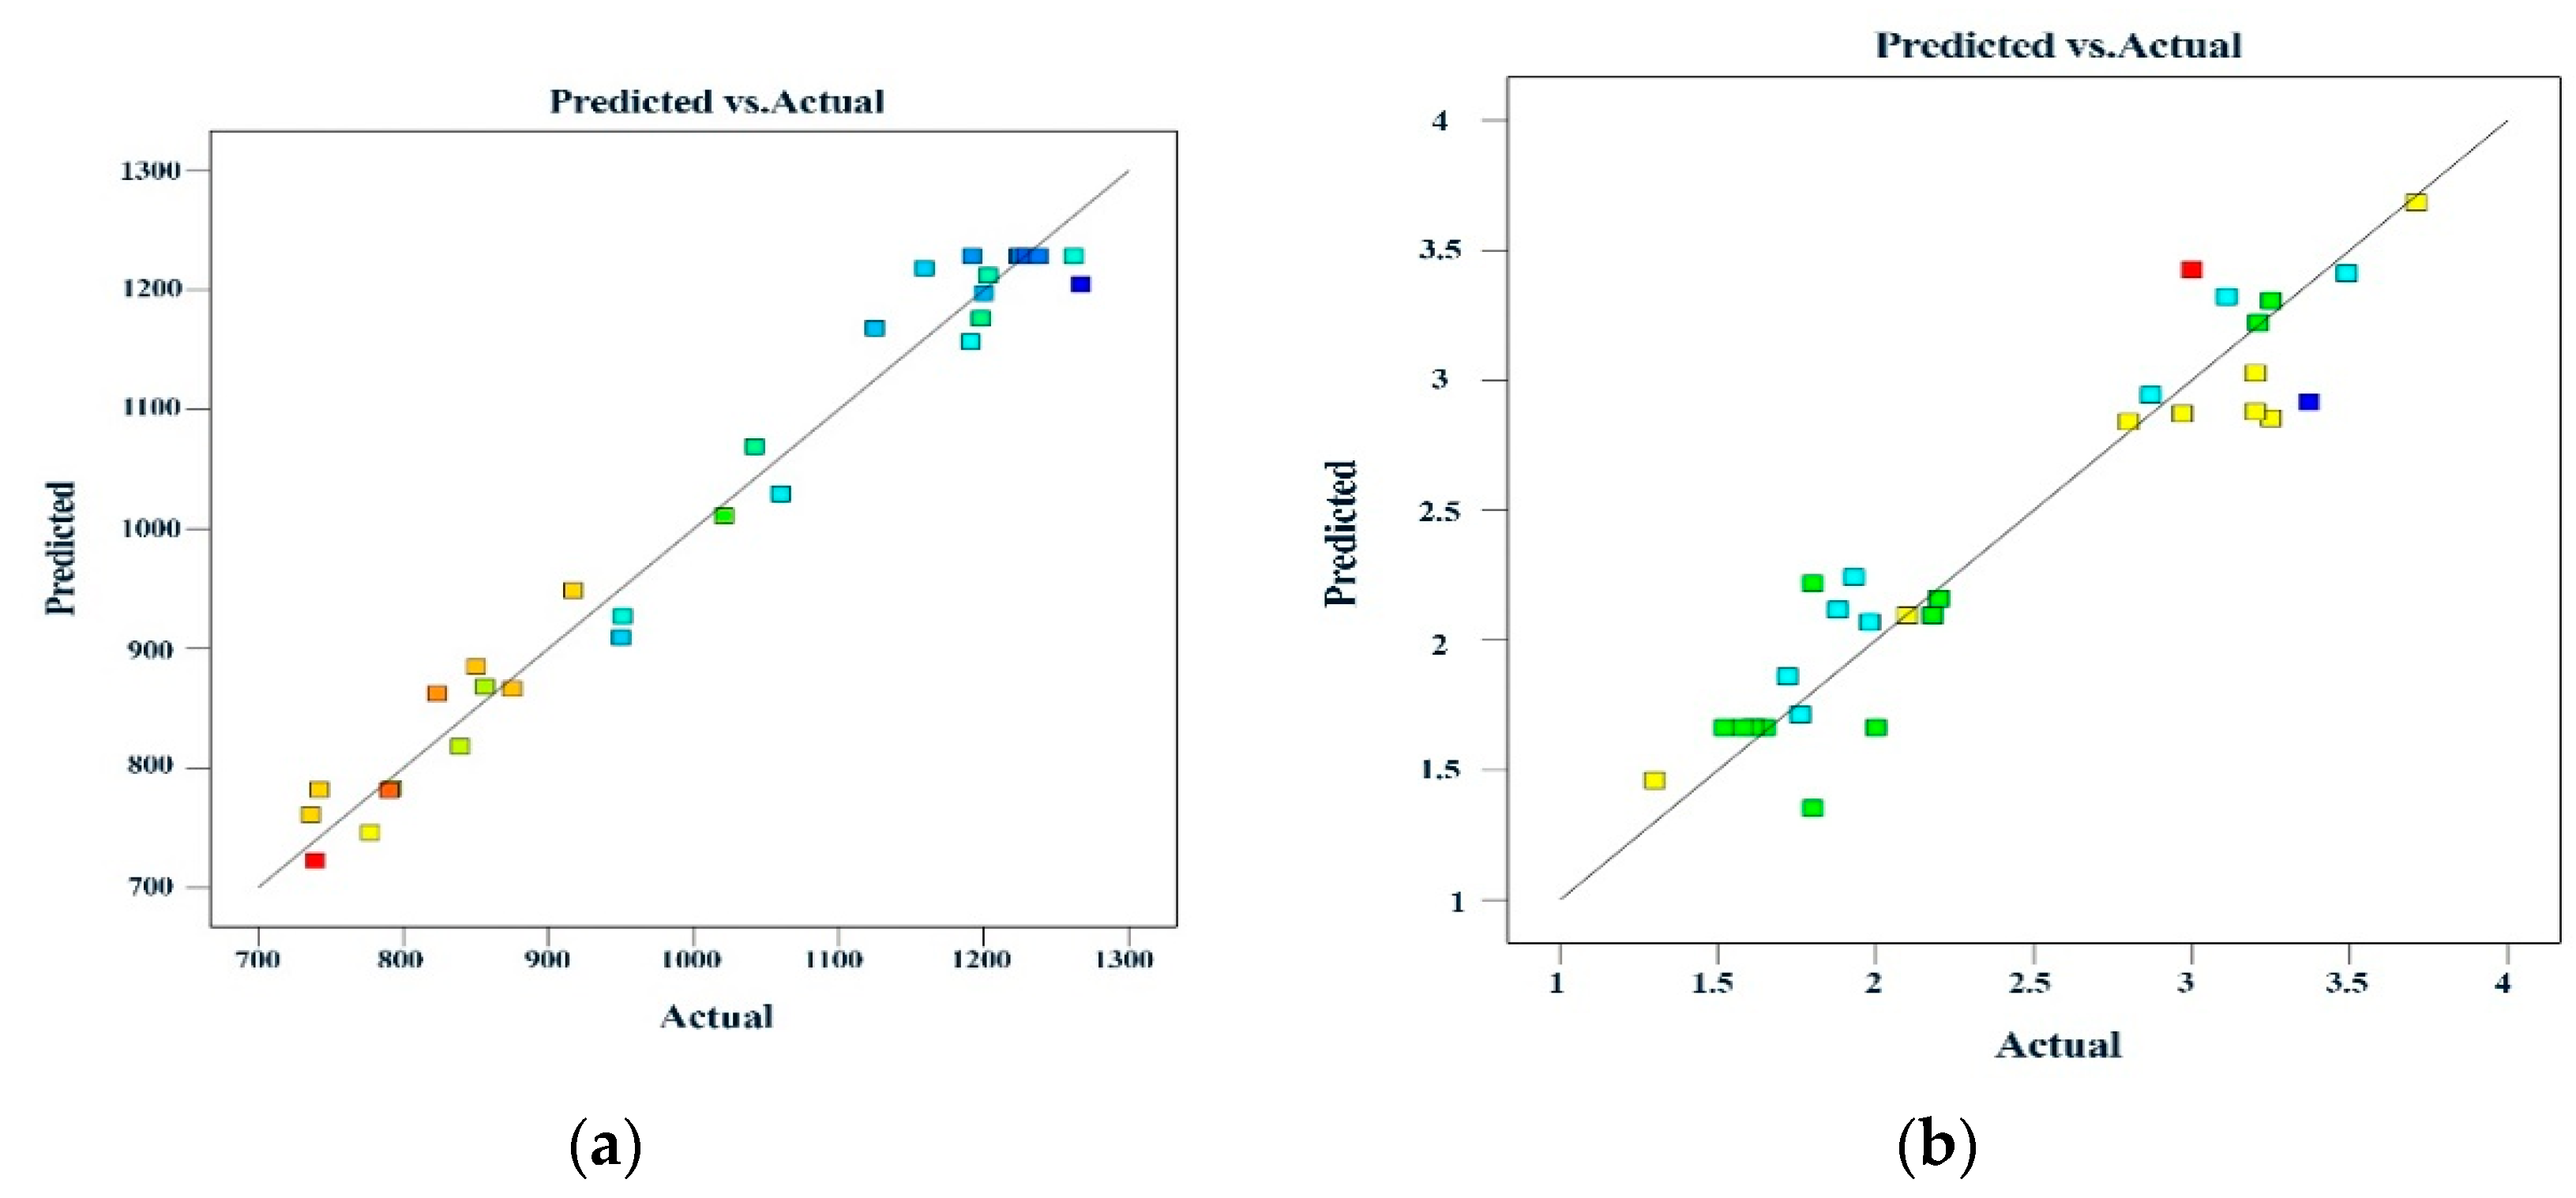
5.1. Authentication of Developed Empirical Relationships
5.2. Affiliation between Porosity and Hardness
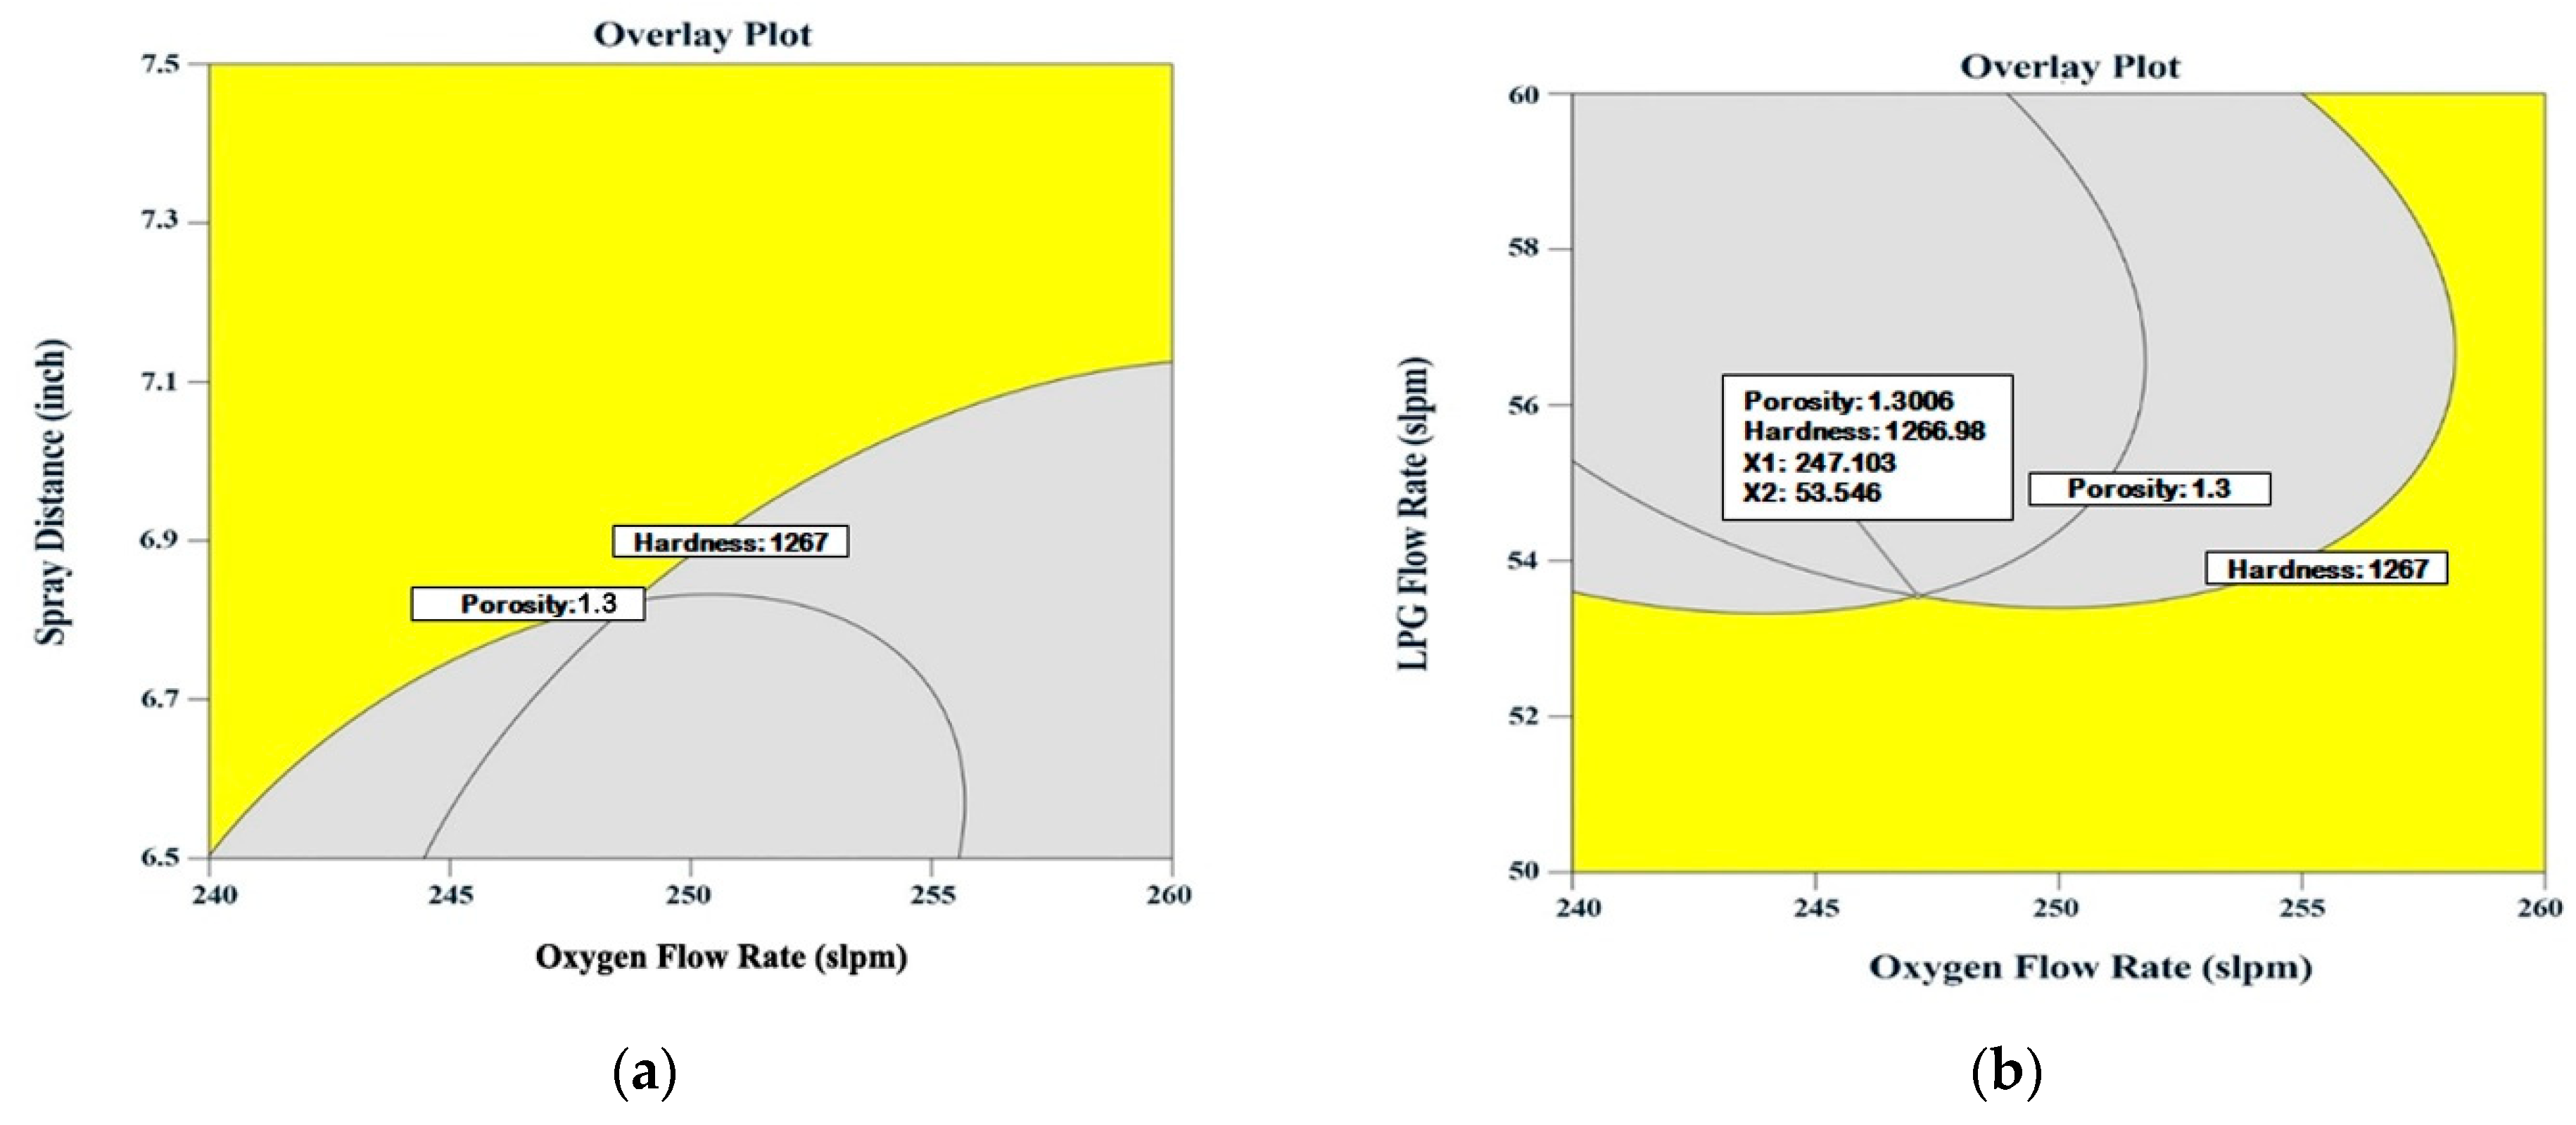
5.3. Justification of Optimisation Procedures
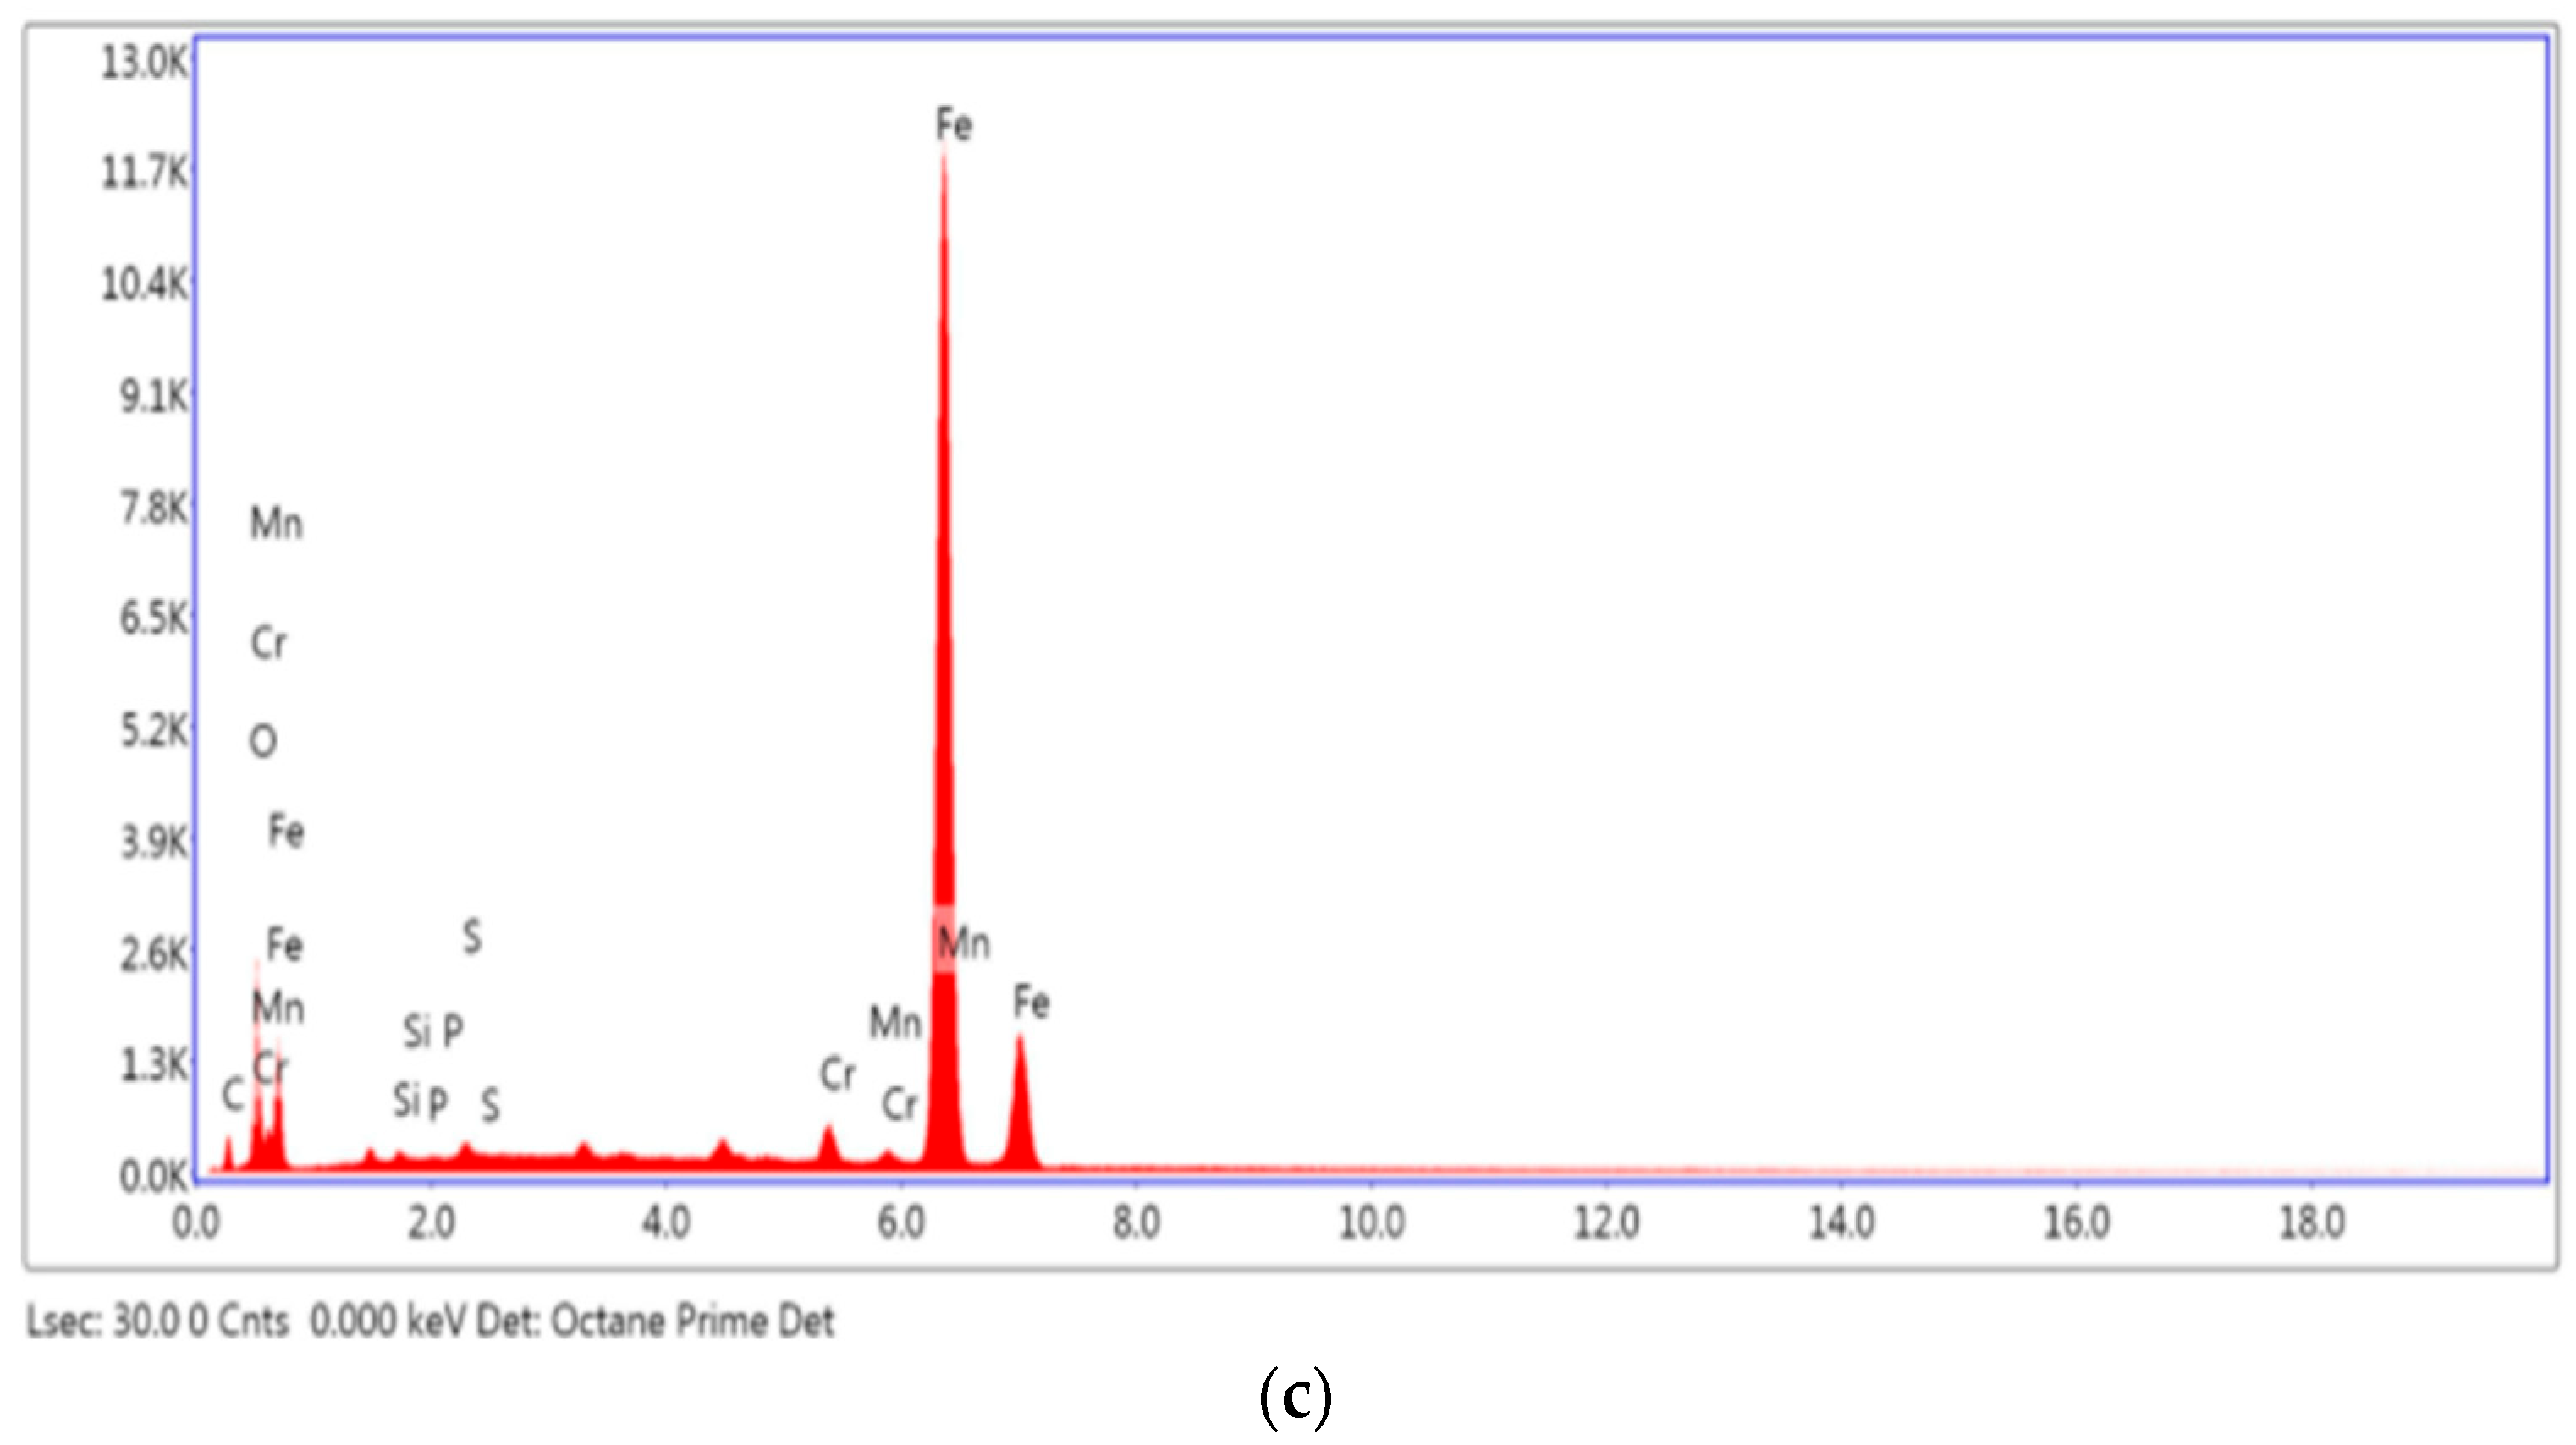
5.4. Investigation of Optimised Coating
6. Conclusions
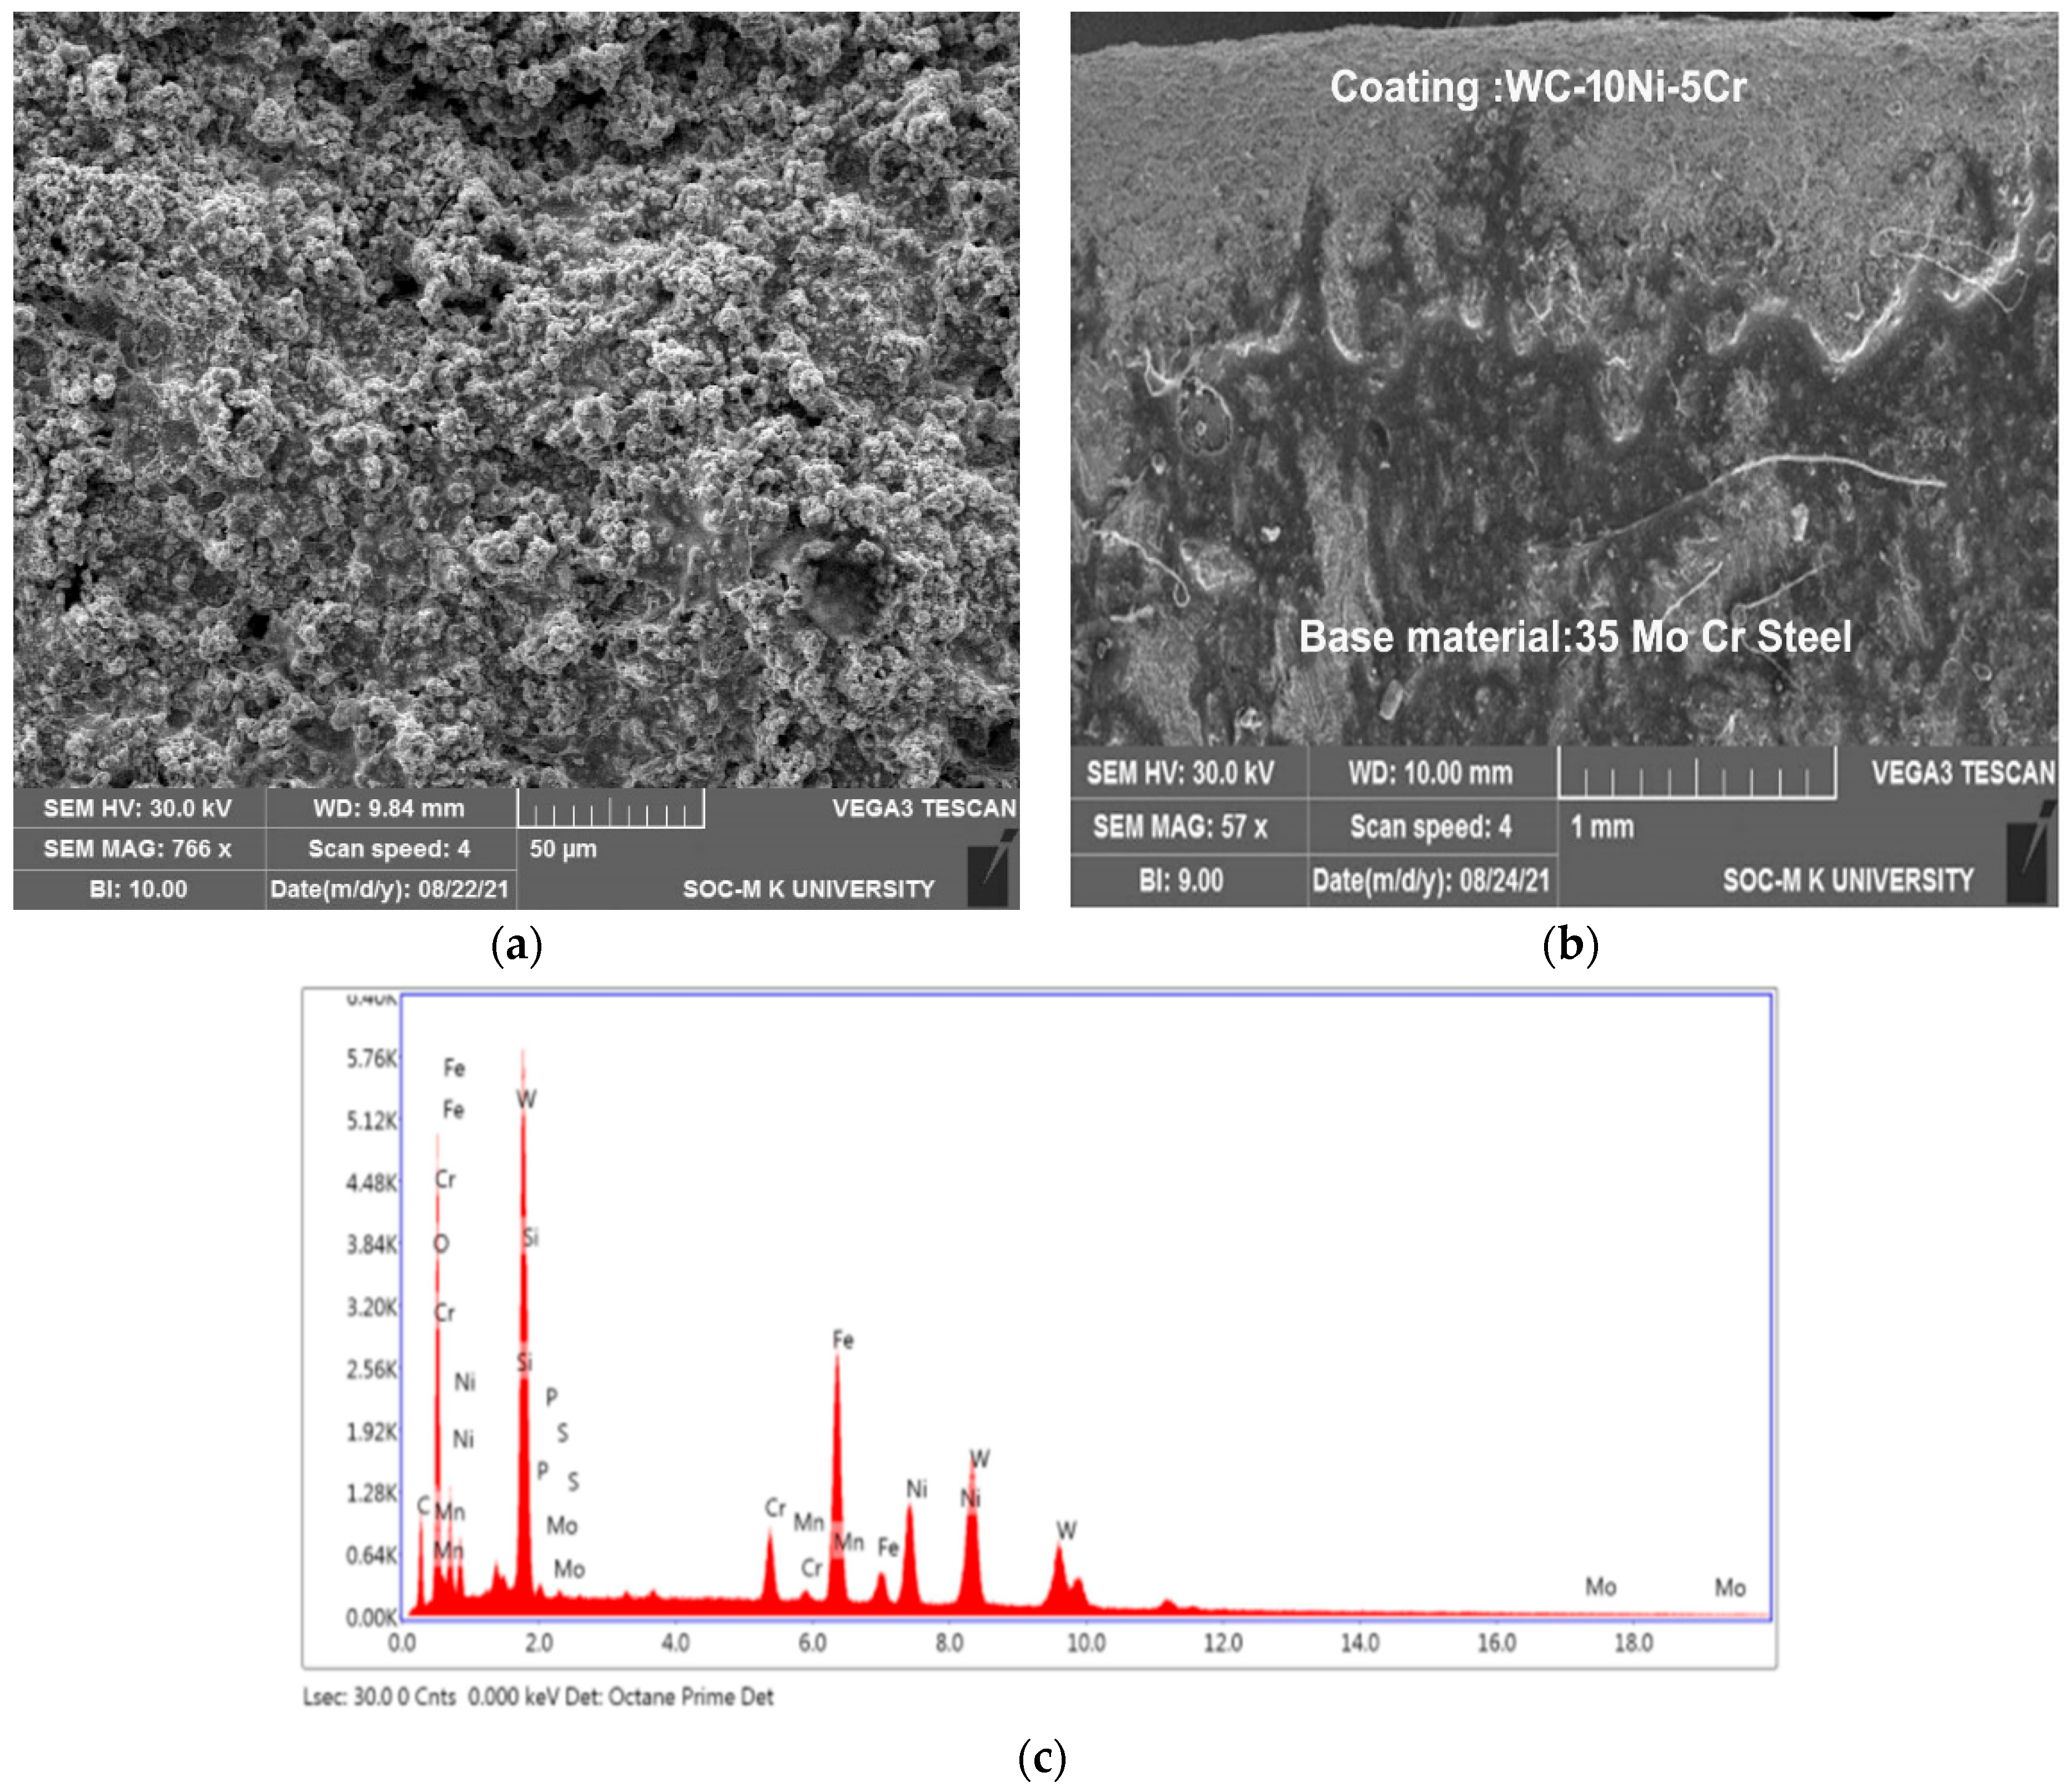
- WC-10Ni-5Cr coatings on 35Cr Mo Steel with HVOF were performed to evaluate the optimum spray conditions to achieve the minimum and maximum level of porosity and microhardness using RSM.
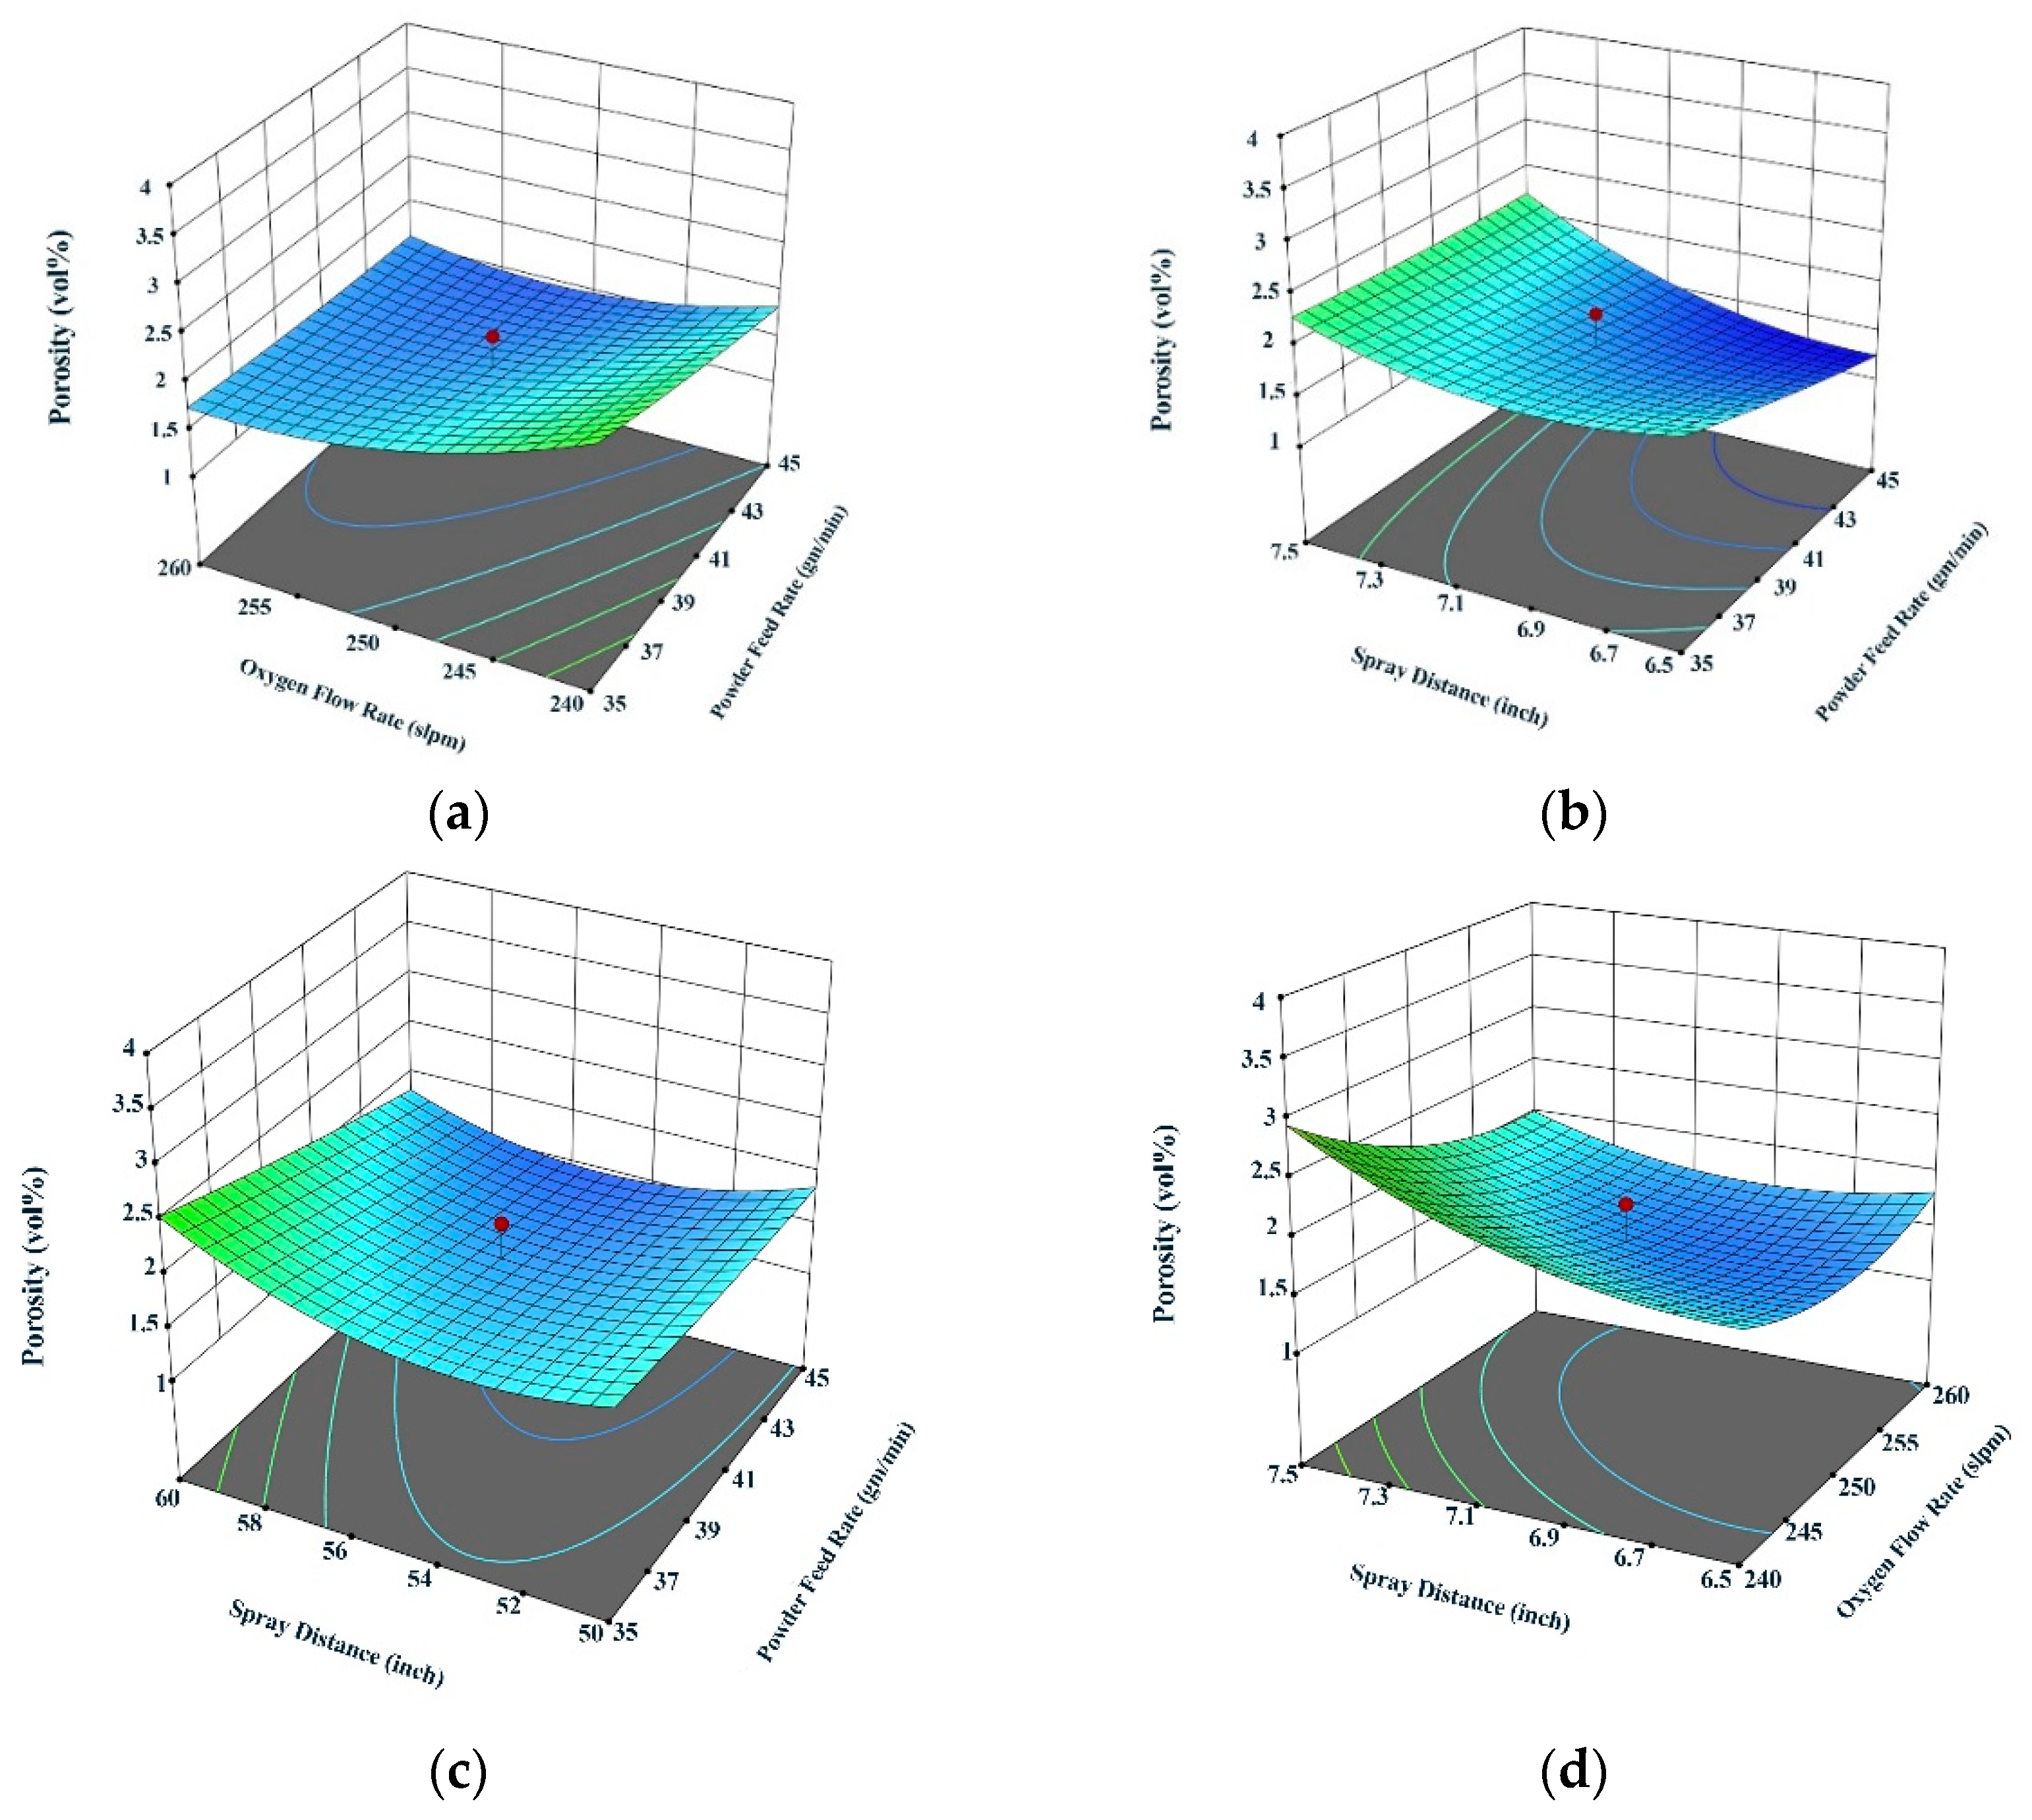
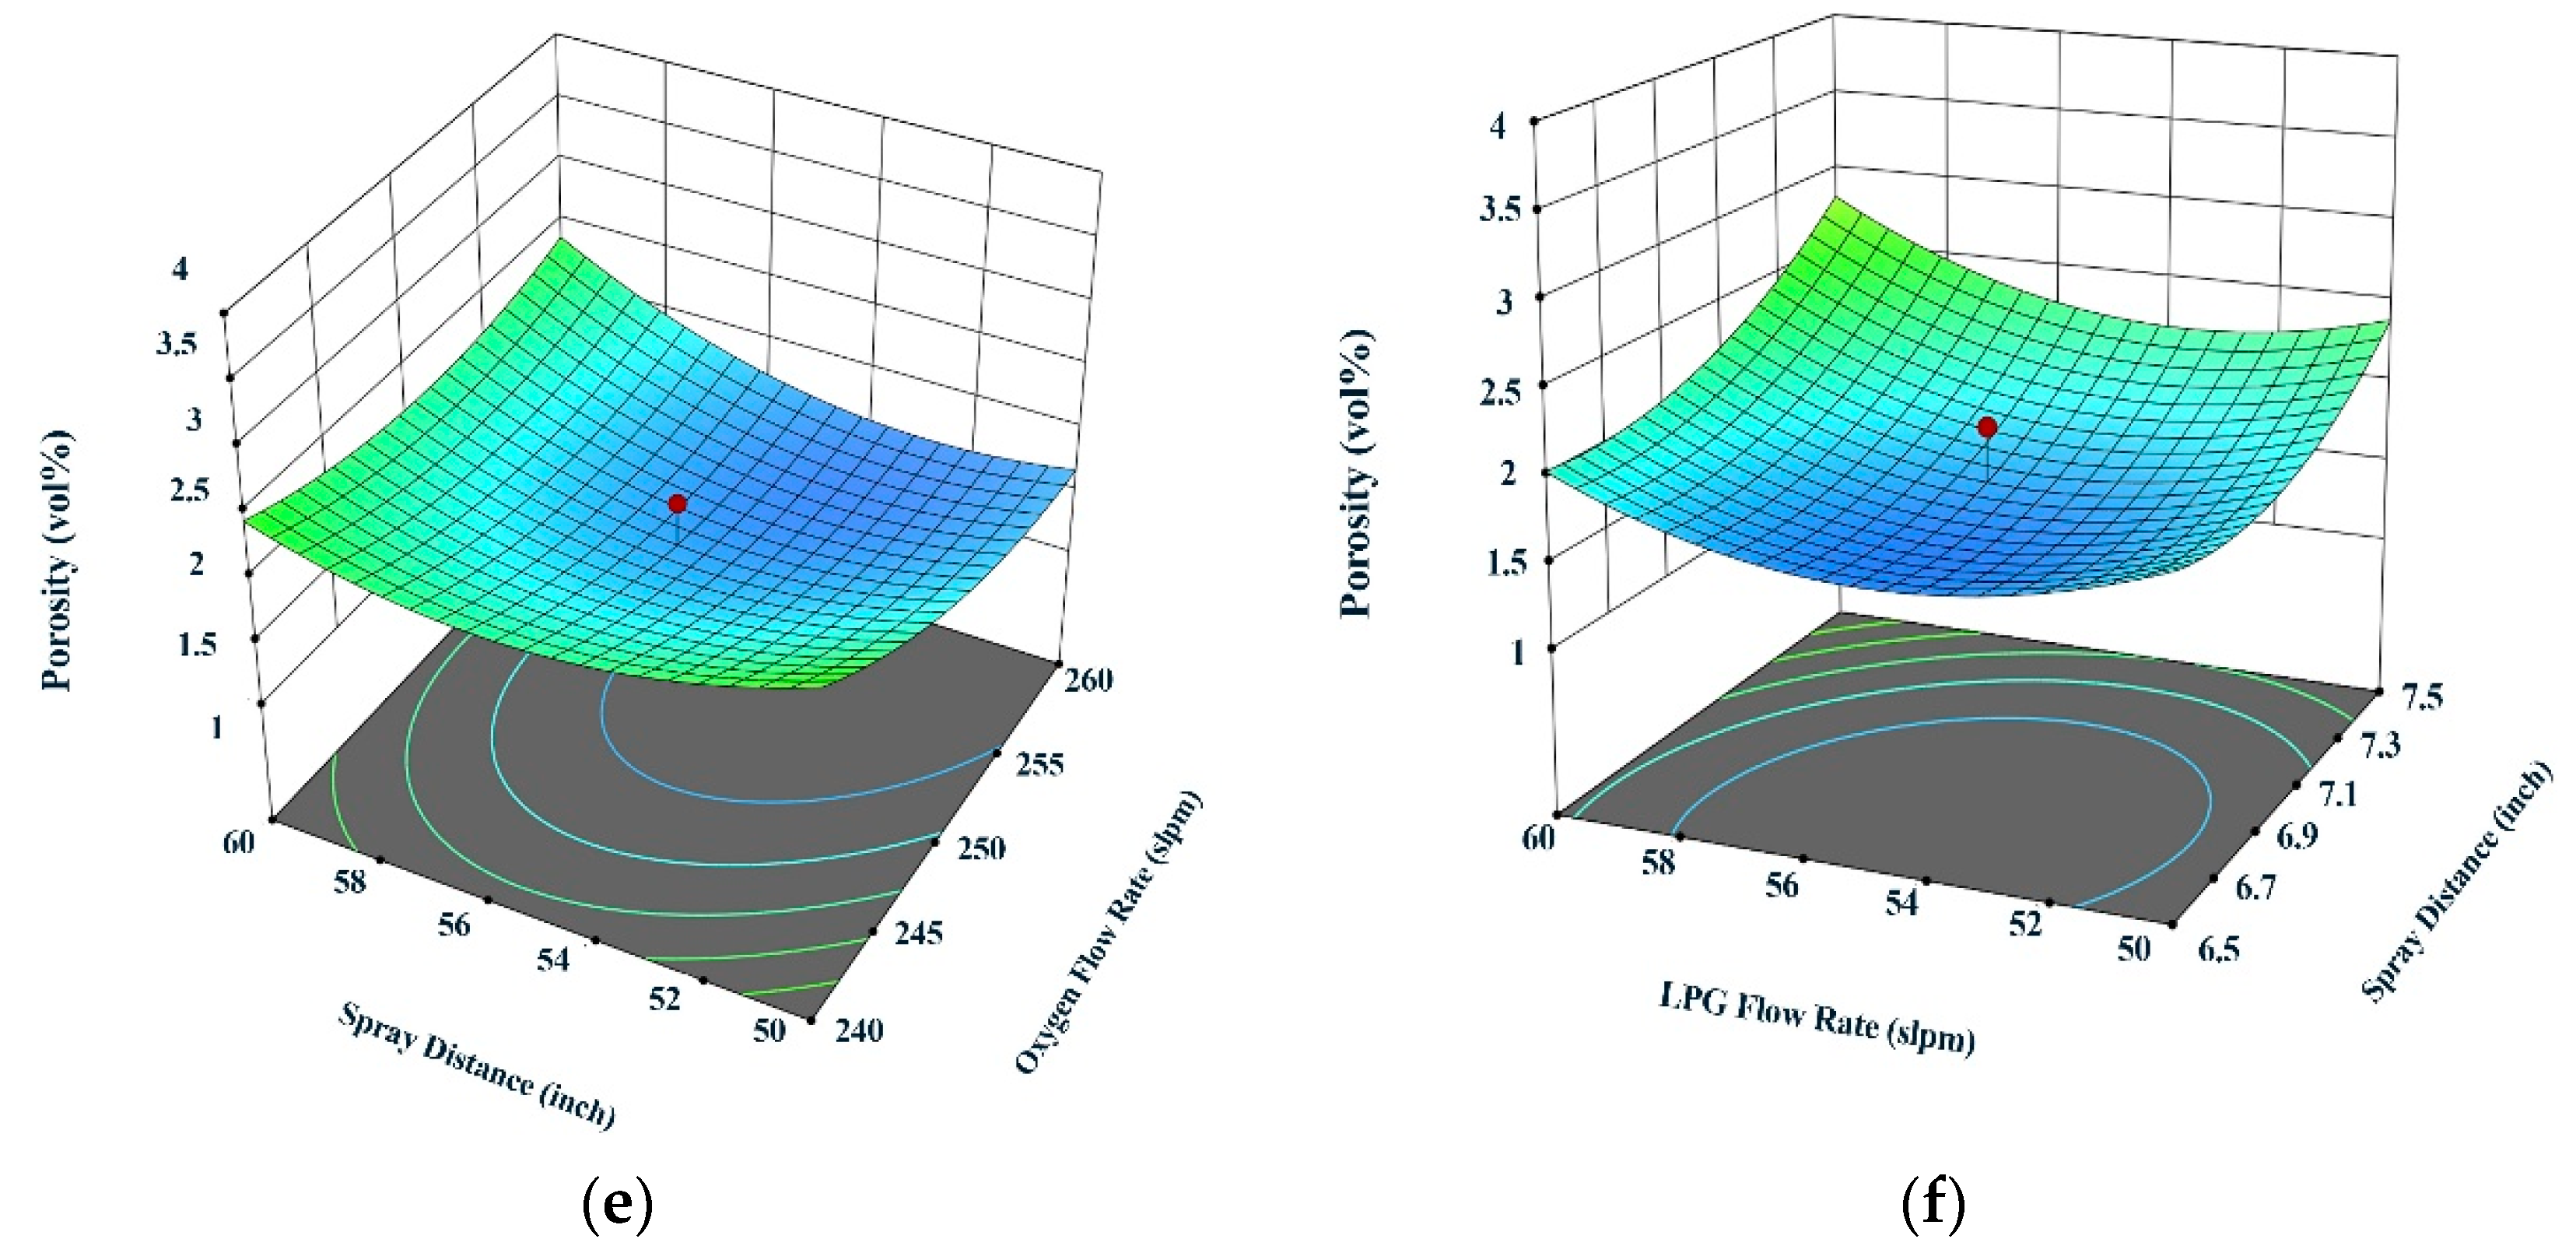
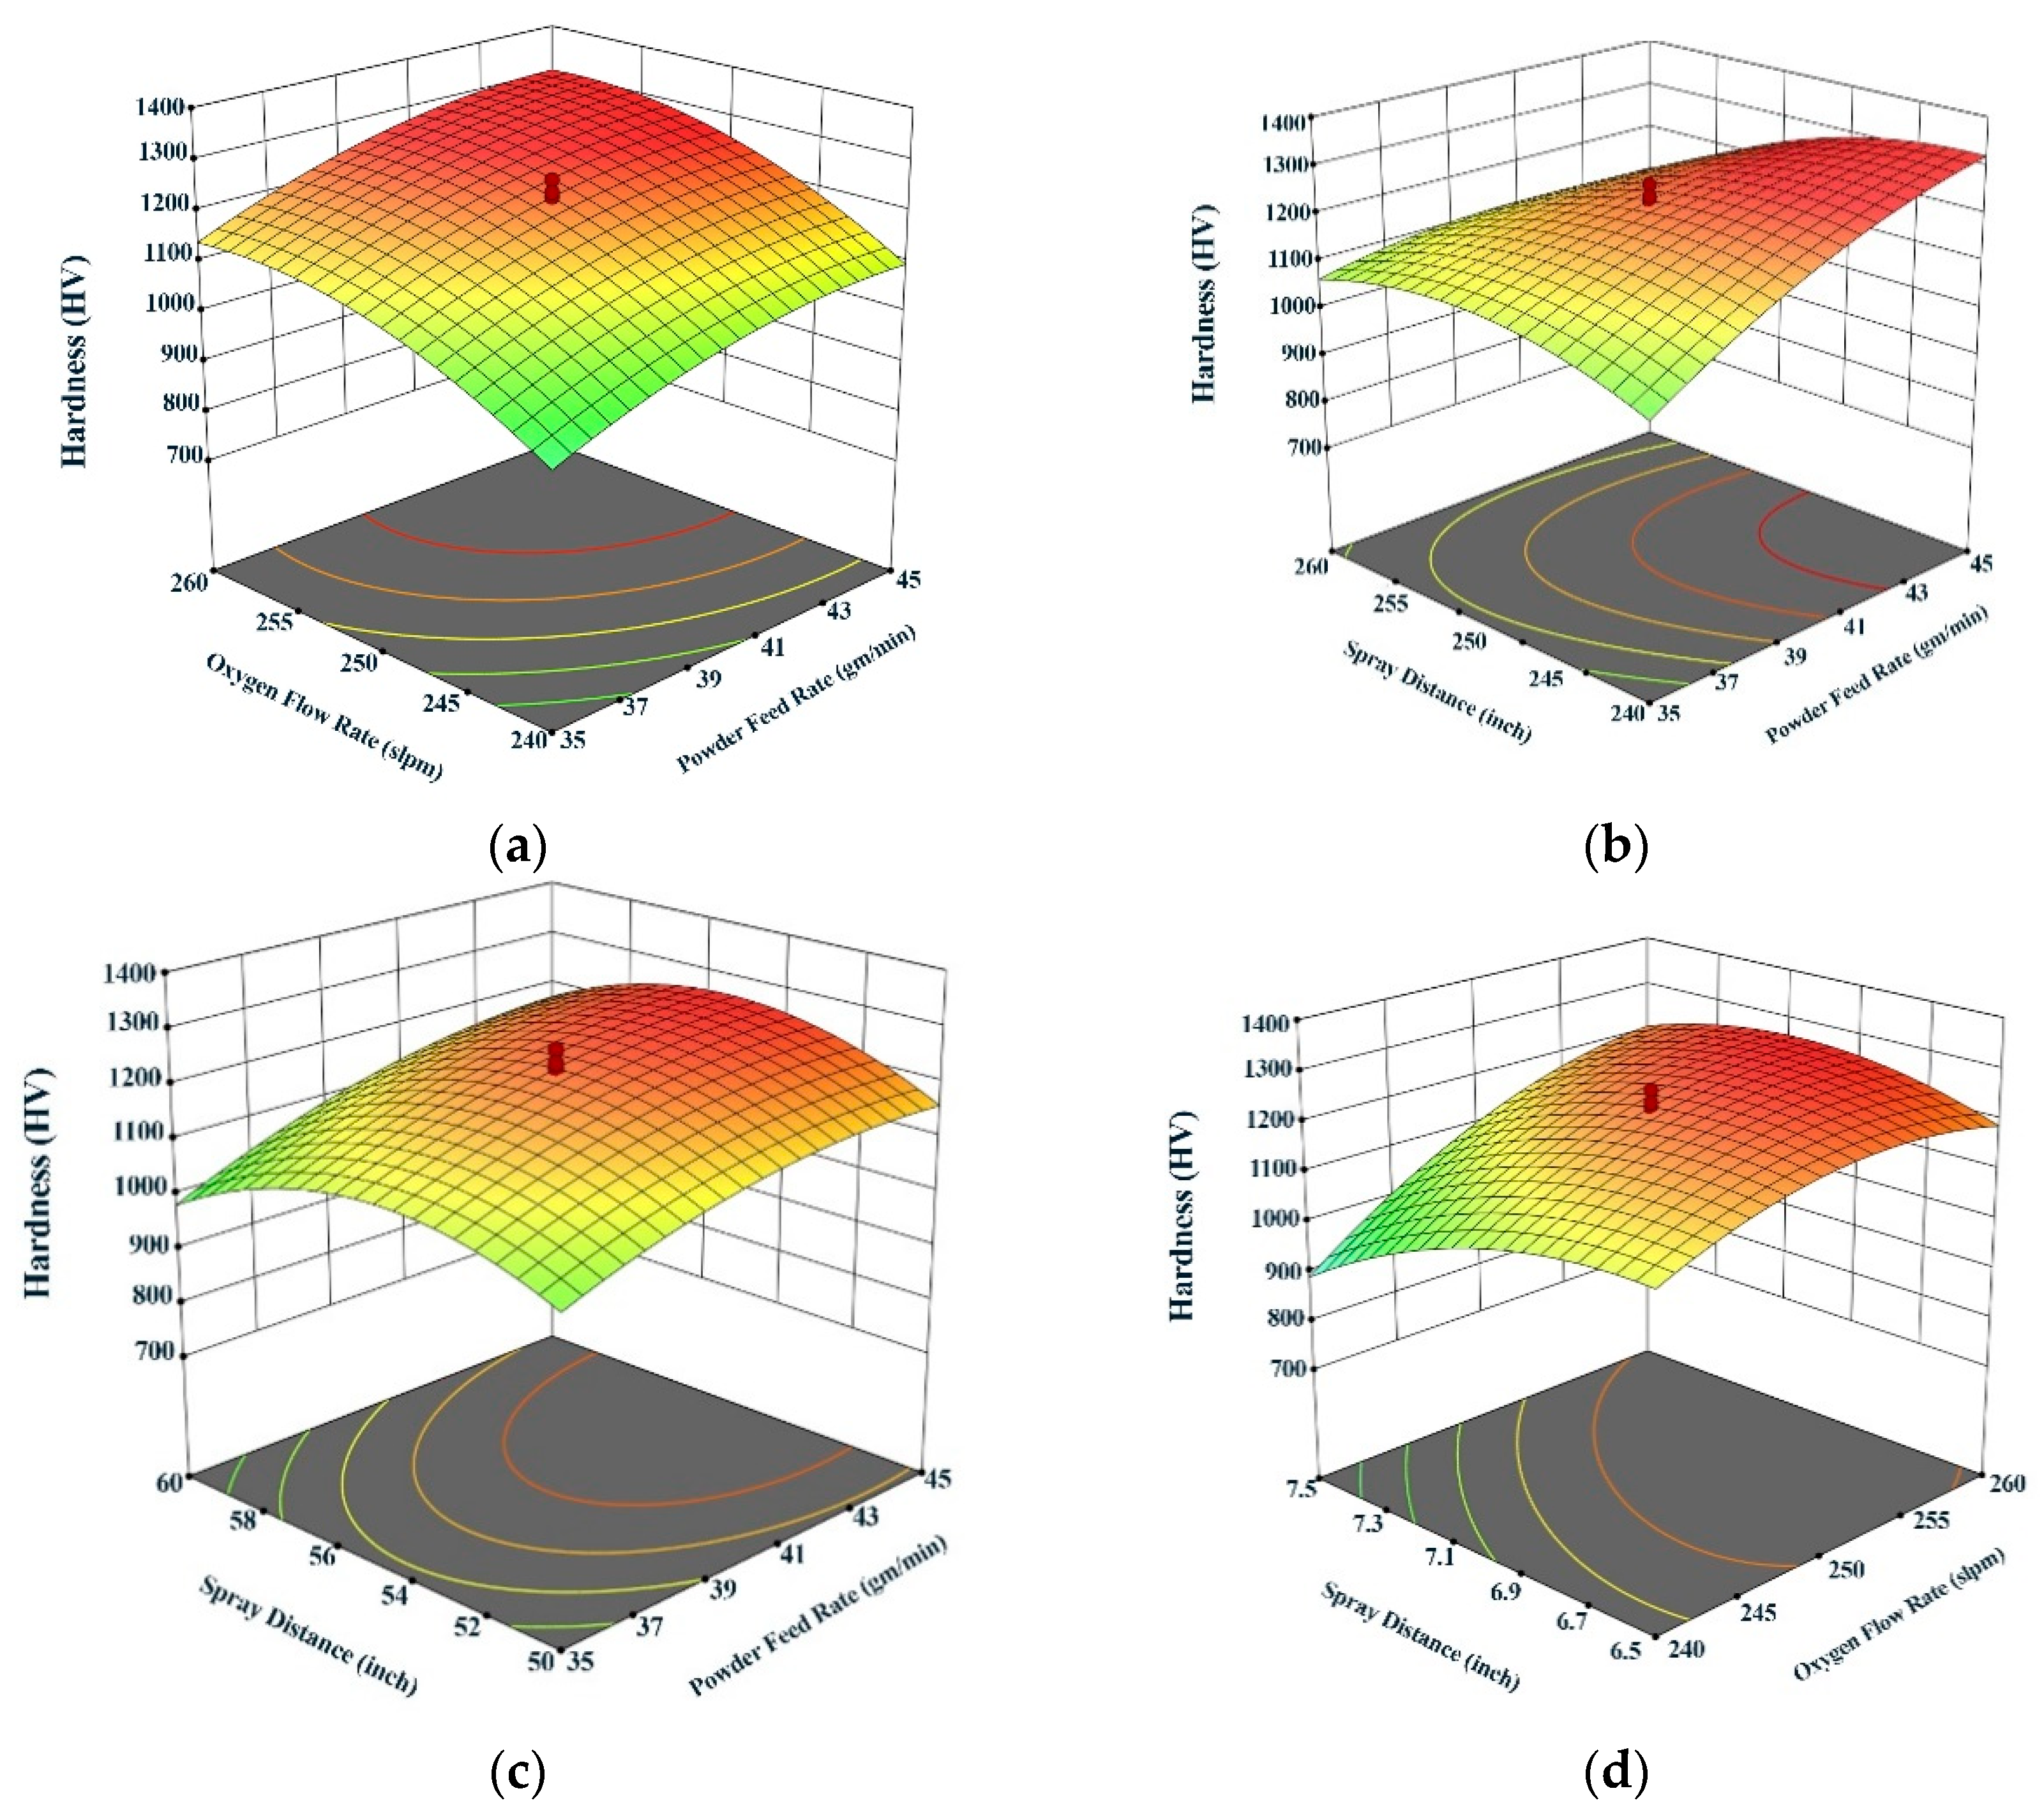
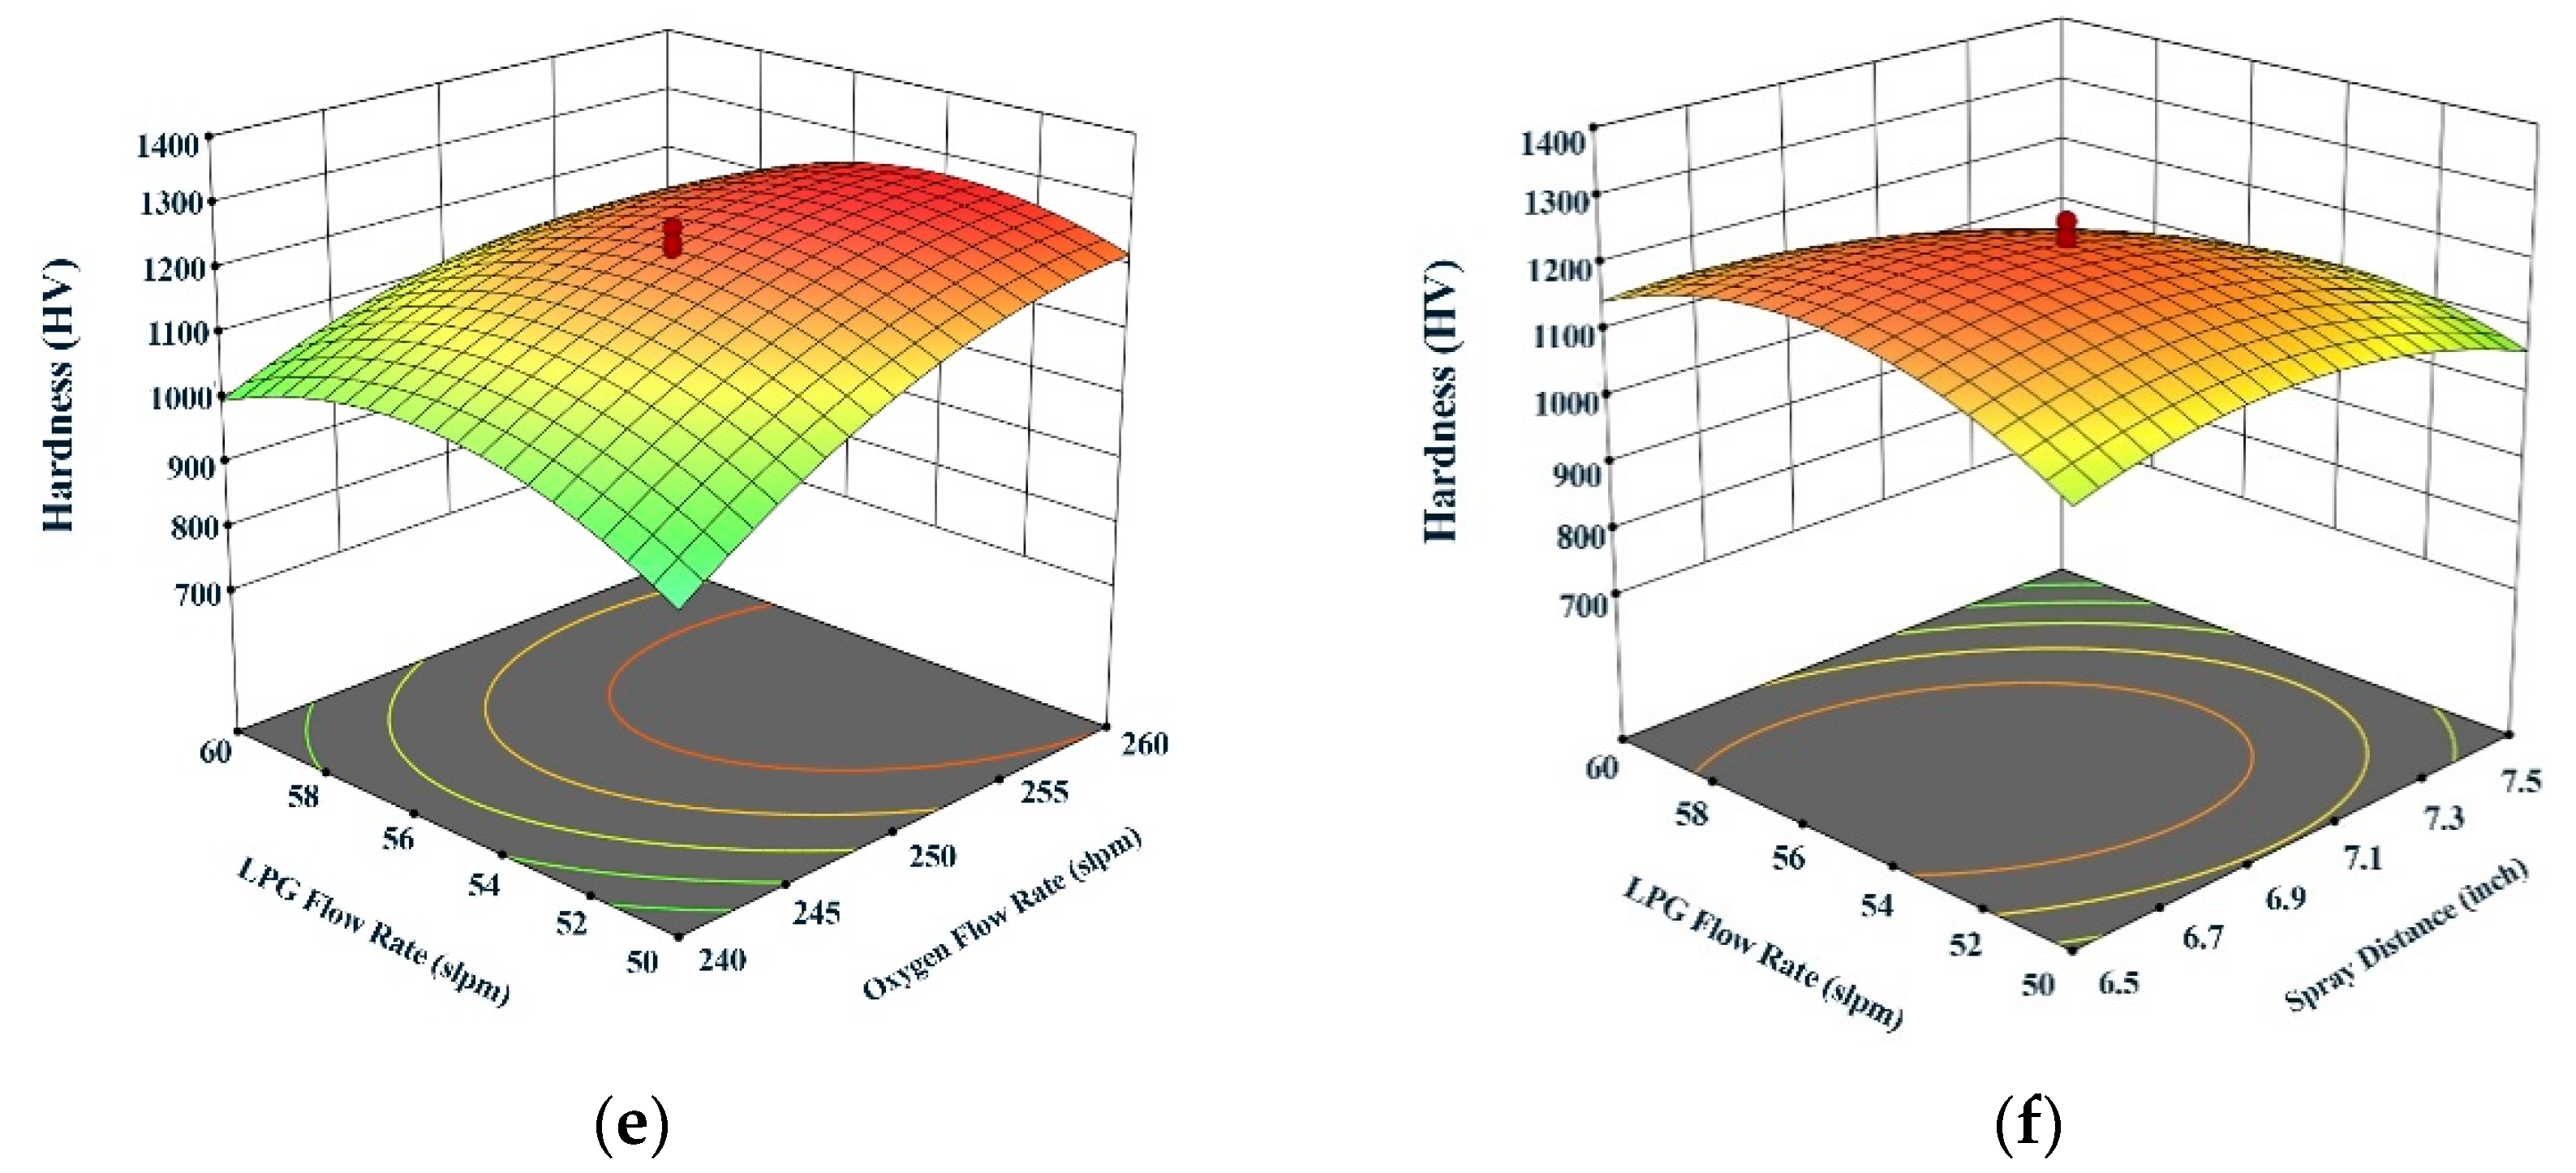
- From the results, it was concluded that running with a powder feed rate of 45 gm/min, an oxygen flow rate of 240 slpm, a spray distance of 6.5 inches and LPG flow rate of 60 slpm gives vol % of porosity = 1.3 (Minimum) and a value of microhardness = 1267 HV (Maximum) in the coating.
- F value results of ANOVA confirm that the fuel flow rate (O) has a higher effect on the porosity level and the microhardness of the HVOF coating than that of other parameters.
- The results also confirm that porosity and hardness always exhibit an inverse relationship.
Author Contributions
Funding
Institutional Review Board Statement
Informed Consent Statement
Data Availability Statement
Acknowledgments
Conflicts of Interest
References
- Vaßen, R.; Bakan, E.; Gatzen, C.; Kim, S.; Mack, D.E.; Guillon, O. Environmental Barrier Coatings Made by Different Thermal Spray Technologies. Coatings 2019, 9, 784. [Google Scholar] [CrossRef] [Green Version]
- Joshi, S.; Nylen, P. Advanced Coatings by Thermal Spray Processes: A review. Technologies 2019, 7, 79. [Google Scholar] [CrossRef] [Green Version]
- Romanov, D.; Moskovskii, S.; Konovalov, S.; Sosnin, K.; Gromov, V.; Ivanov, Y. Improvement of copper alloy properties in electro-explosive spraying of ZnO-Ag coatings resistant to electrical erosion. J. Mater. Res. Technol. 2019, 8, 5515–5523. [Google Scholar] [CrossRef]
- Mohankumar, A.; Duraisamy, T.; Chidambaramseshadri, R.; Pattabi, T.; Ranganathan, S.; Kaliyamoorthy, M.; Balachandran, G.; Sampathkumar, D.; Rajendran, P.R. Enhancing the Corrosion Resistance of Low Pressure Cold Sprayed Metal Matrix Composite Coatings on AZ31B Mg Alloy through Friction Stir Processing. Coatings 2022, 12, 135. [Google Scholar] [CrossRef]
- Kannan, M.; Duraisamy, T.; Pattabi, T.; Mohankumar, A. Investigate the corrosion properties of stellite coated on AZ91D alloy by plasma spray technique. Therm. Sci. 2021, 209. [Google Scholar] [CrossRef]
- Ashokkumar, M.; Thirumalaikumarasamy, D.; Thirumal, P.; Barathiraja, R. Influences of Mechanical, Corrosion, erosion and tribological performance of cold sprayed Coatings A review. Mater. Today Proc. 2021, 46, 7581–7587. [Google Scholar] [CrossRef]
- Mathanbabu, M.; Thirumalaikumarasamy, D.; Thirumal, P.; Ashokkumar, M. Study on thermal, mechanical, microstructural properties and failure analyses of lanthanum zirconate based thermal barrier coatings: A review. Mater. Today Proc. 2021, 46, 7948–7954. [Google Scholar] [CrossRef]
- Straffelini, G.; Federici, M. HVOF Cermet Coatings to Improve Sliding Wear Resistance in Engineering Systems: A review. Coatings 2020, 10, 886. [Google Scholar] [CrossRef]
- Brezinová, J.; Guzanová, A.; Tkáčová, J.; Brezina, J.; Ľachová, K.; Draganovská, D.; Pastorek, F.; Maruschak, P.; Prentkovskis, O. High Velocity Oxygen Liquid-Fuel (HVOLF) Spraying of WC-Based Coatings for Transport Industrial Applications. Metals 2020, 10, 1675. [Google Scholar] [CrossRef]
- Tilger, M.; Biermann, D.; Abdulgader, M.; Tillmann, W. The Effect of Machined Surface Conditioning on the Coating Interface of High Velocity Oxygen Fuel (HVOF) Sprayed Coating. J. Manuf. Mater. Process. 2019, 3, 79. [Google Scholar] [CrossRef] [Green Version]
- Wu, M.; Pan, L.; Duan, H.; Wan, C.; Yang, T.; Gao, M.; Yu, S. Study on Wear Resistance and Corrosion Resistance of HVOF Surface Coating Refabricate for Hydraulic Support Column. Coatings 2021, 11, 1457. [Google Scholar] [CrossRef]
- Javed, M.A.; Ang, A.S.M.; Bhadra, C.M.; Piola, R.; Neil, W.C.; Berndt, C.C.; Leigh, M.; Howse, H.; Wade, S.A. Corrosion and mechanical performance of HVOF WC-based coatings with alloyed nickel binder for use in marine hydraulic applications. Surf. Coat. Technol. 2021, 418, 127239. [Google Scholar] [CrossRef]
- Vignesh, S.; Shanmugam, K.; Balasubramanian, V.; Sridhar, K. Identifying the optimal HVOF spray parameters to attain minimum porosity and maximum hardness in iron based amorphous metallic coatings. Def. Technol. 2017, 13, 101–110. [Google Scholar] [CrossRef]
- Karthikeyan, S.; Balasubramanian, V.; Rajendran, R. Developing empirical relationships to estimate porosity and microhardness of plasma-sprayed YSZ coatings. Ceram. Int. 2014, 40, 3171–3183. [Google Scholar] [CrossRef]
- Vignesh, S.; Balasubramanian, V.; Sridhar, K.; Thirumalaikumarasamy, D. Slurry Erosion Behavior of HVOF-Sprayed Amorphous Coating on Stainless Steel. Met. Microstruct. Anal. 2019, 8, 462–471. [Google Scholar] [CrossRef]
- Prasad, R.V.; Rajesh, R.; Thirumalaikumarasamy, D.; Vignesh, S.; Sreesabari, S. Sensitivity analysis and optimisation of HVOF process inputs to reduce porosity and maximise hardness of WC-10Co-4Cr coatings. Sādhanā 2021, 46, 149. [Google Scholar] [CrossRef]
- Ribu, D.C.; Rajesh, R.; Thirumalaikumarasamy, D.; Vignesh, S. Influence of rotational speed, angle of impingement, concentration of slurry and exposure time on erosion performance of HVOF sprayed cermet coatings on 35CrMo steel. Mater. Today Proc. 2021, 46, 7518–7530. [Google Scholar] [CrossRef]
- Thirumalvalavan, S.; Senthilkumar, N. Experimental Investigation and Optimization of HVOF Spray Parameters on Wear Resistance Behaviour of Ti-6Al-4V Alloy. Comptes Rendus L’academie Bulg. Sci. 2019, 72, 664–673. [Google Scholar] [CrossRef]
- Qiao, L.; Wu, Y.; Hong, S.; Long, W.; Cheng, J. Wet abrasive wear behavior of WC-based cermet coatings prepared by HVOF spraying. Ceram. Int. 2020, 47, 1829–1836. [Google Scholar] [CrossRef]
- Murugan, K.; Ragupathy, A.; Balasubramanian, V.; Sridhar, K. Optimization of HVOF spray parameters to attain minimum porosity and maximum hardness in WC-10 Ni-4 Cr coatings. Surf. Coat. Technol. 2014, 247, 90–102. [Google Scholar] [CrossRef]
- Thermsuk, S.; Surin, P. Optimization Parameters of WC-12Co HVOF Sprayed Coatings on SUS 400 Stainless Steel. Procedia Manuf. 2019, 30, 506–513. [Google Scholar] [CrossRef]
- Baumann, I.; Hagen, L.; Tillmann, W.; Hollingsworth, P.; Stangier, D.; Schmidtmann, G.; Tolan, M.; Paulus, M.; Sternemann, C. Process characteristics, particle behavior and coating properties during HVOF spraying of conventional, fine and nanostructured WC-12Co powders. Surf. Coat. Technol. 2020, 405, 126716. [Google Scholar] [CrossRef]
- Liu, S.; Wu, H.; Xie, S.; Planche, M.-P.; Rivolet, D.; Moliere, M.; Liao, H. Novel liquid fuel HVOF torches fueled with ethanol: Relationships between in-flight particle characteristics and properties of WC-10Co-4Cr coatings. Surf. Coat. Technol. 2021, 408, 126805. [Google Scholar] [CrossRef]
- Guzanová, A.; Brezinová, J.; Draganovská, D.; Maruschak, P.O. Properties of coatings created by HVOF technology using micro-and nano-sized powder. Koroze Ochr. Mater. 2019, 63, 86–93. [Google Scholar] [CrossRef] [Green Version]
- Guo, X.; Planche, M.-P.; Chen, J.; Liao, H. Relationships between in-flight particle characteristics and properties of HVOF sprayed WC-CoCr coatings. J. Mater. Process. Technol. 2014, 214, 456–461. [Google Scholar] [CrossRef]
- Yuan, J.; Ma, C.; Yang, S.; Yu, Z.; Li, H. Improving the wear resistance of HVOF sprayed WC-Co coatings by adding submicron-sized WC particles at the splats’ interfaces. Surf. Coat. Technol. 2016, 285, 17–23. [Google Scholar] [CrossRef]
- Mathivanan, K.; Thirumalaikumarasamy, D.; Ashokkumar, M.; Deepak, S.; Mathanbabu, M. Optimization and prediction of AZ91D stellite-6 coated magnesium alloy using Box Behnken design and hybrid deep belief network. J. Mater. Res. Technol. 2021, 15, 2953–2969. [Google Scholar] [CrossRef]


| Percent | C% | Si% | Mn% | P% | S% | Cr% | Mo% |
|---|---|---|---|---|---|---|---|
| comp | 0.35 | 0.2 | 0.602 | 0.015 | 0.012 | 0.972 | 0.205 |
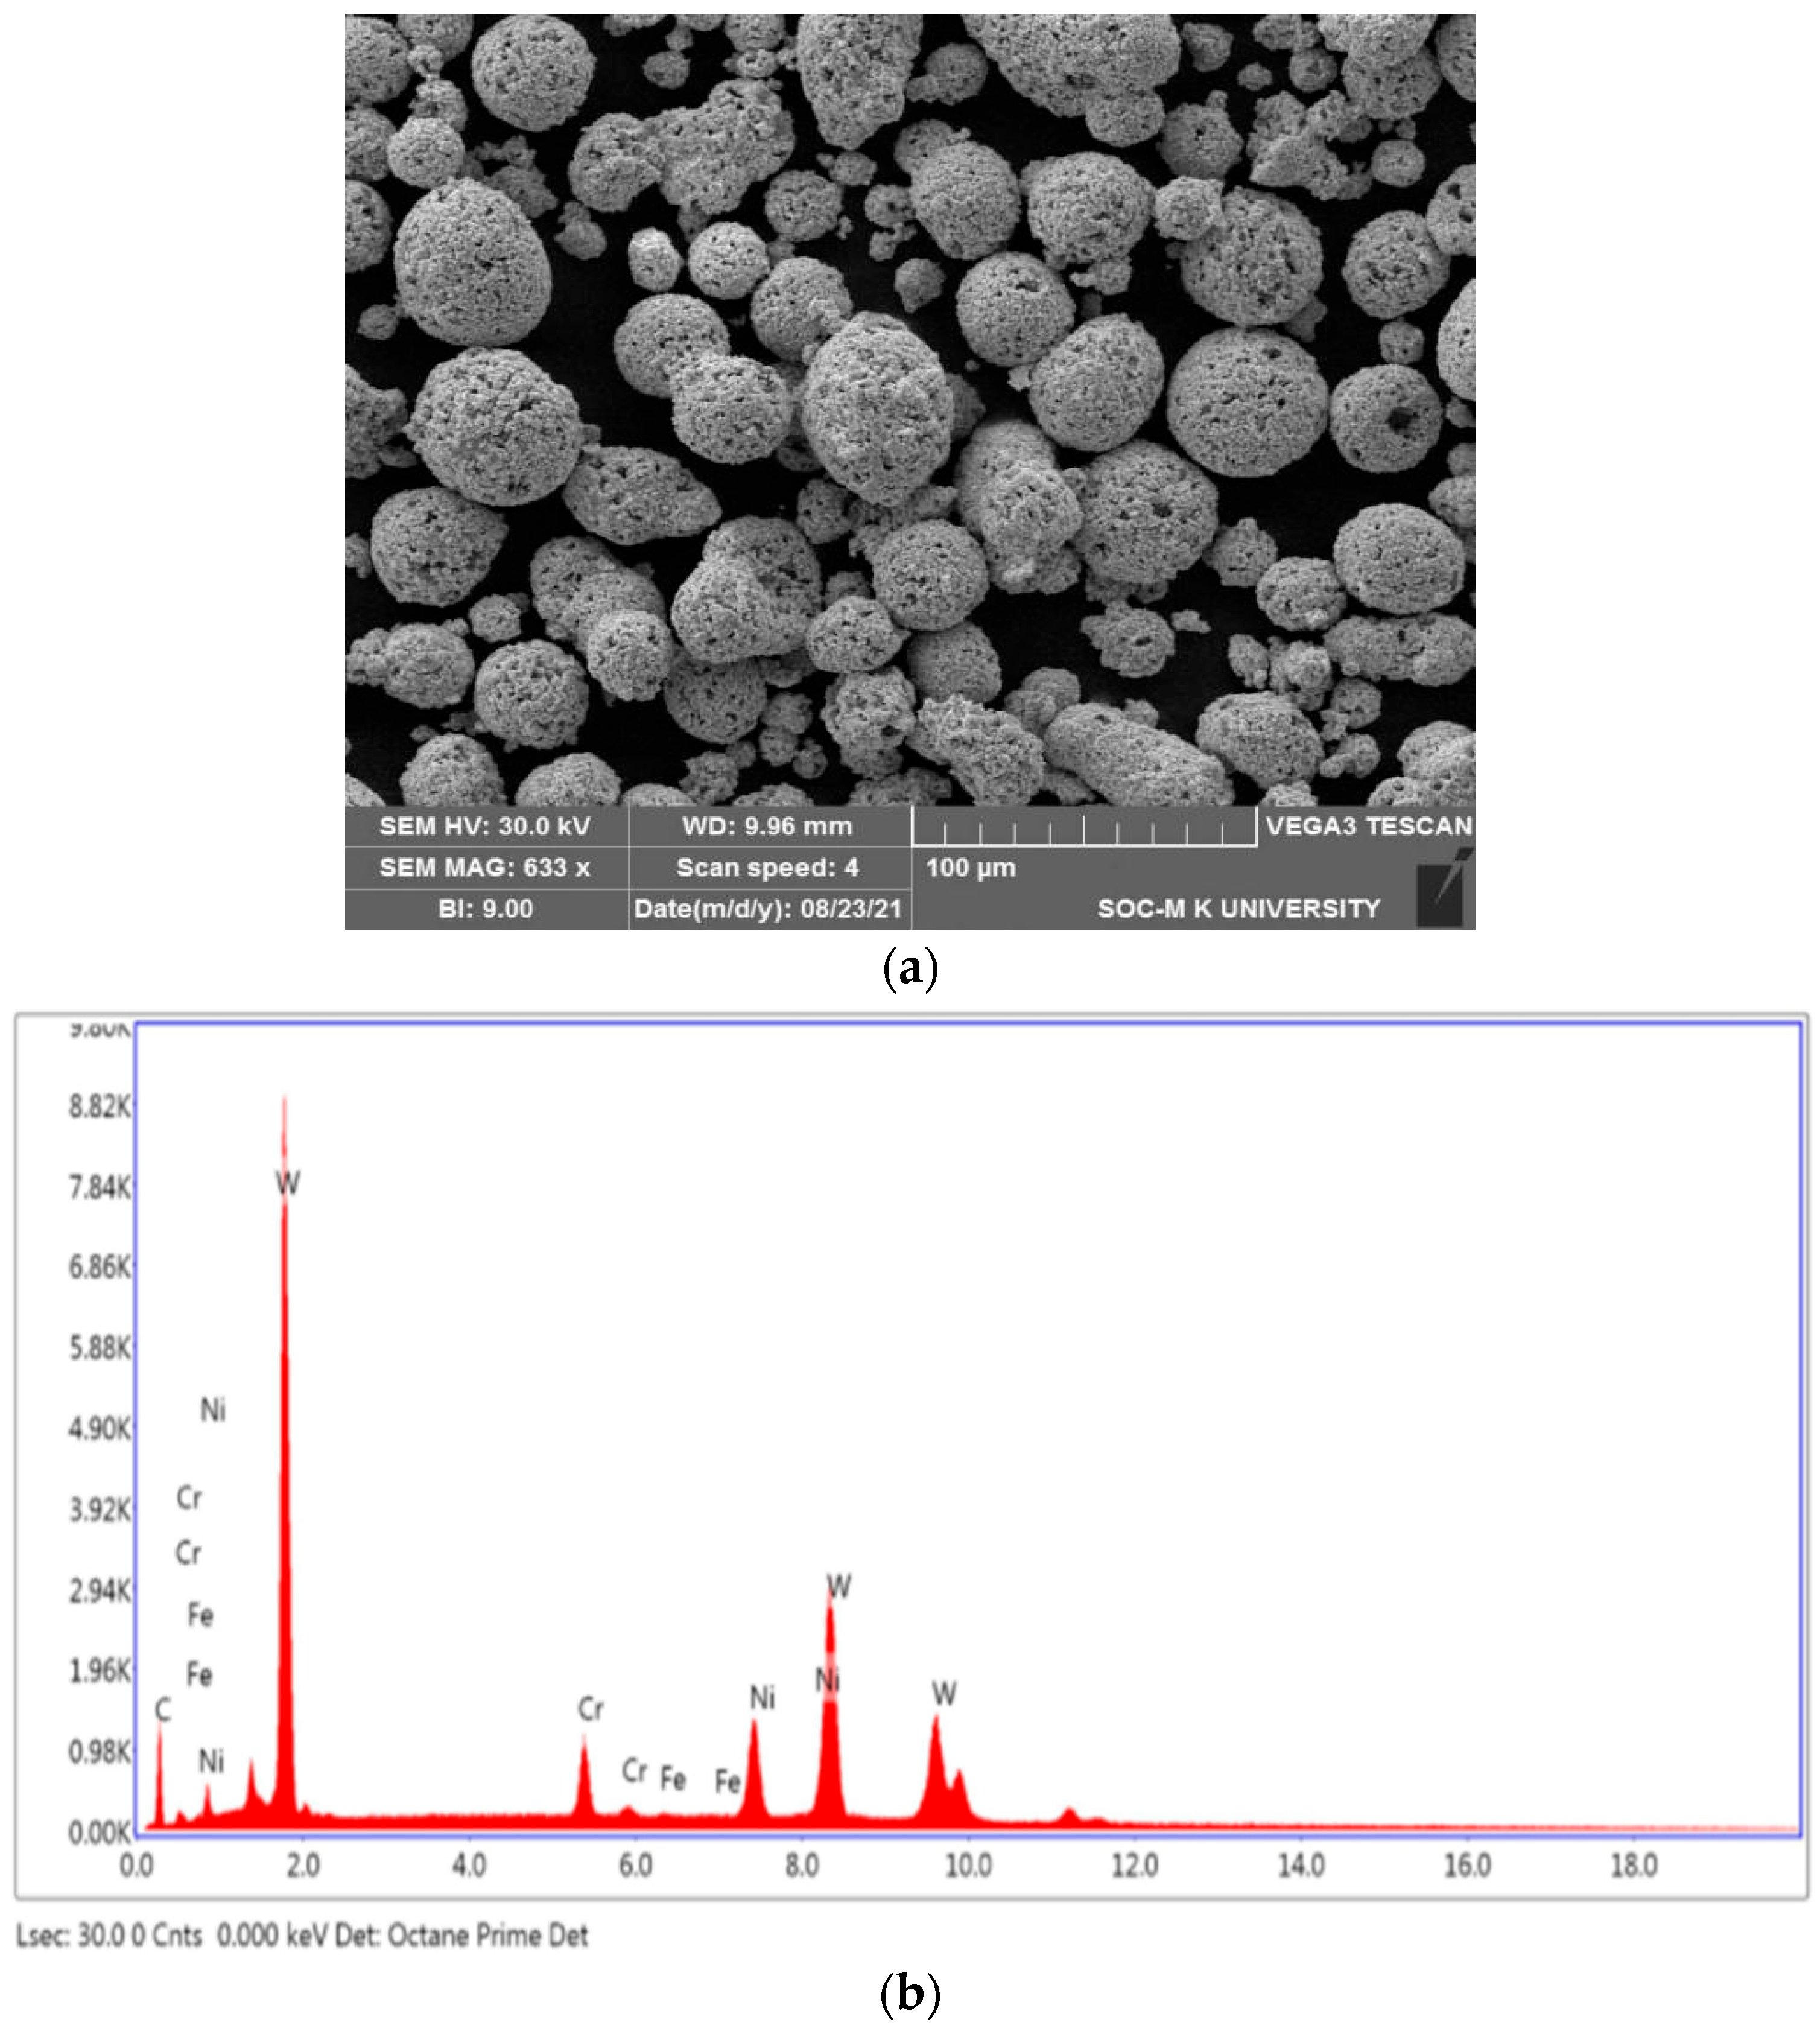
| Percent | C% | Cr% | Ni% | Fe% | W% |
|---|---|---|---|---|---|
| comp | 5.4 | 5.03 | 10.25 | 0.06 | Balance |
| Sl. No | Coded Value | Original Value | Porosity (vol%) | Microhardness (HV) | ||||||
|---|---|---|---|---|---|---|---|---|---|---|
| F | O | S | L | F (gm/min) | O (slpm) | S (inch) | L (slpm) | |||
| 1 | −1 | −1 | −1 | −1 | 35 | 240 | 6.5 | 50 | 2.87 | 792 |
| 2 | 1 | −1 | −1 | −1 | 45 | 240 | 6.5 | 50 | 1.88 | 1060 |
| 3 | −1 | 1 | −1 | −1 | 35 | 260 | 6.5 | 50 | 1.98 | 951 |
| 4 | 1 | −1 | −1 | −1 | 45 | 260 | 6.5 | 50 | 1.72 | 1200 |
| 5 | −1 | −1 | 1 | −1 | 35 | 240 | 7.5 | 50 | 3.49 | 790 |
| 6 | 1 | −1 | 1 | −1 | 45 | 240 | 7.5 | 50 | 3.11 | 864 |
| 7 | −1 | 1 | 1 | −1 | 35 | 260 | 7.5 | 50 | 1.76 | 1125 |
| 8 | 1 | 1 | 1 | −1 | 45 | 260 | 7.5 | 50 | 1.93 | 1191 |
| 9 | −1 | −1 | −1 | 1 | 35 | 240 | 6.5 | 60 | 3.25 | 850 |
| 10 | 1 | −1 | −1 | 1 | 45 | 240 | 6.5 | 60 | 1.3 | 1267 |
| 11 | −1 | 1 | −1 | 1 | 35 | 260 | 6.5 | 60 | 2.97 | 856 |
| 12 | 1 | 1 | −1 | 1 | 45 | 260 | 6.5 | 60 | 2.1 | 1203 |
| 13 | −1 | −1 | 1 | 1 | 35 | 240 | 7.5 | 60 | 3.71 | 739 |
| 14 | 1 | −1 | 1 | 1 | 45 | 240 | 7.5 | 60 | 3.2 | 736 |
| 15 | −1 | 1 | 1 | 1 | 35 | 260 | 7.5 | 60 | 3.2 | 751 |
| 16 | 1 | 1 | 1 | 1 | 45 | 260 | 7.5 | 60 | 2.8 | 1021 |
| 17 | −2 | 0 | 0 | 0 | 30 | 250 | 7 | 55 | 1.8 | 1155 |
| 18 | 2 | 0 | 0 | 0 | 50 | 250 | 7 | 55 | 3.56 | 860 |
| 19 | 0 | −2 | 0 | 0 | 40 | 230 | 7 | 55 | 3.21 | 742 |
| 20 | 0 | 2 | 0 | 0 | 40 | 270 | 7 | 55 | 2.20 | 1198 |
| 21 | 0 | 0 | −2 | 0 | 40 | 250 | 6 | 55 | 2.18 | 1042 |
| 22 | 0 | 0 | 2 | 0 | 40 | 250 | 8 | 55 | 3.25 | 875 |
| 23 | 0 | 0 | 0 | −2 | 40 | 250 | 7 | 45 | 3.37 | 752 |
| 24 | 0 | 0 | 0 | 2 | 40 | 250 | 7 | 65 | 2.52 | 1068 |
| 25 | 0 | 0 | 0 | 0 | 40 | 250 | 7 | 55 | 1.62 | 1224 |
| 26 | 0 | 0 | 0 | 0 | 40 | 250 | 7 | 55 | 1.65 | 1192 |
| 27 | 0 | 0 | 0 | 0 | 40 | 250 | 7 | 55 | 1.61 | 1225 |
| 28 | 0 | 0 | 0 | 0 | 40 | 250 | 7 | 55 | 2.0 | 1262 |
| 29 | 0 | 0 | 0 | 0 | 40 | 250 | 7 | 55 | 1.52 | 1229 |
| 30 | 0 | 0 | 0 | 0 | 40 | 250 | 7 | 55 | 1.58 | 1238 |
| S. No | Parameters | Notations | Units | Levels | ||||
|---|---|---|---|---|---|---|---|---|
| −2 | −1 | 0 | 1 | 2 | ||||
| 1 | Powder feed rate | F | gm/min | 30 | 35 | 40 | 45 | 50 |
| 2 | Oxygen flow rate | O | slpm | 230 | 240 | 250 | 260 | 270 |
| 3 | Spray Distance | S | Inch | 6 | 6.5 | 7 | 7.5 | 8 |
| 4 | LPG flow rate | L | slpm | 45 | 50 | 55 | 60 | 65 |
| Spray Trials | Microstructure for Porosity Analysis | Binary Image for Porosity Analysis | Microhardness Indentation |
|---|---|---|---|
| No:1 F = 35 gpm O = 240 lpm S = 6.5 Inch L = 50 lpm |  |  | 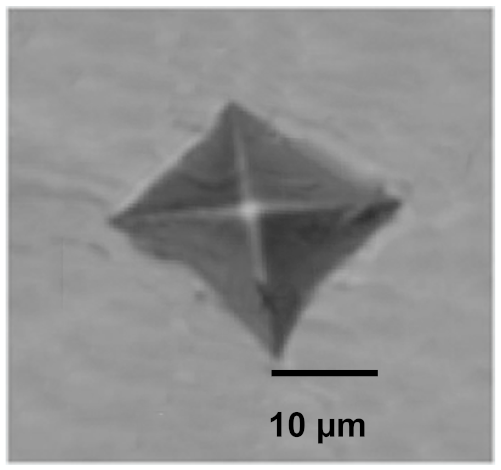 |
| No:2 F = 45 gpm O = 240 lpm S = 6.5 Inch L = 50 lpm |  |  | 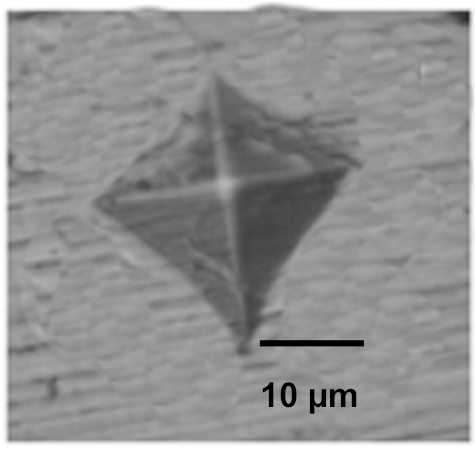 |
| No:3 F = 35 gpm O = 260 lpm S = 6.5 Inch L = 50 lpm |  |  |  |
| No:4 F = 45 gpm O = 260 lpm S = 6.5 Inch L = 50 lpm | 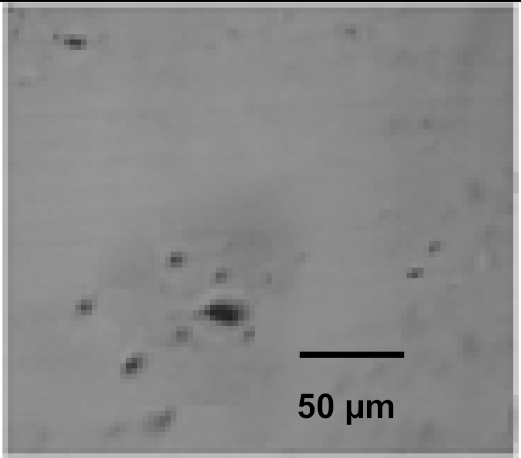 | 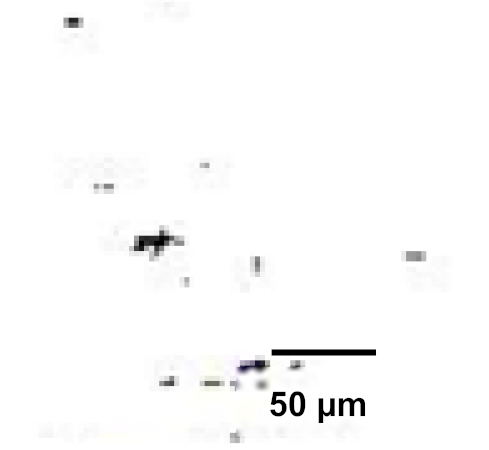 |  |
| No:5 F = 35 gpm O = 240 lpm S = 7.5 Inch L = 50 lpm |  | 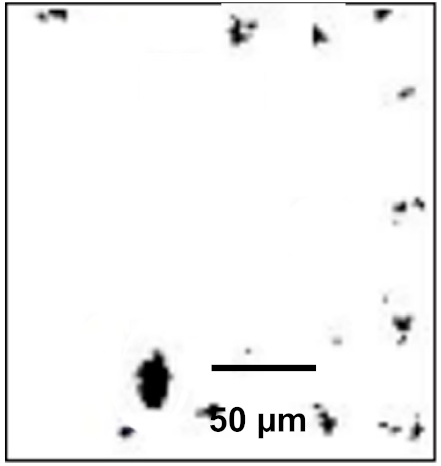 |  |
| No:6 F = 45 gpm O = 240 lpm S = 7.5 Inch L = 50 lpm | 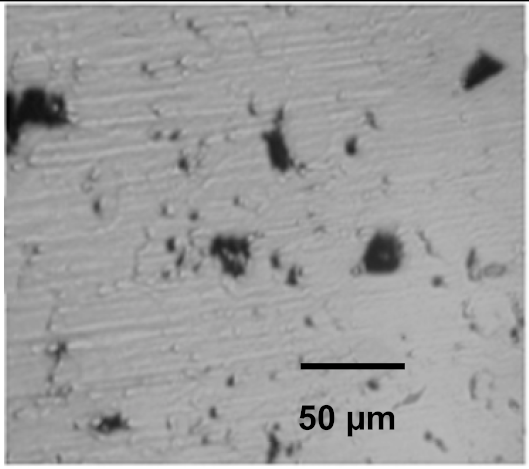 |  | 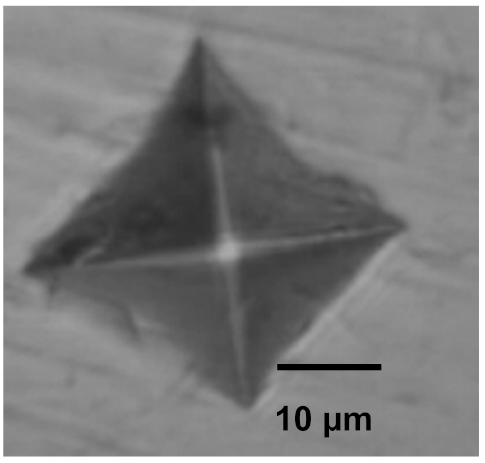 |
| No:7 F = 35 gpm O = 260 lpm S = 7.5 Inch L = 50 lpm |  |  | 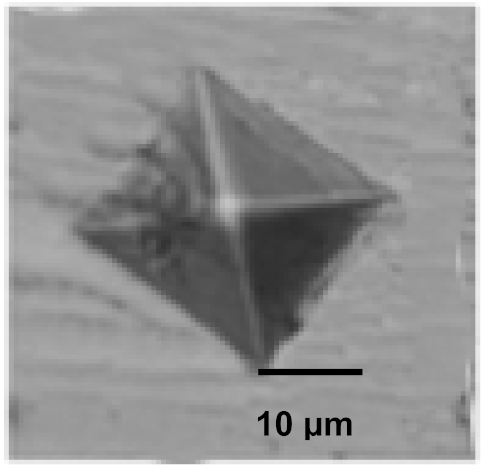 |
| No:8 F = 45 gpm O = 260 lpm S = 7.5 Inch L = 50 lpm | 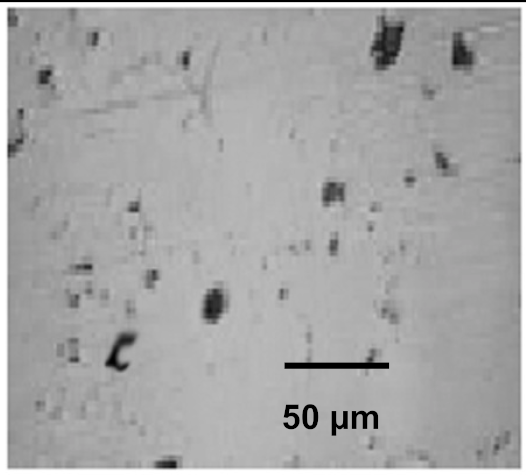 |  | 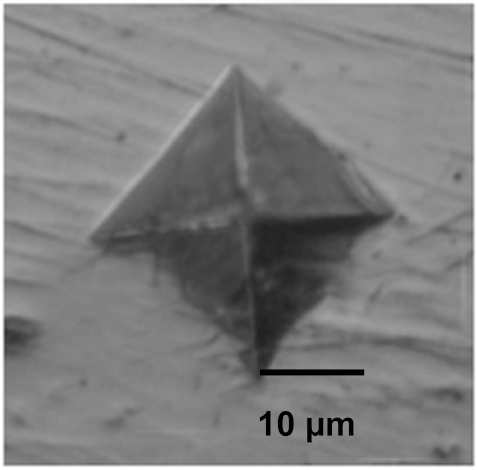 |
| No:9 F = 35 gpm O = 240 lpm S = 6.5 Inch L = 60 lpm |  | 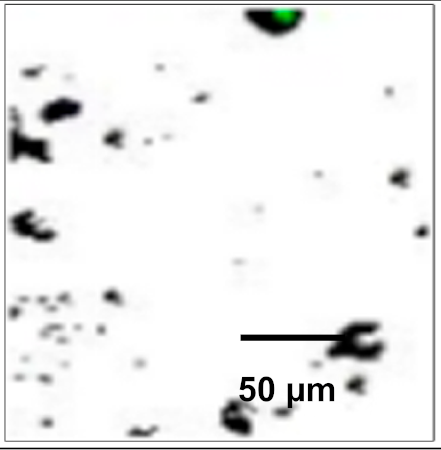 | 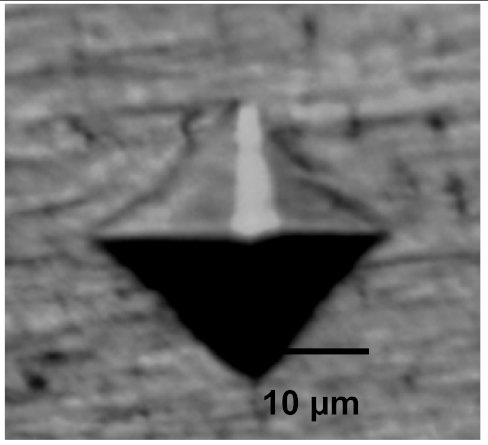 |
| No:10 F = 45 gpm O = 240 lpm S = 6.5 Inch L = 60 lpm | 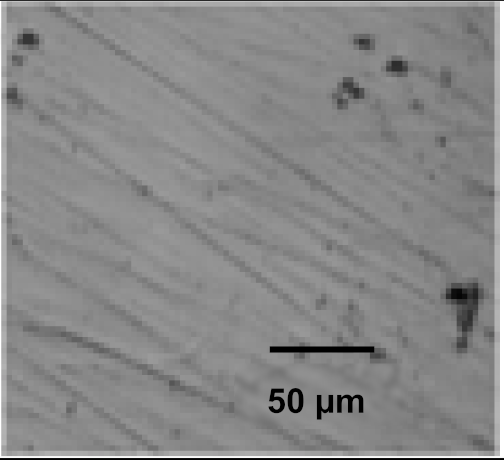 |  | 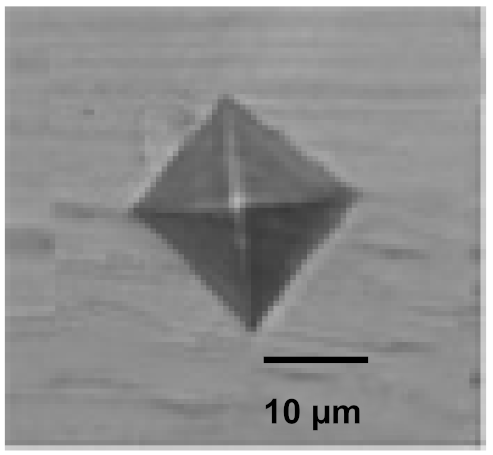 |
| No:11 F = 35 gpm O = 260 lpm S = 6.5 Inch L = 60 lpm | 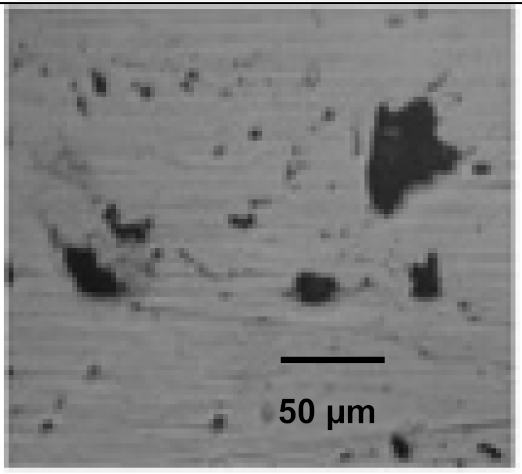 |  | 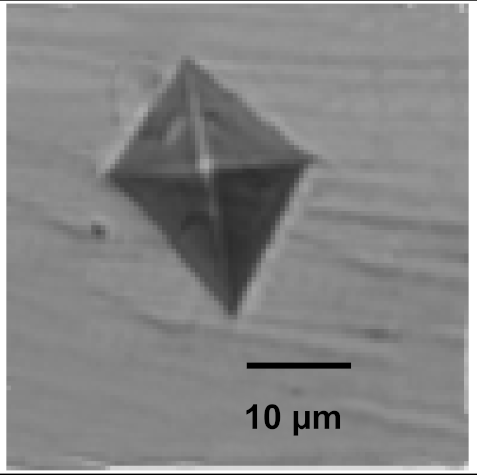 |
| No:12 F = 45 gpm O = 260 lpm S = 6.5 Inch L = 60 lpm | 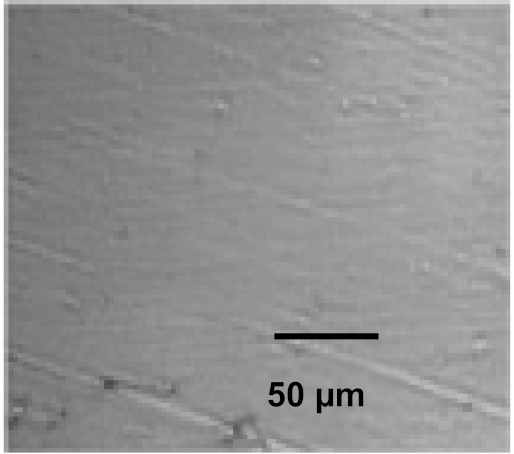 | 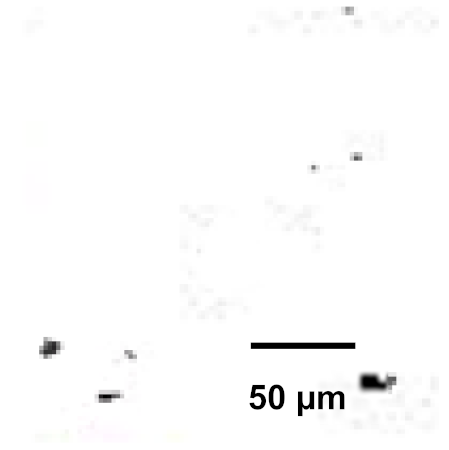 |  |
| No:13 F = 35 gpm O = 240 lpm S = 7.5 Inch L = 60 lpm |  | 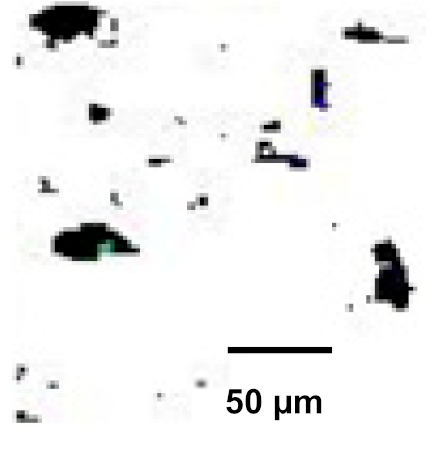 | 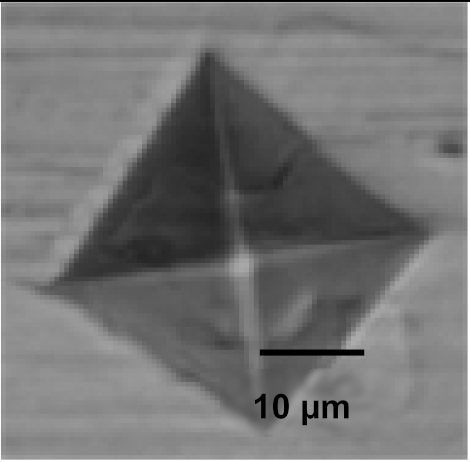 |
| No:14 F = 45 gpm O = 240 lpm S = 7.5 Inch L = 60 lpm | 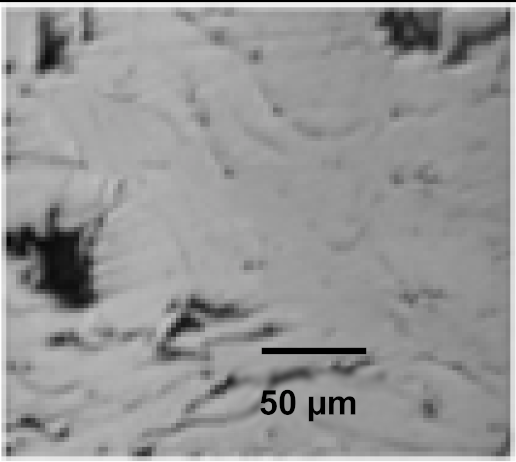 |  | 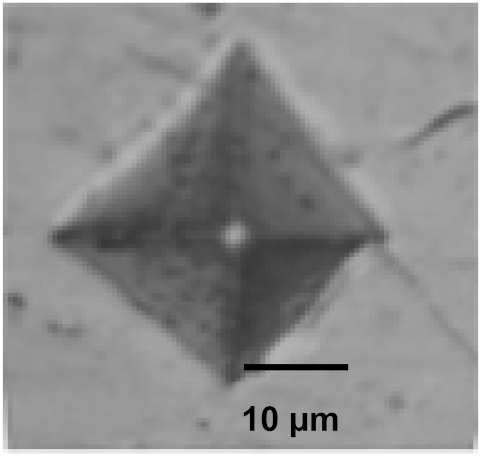 |
| No:15 F = 35 gpm O = 260 lpm S = 7.5 Inch L = 60 lpm | 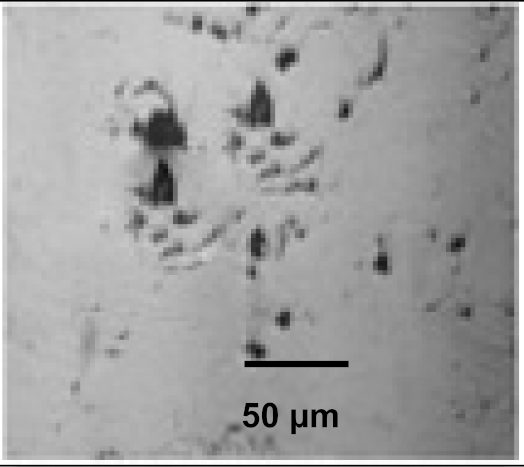 |  | 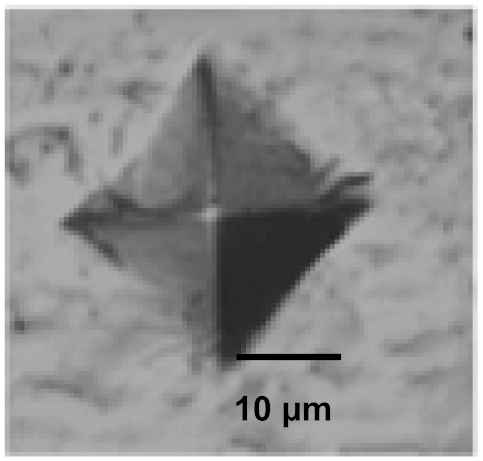 |
| No:21 F = 40 gpm O = 250 lpm S = 6 Inch L = 55 lpm | 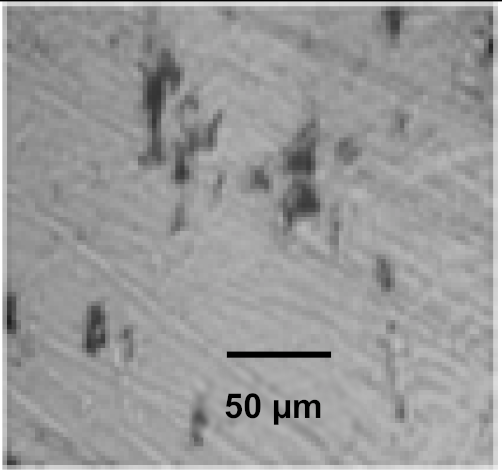 |  | 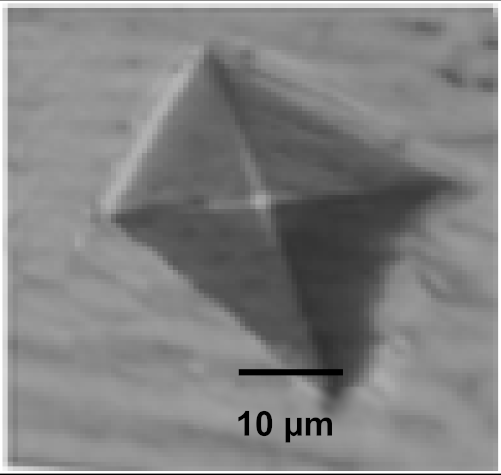 |
| No:22 F = 40 gpm O = 250 lpm S = 8 Inch L = 55 lpm | 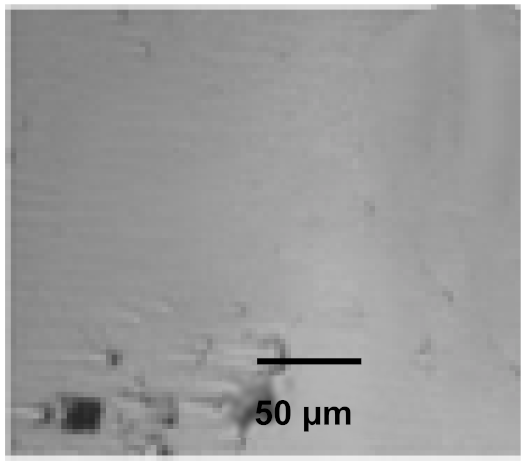 |  |  |
| No:23 F = 40 gpm O = 250 lpm S = 7 Inch L = 45 lpm | 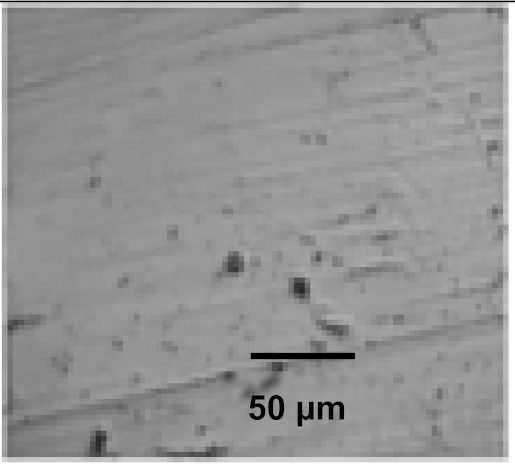 | 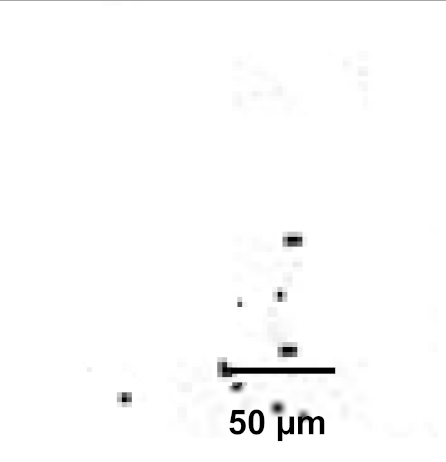 | 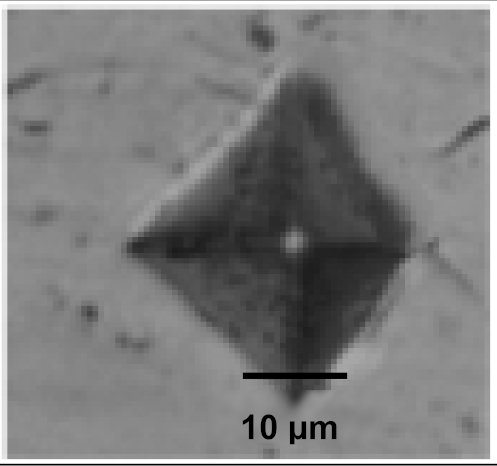 |
| No:24 F = 40 gpm O = 250 lpm S = 7 Inch L = 65 lpm |  | 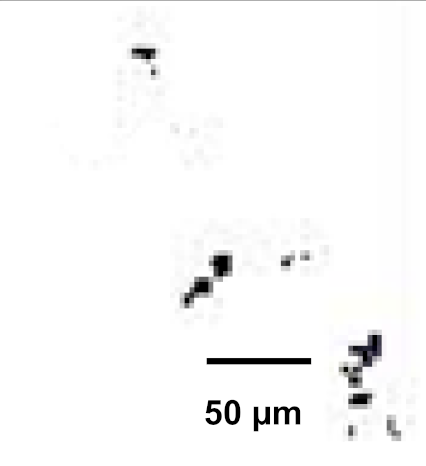 | 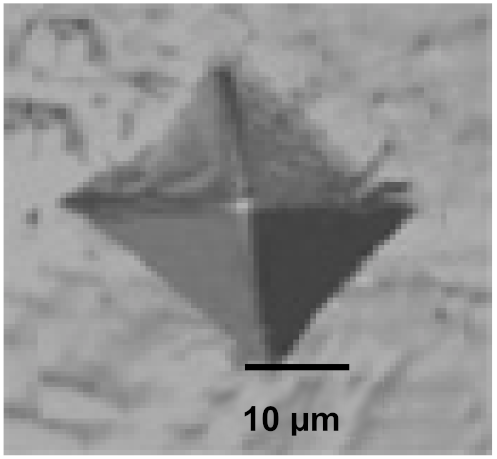 |
| No:25 F = 10 gpm O = 250 lpm S = 7 Inch L = 55 lpm |  |  | 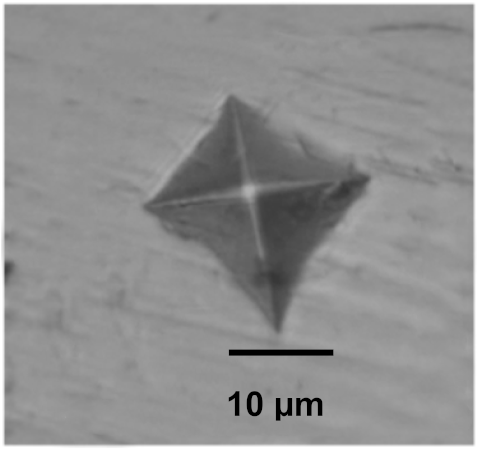 |
| No:26 F = 10 gpm O = 250 lpm S = 7 Inch L = 55 lpm | 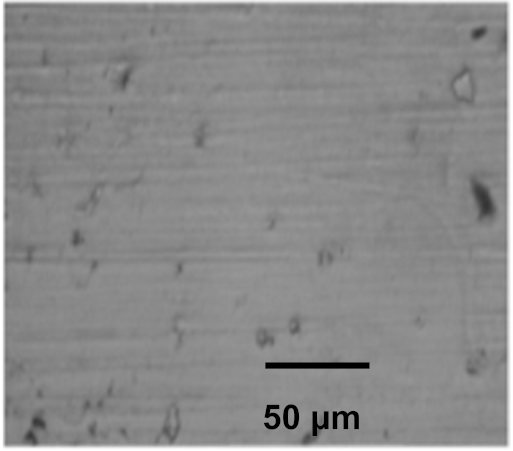 | 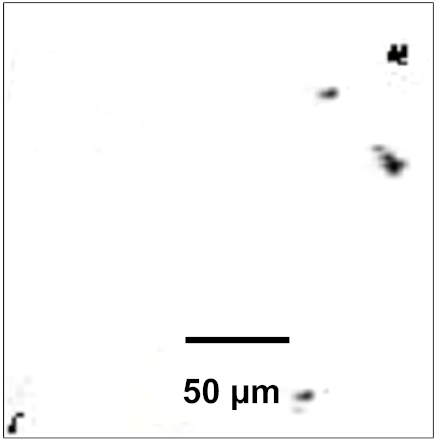 |  |
| Source | Sum of Squares | df | Mean Square | F-Value | p-Value | |
|---|---|---|---|---|---|---|
| Model | 14.36 | 14 | 1.03 | 10.35 | <0.0001 | Significant |
| F-powder feed rate | 1.12 | 1 | 1.12 | 11.33 | 0.0042 | |
| O-oxygen flow rate | 1.69 | 1 | 1.69 | 17.06 | 0.0009 | |
| S-spray distance | 2.2 | 1 | 2.2 | 22.23 | 0.0003 | |
| L-LPG flow rate | 0.3876 | 1 | 0.3876 | 3.91 | 0.0666 | |
| FO | 0.3813 | 1 | 0.3813 | 3.85 | 0.0686 | |
| FS | 0.5439 | 1 | 0.5439 | 5.49 | 0.0333 | |
| FL | 0.3221 | 1 | 0.3221 | 3.25 | 0.0915 | |
| OS | 0.6765 | 1 | 0.6765 | 6.83 | 0.0196 | |
| OL | 0.7966 | 1 | 0.7966 | 8.04 | 0.0125 | |
| SL | 0.1314 | 1 | 0.1314 | 1.33 | 0.2675 | |
| F2 | 0.0256 | 1 | 0.0256 | 0.2579 | 0.619 | |
| O2 | 1.81 | 1 | 1.81 | 18.25 | 0.0007 | |
| S2 | 1.84 | 1 | 1.84 | 18.61 | 0.0006 | |
| L2 | 3.89 | 1 | 3.89 | 39.3 | <0.0001 | |
| Residual | 1.49 | 15 | 0.0991 | |||
| Lack of fit | 1.34 | 10 | 0.134 | 4.6 | 0.053 | Not significant |
| Pure error | 0.1457 | 5 | 0.0291 | Cor total: corrected total | ||
| Cor total | 15.85 | 29 | PRESS: predicted error sum of squares | |||
| Std. dev = 37.94 | R2 = 0.9772 | df: degrees of freedom | ||||
| Mean = 1018.24 | Adj R2 = 0.9364 | CV: coefficient of variation | ||||
| C.V.% = 3.75 | Pred R2 = 0.8602 | F: Fisher’s ratio | ||||
| PRESS = 1.14 × 10⁵ | Adeq Precision = 18.155 | p: probability | ||||
| Source | Sum of Squares | df | Mean Square | F-Value | p-Value | |
|---|---|---|---|---|---|---|
| Model | 1.03 × 10⁶ | 14 | 73,333.46 | 43.07 | <0.0001 | Significant |
| F- powder feed rate | 1.43 × 10⁵ | 1 | 1.43 × 10⁵ | 84.04 | <0.0001 | |
| O- oxygen flow rate | 2.33 × 10⁵ | 1 | 2.33 × 10⁵ | 136.89 | <0.0001 | |
| S-spray distance | 6.17 × 10⁴ | 1 | 61,712.04 | 36.25 | <0.0001 | |
| L-LPG flow rate | 2.93 × 10³ | 1 | 2926.04 | 1.72 | 0.2096 | |
| FO | 5.88 × 10² | 1 | 588.06 | 0.3454 | 0.5655 | |
| FS | 7.94 × 10⁴ | 1 | 79,383.06 | 46.63 | <0.0001 | |
| FL | 5.44 × 10³ | 1 | 5439.06 | 3.19 | 0.0941 | |
| OS | 5.89 × 10⁴ | 1 | 5.89 × 10⁴ | 34.61 | <0.0001 | |
| OL | 2.58 × 10⁴ | 1 | 2.58 × 10⁴ | 15.18 | <0.0014 | |
| SL | 2.58 × 10⁴ | 1 | 2.58 x10⁴ | 15.18 | <0.0014 | |
| F2 | 4.65 × 10⁴ | 1 | 4.65 × 10⁴ | 27.32 | 0.0001 | |
| O2 | 1.07 × 10⁵ | 1 | 1.07 × 10⁵ | 62.54 | <0.0001 | |
| S2 | 1.17 × 10⁵ | 1 | 1.17 × 10⁵ | 68.44 | <0.0001 | |
| L2 | 2.58 × 10⁵ | 1 | 2.58 × 10⁵ | 151.75 | <0.0001 | |
| Residual | 2.55 × 10⁴ | 15 | 1.70 × 10³ | |||
| Lack of fit | 2.30 × 10⁴ | 10 | 2.30 × 10³ | 4.45 | 5.65 × 10⁻² | Not significant |
| Pure error | 2.58 × 10³ | 5 | 5.15 × 10² | Cor total: corrected total | ||
| Core total | 1.05 × 10⁶ | 29 | PRESS: predicted error sum of squares | |||
| Std. dev = 37.93 | R2 = 0.9771 | df: degrees of freedom | ||||
| Mean = 1018.23 | Adj R2 = 0.9364 | CV: coefficient of variation | ||||
| C.V.% = 3.73 | Pred R2 = 0.8602 | F: Fisher’s ratio | ||||
| PRESS = 1.147 × 10⁵ | Adeq Precision = 18.155 | p: probability | ||||
| Expt.No | HVOF Spray Parameters | Coating Porosity (Vol%) | Coating Microhardness (HV) | |||||||
|---|---|---|---|---|---|---|---|---|---|---|
| Powder Feed Rate (gm/min) | Oxygen Flow Rate (slpm) | Spray Distance (inch) | LPG Flow Rate (slpm) | By Experiment | By Modal | Variation (%) | By Experiment | By Modal | Variation (%) | |
| 1 | 30 | 230 | 6 | 50 | 1.55 | 1.6 | +3.13 | 1222 | 1276 | +4.23 |
| 2 | 35 | 250 | 7 | 55 | 1.86 | 1.8 | −2.78 | 1186 | 1202 | +1.33 |
| 3 | 45 | 270 | 8 | 60 | 2.2 | 2.1 | −4.76 | 1310 | 1255 | −4.38 |
| Expt.No. | HVOF Spray Parameters | Coating Porosity (Vol%) | Coating Microhardness (HV) | |||
|---|---|---|---|---|---|---|
| Powder Feed Rate (gm/min) | Oxygen Flow Rate (slpm) | Spray Distance (inch) | LPG Flow Rate (slpm) | |||
| 1 | 48 | 247 | 6 | 54 | 1.3 | 1267 |
| 2 | 45 | 244 | 5.5 | 51 | 1.9 | 1061 |
| 3 | 51 | 250 | 6.5 | 57 | 2.3 | 900 |
Publisher’s Note: MDPI stays neutral with regard to jurisdictional claims in published maps and institutional affiliations. |
© 2022 by the authors. Licensee MDPI, Basel, Switzerland. This article is an open access article distributed under the terms and conditions of the Creative Commons Attribution (CC BY) license (https://creativecommons.org/licenses/by/4.0/).
Share and Cite
Rajendran, P.R.; Duraisamy, T.; Chidambaram Seshadri, R.; Mohankumar, A.; Ranganathan, S.; Balachandran, G.; Murugan, K.; Renjith, L. Optimisation of HVOF Spray Process Parameters to Achieve Minimum Porosity and Maximum Hardness in WC-10Ni-5Cr Coatings. Coatings 2022, 12, 339. https://doi.org/10.3390/coatings12030339
Rajendran PR, Duraisamy T, Chidambaram Seshadri R, Mohankumar A, Ranganathan S, Balachandran G, Murugan K, Renjith L. Optimisation of HVOF Spray Process Parameters to Achieve Minimum Porosity and Maximum Hardness in WC-10Ni-5Cr Coatings. Coatings. 2022; 12(3):339. https://doi.org/10.3390/coatings12030339
Chicago/Turabian StyleRajendran, Pradeep Raj, Thirumalaikumarasamy Duraisamy, Ramachandran Chidambaram Seshadri, Ashokkumar Mohankumar, Sathiyamoorthy Ranganathan, Guruprasad Balachandran, Kaliyamoorthy Murugan, and Laxmi Renjith. 2022. "Optimisation of HVOF Spray Process Parameters to Achieve Minimum Porosity and Maximum Hardness in WC-10Ni-5Cr Coatings" Coatings 12, no. 3: 339. https://doi.org/10.3390/coatings12030339
APA StyleRajendran, P. R., Duraisamy, T., Chidambaram Seshadri, R., Mohankumar, A., Ranganathan, S., Balachandran, G., Murugan, K., & Renjith, L. (2022). Optimisation of HVOF Spray Process Parameters to Achieve Minimum Porosity and Maximum Hardness in WC-10Ni-5Cr Coatings. Coatings, 12(3), 339. https://doi.org/10.3390/coatings12030339