Article

Formation Mechanism and Weights Analysis of Residual Stress Holes in E690 High-Strength Steel by Laser Shock Peening

1
School of Mechanical Engineering, Nantong University, Nantong 226019, China
2
COSCO (Nan Tong) Shipyard Co. Ltd., Nantong 226017, China
*
Author to whom correspondence should be addressed.
Coatings 2022, 12(2), 285; https://doi.org/10.3390/coatings12020285
Submission received: 11 January 2022 / Revised: 17 February 2022 / Accepted: 18 February 2022 / Published: 21 February 2022

Abstract

:
To investigate the surface residual stress hole formation mechanism induced by laser shock peening (LSP) in an E690 high-strength steel sheet and to assign weights to the relevant causes; E690 steel samples were loaded using four laser beams with different power densities. The dynamic strain in thin plate samples was measured using a polyvinylidene fluoride piezoelectric sensor during LSP and the residual stress distributions on thin- and thick-plate samples were studied using an X-ray stress analyzer. The residual stress distribution of the simulated laser shock E690 high-strength steel sheet was consistent with that of the measured residual stress field, and the propagation pattern induced by a pulsed laser shock wave obtained via simulation shows good consistency with the surface dynamic strain test results. A shock wave propagation model was established for E690 high-strength steel sheets. At laser power densities of 1.98 and 2.77 GW/cm2, the residual stress fields obtained through simulations and experiments show the residual stress hole phenomenon. The combined effect of the shock wave, which is reflected back and forth, and the rarefaction waves that converge toward the center produced the residual stress hole phenomenon, and shock wave reflection has a slightly greater impact than surface rarefaction wave convergence on the residual stress holes on the material’s surface. When the laser power density is 4.07 GW/cm2, the maximum residual principal stress is distributed uniformly.

Graphical Abstract

1. Introduction

As the world’s offshore oil and gas development efforts expand into the deep sea and polar regions, E690 high-strength steel, which is an important offshore steel, is mainly used to manufacture pile legs of jack-up offshore engineering platforms. The pile legs undertake the task of lifting and lowering the offshore platform during the operation preparation and completion, as well as the task of supporting the hull and auxiliary equipment under normal or survival conditions [1,2,3]. The pile leg lifting mechanisms are under a heavy-duty environment for a long time during service. Simultaneously, the load of the hull deck is transmitted to the pile leg structure through the lifting device, and the pile leg will bear the combined cycle of many loads. Under these extreme conditions, the lifting mechanism is prone to friction, wear, and stress corrosion, and this represents a serious threat to the safety of offshore platforms [4,5].
Laser shock peening (LSP) is a new material surface strengthening technology that applies high-energy laser beams to load the absorption layers of metal surfaces; using the mechanical effect of the resulting shock wave, local plastic deformation and compressive residual stress are produced on the material’s surface to improve its surface properties [6,7,8,9]. When compared with traditional strengthening methods such as shot peening, low plasticity burnishing, and surface alloying, use of LSP helps to form deeper compressive residual stress layers with depths of 1–2 mm, which are 5–10 times the depths of the corresponding layers by shot peening. LSP also enables refinement of the surface grains of the material and even enables the generation of nanocrystals, thereby improving the material’s resistance to corrosion and fatigue [10,11,12]. At present, a circular flat top light beam with a flat top spot energy distribution is mostly used in LSP [13,14]. The compressive residual stress distribution on the surfaces of the metal samples after LSP is not uniform and there is often a lack of residual stress at the center of the spot.
Peyre et al. [15] found that a residual stress hole formed in 7075 aluminum alloy after LSP, but the specific reason for the hole’s formation was not explained because of the limitations of the research conditions. Jiang et al. [16] studied the residual stress field on the material surface through numerical simulations. Nie et al. [17] carried out numerical simulations of the LSP of a single circular Gaussian spot using ABAQUS finite element software. Their simulations showed that the secondary plastic deformation that occurs after the shock wave loading-induced plastic deformation is the main reason for residual stress hole formation. Cao et al. [18] used polyvinylidene fluoride (PVDF) piezoelectric sensors to measure the dynamic strain of a 7050 aluminum alloy surface under the action of a pulsed laser beam, and they then established a dynamic strain model of the 7050 aluminum alloy surface when loaded using pulsed laser shock waves. Sun et al. [19] used the finite element method (FEM) to predict the residual stress distribution of a material after laser shock peening and proposed that the residual stress hole was the result of reverse plastic deformation. Dung et al. [20] demonstrated the excellent capability of PVDF piezoelectric sensors for dynamic strain induced by shock loads. Ali et al. [21] monitored the dynamic strain process and damage progress of woven carbon fiber laminates under fatigue loading based on PVDF sensors. To date, researchers have performed a great deal of research on the reasons for the residual stress holes on the surfaces of LSPed materials. However, when the dynamic strain characteristics of the material’s surface and back during LSP were considered, few researchers reported on the effects of the surface rarefaction waves and the reflected waves induced by the laser shock on residual stress hole formation, or on the weighting of these factors from a multiple wave propagation perspective.
In this study, E690 steel samples were loaded using laser beams with different power densities of 1.53, 1.98, 2.77, and 4.07 GW/cm2. ABAQUS software was used to simulate the LSP of the E690 high-strength steel samples. The residual stress distributions on the sample surfaces were measured using an X-ray stress analyzer to verify the reliability of the proposed model. A PVDF sensor was used to measure the dynamic strain properties of the sample during LSP. In combination with the simulation results, the propagation and attenuation behavior of the shock wave and the dynamic deformation of the material during the shock process were studied. The formation mechanism of the residual stress field in E690 high-strength steel after laser shock wave loading was studied and provided both a theoretical basis and technical support for quantitative control of the surface compressive stress distribution of E690 high-strength steel.

2. Numerical Simulation

2.1. Finite Element Model

To ensure the accuracy and quality of the computation while also reducing the calculation time required, a one-quarter three-dimensional finite element model with dimensions of 5 mm × 5 mm × 1.5 mm was established. Because of the large variations in the residual stress in the depth direction, and to study the propagation law of the shock wave in the sample more accurately, the mesh size in the depth direction was set at 0.03 mm, the mesh size on the impact zone was set at 0.05 mm, and the mesh size of the remaining elements was 0.07 mm; the number of mesh elements was approximately 268,650, and the mesh cell type was C3D8R. Symmetrical constraints were imposed on the two symmetry planes in the middle of the model and the bottom surface was fully constrained. Figure 1 shows a three-dimensional axisymmetric finite element model. At the same time, a path was set in the radial direction from the impact area surface and the shock wave transmission data during LSP were extracted every 10 ns.

2.2. Material Definition

The Johnson-Cook (J-C) model is widely used in the simulation of high strain rate phenomena such as high-speed shock and explosion shock. The temperature effect during the material strengthening process is not considered during LSP, which means that the J-C model [22] can be simplified as follows:
σ = ( A + B ε n ) [ 1 + C ln ( ε . ε 0 . ) ]
In this equation, σ is the flow stress, A is the initial yield strength, B is the strain hardening coefficient, n is the strain hardening index, and C is the strain hardening factor; ε is the plastic strain, ε . is the strain rate, and ε 0 . is the strain rate under a quasi-static. The mechanical performance parameters of E690 high-strength steel and the parameters used in the J-C model are shown in Table 1 [23], where ρ is the density and E is the Young’s modulus of the material.

2.3. Loading of Laser Shock Pressure

When the shock wave pressure is large enough, the material yields and enters plasticity. The stress–strain relationship of the ideal plastic material is located on the yield surface, which satisfies the plastic stress–strain relationship. The duration of laser shock wave is very short, and its plastic wave propagation process can be approximately analyzed by one-dimensional strain process [24]. Under the condition of one-dimensional strain shock compression, the normal stress when the material yields σx is called the Hugoniot elastic limit (HEL), and is represented by σHEL [25].
σ x = σ HEL = K ε HEL + 2 3 Y 0 = ( K + 4 3 G ) ε HEL
where σ0 is the yield stress of the material. The strain of the material at the HEL can be calculated using the following equations:
ε HEL = σ 0 2 G
According to Equations (2) and (3) we can obtain Equation (4) as follows:
σ HEL = [ K 2 G + 2 3 ] σ 0
K = λ + 2 3 μ = E 3 ( 1 2 ν )
G = μ = E 2 ( 1 + ν )
where K is the bulk modulus, G is the shear modulus, σ0 is the yield strength, and λ and μ are Raman constants. According to Equations (5) and (6), K = 175 GPa and G = 91 GPa, respectively. In Equation (4), σ0 = 690 MPa, and the HEL of σHEL = 1123 MPa can thus be calculated. Using the empirical formula for laser shock wave peak pressure that was derived by Fabbro [26], where the internal energy conversion coefficient α is 0.2, Z is the equivalent acoustic impedance of the substrate and the constraining layer, which is taken to be 0.455 × 10⁶ g·cm−2·s−1, and I0 is the laser power density (GW/cm2), P is the peak pressure of the shock wave and is given by:
P = 0.01 α 2 α + 3 Z I 0
By considering the interaction mechanism between the laser shock wave and the material, the analysis steps are set to be dynamic shock analysis and static rebound analysis. The dynamic analysis step time is set at 4000 ns, which is much longer than the shock wave loading time. The action time of the laser-induced shock wave is approximately two to three times the pulse width [27]; the laser pulse width is 10 ns, and the shock wave action time is set at 30 ns based on simulations. The pressure curve of the laser shock wave loading process is shown in Figure 2.

3. Experimental Scheme Design

US-made E690 high-strength steel was used and its chemical composition and some of its mechanical properties are shown in Table 2. The E690 high-strength steel was processed into samples with dimensions of 50 mm × 50 mm × 2 mm and 50 mm × 50 mm × 50.5 mm via wire cutting. The front and back sides of the samples were polished using 240–1200 mesh sandpaper and the thicknesses of the samples were polished to 1.5 and 50 mm, respectively. The samples were cleaned using anhydrous ethanol and then dried. The experiment used a YAG solid-state pulsed laser (Gaia-R series, THALES, Paris, France) with a pulse width of 10 ns, a wavelength of 1064 nm, a spot diameter of 5 mm, and laser energies of 3, 3.89, 5.43, and 8 J. A 0.1 mm thick 3M aluminum film was used as the absorption layer and K9 glass was used as the constrained layer.
The PVDF piezoelectric sensors were pasted at the center of the spot on the back of the specimen and 3 mm away from the spot center on the surface of the sample. Figure 3 shows a schematic diagram of the dynamic strain detection device used for the laser shock samples. The dimensions of the PVDF sensor were 5 mm × 10 mm × 30 μm. The sensor uses a photodiode to receive the laser beam, which acts as the trigger signal for the oscilloscope. The oscilloscope adopts the DL9140 digital oscilloscope (YOKOGAWA, Tokyo, Japan), which is used to detect the piezoelectric signal from the PVDF piezoelectric sensor in real time. According to the theory of stress wave, the stress wave induced by laser beam is reflected back and forth in E690 high strength-steel sample. When the shock wave propagates to the surface and back of the sample, a voltage pulse will be generated on the PVDF piezoelectric sensor and outputs this signal in the form of a voltage–time curve.
An X-ray stress analyzer (LXRD type, Proto, Ottawa, Canada) was used to measure the residual stress distribution on the surface of the impact area. The five measurement points are located along the same diameter of the laser shock spot, as illustrated in Figure 4. Each measurement point was measured once in each of the three directions of 0°, 45°, and 90°. The test parameters were selected as follows: collimating tube diameter: 1 mm; target material: Cr target; Bragg angle: 156°; crystal face type: (211); tube voltage: 30 kV; tube current: 25 mA; and exposure time: 15 s.
To study the residual stress distribution characteristics of the laser shock-strengthened area, three mutually perpendicular forces within the principal stress space at this point are used to express the stress in any direction. Using the two-dimensional stress analysis method and the element body stress–strain model, the following calculation formula for the principal stress vector can be obtained [28].
tan 2 α = ( σ 0 + σ 90 2 σ 45 ) σ 0 σ 90
σ max = 0.5 [ ( σ 0 σ 90 ) 2 + ( σ 0 + σ 90 2 σ 45 ) 2 + σ 0 + σ 90 ]
σ min = 0.5 [ σ 0 + σ 90 ( σ 0 σ 90 ) 2 + ( σ 0 + σ 90 2 σ 45 ) 2 ]
where α is the principal stress direction angle, σ0, σ45, and σ90 are the residual stress values in the 0°, 45°, and 90° directions from the measuring point, respectively, σmax is the maximum principal stress, and σmin is the minimum principal stress.
The sample after LSP was made into transmission electron microscope (TEM) film samples by wire cutting, manual grinding, dimple grinding, and ion thinning. The microstructure of the film samples was observed by field emission high-resolution transmission electron microscope (TECNAI G2 F20, FEI company, Hillsboro, OR, USA).

4. Results Analysis and Discussion

4.1. Surface Residual Stress Distribution after LSP with Different Laser Power Densities

The stress wave forms a stable residual stress field inside the model after multiple reflections. 
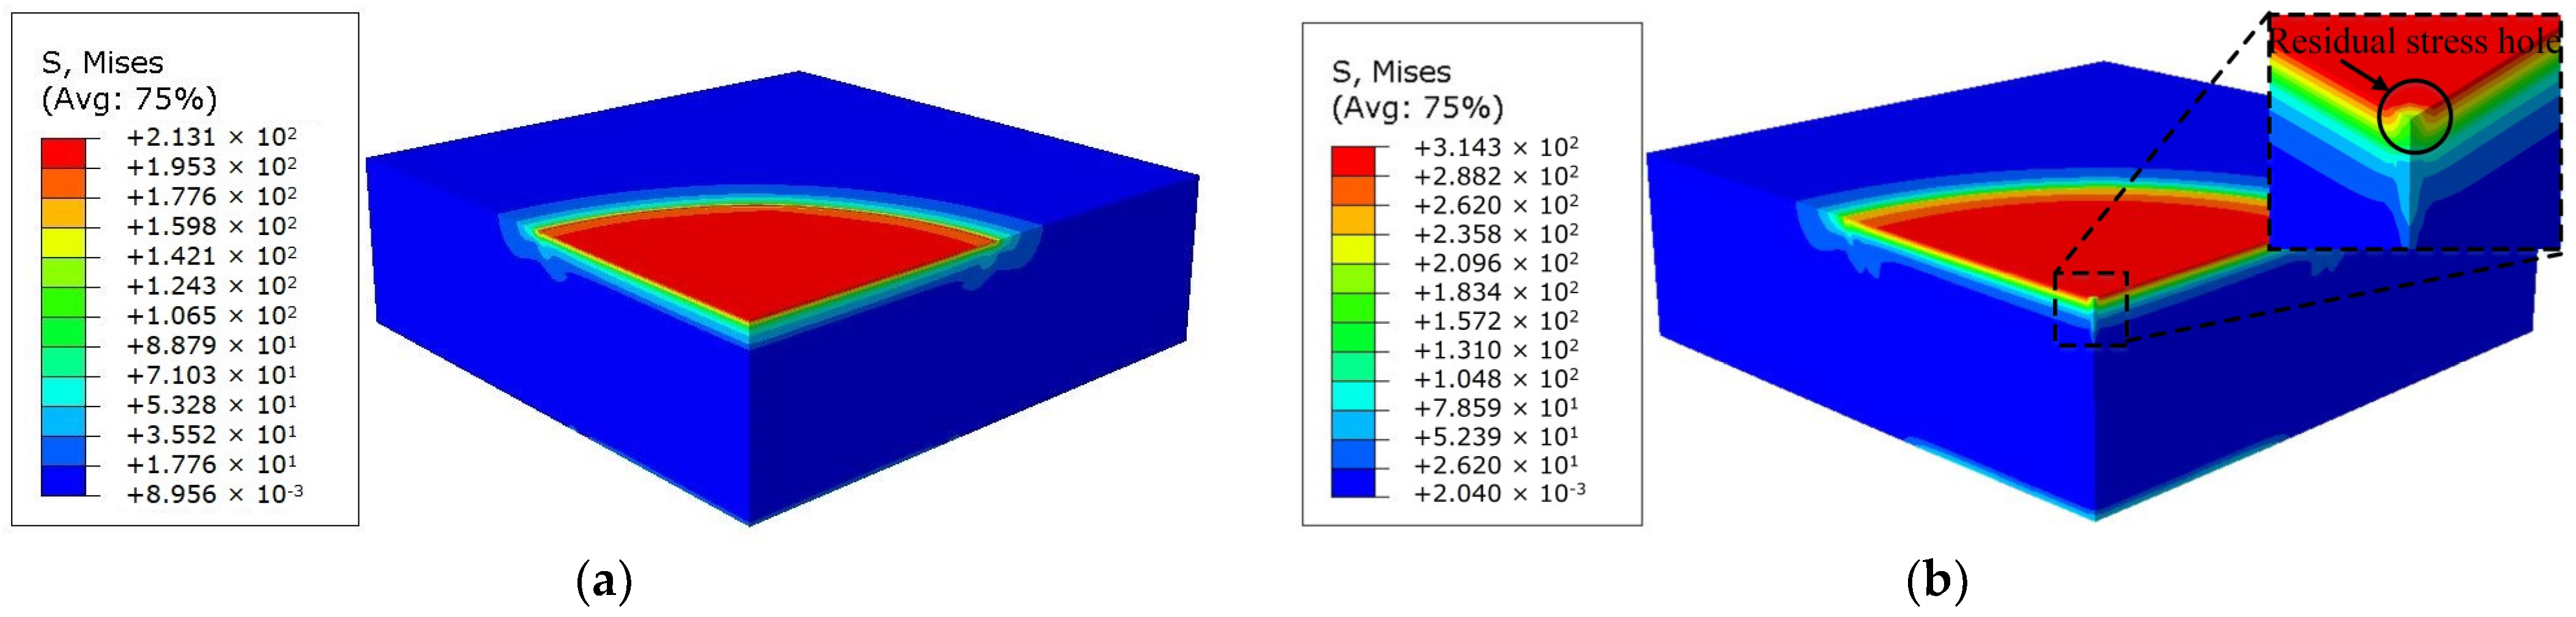
Figure 5 shows the equivalent stress nephogram of the E690 high-strength steel model when loaded with the different laser power densities after springback deformation analysis. When the laser power density is 1.53 GW/cm2, the peak pressure of the LSP is approximately 2000 MPa, which is 1.78 times the HEL for E690 high-strength steel, and no residual stress hole is visible on the material surface shown in Figure 5a. Figure 5b shows that when the laser power density increases to 1.98 GW/cm2, the peak pressure is approximately 2.2 times the HEL for E690 high-strength steel, and a residual stress hole has appeared at the center of the spot. Figure 5c,d shows that when the laser power density is increased to 2.77 and 4.07 GW/cm2, respectively, the peak pressure of LSP greatly exceeds the HEL for E690 high-strength steel, and the residual stress hole phenomenon appears at the center of the light spot.
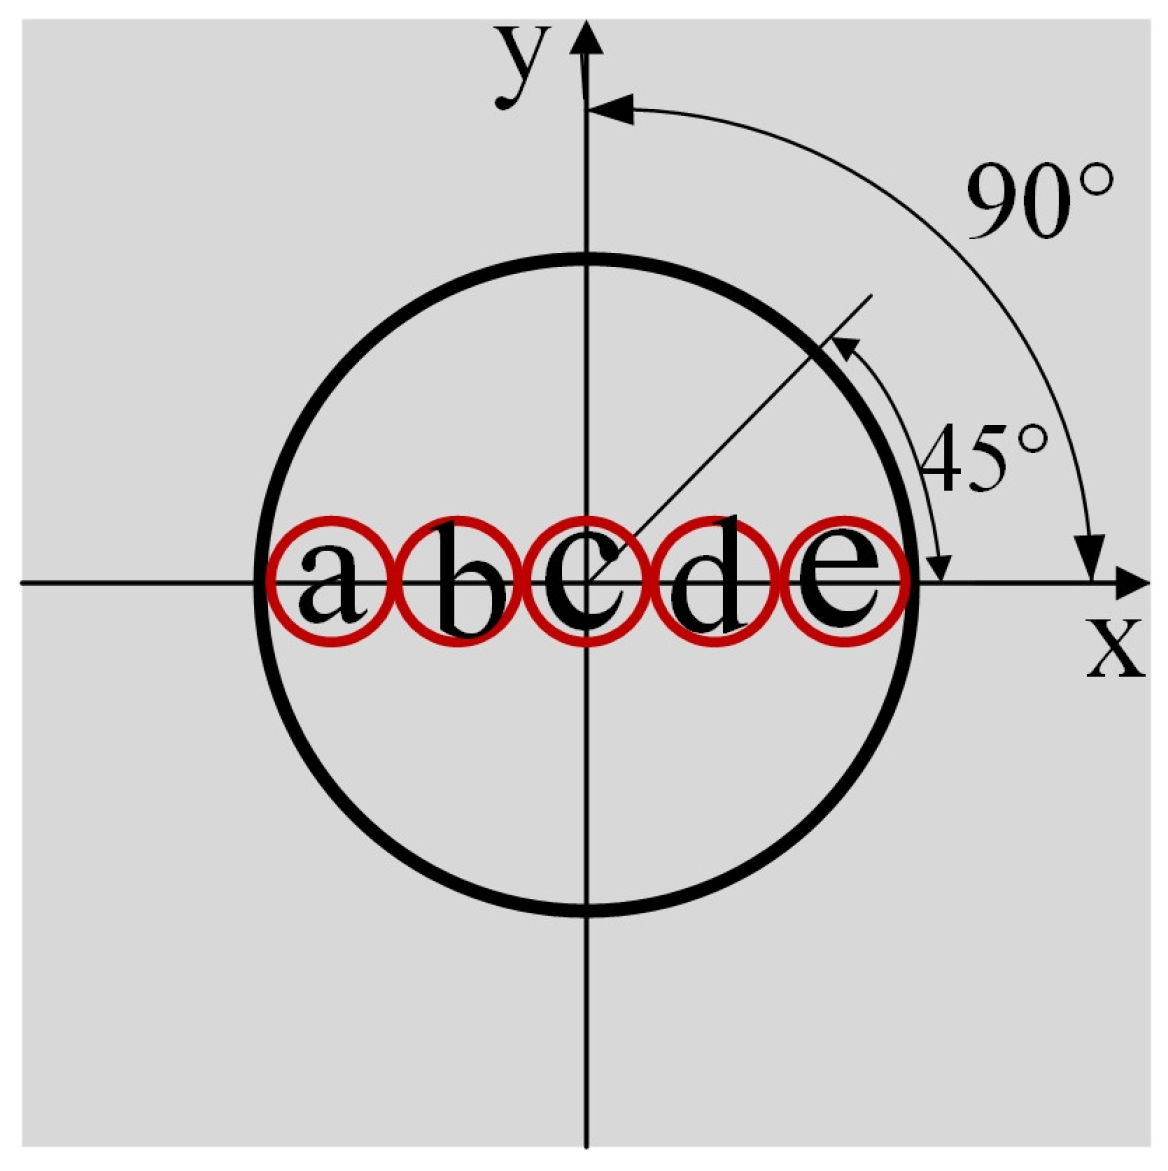
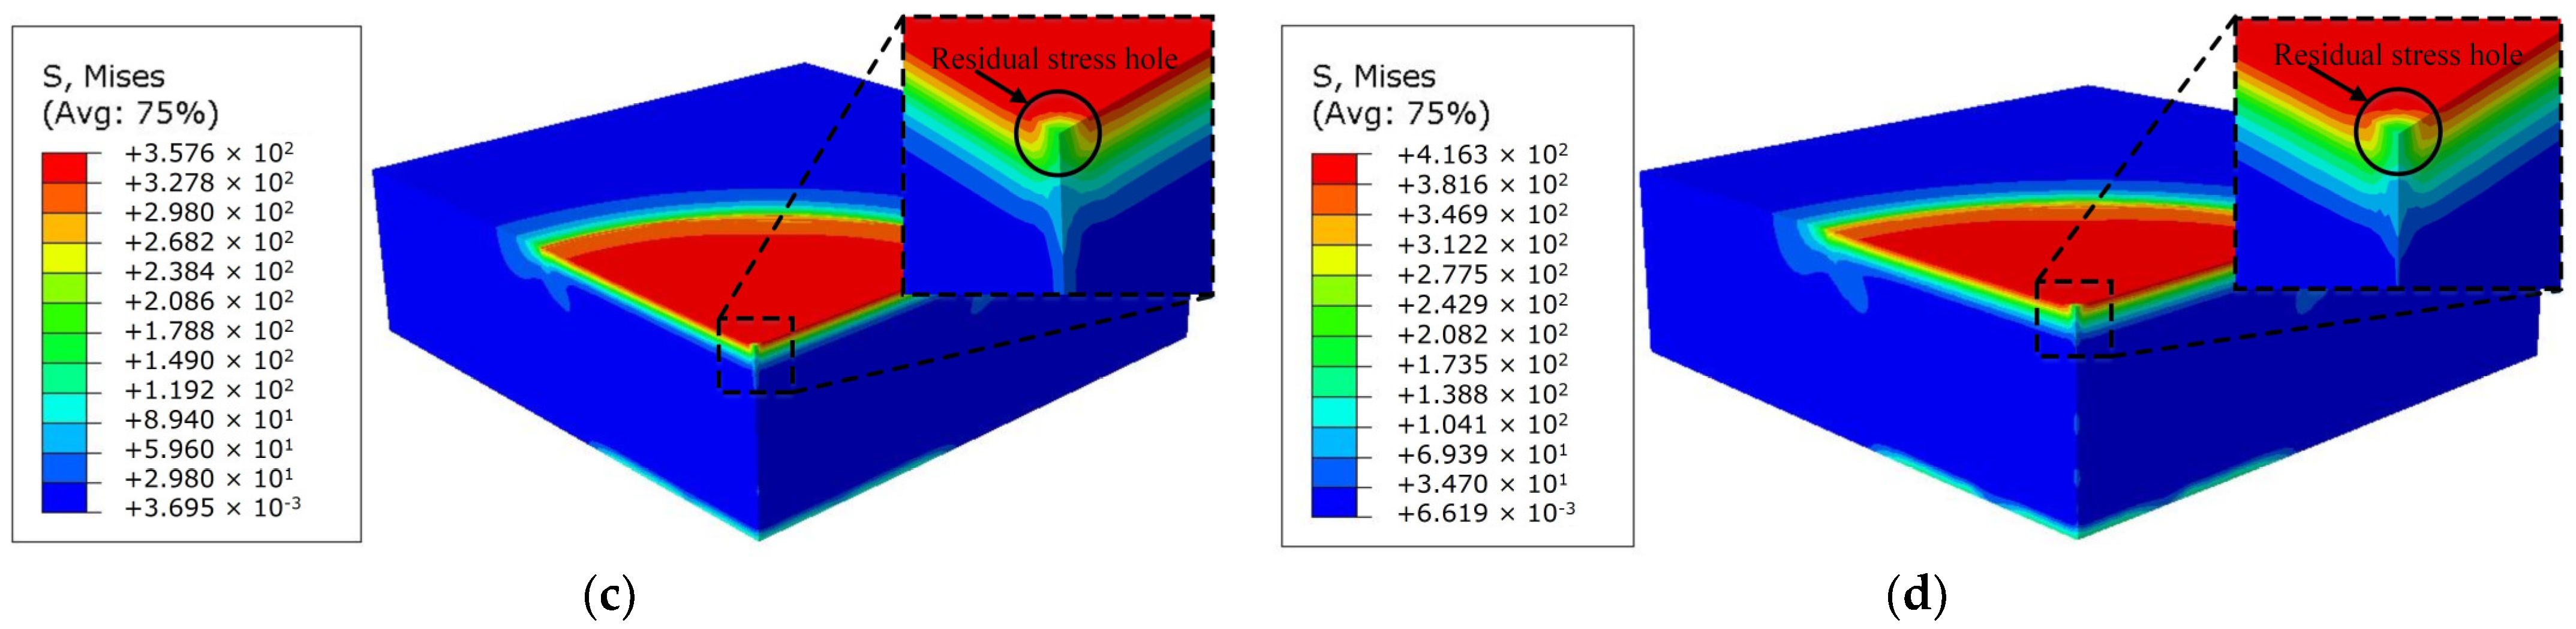
The X-ray stress analyzer is used to measure the surface residual stresses at 0°, 45°, and 90° at five measuring points along the same diameter across the LSPed region. Using the test results and by combining Equations (8)–(10), the residual principal stress values and the direction angle can be obtained, i.e., σmax, σmin, and α, respectively. The residual principal stress distributions and the direction angles along the same diameter of the LSPed region under the different laser power densities are illustrated in Figure 6. When the laser power density is 1.53 GW/cm2, the maximum residual principal stress curve shows little change, while the principal stress direction angle curve changes considerably, thus indicating that the principal stress direction angle distribution is relatively dispersed and that the stress concentration is not easy to form. When the laser power density is 1.98 GW/cm2, the surface residual stress in the LSPed region is compressive stress, and the maximum compressive residual stress does not appear at the center of the spot; this results in a residual stress hole, and the change in the principal stress direction angle curve is large, which means that it is not easy to produce a stress concentration. When the laser power density increases to 2.77 GW/cm2, the compressive residual stress at the spot center is reduced further, and the residual stress hole phenomenon becomes more obvious. The principal stress direction angle curve changes greatly, and it is not easy for stress concentration to occur. When the laser power density is 4.07 GW/cm2, the maximum residual principal stress is compressive stress and is distributed uniformly, while the angle of the principal stress direction changes greatly.
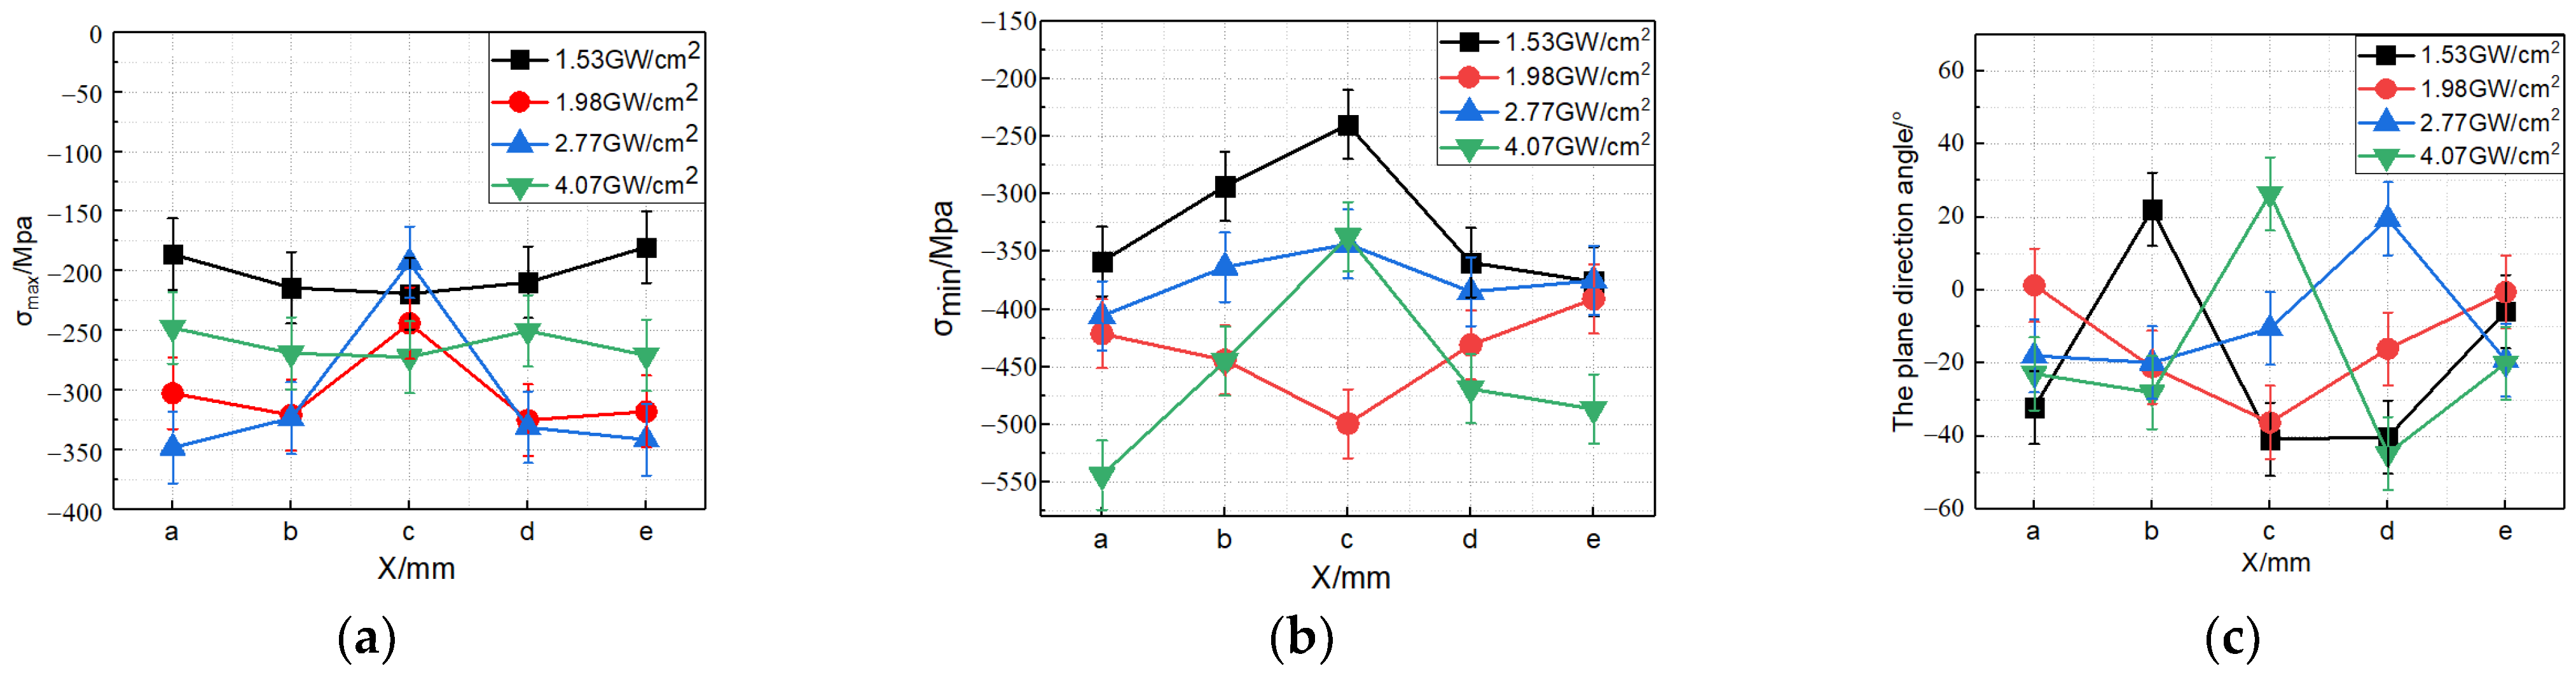
Figure 7 shows a comparison of the experimental and simulated results for the surface residual stresses after the surfaces were shocked with the different laser power densities. From Figure 7a, when the laser power density is 1.53 GW/cm2, the maximum residual stress obtained via the simulation is −211.79 MPa, the maximum residual stress measured experimentally is −219.01 MPa, and both maxima appear at the center of the spot. The residual stress value at a distance of 1 mm from the spot center is −209.51 MPa and the residual stress at a distance of 2 mm from the spot center is −180.02 MPa, as measured in the experiments. The residual stress value obtained from the experiments is similar to the simulated value; the simulated results after LSP also show good agreement with the experimental data.
Figure 7b shows that when the laser power density is 1.98 GW/cm2, the simulated residual stress value at the spot center drops to −229.88 MPa, and the residual stress field is distributed symmetrically, a residual stress hole is generated at the center of the spot. The experimental results show that the residual stress values measured at the spot center and 1 and 2 mm away from the spot center are −243.79, −324.84, and −317.7 MPa, respectively. The compressive residual stress value at the center of the spot is lower than that at the two sides, which means that the residual stress hole appears. The residual stress values measured during the experiments are similar to the simulated values, and the simulation results also show good agreement with the experimental data. Figure 7c shows that when the laser power density is 2.77 GW/cm2, the compressive residual stress value at the center of the spot obtained via the simulations and the experiments is reduced further, but the compressive residual stress on both sides of the laser spot is higher than that when the power density is 1.98 GW/cm2. The experimental residual stress is similar to the simulated value, and the simulation results again show good agreement with the experimental data. When the laser power density reaches 4.07 GW/cm2, there is a certain error between the simulation results and the experimental results, as shown in Figure 7d. The reason for this error is that the established material model represents an ideal case of isotropy and the sample material cannot be an isotropic medium [29]; when the laser power density increases, the plastic deformation and the dislocation density within the surface area of the spot increase further, and thus the accumulation of the material property errors leads to errors in both the simulations and the experiments [30].

4.2. Surface Rayleigh Wave Propagation and Verification of Simulation Model

Figure 7 shows that when the laser power density is 2.77 GW/cm2, a large residual stress hole is generated at the center of the light spot, and the simulation results show good agreement with the experimental results, which means that the dynamic stress wave nephogram can be extracted (see Figure 8). 
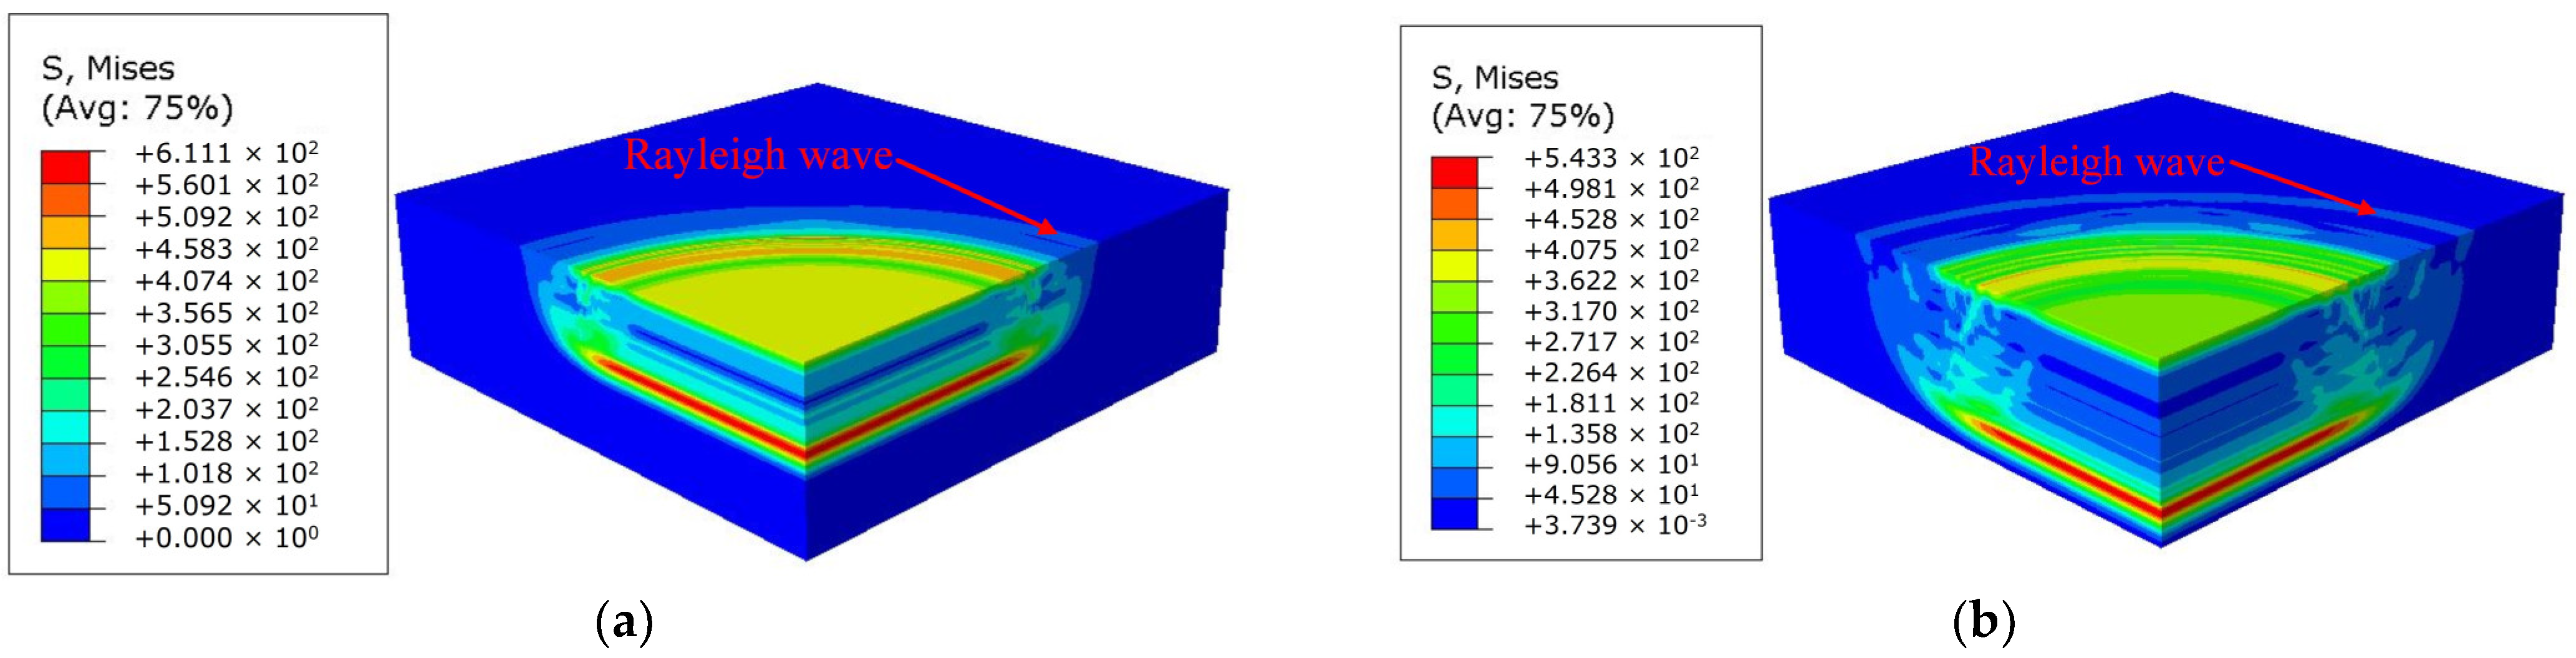
Figure 8a shows that the shock wave has been loaded on the sample at 130 ns and the longitudinal compression wave continues to propagate toward the bottom of the sample. Simultaneously, the surface Rayleigh wave excited by the transverse deformation of the material’s surface that was induced by the longitudinal compression wave can also be observed. Figure 8b shows that the longitudinal compression wave has not reached the bottom surface at 220 ns, and that the range of influence of the surface Rayleigh wave has expanded further outward. Between 130 and 220 ns, the outward Rayleigh wave propagated forward by 0.4 mm and the surface Rayleigh wave velocity was calculated to be 4.4 × 10³ m/s.
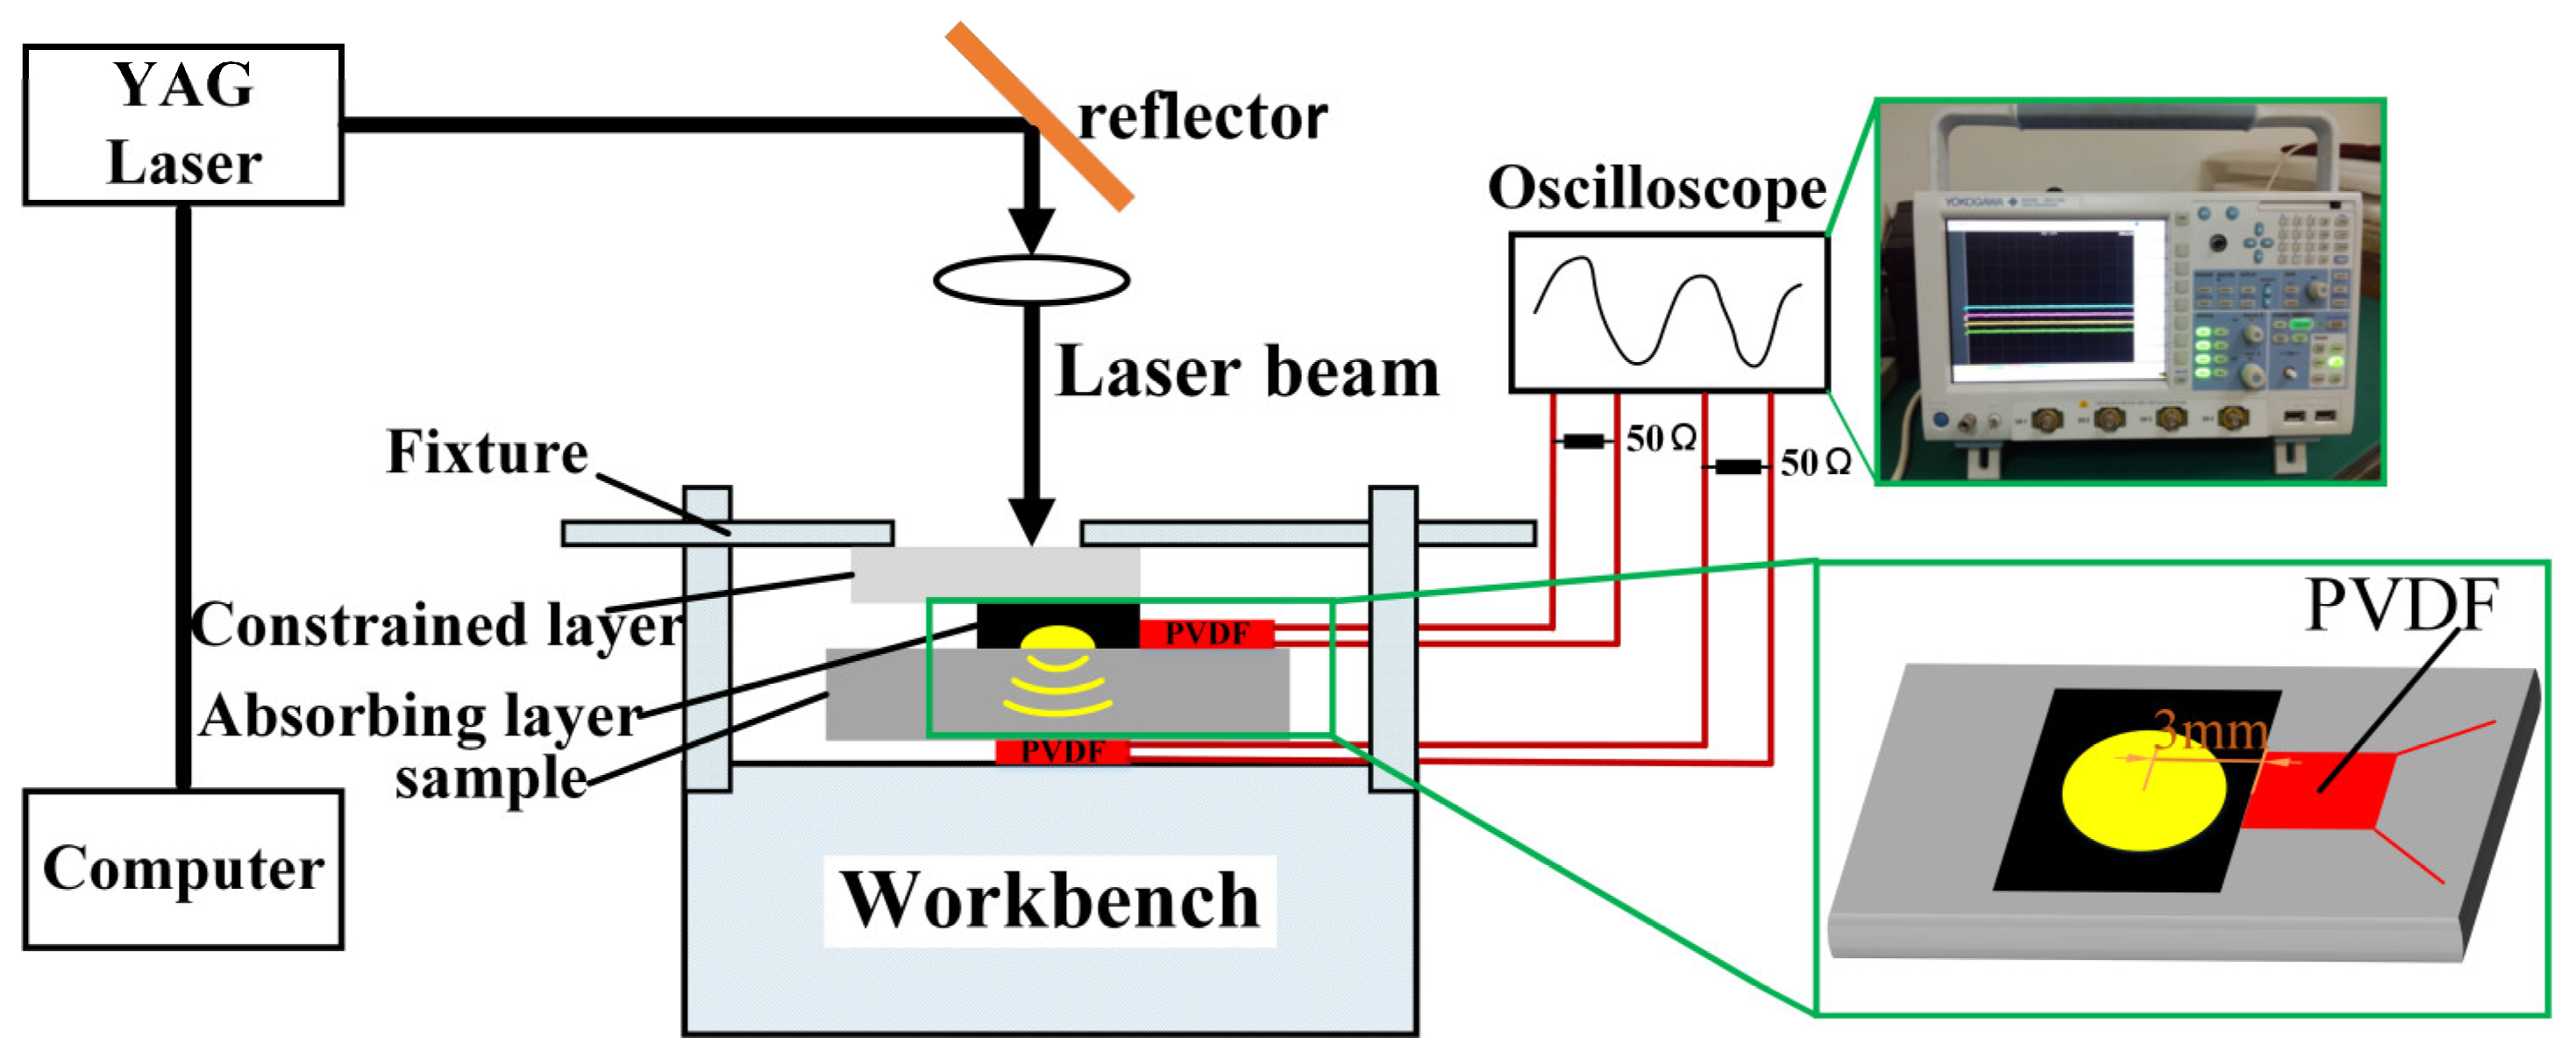
The PVDF piezoelectric sensor is used to measure the dynamic strain on the surface and back of the sample. The piezoelectric waveform V(ε, t) measured using the PVDF sensor reflects the longitudinal shock wave induced by the LSP and the surface wave excited by the longitudinal shock wave and this piezoelectric waveform is shown in 
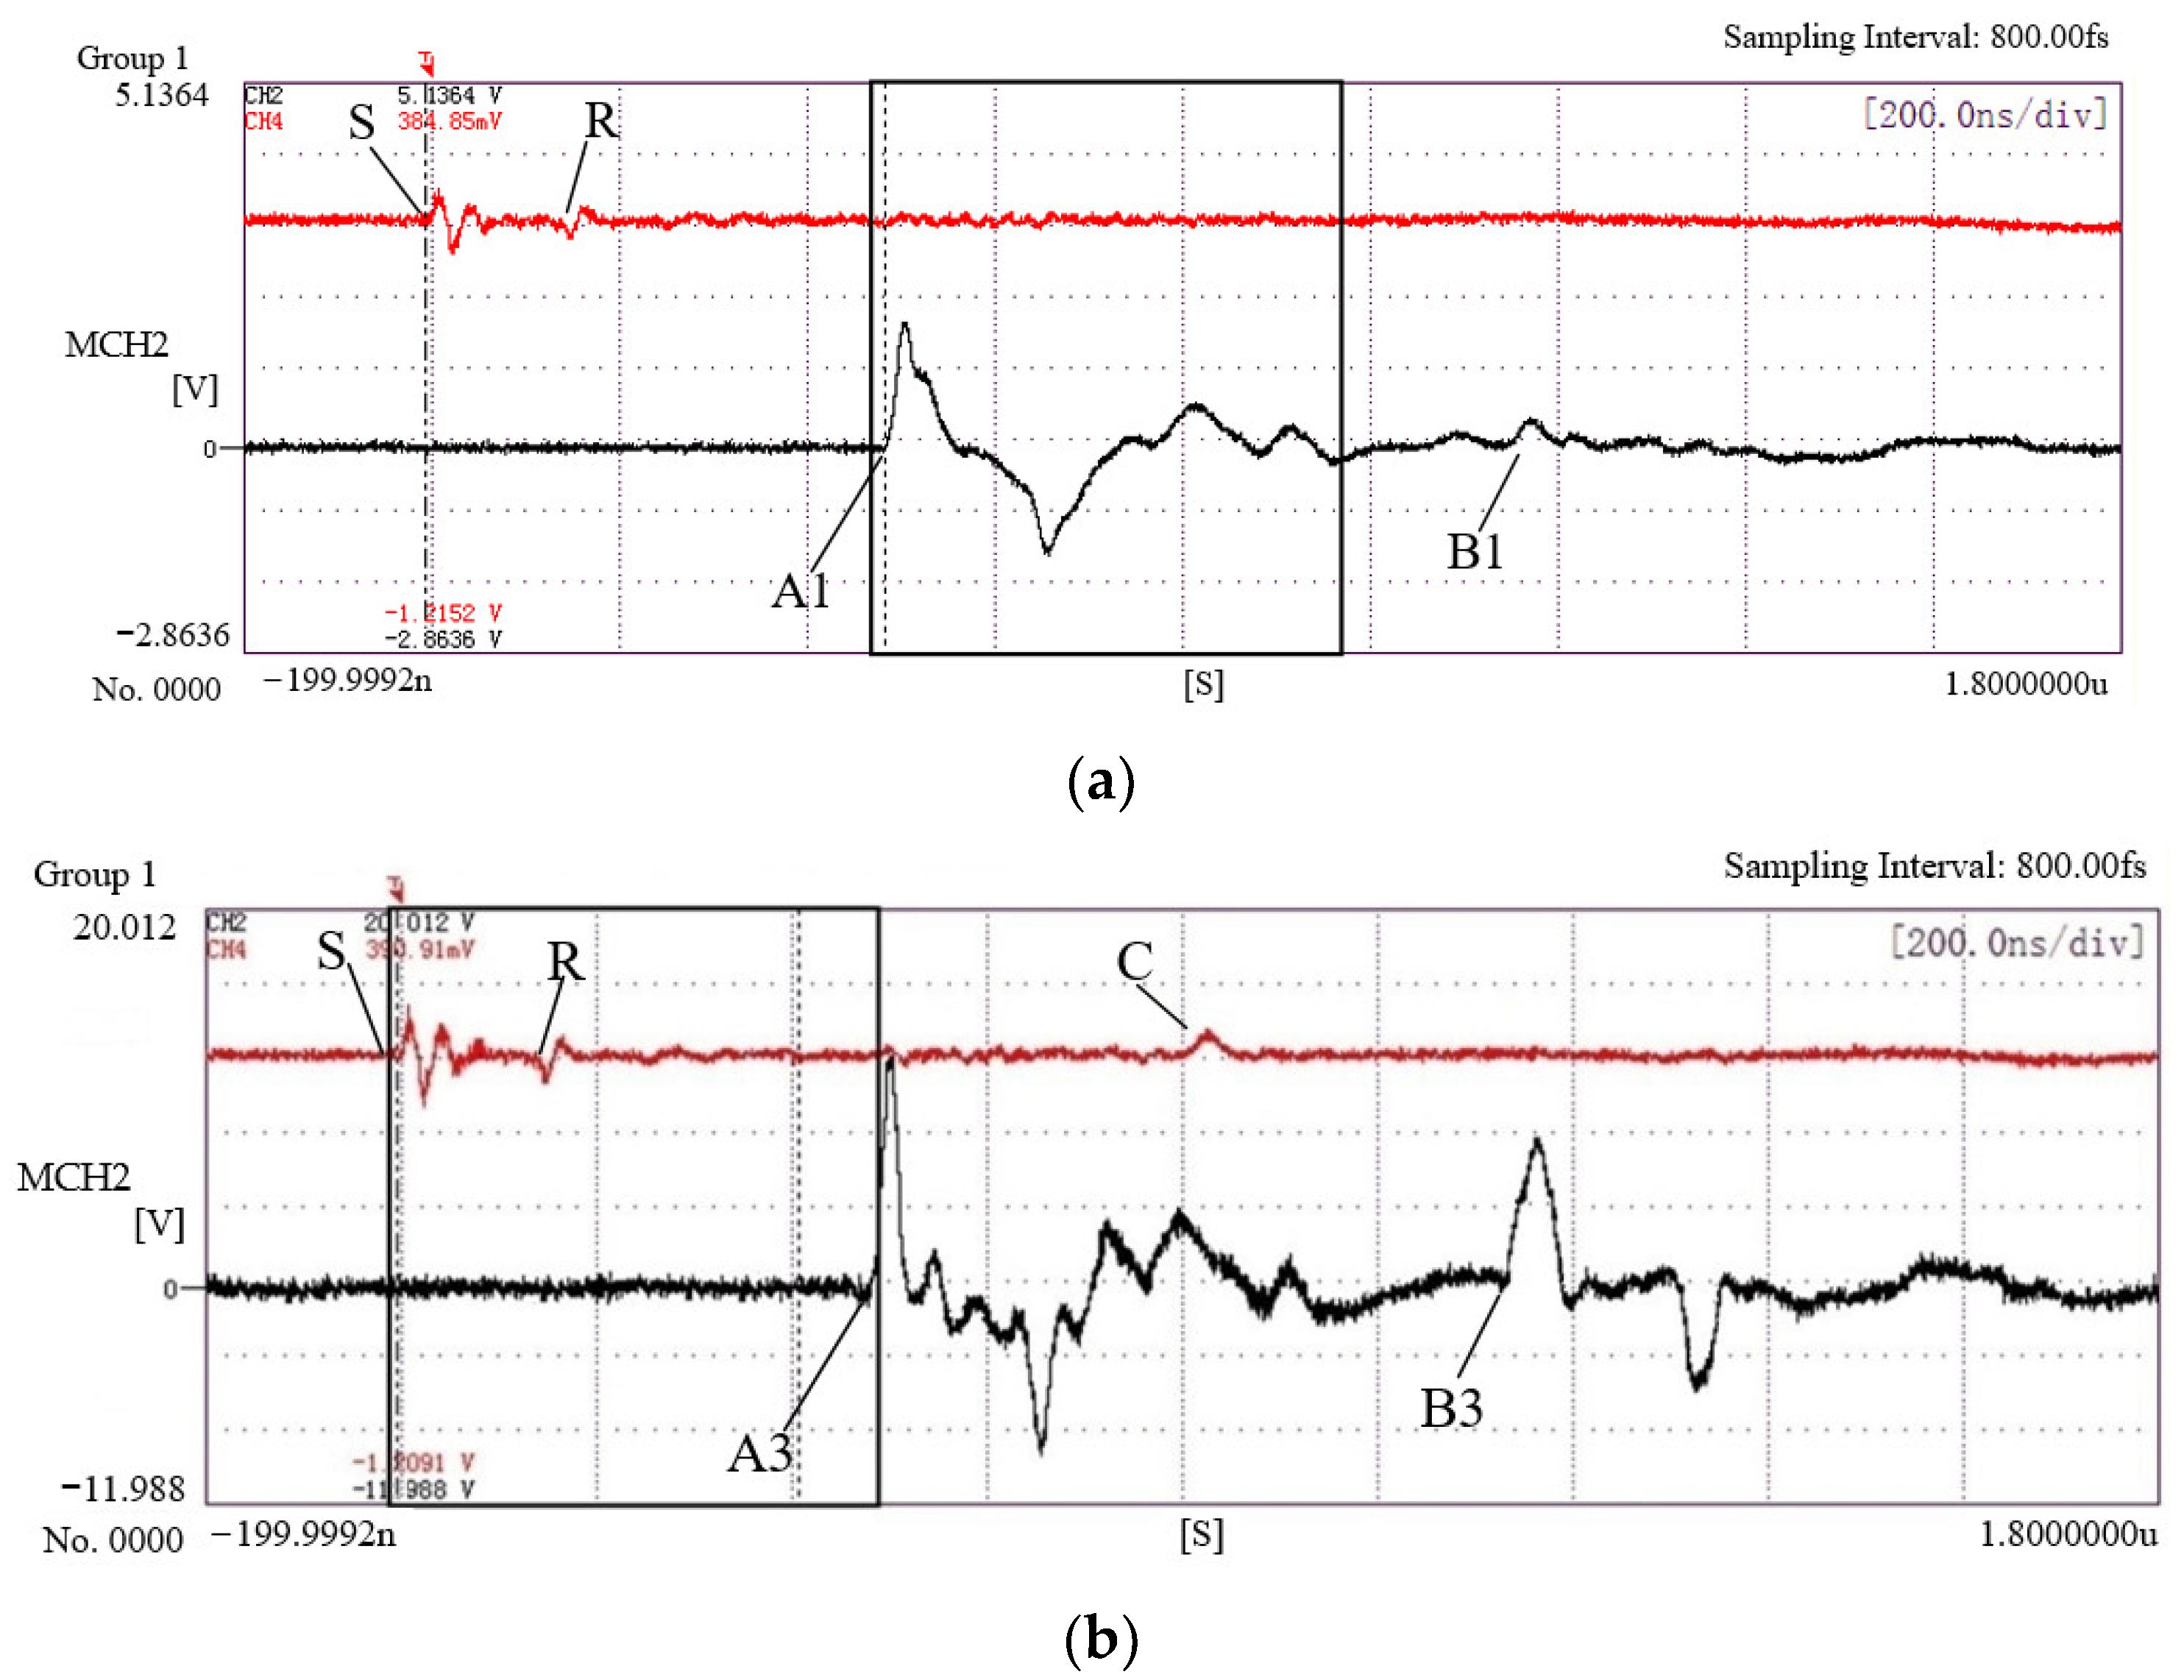
Figure 9. CH2 and CH4 represent the measurement channels of the oscilloscope. The dynamic strain of the PVDF sensor pasted on the back of the sample is collected via CH2, and CH4 is used to collect the dynamic strain from the PVDF sensor pasted on the sample’s front surface. From the time point S, the piezoelectric sensor can detect the shear wave, and this shear wave propagates longitudinally in the material and attenuates gradually. By the time that it approaches time point R, the waveform amplitude has been attenuated to zero. Because of the impact of the shock wave on the material surface, the impact area is axially compressed and laterally deformed, which results in the generation of Rayleigh waves on the material surface. After the time point R, the V(ε, t) curve shows a compression wave with an obvious increase in amplitude and a concave waveform; this is the surface Rayleigh wave. At this time (134 ns), the distance between the PVDF sensor and the edge of the spot is 0.5 mm, meaning that the compression wave velocity is 3.73 × 10³ m/s, which is similar to the simulated value of 4.4 × 10³ m/s and thus further verifies that the wave is a surface Rayleigh wave.
The errors between the simulations and the experimental results stem mainly from two aspects. First, the material model used in the simulation uses an isotropic ideal material. In fact, the actual material will show a certain degree of anisotropy because of the different processing methods used and the uneven material composition [31]. Second, the damping characteristics of the material are not considered in the simulations and the mechanical vibration energy losses caused by internal factors such as the friction between the material grains when the material is vibrating are also ignored [32]. It can be seen from the results that when the laser power density is 2.77 GW/cm2, no coupling occurs between the surface Rayleigh wave and the shear wave and the simulated values show good agreement with the experimental values, thus further proving that the simulation model is both accurate and reliable.

4.3. Shock Wave Propagation and the Residual Stress Field Formation Mechanism

The verification of the simulation model shows that the simulation can provide a better reflection of the actual process of LSP. A 1.5 mm sample that was shocked with a power density of 2.77 GW/cm
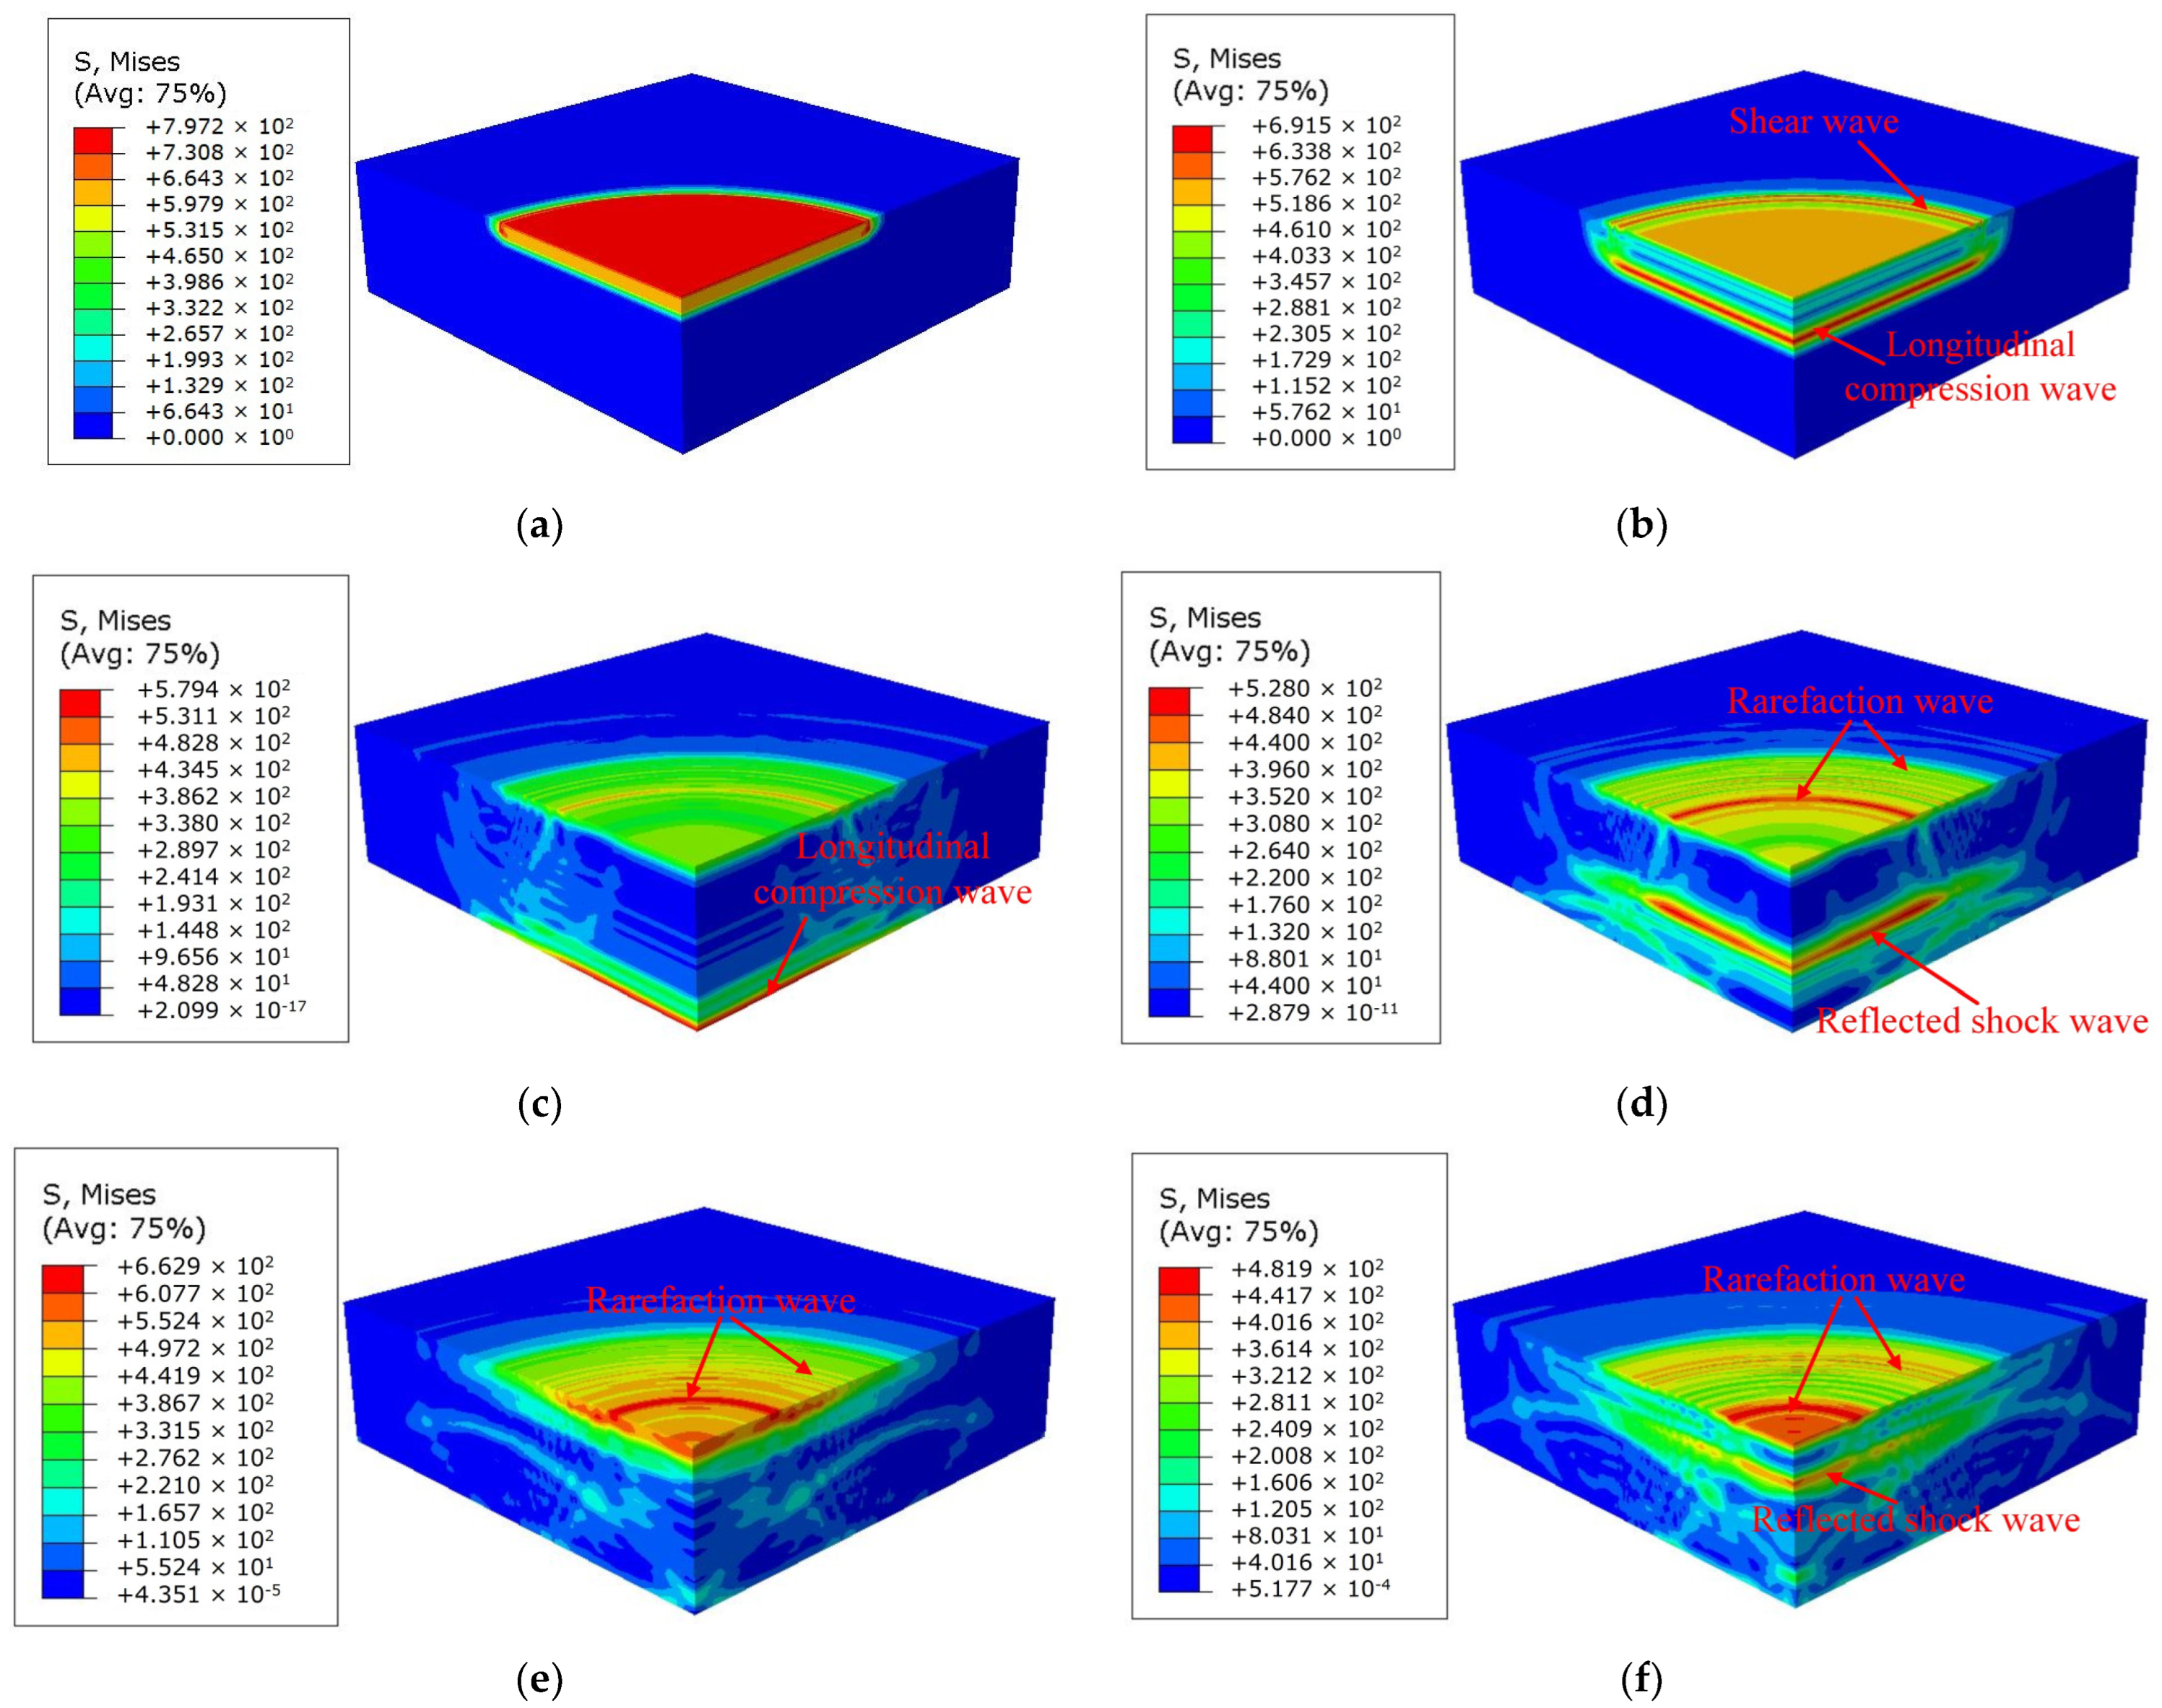
2 was taken as an example for analysis and its dynamic stress wave nephogram was extracted as shown in Figure 10. It is shown in Figure 10 that the shock wave loading in the sample is basically completed at 30 ns, and the longitudinal compression waves that are generated along the thickness direction begins to propagate toward the bottom of the sample. When the time reaches 70 ns, the longitudinal compression wave continues to propagate toward the bottom of the sample, while shear waves are also generated at the edge of the spot because of the shearing effect, and these shear waves then propagate in the sample. The longitudinal compression wave reaches the bottom of the sample and is reflected at 280 ns. When the time reaches 370 ns, the reverse stretching wave begins to propagate toward the impact surface of the sample after being reflected from the bottom of the sample for the first time, and the surface rarefaction waves propagate toward the center of the spot. The longitudinal shock wave is reflected back toward the sample surface through the bottom of the sample for the first time, and the surface rarefaction waves converge further toward the center of the spot at 560 ns. When the time reaches 600 ns, after the reverse stretching wave is reflected by the impact surface of the sample, it propagates toward the bottom of the sample for a second time. Simultaneously, it is clearly shown that the surface rarefaction waves propagate toward the center of the spot, close to the central convergence point.
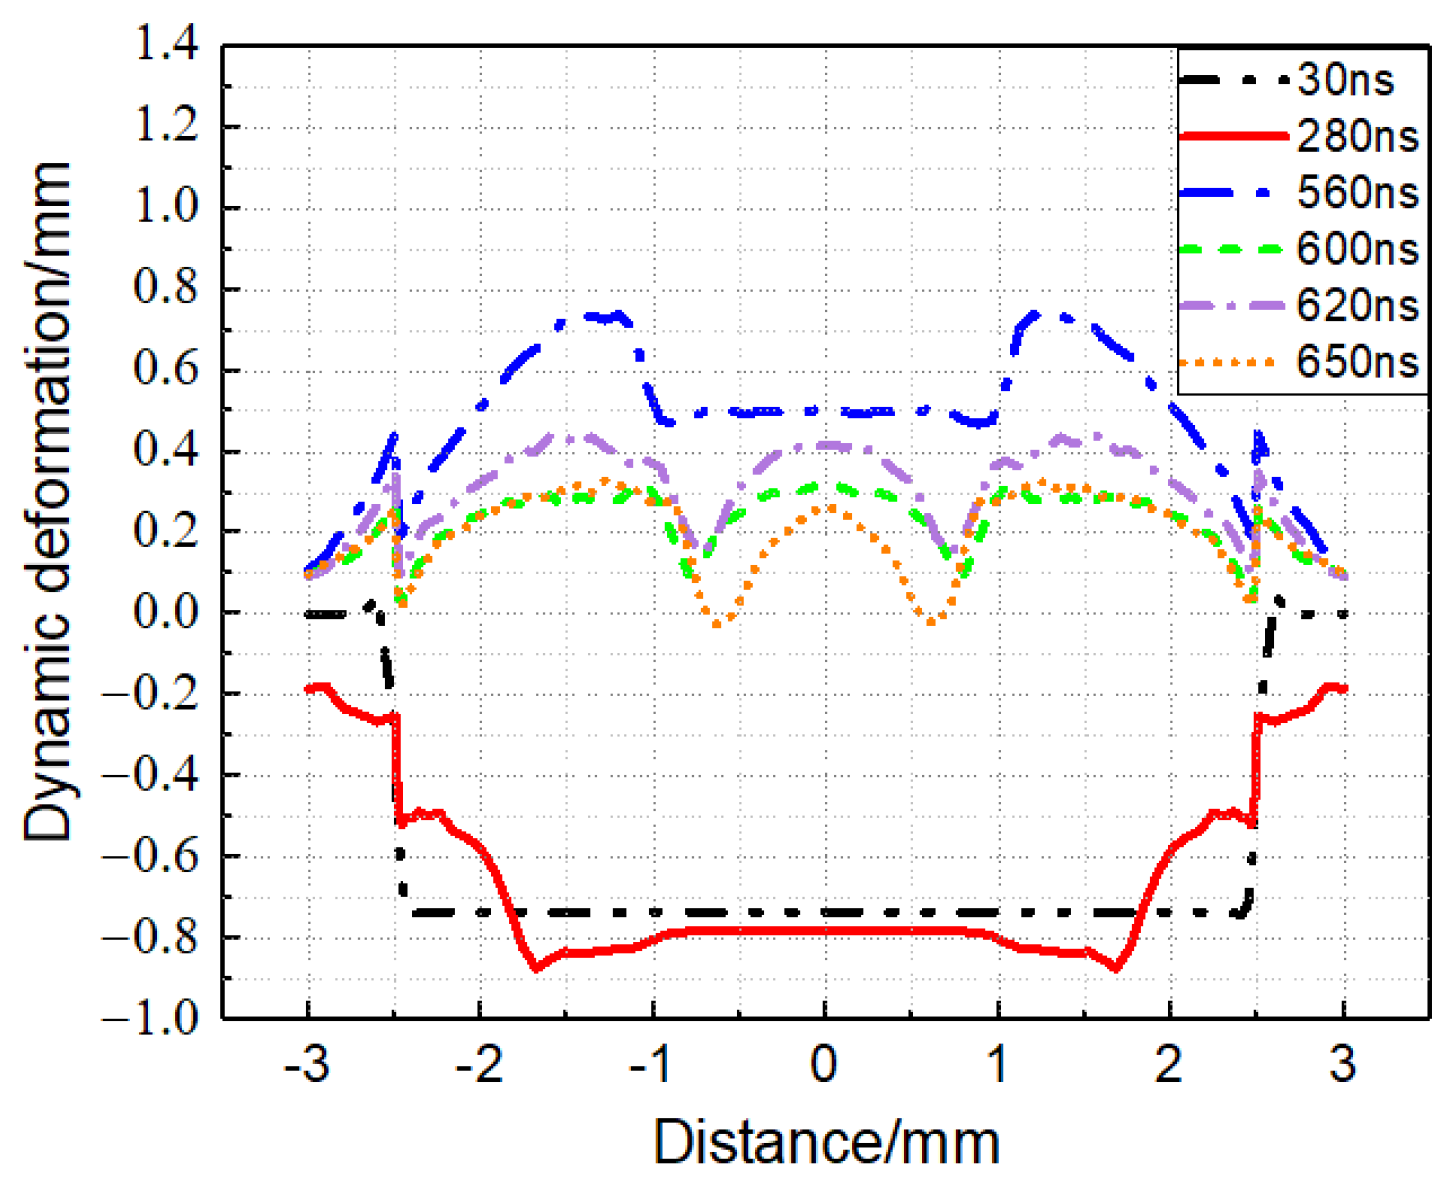
The radial deformation distribution curves of the sample surface are obtained at different times when the laser power density is 2.77 GW/cm2, as illustrated in Figure 11. The pressure loading is basically completed at 30 ns and the deformation of the spot center is −0.78 μm. When the time reaches 280 ns, the longitudinal compression wave reaches the bottom of the sample for the first time and the deformation at the center of the spot reaches a maximum of −0.8 μm. At 560 ns, the shock wave is reflected from the impact surface of the sample and propagates further toward the bottom. At this time, reverse tension appears at the center of the spot and the maximum deformation is 0.5 μm. When the time reaches 600 ns, the longitudinal shock wave propagates toward the bottom surface of the sample again after being reflected by the sample surface, the surface rarefaction waves propagate toward the center and approach the central convergence point, and the forward deformation of the center surface of the spot is reduced to 0.3 μm. When the time reaches 620 ns, the surface rarefaction waves converge at the center of the spot and the surface deformation at the spot center increases to 0.41 μm. The reflected shock wave propagates toward the bottom of the sample and the surface deformation at the spot center decreases to 0.26 μm at 650 ns. During the laser shock wave loading stage, both axial and radial plastic deformation occur on the surface of the specimen, and the shock wave that is reflected back and forth then causes the surface of the plastic region at the center of the sample to move up and down.
Simultaneously, the boundary effect of the shock wave causes a large shear deformation at the spot boundary, which causes the boundary of the spot to become the source of the rarefaction waves. Part of these waves converge toward the center of the spot, while the remainder propagate toward the outside of the spot, and the rarefaction waves that converge toward the center of the spot reach the center simultaneously and produce a secondary deformation in the plastic zone. It can therefore be inferred that the main causes of residual stress hole formation are the convergence of the rarefaction waves and the effect of the shock wave, which is reflected back and forth.
The PVDF piezoelectric sensor was used to measure the dynamic strain characteristics of the sample surface under the application of four laser shocks with different power densities to verify the effects of both the surface rarefaction wave, and the shock wave that is reflected back and forth, on residual stress hole formation. The piezoelectric waveforms V(ε, t) of the dynamic strain on the surfaces of the LSP samples for the power densities of 1.53 and 4.07 GW/cm2 are shown in Figure 12. The waveform detected at the power density of 1.98 GW/cm2 is similar to that observed at 2.77 GW/cm2, and thus the power density of 2.77 GW/cm2 is taken as an example for analysis; the piezoelectric waveform V(ε, t) of its dynamic strain is shown in Figure 9. It can be seen from the back dynamic strain (channel CH2) in Figure 12a that when the power density is 1.53 GW/cm2, the elastic–plastic stress wave induced by LSP reaches the back of the sample at time point A1, thus causing the first piezoelectric peak of the strain. Because the amplitudes of the shear wave and the longitudinal wave are small, time point B1 represents the location of the second peak value of the strain caused by the second reflection toward the back of the sample, according to calculations; this shows that the LSP energy is small and that the influence of the shock wave that is reflected back and forth in the sample can be ignored. Figure 9 shows that when the laser power density is 2.77 GW/cm2, the amplitudes of both the shear waves and the longitudinal shock wave obtained by detection have increased greatly. At time A2, the piezoelectric sensor detects that the longitudinal compression wave has propagated to the back of the sample for the first time; it is then reflected at the sample interface to form the reverse stretching wave and continues to propagate within the sample. At time point B2, the piezoelectric sensor detects a shock wave that is reflected back and forth for one stroke in the sample for the second time. When the laser power density is 4.07 GW/cm2, the back dynamic strain (channel CH4) indicates that the dynamic strain induced by the shock wave that is reflected back and forth within the thin plate sample is detected again at the spot boundary. The time interval between time point C and time point A3 is exactly half of the time interval between time point A3 and time point B3 in channel CH2; simultaneously, the piezoelectric sensor pasted on the back of the sample detects the shock wave propagating toward the back twice, at time point A3 and time point B3.
Comparison of Figure 9 with Figure 12 shows that the near surface of the spot area produces plastic deformation under the action of the laser shock. Additionally, the shock wave that is reflected back and forth and the rarefaction waves in the sample propagate toward the center of the spot successively, which causes the surface of the plastic area at the sample center to move up and down. Because the secondary plastic deformation unloads both the shock wave and the rarefaction waves, no dynamic strain is measured after the attenuation of the Rayleigh wave in the surface dynamic strain (channel CH4) in Figure 9 and Figure 12a. With the increasing laser energy, the plastic deformation in the near-surface part of the impact area increases and the dislocation density and hardness of the impact area also increase, which causes the PVDF piezoelectric sensor that is pasted near the edge of the spot to detect the dynamic strain again, as illustrated in Figure 12b (channel CH4). Time point C at which the dynamic strain appears is the time point at which the shock wave that was detected on the back of the samples is reflected back and forth for half a cycle. In summary, the convergence processes of the rarefaction waves and the shock waves that are reflected back and forth within the samples have a non-negligible effect on the formation of the residual stress holes in E690 high-strength steel.

4.4. Modeling the Shock Wave Propagation in E690 High-Strength Steel

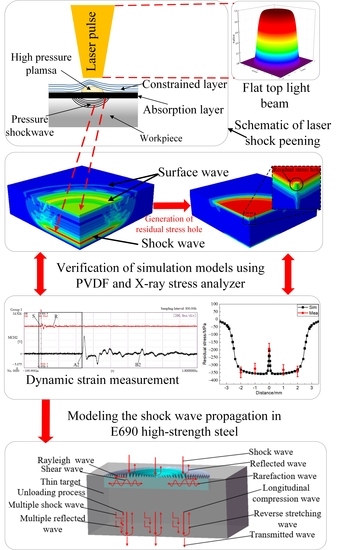
Figure 13 shows the propagation model of the shock wave in the E690 high-strength steel sheet. When the E690 high-strength steel sheet’s surface is loaded using a laser, the laser-induced shock wave is transmitted and reflected within the sample. The transmitted longitudinal wave deforms the specimen axially to form a longitudinal compression wave that propagates axially. The reflection of the shock wave causes formations of a multiple- reflection wave that propagates axially under the action of the constrained layer. Simultaneously, the plasma vapor also forms multiple shock waves under the action of the constrained layer [33]. The longitudinal compression wave, the multiple-reflection wave, and the multiple shock waves are transmitted successively into the interior of the material, with the longitudinal compression wave carrying greater energy than the other waves. The longitudinal compression wave arrives at the back surface of the sample before the multiple-reflected wave and the multiple shock wave; as a result, the strain on the back surface of the sample reaches its maximum, and reflection and transmission occur at the interface in the sample, where the reflected wave is transformed into a reverse stretching wave that continues to propagate in the sample, and the transmitted wave enters the air medium. Subsequently, the multiple-reflection wave and the multiple shock waves propagate toward the back surface of the sample, and unload head-on when they meet the reverse stretching wave, thus causing the back surface strain to fluctuate after reaching the maximum. After unloading, the reverse stretching wave still has a considerable remaining momentum, which means that the wave continues to propagate toward the surface of the sample, and is then reflected from the front surface to the back of the sample. The stress wave gradually attenuates to zero as a result of back-and-forth reflection from the front and back surfaces of the sample.
When an axially-propagating longitudinal compression wave is formed inside the sample, the boundary effect of the shock wave then causes a large shear deformation to occur at the boundary of the spot, and the shear wave caused by the shear deformation is gradually attenuated as it propagates into the material. The source of the rarefaction wave is the boundary of the spot. The rarefaction wave, when propagating from the spot boundary toward the surrounding area, can be divided into two parts, where one part converges toward the center and the other part propagates outward. The impact of the shock wave on the specimen will cause lateral deformation of the impact area, which results in generation of surface Rayleigh waves at the spot boundary.

4.5. Weights of Surface Rarefaction Wave Convergence and the Reflect of Shock Wave Influencing Residual Stress Hole Formation

The convergence of the rarefaction waves and the reflection of shock waves in the samples are the main reasons for the formation of the residual stress holes. The impact load boundary of a square beam spot does not have a center symmetry characteristic, which weakens the condition under which the rarefaction waves converge toward the center of the spot. According to the research results of Cao et al. [34] obtained using the same LSP parameters, the residual stress distributions generated by the circular spot and the square spot are similar and the residual stress holes are generated at the center of the spot, but the compressive residual stresses at the spot center are different, and the residual stress gradient from the center toward the surface of the square spot is small, which improves the occurrence of the residual stress hole phenomenon to a certain extent.
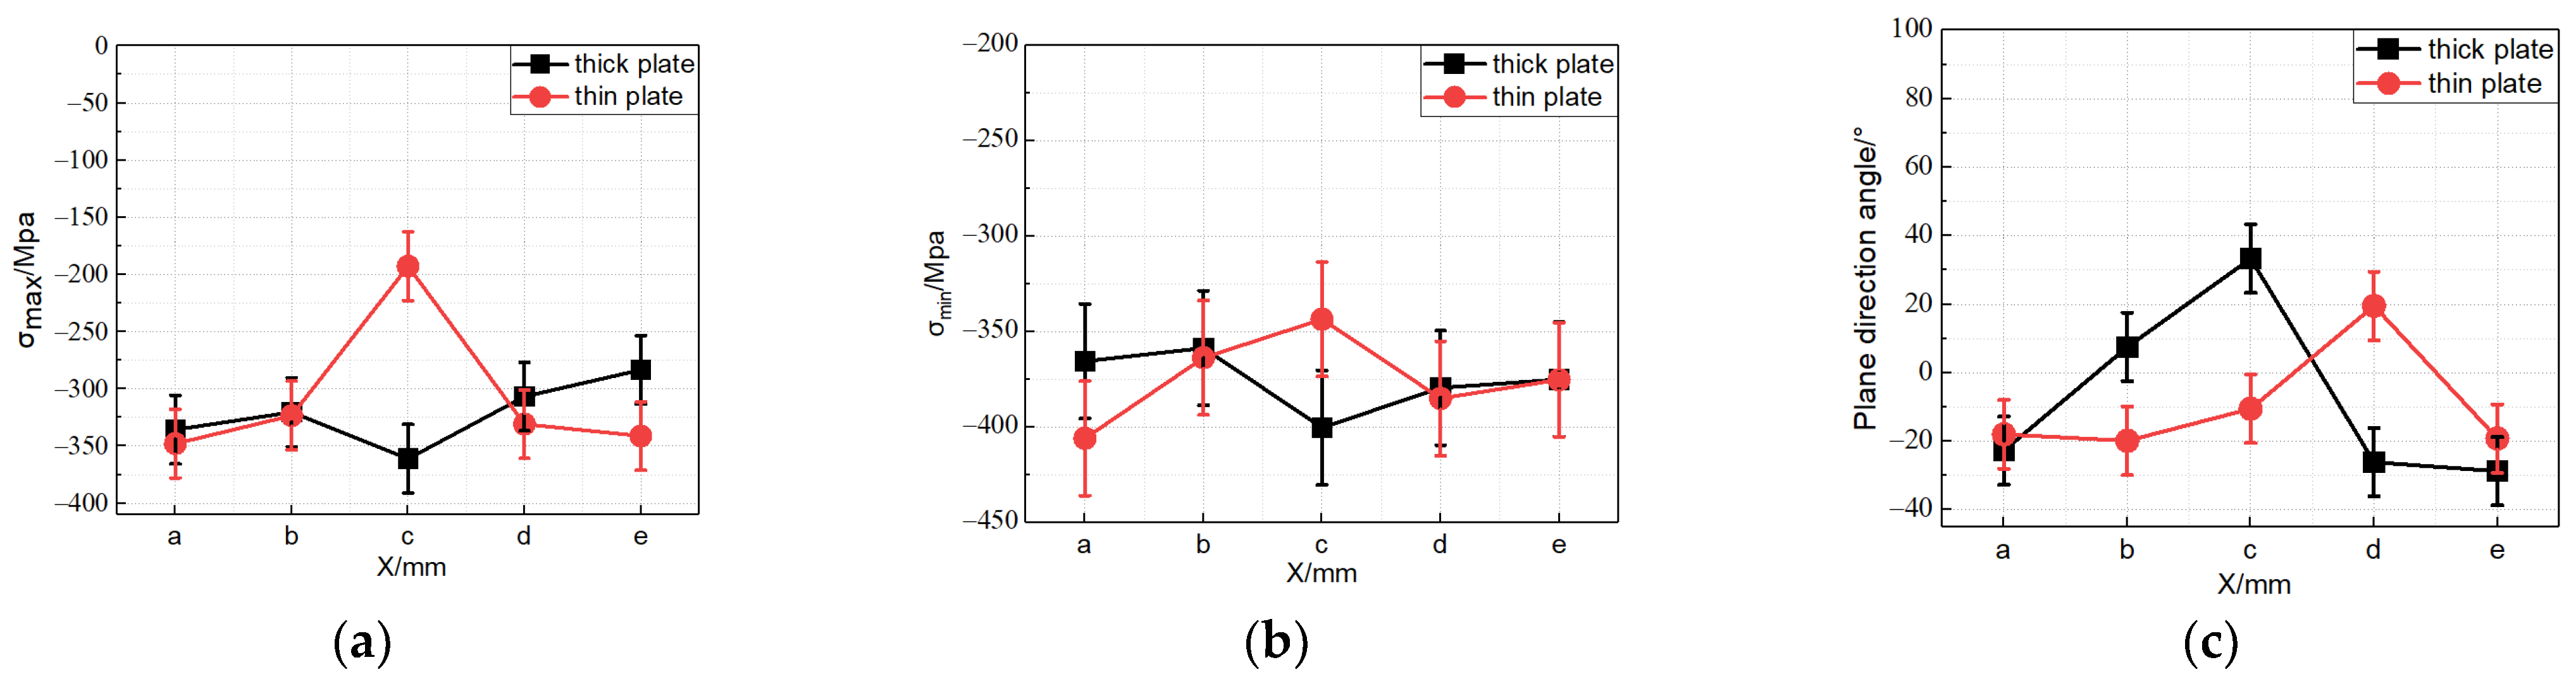
To investigate the influence of the reflection of shock wave in the sample on residual stress hole formation in E690 high-strength steel, the plate thickness was increased to weaken the reflection of shock wave. The 50 mm thick plate sample was shocked using a laser power density of 2.77 GW/cm2 and the surface stresses at five measurement points along the same diameter of the laser spot in three different directions were measured using the X-ray stress analyzer. Under the same laser power density conditions, the residual principal stress distributions, and the directional angles along the same diameter of the impact area of the samples with the different thicknesses, are shown in Figure 14. Comparison of the results in Figure 14 shows that the effect of the reflected shock wave on the residual stress hole on the sample surface is weakened by increasing the plate thickness and the residual stress hole phenomenon does not appear in the thick plate.
In summary, by separately weakening the conditions for generation of residual stress holes, we demonstrate that the effects of convergence of the surface rarefaction waves and those of the reflected shock waves in the thin plate samples on residual stress hole formation cannot be ignored; in addition, the reflection of shock wave in the thin plate sample has a slightly greater impact on the formation of residual stress holes on the material surface than the convergence of the surface rarefaction waves.

4.6. Microstructure Evolution of the E690 High-Strength Steel Surface by LSP

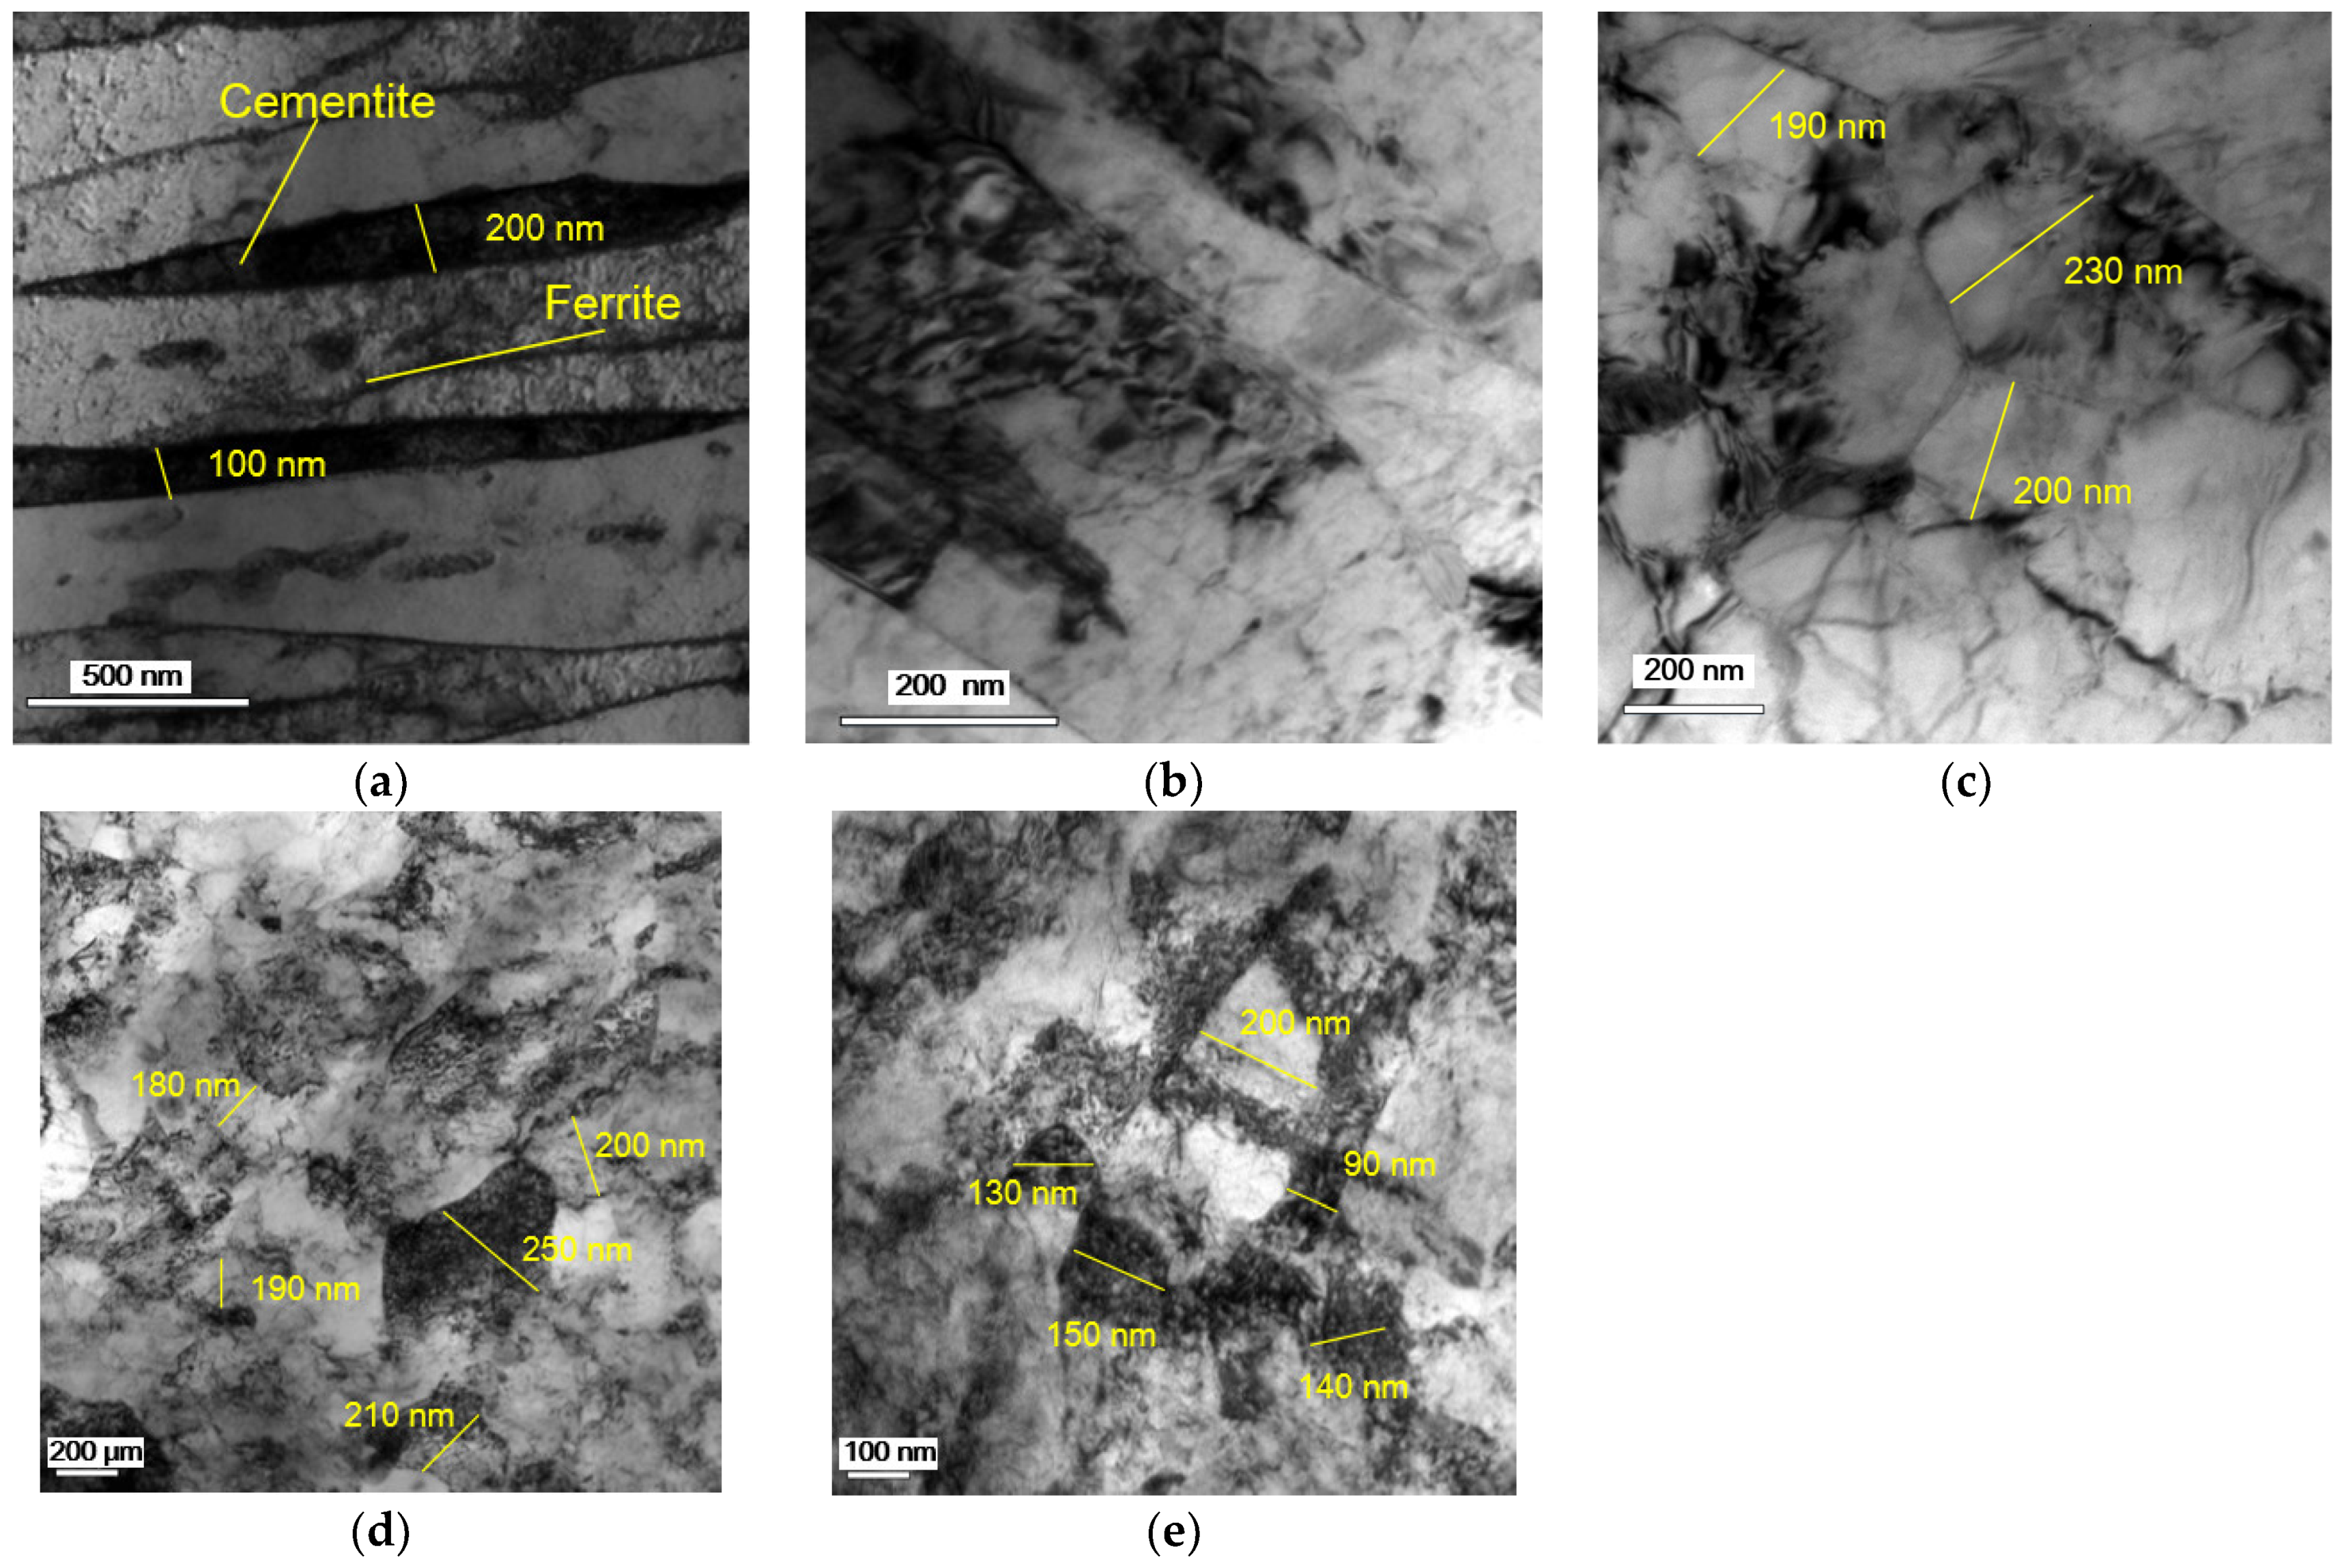
Figure 15 shows the TEM morphologies of the E690 high-strength steel shocked with different laser power densities. It can be seen from Figure 15a that the matrix phase of E690 high-strength steel is flake pearlite formed by alternately superimposing cementite and ferrite, and its flake spacing is about 100–400 nm. Observing Figure 15b, it can be seen that when the laser power density is 1.53 GW/cm2, the alternately laminated layered structure is still vaguely visible in the matrix. When the power density is 1.98 GW/cm2, it can be seen from Figure 15c that the original cementite layer basically disappears, the dislocation distribution is uniform, and the dislocations proliferation is obvious. When the laser power density is 2.77 GW/cm2, it can be seen from Figure 15d that the grains are obviously refined, and the grain size is between 150 and 250 nm. Observing Figure 15e, it can be seen that when the power density is 4.07 GW/cm2, the grains continue to be refined, and the grain size is between 100 and 200 nm.
During LSP, when the peak pressure of the shock wave exceeds the HEL of E690 high-strength steel, strong plastic deformation occurs on the surface of E690 high-strength steel, which induces high-density dislocations. Lattice distortion is induced as dislocations undergo processes such as slippage, accumulation, entanglement, and rearrangement. As the laser energy further increases, the sub-grains are rotated and merged under the impact load to form refined sub-micron grains [35,36]. Dislocation motion, lattice distortion, sub-grain rotation, and grain refinement occur on the E690 high-strength steel surface after LSP. Simultaneously, the severe plastic deformation area is also restricted by the surrounding matrix material without plastic deformation, so that a compressive residual stress field with a certain depth is formed on the surface; that is, the compressive residual stress on the surface of the sample increases macroscopically.

5. Conclusions

(1) A simulation model of LSP for E690 high-strength steel was established. The accuracy and reliability of the simulation model are verified by residual stress test and surface dynamic strain measurements.
(2) The main causes of residual stress hole formation are the convergence of the rarefaction waves and the effect of the shock wave that is reflected back and forth. By weakening the conditions, it can be shown that the reflect of shock wave in the thin plate sample has a slightly greater impact on residual stress hole formation on the material surface than the convergence of the surface rarefaction waves.
(3) A PVDF piezoelectric sensor was used to measure the dynamic strain characteristics of the sample during LSP, and a laser shock wave propagation model for E690 high-strength steel was established.
(4) The statistical law between the laser power density and the residual stress hole still needs to be further studied. The quantitative relationship between the microstructure and the residual stress in the LSPed area is limited by the experimental conditions, and the research will continue after conditions are met.

Author Contributions

Y.C.: investigation and writing—original draft preparation; Z.W.: investigation, validation, data curation; W.S.: conceptualization, investigation, methodology, and writing original draft preparation; G.H.: visualization, investigation, data curation, formal analysis; M.Q.: methodology: data curation, formal analysis. All authors have read and agreed to the published version of the manuscript.

Funding

This work was supported by the National Natural Science Foundation of China (Nos. 51505236, 51979138), National High-Tech Ship Scientific Research Project of China (No. MC-202031-Z07), China Postdoctoral Science Foundation (No. 2019M651931), and National Key Research and Development Project of China (No. 2019YFB2005300).

Institutional Review Board Statement

Not applicable.

Informed Consent Statement

Not applicable.

Data Availability Statement

Data on the analysis and reporting results during the study can be obtained by contacting the authors.

Conflicts of Interest

The authors declare no conflict of interests.

References

  1. Zhao, T.; Liu, Z.; Du, C.; Sun, M.; Li, X. Effects of cathodic polarization on corrosion fatigue life of E690 steel in simulated seawater. Int. J. Fatigue 2018, 110, 105–114. [Google Scholar] [CrossRef]
  2. Turnbull, A.; Wright, L. Modelling the electrochemical crack size effect on stress corrosion crack growth rate. Corros. Sci. 2017, 126, 69–77. [Google Scholar] [CrossRef]
  3. Cao, Y.; Zhu, P.; Shi, W.; Hua, G.; Wang, H.; Qiu, M. Correlation between X-Ray diffraction pattern and microstructure of surface of E690 high-strength steel induced by laser-shock processing. Vacuum 2022, 195, 110595. [Google Scholar] [CrossRef]
  4. Mohd, M.H.; Paik, J.K. Investigation of the corrosion progress characteristics of offshore subsea oil well tubes. Corros. Sci. 2013, 67, 130–141. [Google Scholar] [CrossRef]
  5. Zhao, T.; Liu, Z.; Du, C.; Dai, C.; Li, X.; Zhang, B. Corrosion fatigue crack initiation and initial propagation mechanism of E690 steel in simulated seawater. Mater. Sci. Eng. A 2017, 708, 181–192. [Google Scholar] [CrossRef]
  6. Shu, S.; Huang, X.; Cheng, Z.; Shen, Y.; He, Z.; Liu, W. Understanding the relations between surface stress state and microstructure feature for enhancing the fatigue performance of TC6 titanium alloy. Coatings 2021, 11, 1261. [Google Scholar] [CrossRef]
  7. Salimianrizi, A.; Foroozmehr, E.; Badrossamay, M.; Farrokhpour, H. Effect of Laser Shock Peening on surface properties and residual stress of Al6061-T6. Opt. Lasers Eng. 2016, 77, 112–117. [Google Scholar] [CrossRef]
  8. Caralapatti, V.K.; Narayanswamy, S. Analyzing the effect of high repetition laser shock peening on dynamic corrosion rate of magnesium. Opt. Laser Technol. 2017, 93, 165–174. [Google Scholar] [CrossRef]
  9. Kalainathan, S.; Prabhakaran, S. Recent development and future perspectives of low energy laser shock peening. Opt. Laser Technol. 2016, 81, 137–144. [Google Scholar] [CrossRef]
  10. James, M.; Newby, M.; Hattingh, D.; Steuwer, A. Shot-peening of steam turbine blades: Residual stresses and their modification by fatigue cycling. Procedia Eng. 2010, 2, 441–451. [Google Scholar] [CrossRef] [Green Version]
  11. Zhang, Y.; Lu, J.; Ren, X.; Yao, H. Effect of laser shock processing on the mechanical properties and fatigue lives of the turbojet engine blades manufactured by LY2 aluminum alloy. Mater. Des. 2009, 30, 1697–1703. [Google Scholar] [CrossRef]
  12. Gujba, A.K.; Medraj, M. Laser Peening Process and Its Impact on Materials Properties in Comparison with Shot Peening and Ultrasonic Impact Peening. Materials 2014, 7, 7925–7974. [Google Scholar] [CrossRef] [PubMed] [Green Version]
  13. Ganesh, P.; Sundar, R.; Kumar, H.; Kaul, R.; Ranganathan, K.; Hedaoo, P.; Tiwari, P.; Kukreja, L.M.; Oak, S.M.; Dasari, S.; et al. Studies on laser peening of spring steel for automotive applications. Opt. Lasers Eng. 2012, 50, 678–686. [Google Scholar] [CrossRef]
  14. Shen, X.; Shukla, P.; Nath, S.; Lawrence, J. Improvement in mechanical properties of titanium alloy (Ti-6Al-7Nb) subject to multiple laser shock peening. Surf. Coat. Technol. 2017, 327, 101–109. [Google Scholar] [CrossRef]
  15. Peyre, P.; Fabbro, R. Laser shock processing of aluminium alloys: Application to high cycle fatigue behavior. Mater. Sci. Eng. A 1996, 210, 102–113. [Google Scholar] [CrossRef]
  16. Jiang, Y.F.; Lai, Y.L.; Zhang, L.; Tang, Z.Z.; Li, Z.F. Investigation of residual stress hole on a metal surface by laser shock. Chin. J. Lasers 2010, 37, 2073–2079. [Google Scholar] [CrossRef]
  17. Nie, X.F.; Zang, S.L.; He, W.F.; Zhao, J. Sensitivity analysis and restraining method of “Residual Stress Hole” induced by laser shock peening. High Voltage Eng. 2014, 40, 2107–2112. [Google Scholar]
  18. Cao, Y.; Feng, A.; Hua, G. Influence of interaction parameters on laser shock wave induced dynamic strain on 7050 aluminum alloy surface. J. Appl. Phys. 2014, 116, 153105. [Google Scholar] [CrossRef]
  19. Sun, R.; Li, L.; Zhu, Y.; Zhang, L.; Guo, W.; Peng, P.; Li, B.; Guo, C.; Liu, L.; Che, Z.; et al. Dynamic response and residual stress fields of Ti6Al4V alloy under shock wave induced by laser shock peening. Model. Simul. Mater. Sci. Eng. 2017, 25, 065016. [Google Scholar] [CrossRef]
  20. Dung, C.V.; Sasaki, E. Numerical Simulation of Output Response of PVDF Sensor Attached on a Cantilever Beam Subjected to Impact Loading. Sensors 2016, 16, 601. [Google Scholar] [CrossRef]
  21. Ali, H.Q.; Tabrizi, I.E.; Khan, R.M.; Zanjani, J.S.; Yilmaz, C.; Poudeh, L.H.; Yildiz, M. Experimental study On Dynamic Behavior of woven carbon fabric laminates using in-house piezoelectric sensors. Smart Mater. Struct. 2019, 28, 10. [Google Scholar] [CrossRef]
  22. Johnson, G.R.; Cook, W.H. A Constitutive Model and Data for Metals Subjected to Large Strains, High Strain Rates and High Temperatures. In Proceedings of the 7th International Symposium on Ballistics, The Hague, The Netherlands, 19–21 April 1983; Volume 21, pp. 541–547. Available online: https://scholar.google.com.hk/scholar?hl=zh-CN&as_sdt=0%2C5&q=High+Strain+Rates+and+High+Temperatures&btnG= (accessed on 17 February 2022).
  23. Sun, G.F.; Wang, Z.D.; Lu, Y.; Zhou, R.; Ni, Z.H.; Gu, X.; Wang, Z.G. Numerical and experimental inv-estigation of thermal field and residual stress in laser-MIG hybrid welded NV E690 steel plates. J. Manuf. Processes 2018, 34, 106–120. [Google Scholar] [CrossRef]
  24. Su, B.; Zhang, Y.; Sun, G.; Ni, Z. Prediction of micro indention depth of TC4 titanium alloy during laser shock processing. Jpn. J. Appl. Phys. 2018, 57, 122703. [Google Scholar] [CrossRef]
  25. Li, Y.H. Theory and Technology of Laser Shock Peening; Science Press: Beijing, China, 2013. [Google Scholar]
  26. Fabbro, R.; Fournier, J.; Ballard, P.; Devaux, D.; Virmont, J. Physical study of laser-produced plasma in confined geometry. J. Appl. Phys. 1990, 68, 775–784. [Google Scholar] [CrossRef]
  27. Peyre, P.; Fabbro, R. Laser shock processing: A review of the Physics and applications. Opt. Quaint. Electr. 1995, 27, 1213–1229. [Google Scholar]
  28. Feng, A.X.; Sun, H.Y.; Cao, Y.P.; Xu, C.C.; Ni, G.F.; Wang, J.W.; Zhou, P.C. Residual Stress Determination by X-Ray Diffraction with Stress of Two Directions Analysis Method. Appl. Mech. Mater. 2010, 43, 569–572. [Google Scholar] [CrossRef]
  29. Qiao, H.C. Experimental investigation of laser peening on Ti17 titanium alloy for rotor blade applications. Appl. Surf. Sci. 2015, 351, 524–530. [Google Scholar]
  30. Ren, X.D.; Zhou, W.F.; Ren, Y.P.; Xu, S.D.; Liu, F.F.; Yuan, S.Q.; Ren, N.F.; Huang, J.J. Dislocation ev-olution and properties enhancement of GH2036 by laser shock processing: Dislocation dynamics simulation and experiment. Mater. Sci. Eng. A 2016, 654, 184–192. [Google Scholar] [CrossRef]
  31. Ding, K.; Ye, L. Laser Shock Peening: Performance and Process Simulation; CRC Press: Boca Raton, FL, USA, 2006. [Google Scholar]
  32. Cellard, C.; Retraint, D.; François, M.; Rouhaud, E.; Le Saunier, D. Laser shock peening of Ti-17 titanium alloy: Influence of process parameters. Mater. Sci. Eng. A 2012, 532, 362–372. [Google Scholar] [CrossRef]
  33. Jiang, Y.; Li, X.; Jiang, W.; Wan, Q.; Gan, X.; Zhao, Y.; Hua, C.; Li, X.; Zhang, J. Thickness effect in laser shock processing for test specimens with a small hole under smaller laser power density. Opt. Laser Technol. 2019, 114, 127–134. [Google Scholar] [CrossRef]
  34. Cao, Z.; Xu, H.; Zou, S.; Che, Z. Investigation of Surface Integrity on TC17 Titanium Alloy Treated by Square-spot Laser Shock Peening. Chin. J. Aeronaut. 2012, 25, 650–656. [Google Scholar] [CrossRef] [Green Version]
  35. Liu, L.; Wang, J.; Zhou, J. Effects of laser shock peening on mechanical behaviors and microstructural evolution of brass. Vacuum 2018, 148, 178–183. [Google Scholar] [CrossRef]
  36. Huang, S.; Zhu, Y.; Guo, W.; Peng, P.; Diao, X. Impact toughness and microstructural response of Ti-17 titanium alloy subjected to laser shock peening. Surf. Coatings Technol. 2017, 327, 32–41. [Google Scholar] [CrossRef]
Figure 1. Three-dimensional axial-symmetry finite element model.
Coatings 12 00285 g001
Figure 2. Pressure curve of laser shock wave loading.
Coatings 12 00285 g002
Figure 3. Schematic diagram of detection of dynamic strain induced by laser shock on a sample.
Coatings 12 00285 g003
Figure 4. Schematic diagram showing the locations of the test points in the impact area.
Coatings 12 00285 g004
Figure 5. Equivalent stress nephograms of E690 high-strength steel model under different power density laser loadings of (a) 1.53 GW/cm2, (b) 1.98 GW/cm2, (c) 2.77 GW/cm2, and (d) 4.07 GW/cm2.
Coatings 12 00285 g005aCoatings 12 00285 g005b
Figure 6. Distributions of residual principal stresses produced by different laser power densities: (a) Maximum residual principal stress distribution. (b) Minimum residual principal stress distribution. (c) Principal stress direction angular distribution.
Coatings 12 00285 g006
Figure 7. Comparison of experimental and simulated results for residual stresses on the sample surfaces after laser shock under different power densities of (a) 1.53 GW/cm2, (b) 1.98 GW/cm2, (c) 2.77 GW/cm2, and (d) 4.07 GW/cm2.
Coatings 12 00285 g007
Figure 8. Nephograms of surface Rayleigh wave propagation in sample at (a) 130 ns and (b) 220 ns.
Coatings 12 00285 g008
Figure 9. Dynamic strain characteristics of E690 high-strength steel under laser shock loading at a power density of 2.77 GW/cm2.
Coatings 12 00285 g009
Figure 10. Stress wave nephograms of laser shock wave propagating in samples at different times of (a) 30 ns, (b) 70 ns, (c) 280 ns, (d) 370 ns, (e) 560 ns, and (f) 600 ns.
Coatings 12 00285 g010
Figure 11. Radial deformation distributions of impact surface at different times.
Coatings 12 00285 g011
Figure 12. Dynamic strain characteristics of E690 high-strength steel under laser shock loading at power densities of (a) 1.53 GW/cm2 and (b) 4.07GW/cm2.
Coatings 12 00285 g012
Figure 13. Propagation model of laser shock wave in E690 high-strength steel sheet.
Coatings 12 00285 g013
Figure 14. Comparison of the residual stress characteristics on the thin plate and thick plate samples at a laser power density of 2.77 GW/cm2: (a) Maximum residual principal stress distribution. (b) Minimum residual principal stress distribution. (c) Principal stress direction angular distribution.
Coatings 12 00285 g014
Figure 15. The TEM morphologies of the E690 high-strength steel at laser shock loading at power densities of (a) 0 GW/cm2, (b) 1.53 GW/cm2, (c) 1.98 GW/cm2, (d) 2.77 GW/cm2 and (e) 4.07 GW/cm2.
Coatings 12 00285 g015
Table 1. Parameters of the E690 high-strength steel Johnson-Cook (J-C) model.
ρ (kg/m3)E (GPa)Poisson RatioA (MPa)B (MPa)nC
78502100.37395100.30.0147
Table 2. Chemical composition of E690 high-strength steel by mass fraction (%).
CSiMnPSCrNiMoV
0.18≤0.50≤1.6≤0.02≤0.01≤1.5≤3.5≤0.7≤0.08
Publisher’s Note: MDPI stays neutral with regard to jurisdictional claims in published maps and institutional affiliations.

