Article

Numerical Modelling on the Effect of Temperature on MOCVD Growth of ZnO Using Diethylzinc and Tertiarybutanol

1
School of Chemical Engineering, Guizhou Minzu University, Guiyang 550025, China
2
School of Mechanical and Electrical Engineering, Guizhou Normal University, Guiyang 550025, China
*
Author to whom correspondence should be addressed.
Coatings 2022, 12(12), 1991; https://doi.org/10.3390/coatings12121991
Submission received: 19 November 2022 / Revised: 11 December 2022 / Accepted: 15 December 2022 / Published: 19 December 2022
(This article belongs to the Section Thin Films)

Abstract

:
The dynamic growth of MOCVD-grown ZnO thin films under temperature effect was systematically investigated by a numerical approach using computational fluid dynamics (CFD) technique. A three-dimensional (3D) reactor-scale model was developed to determine the growth rate and uniformity of ZnO thin film in the temperature range of 593 K to 713 K. The mixed-convection flow and heat transfer inside the reactor chamber were assessed. The results showed that as the temperature increased, ZnO thickness increased initially before decreasing. At 673 K, the highest deposition rate with acceptable uniformity was achieved. The admixture of transverse and longitudinal rolls was observed for the flow conditions. Temperature variations were found to directly affect the axial and lateral uniformity of deposition, but had a minor impact on the size and position of transverse rolls. Experimental verification studies were conducted, and high-quality ZnO films were successfully fabricated by using diethylzinc (DEZn) and tertiarybutanol (t-BuOH) as precursors; it was found that the comprehensive thickness and structural properties of ZnO deposited at temperature of 673 K are preferred. Experimental results and numerical simulations exhibited good agreement.

1. Introduction

Zinc oxide (ZnO) is a fascinating II-VI semiconductor material with a wide direct band gap of 3.37 eV at room temperature [1,2] which has gained remarkable attention in versatile applications, such as a transparent electrode for solar cells and gas sensors [3,4], photocatalysis [5], light-emitting diodes (LED) [6] and laser diodes [7]. The metal–organic chemical vapor deposition (MOCVD) technique is widely used for the growth of high-quality ZnO thin films due to its potential scalability for large-scale fabrication [8]. However, the challenge remains to produce a homogeneous and uniform ZnO thin film with minimal defects.
Several efforts have been directed towards the selection of appropriate precursors in order to effectively avoid high reactivity precursors and achieve better control in the syn-thesis of ZnO films [9,10]. Tena-Zaera et al. [11] developed a 3D model to investigate the gas flow in a two-inlet horizontal reactor by considering the effects of different Zn precursors, such as diethylzinc (DEZn), dimethylzinc (DMZn) and dimethylzinc-triethylamine (DMZn-TEA) and different oxygen precursors (t-butanol, i-propanol and acetone) with two carrier gases (H2 and N2) on the fluid dynamics in the numerical simulation. Compared with dimethylzinc (DMZn), diethylzinc (DEZn) used as zinc precursor exhibits superior structural features and optical properties [12] and is less active and reacts less strongly with oxygen precursors [13]. The use of tertiarybutanol (t-BuOH) as a promising oxygen source instead of O2 and H2O has been found to avoid or significantly reduce the violent pre-reactions, with a lower reactivity and decomposition temperature than other oxygen sources [14,15]. Thus, diethylzinc (DEZn) and tertiarybutanol (t-BuOH) are used as zinc and oxygen precursors, respectively, for the growth of ZnO thin film.
Experimental studies on ZnO film have been documented in the literature [16,17,18]. Of particular interest, large-scale industrial production affects the deposition rate as well as the quality and uniformity of the deposited thin film, which is strongly related to the thermal and flow behavior of gas fluid in the reactor. Computational fluid dynamics (CFD) modelling is an effective simulation tool for obtaining insight into thermal flow patterns. Many numerical results have been presented for a variety of conditions and geometries [19,20,21]. Li and Xiao [22] showed that an improper gas distributing system would cause low growth uniformity. Li et al. [23] obtained a good ZnO deposition rate by adjusting the entrance flow of MO source. Zhang et al. [24] studied the influence of operating parameters on the growth rate and thickness uniformity, especially the inlet conditions, such as a premixed or non-premixed inlet, inlet temperature, total gas flow rate and the component ratio of precursors. Similarly, Wang et al. [25,26] investigated the film deposition rate and the film uniformity of a ZnO thin film in a vertical MOCVD reactor under different process parameters, such as the substrate temperature, operating pressure, total flow rate and mass fraction of the gas flow. There is no doubt that studies on the key transport phenomena always need to be considered since they play a crucial role in governing the reactor behavior and scaling-up of MOCVD [27,28,29,30]; however, the understanding of the influence of deposition temperature and its controlling mechanism of transport phenomena at the macroscopic level during deposition is still limited. In addition, experimental studies [31,32] have also showed that the proper control of processing parameters is essential to the microstructure of thin films, while only a few of them have used the MOCVD method to grow a ZnO thin film. Therefore, a comprehensive examination of the temperature effect on the macro flow behavior and microstructure evolution of a ZnO thin film deposited by MOCVD merits additional discussion.
In this study, a 3D CFD model is employed to describe the flow dynamics and transport phenomena in a horizontal MOCVD reactor for ZnO growth, where diethylzinc (DEZn) and tertiarybutanol (t-BuOH) are used as precursors, and nitrogen (N2) is used as carrier gas. The deposition temperature influence on the deposition rate and uniformity of ZnO thin films are highlighted. The key dimensionless parameters are used to evaluate the effects of the thermal and flow behavior, and mechanisms on ZnO growth. Further-more, a temperature-dependent experimental study on the structural and morphological properties is examined in order to identify the produced ZnO thin films. Experimental results on ZnO growth are conducted in order to validate the predictions from the developed CFD simulations.

2. Numerical Model and Boundary Conditions
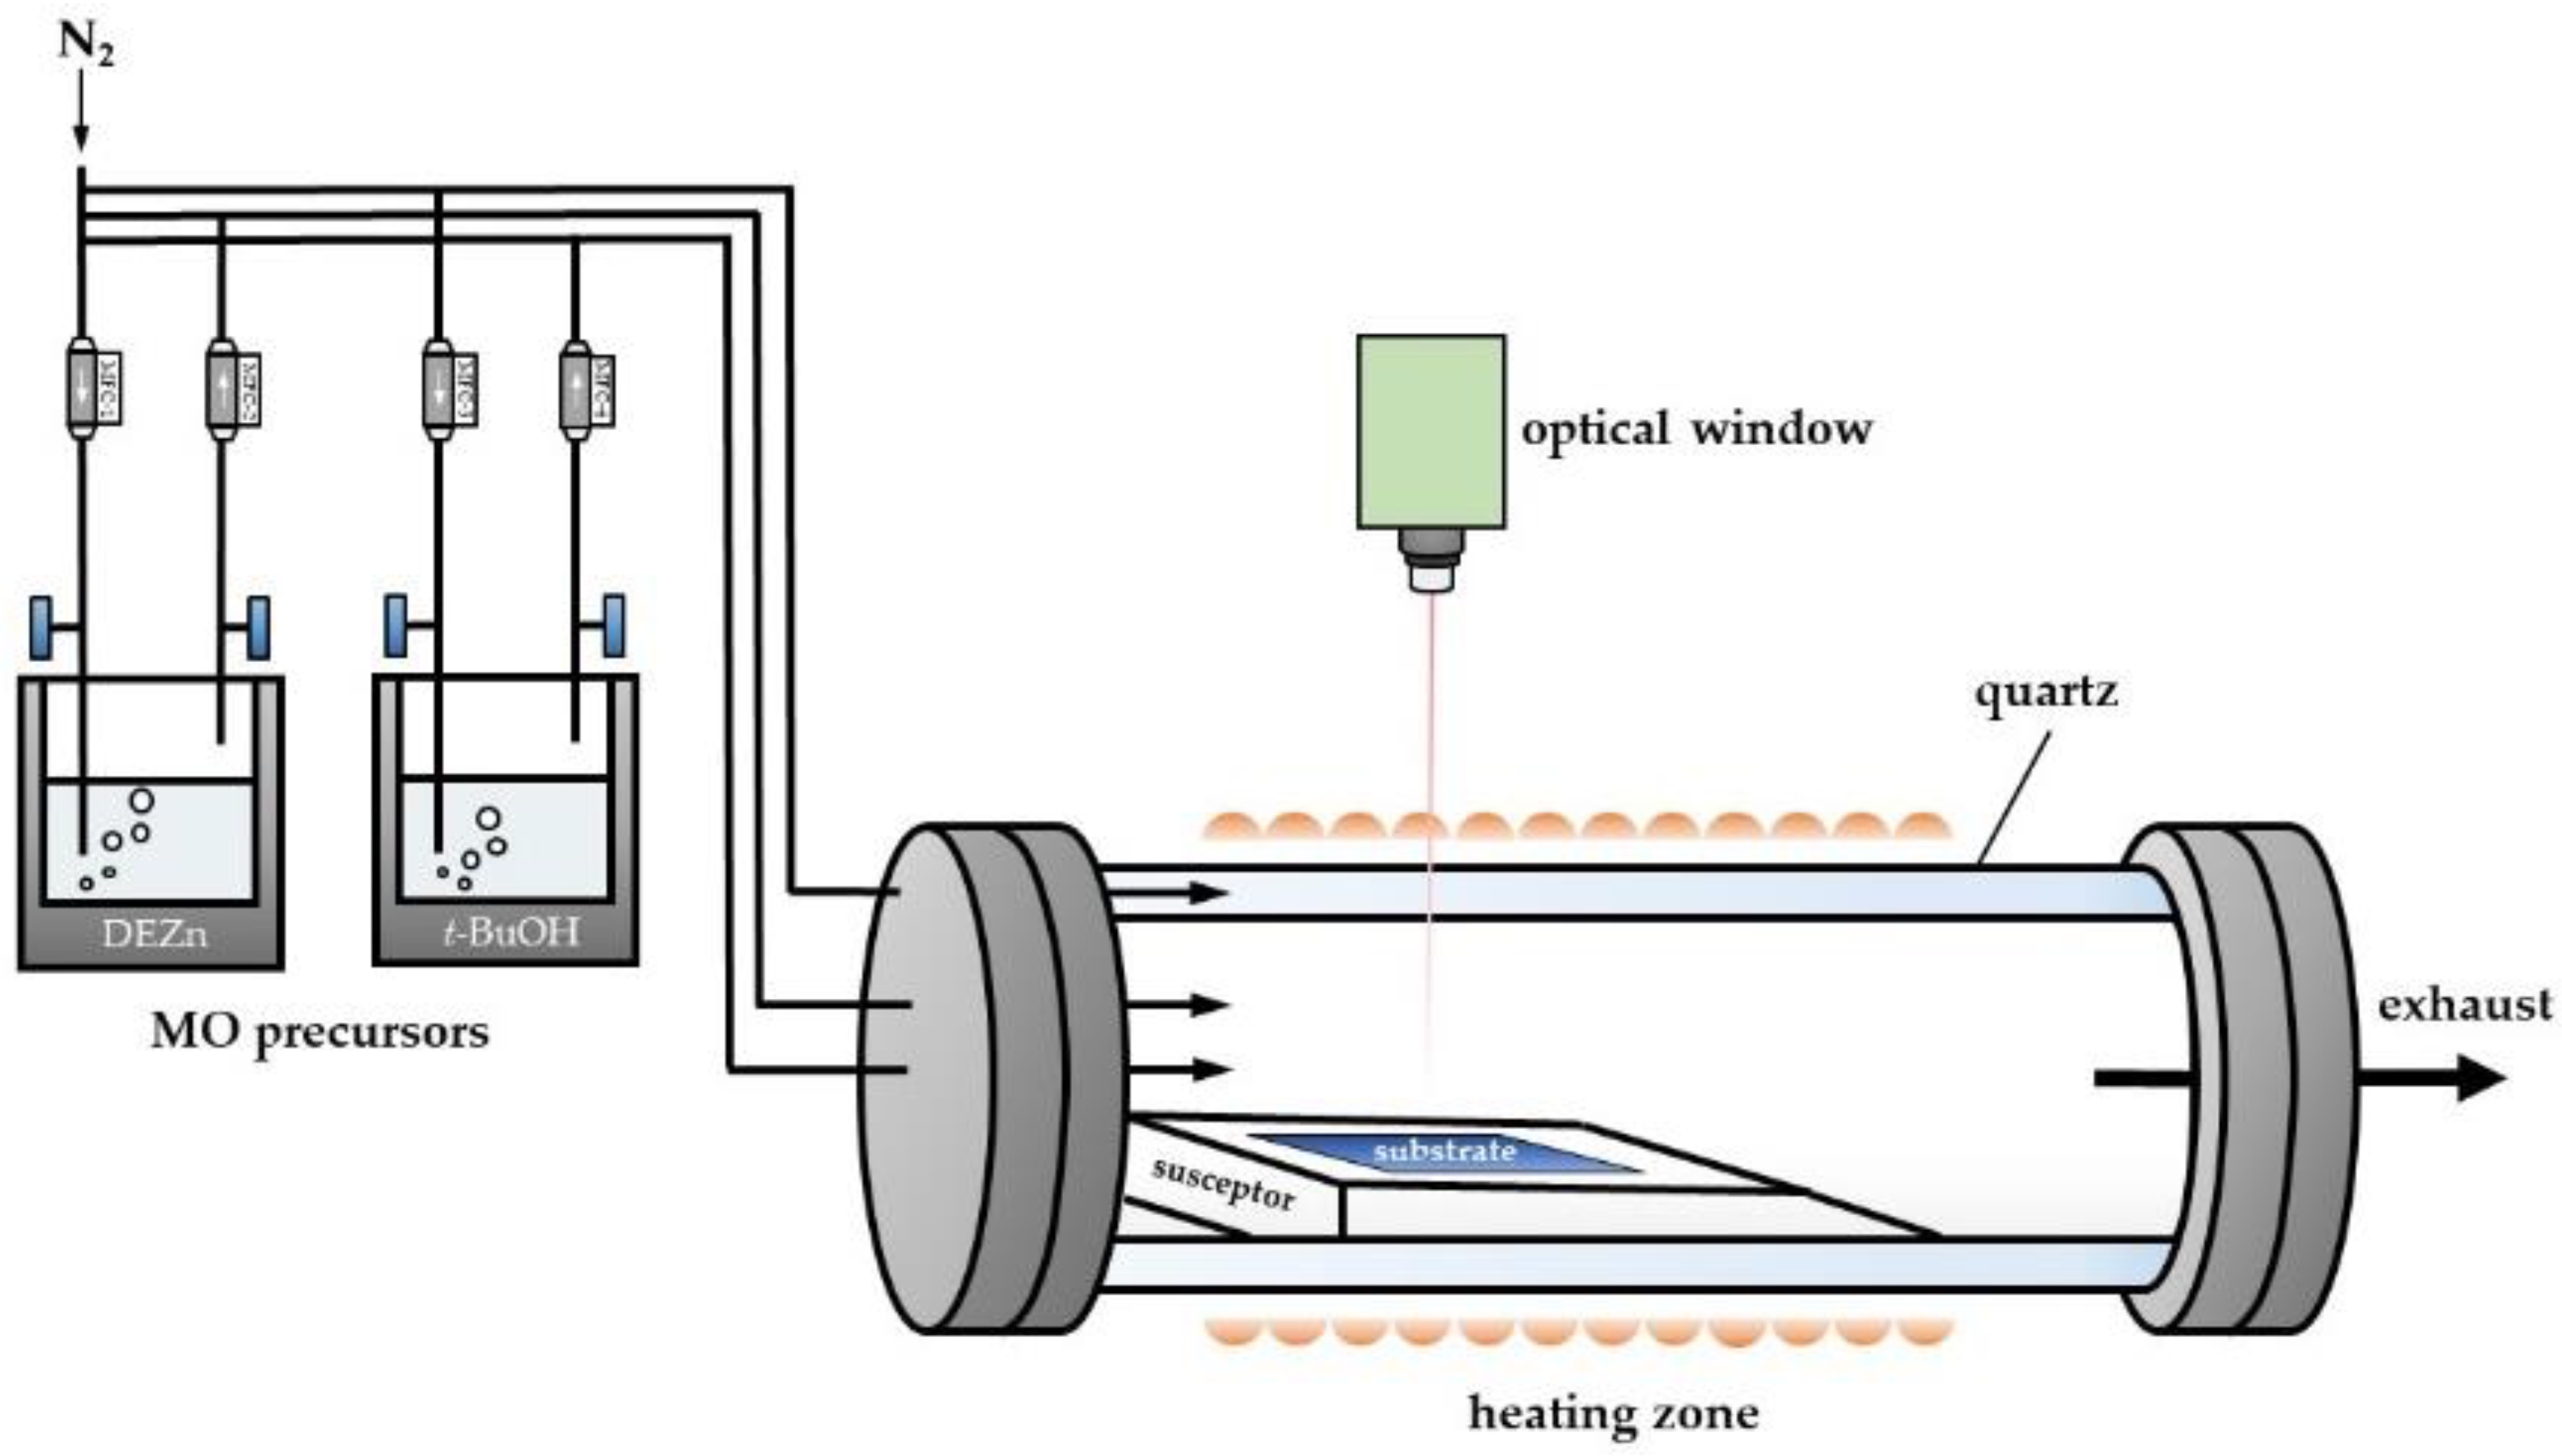
2.1. Physical Model

The configuration of the horizontal MOCVD quartz reactor and its generated grid for numerical simulations are depicted in Figure 1. The dimension of the MOCVD reactor chamber was 560 mm × 64 mm, and the aspect ratio W/H was 1.8. A graphite susceptor was allocated normal to the bulk gas flow in the deposition zone of the reactor. The mesh was generated with the upper surface of the susceptor as the boundary in order to simplify the numerical model. The total number of grid cells was approximately 247,000 with a non-uniform grid. Around the deposition zone, incrementally finer meshes were created above the susceptor surface wall. The grid-independency of the solution was checked by quadrupling the total number of cells and the grid adopted in this study was sufficiently fine to avoid numerical errors under consideration of computational efficiency.

2.2. Governing Equations

The equations for the conservation of mass, momentum and energy of an incompressible flow with variable density under the Boussinesq approximation and in the Cartesian coordinates are as follows:
ρ t + ( ρ U ) = 0
( ρ U ) t + ( ρ U U ) = p + τ + ρ g
c p ( ρ T ) t + c p ( ρ U T ) = ( κ T ) + Φ + S E
where ρ is the density of the fluid flow, t is the time, U is the velocity of the flow, τ is the viscous stress tensor, g is the acceleration of gravity, c p is the specific heat per unit mass of the gas, T is the temperature, κ is the thermal conductivity, S E is the internal heat source term and Φ is the dissipation function arising from the viscous effects that mechanical energy is converted to heat. The species transport process is described by a convection–diffusion equation:
t ( ρ ω i ) + ( ρ U ω i ) = J i + R i + S i
where ω i is the mass fraction of species i, J i is the net diffusion flux of species i, R i is the net chemical reaction rate of species i and S i is the combined source term.
In the MOCVD system, the gaseous precursors of diethylzinc (DEZn) and tert-butanol (t-BuOH) are carried by nitrogen (N2) into the reactor chamber. The ZnO deposition is realized by the gas diffusion coupled with the chemical reaction on the substrate. It is assumed that the concentrations of the bulk (solid) species do not affect the reaction rate, the rate of the surface reaction (Ri,b) thus can be written as:
R i , b = ( b i b i ) k [ G i ] wall η i
where b i and b i are the stoichiometric coefficients for each reactant and each product of species i, k is the rate constant which can be calculated by Arrhenius expressions, η i is the rate exponents of the gaseous species i and G i represents the molar concentration of gas-phase species that adsorbed on the wall surface. Overall, the reaction is assumed to take place on the substrate surface as:
DEZn ( g ) + t BuOH ( g ) ZnO ( s ) + R ( g )
where R represents the by-products of this chemical reaction which mainly are C2H6 and C4H8.

2.3. Boundary Conditions

For all numerical simulations in this study, a continuum flow was encountered under the pressure of 975 mbar. The II/VI (DEZn/t-BuOH) ratio was kept at 0.33 with the total flow rate of the gas mixture fixed at 4 slm (standard liter per minutes). The deposition temperature was varied from 593 to 713 K. A no-slip boundary condition was assumed for all chamber walls, including the substrate surface. Velocity inlet and pressure outlet were adopted on the inlet and outlet boundary, respectively. A chemical reaction was active on the susceptor surface. The wall temperatures were determined by the conduction and convective heat transfer between reactor wall and surrounding air (at 300 K). The flow behavior was assumed to be laminar for the current operating conditions due to the small Reynolds number (Re < 60). The detailed boundary conditions are listed in Table 1.

2.4. Numerical Procedure

The second-order upwind differencing scheme was employed over the whole computational domain to approximate the solution of momentum, energy and species equations in terms of accuracy and stability. The semi-implicit method for pressure linked equations (SIMPLE) algorithm was used for the pressure velocity coupling. As convergence criterion, the normalized residuals of energy and other variables were on the order of 10−6 and 10−5, respectively.

3. Experimental Details

3.1. Growth of ZnO

The experimental procedure and the schematic diagram of the MOCVD system is illustrated in Figure 2. The entire gas flow system including tubing and bubblers were assembled and connected with stainless steel. The gaseous precursors of diethylzinc (DEZn) and tert-butanol (t-BuOH) were carried by nitrogen (N2) into the reactor chamber, and the flow rates were controlled by the mass flow controller (MFC). Precursors were transported in separate gas lines until they reached the reaction chamber in order to effectively avoid the pre-reactions. The gas injector was used to provide a uniform, symmetric and steady gas flow. The rectangular reactor was enclosed by a quartz dome and the main deposition zone was protected by the standing heat protective shields from outside. The susceptor was located in the center of heating zone and heated indirectly by means of an infrared heating element. The temperature was measured by inserting the thermocouple tip into the susceptor. The ZnO deposition process was real-time monitored by an in situ laser reflectance interferometry (LRI) employing a 635 nm diode laser. The reflectance signal from interferometry of ZnO growth indicated the nucleation time and growth time of thin films. The ZnO thin films were deposited onto the glass substrate (Corning 1737) with an area of 33.6 cm2, which was placed on the leading edge of the susceptor. A standard pre-treatment procedure was adopted before each experiment run to prevent the affection of substrate surface cleanness (pollution), i.e., the glass substrate was brushed gently with deionized water, and then high-pressure nitrogen was used to blow the residual deionized water and other impurities off the substrate.

3.2. Deposition Rate and Characterization of ZnO

The whole deposition process was monitored by in situ laser interferometry employing a 635 nm diode laser to measure the nucleation time and growth time. To calculate the deposition rate (DR) of ZnO, surface profilometer (Veeco Dektak 150) was performed to measure the thin film thickness of ZnO layer, and the mass deposited on the substrate was acquired by analytical balances with a scale of 0.1 mg resolution (Mettler Toledo). The characterized morphology and elemental composition were analyzed by scanning electron microscopy (SEM) (Sigma VP, ZEISS, Jena, Germany). The samples were recorded by using a Bruker D8 advance X-ray diffractometer (Bruker Optik GmbH, Ettlingen, Germany) with Cu Κα radiation (λ = 1.5406 Å) to ensure the ZnO thin film was successfully deposited on the substrate as desired.

4. Results and Discussion

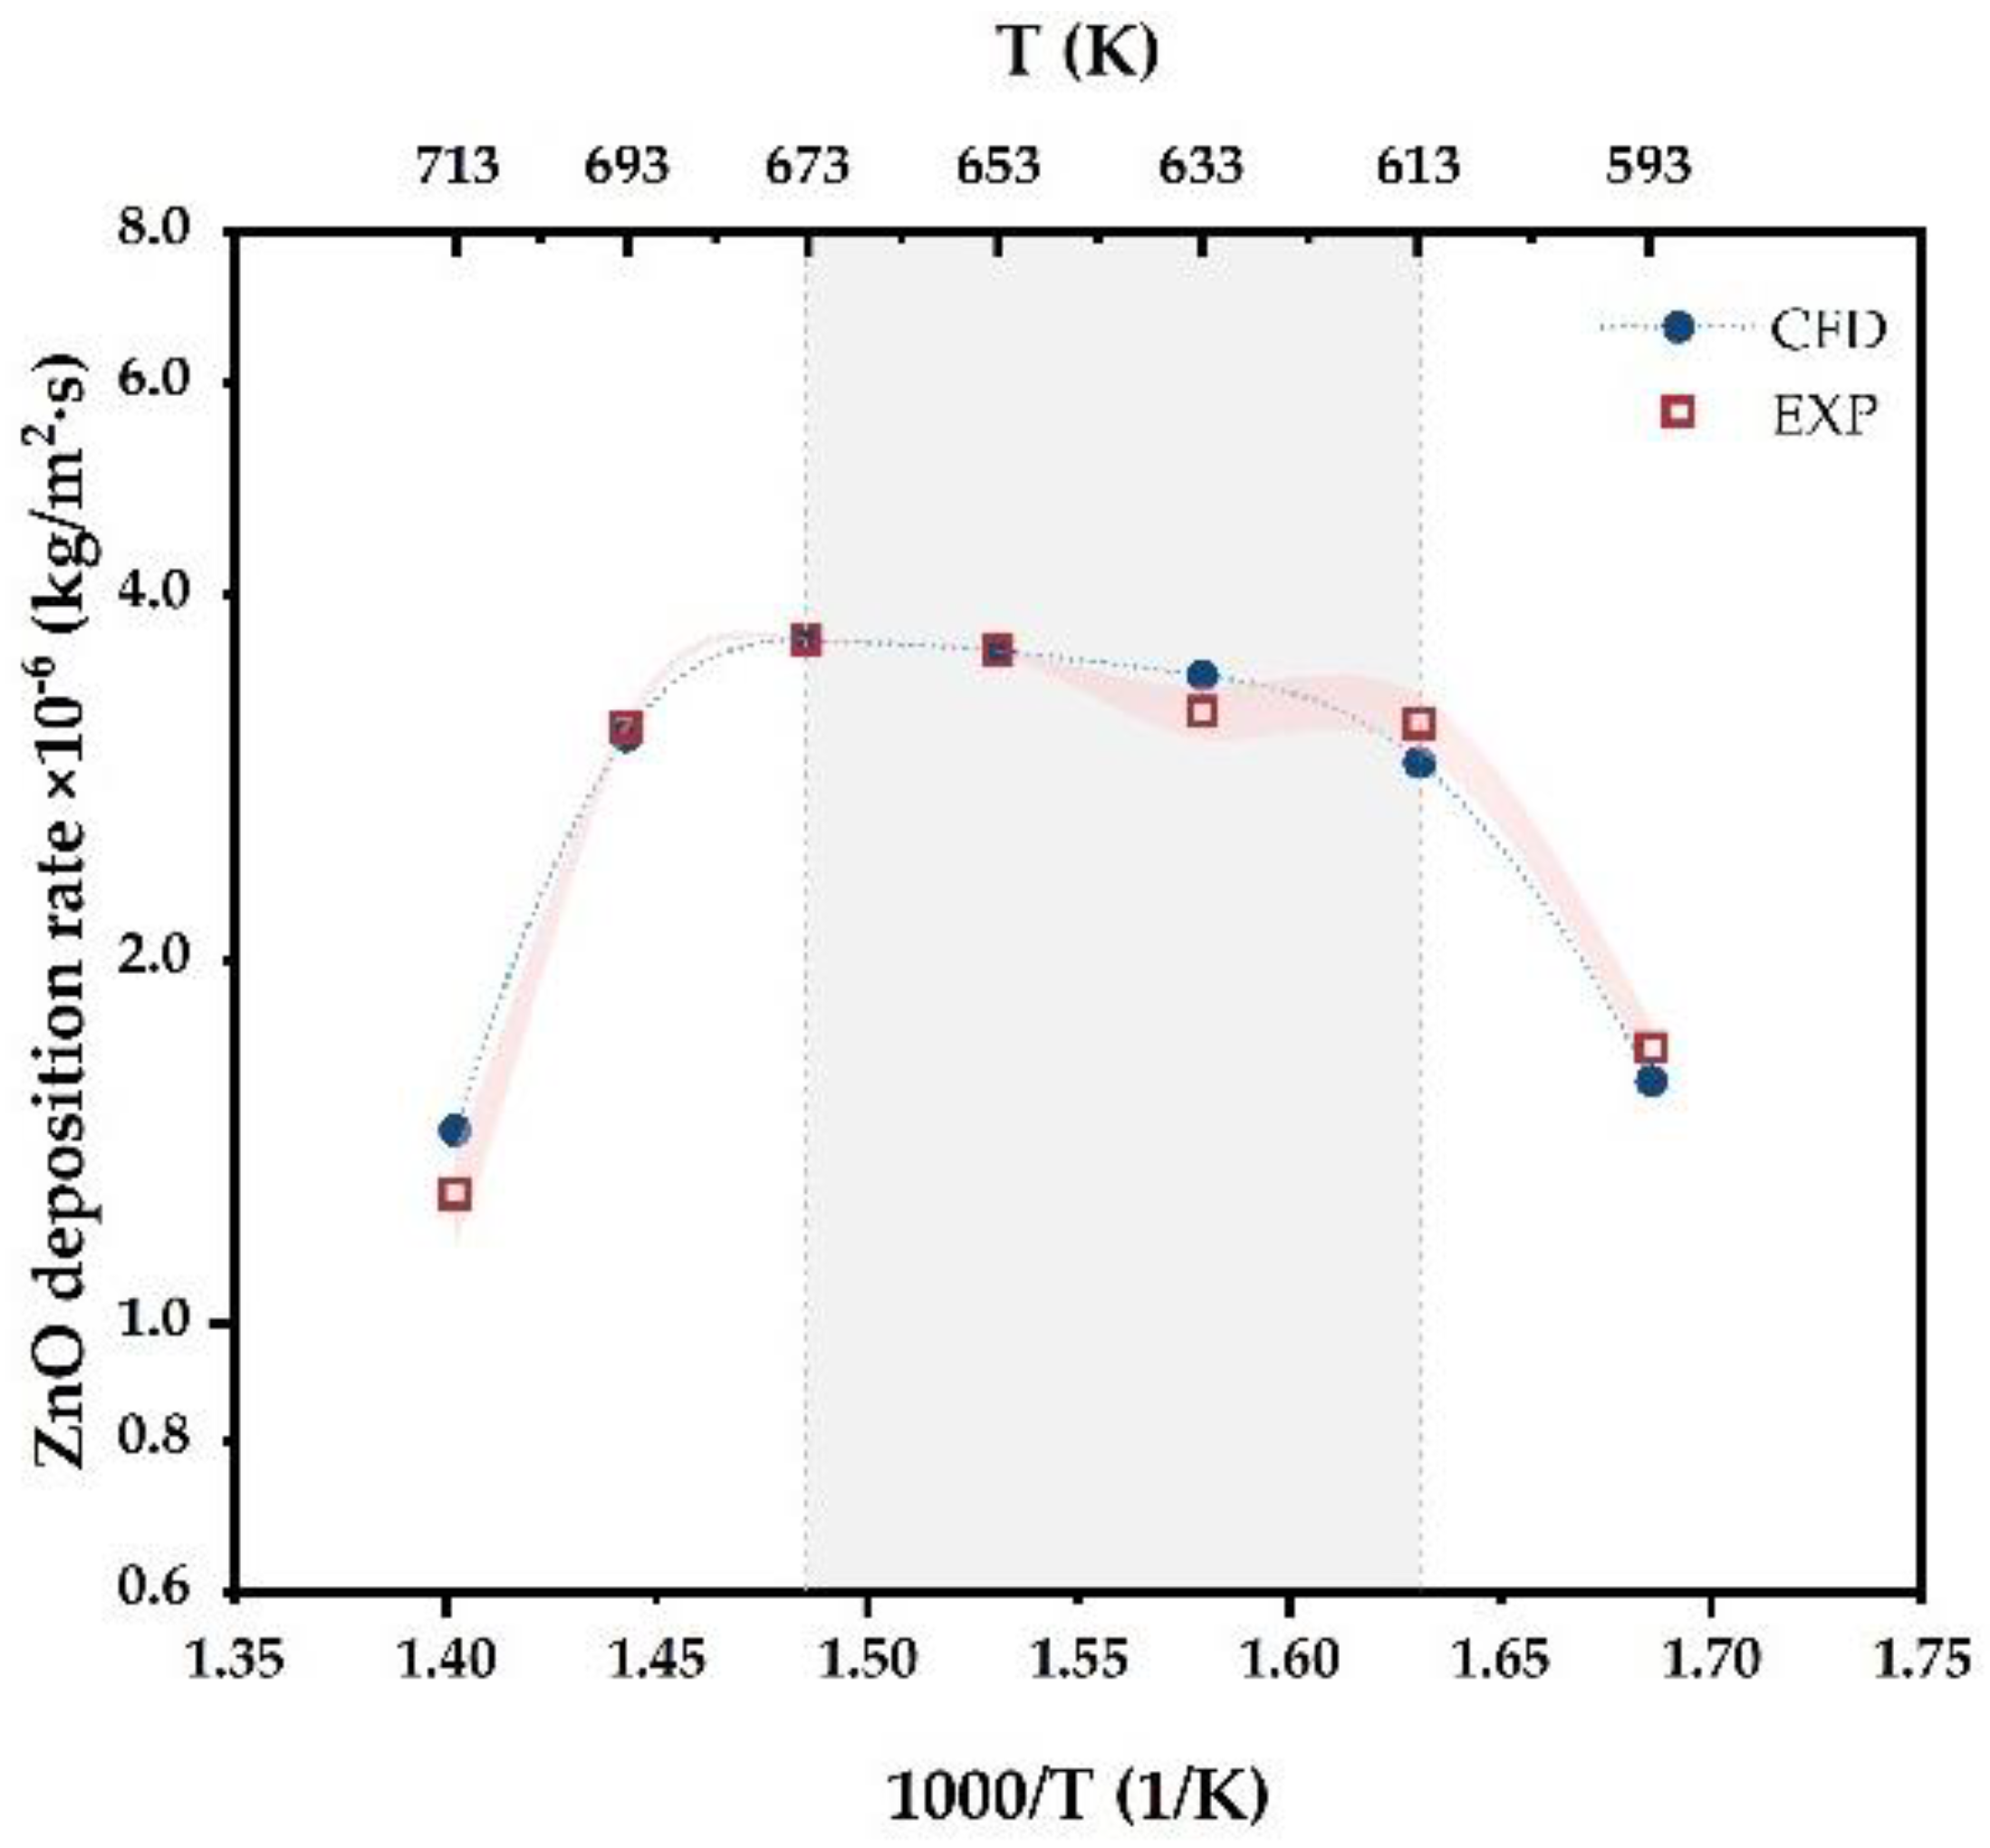
4.1. Model Validation and Temperature Effects

A comparison between the numerical results and experimental data for ZnO deposition rates are plotted as a function of temperature (593 to 713 K) in Figure 3. A good agreement was achieved; the 3D modelling predictions agreed well with the experimental deposition rates at low- and mid-temperature ranges, but not as well at the high-temperature range. The discrepancies between the experimental and CFD results at 613, 633 and 713 K were possibly due to experimental errors, within the averaged relative experimental error less than 2%.
A distinct ‘up-flat-down’ temperature-dependent variation trend was identified under the studied temperature range, corresponding to three regions of growth: a low-temperature kinetic-limited range, a mid-temperature mass transport-controlled region and a high-temperature desorption-dominated regime. The ZnO deposition rate was highly temperature-dependent below 613 K, where the deposition was kinetically limited by the thermally activated decomposition of the precursor/radicals. As the deposition temperature rose, the growth was found to be weakly dependent on the deposition temperature between 613 and 673 K. The ZnO deposition rate could reach up to 3.7 × 10⁻⁶ kg/m2·s with a maximum temperature of 673 K. In this temperature range, the ZnO deposition rate was controlled by the diffusion of precursors in the gas phase through a stagnant boundary layer to the substrate surface, since the surface reactions occurred much faster than the diffusion process. The deposition rate provided little insight with regard to the reaction mechanisms; it was found to be associated with a diffusion coefficient proportional to T3/2. In the desorption-limited region, an inverse relation between deposition rate and temperature was found in the high temperature range (>673 K). The ZnO deposition rate fell off as the temperature further increased, which indicates that the dominant factor limiting growth was the desorption kinetics of the species or gas phase depletion effects caused by the thermal cracking of the precursors before reaching the substrate surface. It should be noted that most MOCVD processes are conducted under the diffusive species transport dominated region [33], and this is mainly because high growth rates and high throughput can be achieved, so that the high-temperature region was not taken into consideration in the following studies.

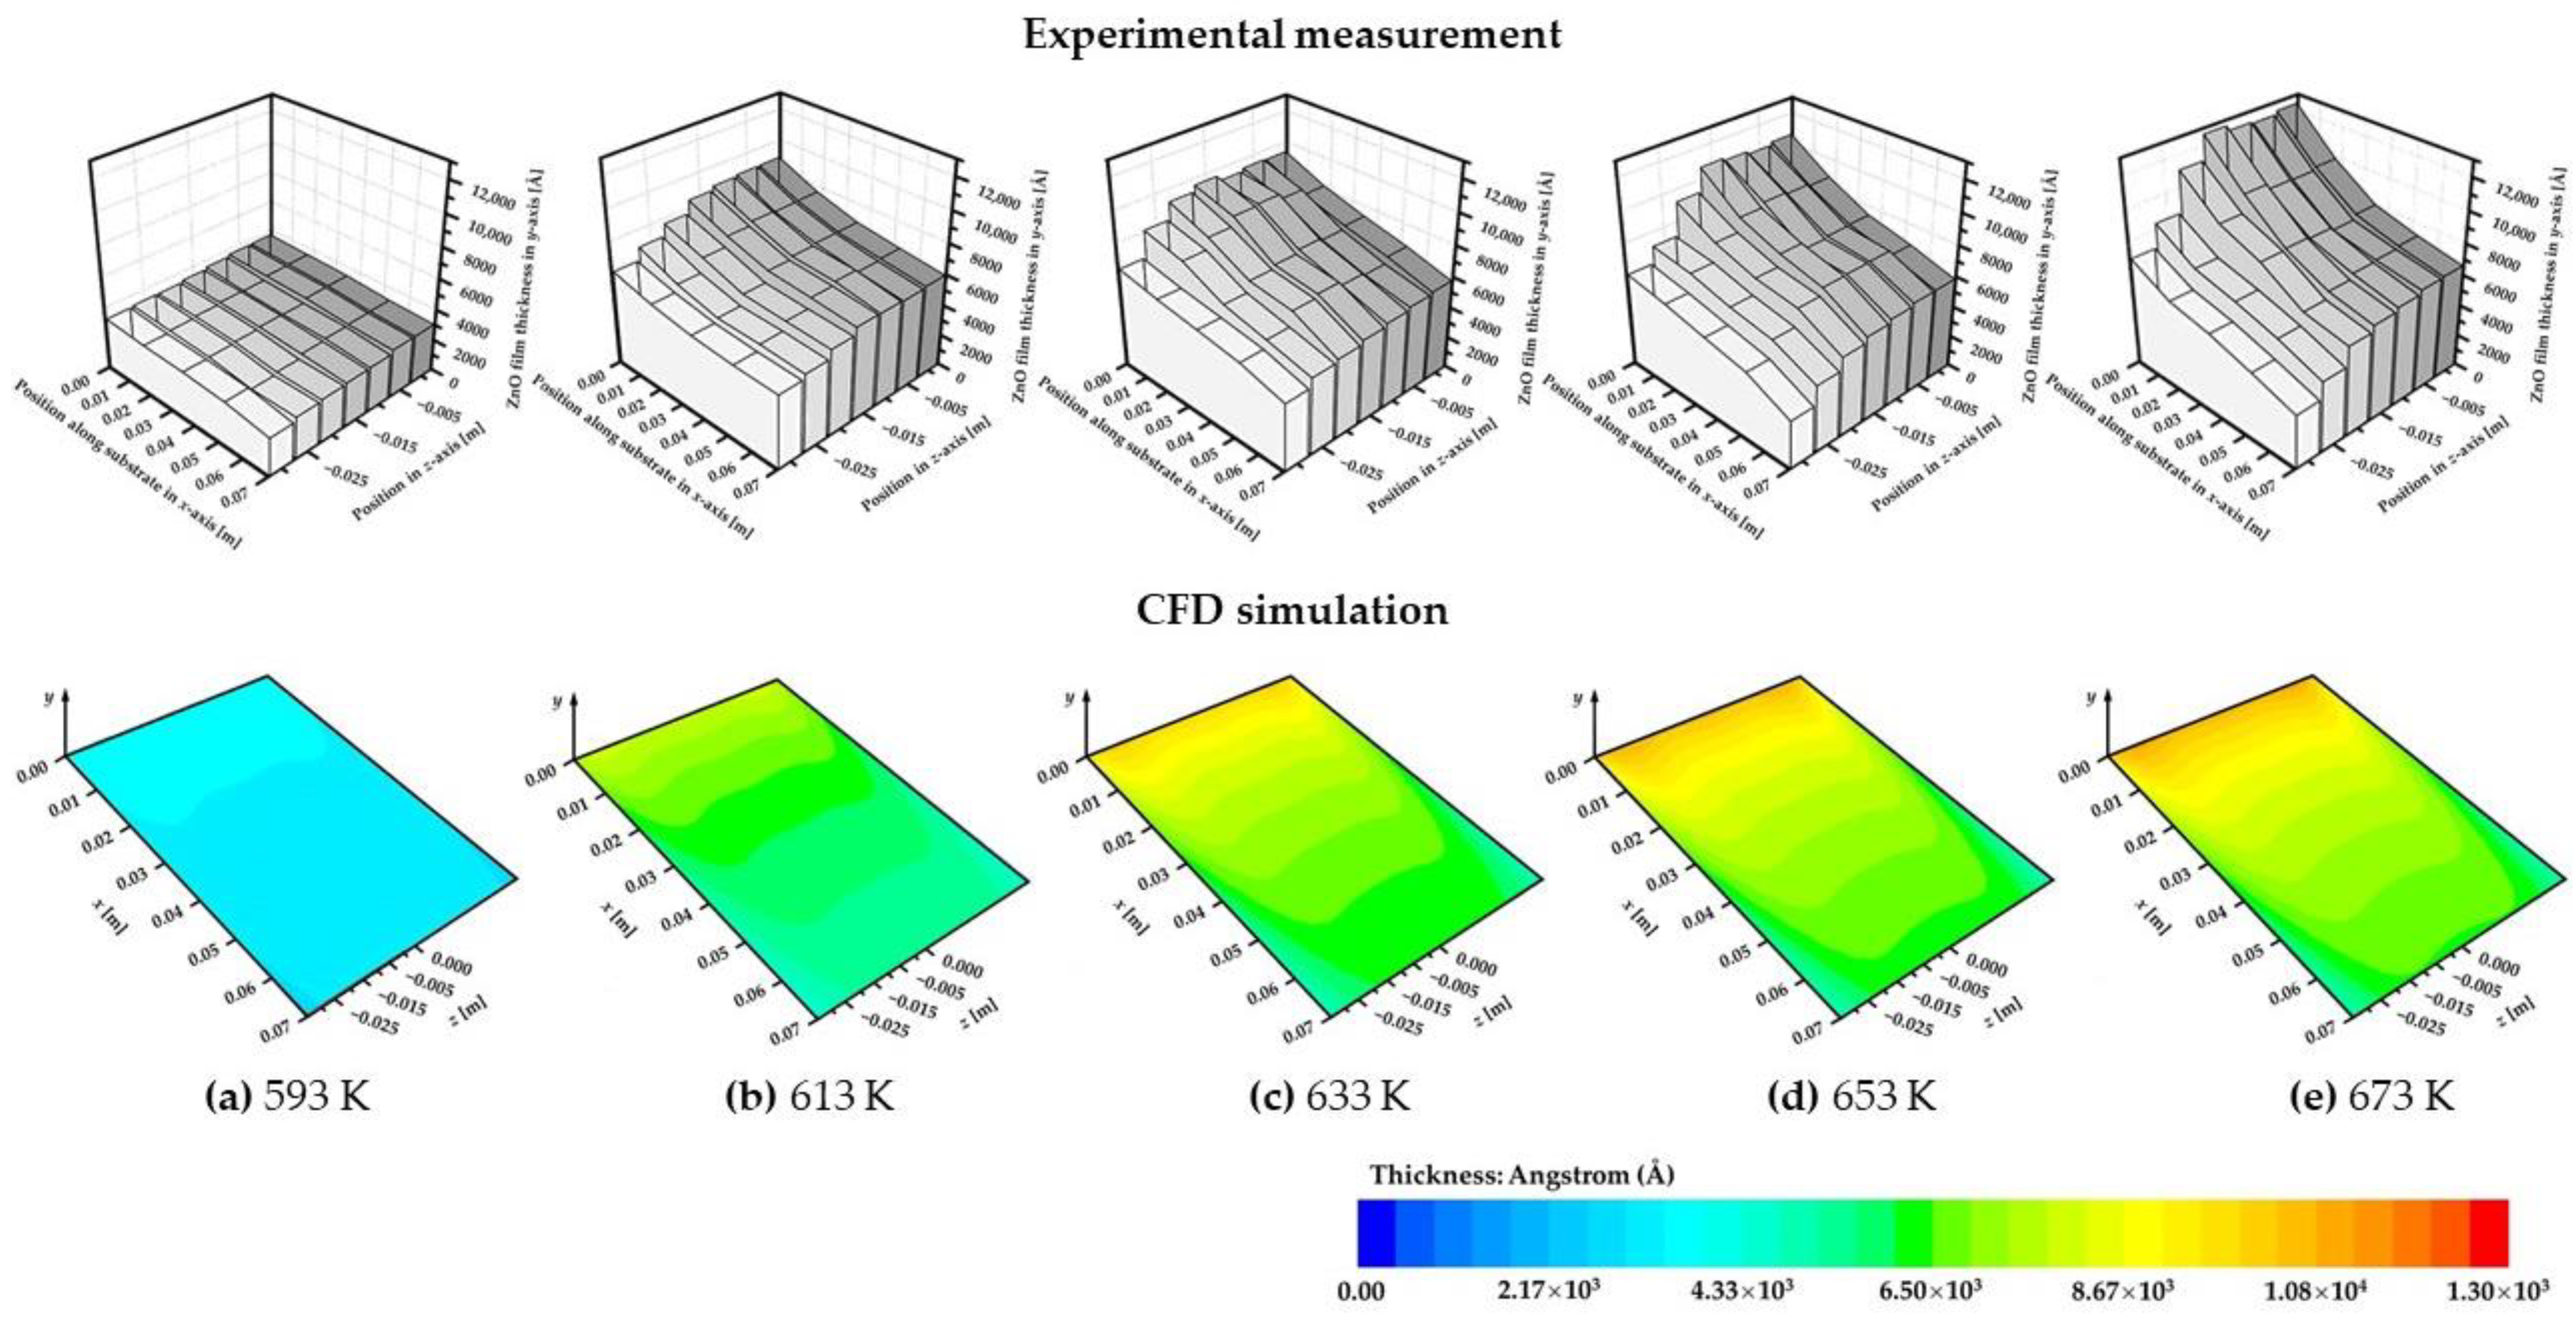
4.2. Thin Film Thickness and Uniformity

The ZnO growth rate was found to decay exponentially under variable temperature regimes (593 to 673 K). The distribution of the growth rate as a function of the axial position z for different lateral positions x is demonstrated in Figure 4. It can be observed from Figure 4a that the steep decline of growth rates along the flow path favored higher deposition temperatures because of the effective diffusion boundary layer thickness. The latitudinal decline of ZnO growth at lower temperatures was less pronounced (i.e., 593 K), resulting in a thin, uniform thickness over the substrate.
The lateral variation of ZnO growth rates was further examined for three different positions of the substrate: x = 0.02 m, x = 0.04 m and x = 0.06 m. For mass-transfer controlled depositions at temperatures ranging from 613 to 673 K, the ZnO growth rate distributions initially presented a lower growth rate in the center and higher growth rate on both sides along the z-axis of the substrate (see Figure 4b). This was probably caused by a lateral inward (positive) vortex motion, driving the gas flow to move upward near reactor walls and downward in the center, which provided a more effective supply of reactants on the sides. However, as the temperature and flow profiles gradually developed, this phenomenon was less pronounced at the edge of the substrate as shown in Figure 4c,d. However, at the transition temperature of 613 K, the lateral distribution was slightly affected by the vortex motion, revealing that the mass transport and chemical kinetics both contributed to the distribution behavior of ZnO growth rate. Additionally, contrary to mid-temperature range, ZnO films exhibited a more uniform distribution at 593 K due to the predominant chemical kinetics.
The contours of ZnO thin film thickness on the substrate are depicted in Figure 5. A quite similar trend for ZnO thickness variation was observed between the numerical results and experimental data (only half of the substrate width was demonstrated for experimental data). The deposited ZnO thin film was thicker at the leading edge of substrate at all temperatures. The fluctuated ZnO thickness along lateral position z was assumed to be influenced by the presence of recirculation rolls in the entrance zone. However, such upstream vertex flow may not have had negative effects; instead, it may have improved the uniformity of the deposition on the substrate. Specifically, Figure 5a shows that the ZnO film exhibited good uniformity at the temperature of 593 K, both numerically and experimentally, with a relatively smooth surface and modest thickness variations (mean thickness, M = 3145 Å, standard deviation, SD = 304). In Figure 5b, the ZnO thickness almost doubled as the temperature increased to 613 K, and the uniformity of ZnO film reduced in the longitudinal x-direction (M = 6594 Å, SD = 1108). Figure 5c shows a similar thickness trend at 633 K (M = 6867 Å, SD = 1497), although the lateral thickness distribution had a more noticeable change. With a continuous increase in temperature, ZnO had a thicker film but less uniformity. On average, the thickest film was found to be 7740 Å at 673 K, and the thickness variation was less than 150 Å between 653 and 673 K. The depletion of the ZnO thickness on the substrate from center to edge is depicted in Figure 5d,e.

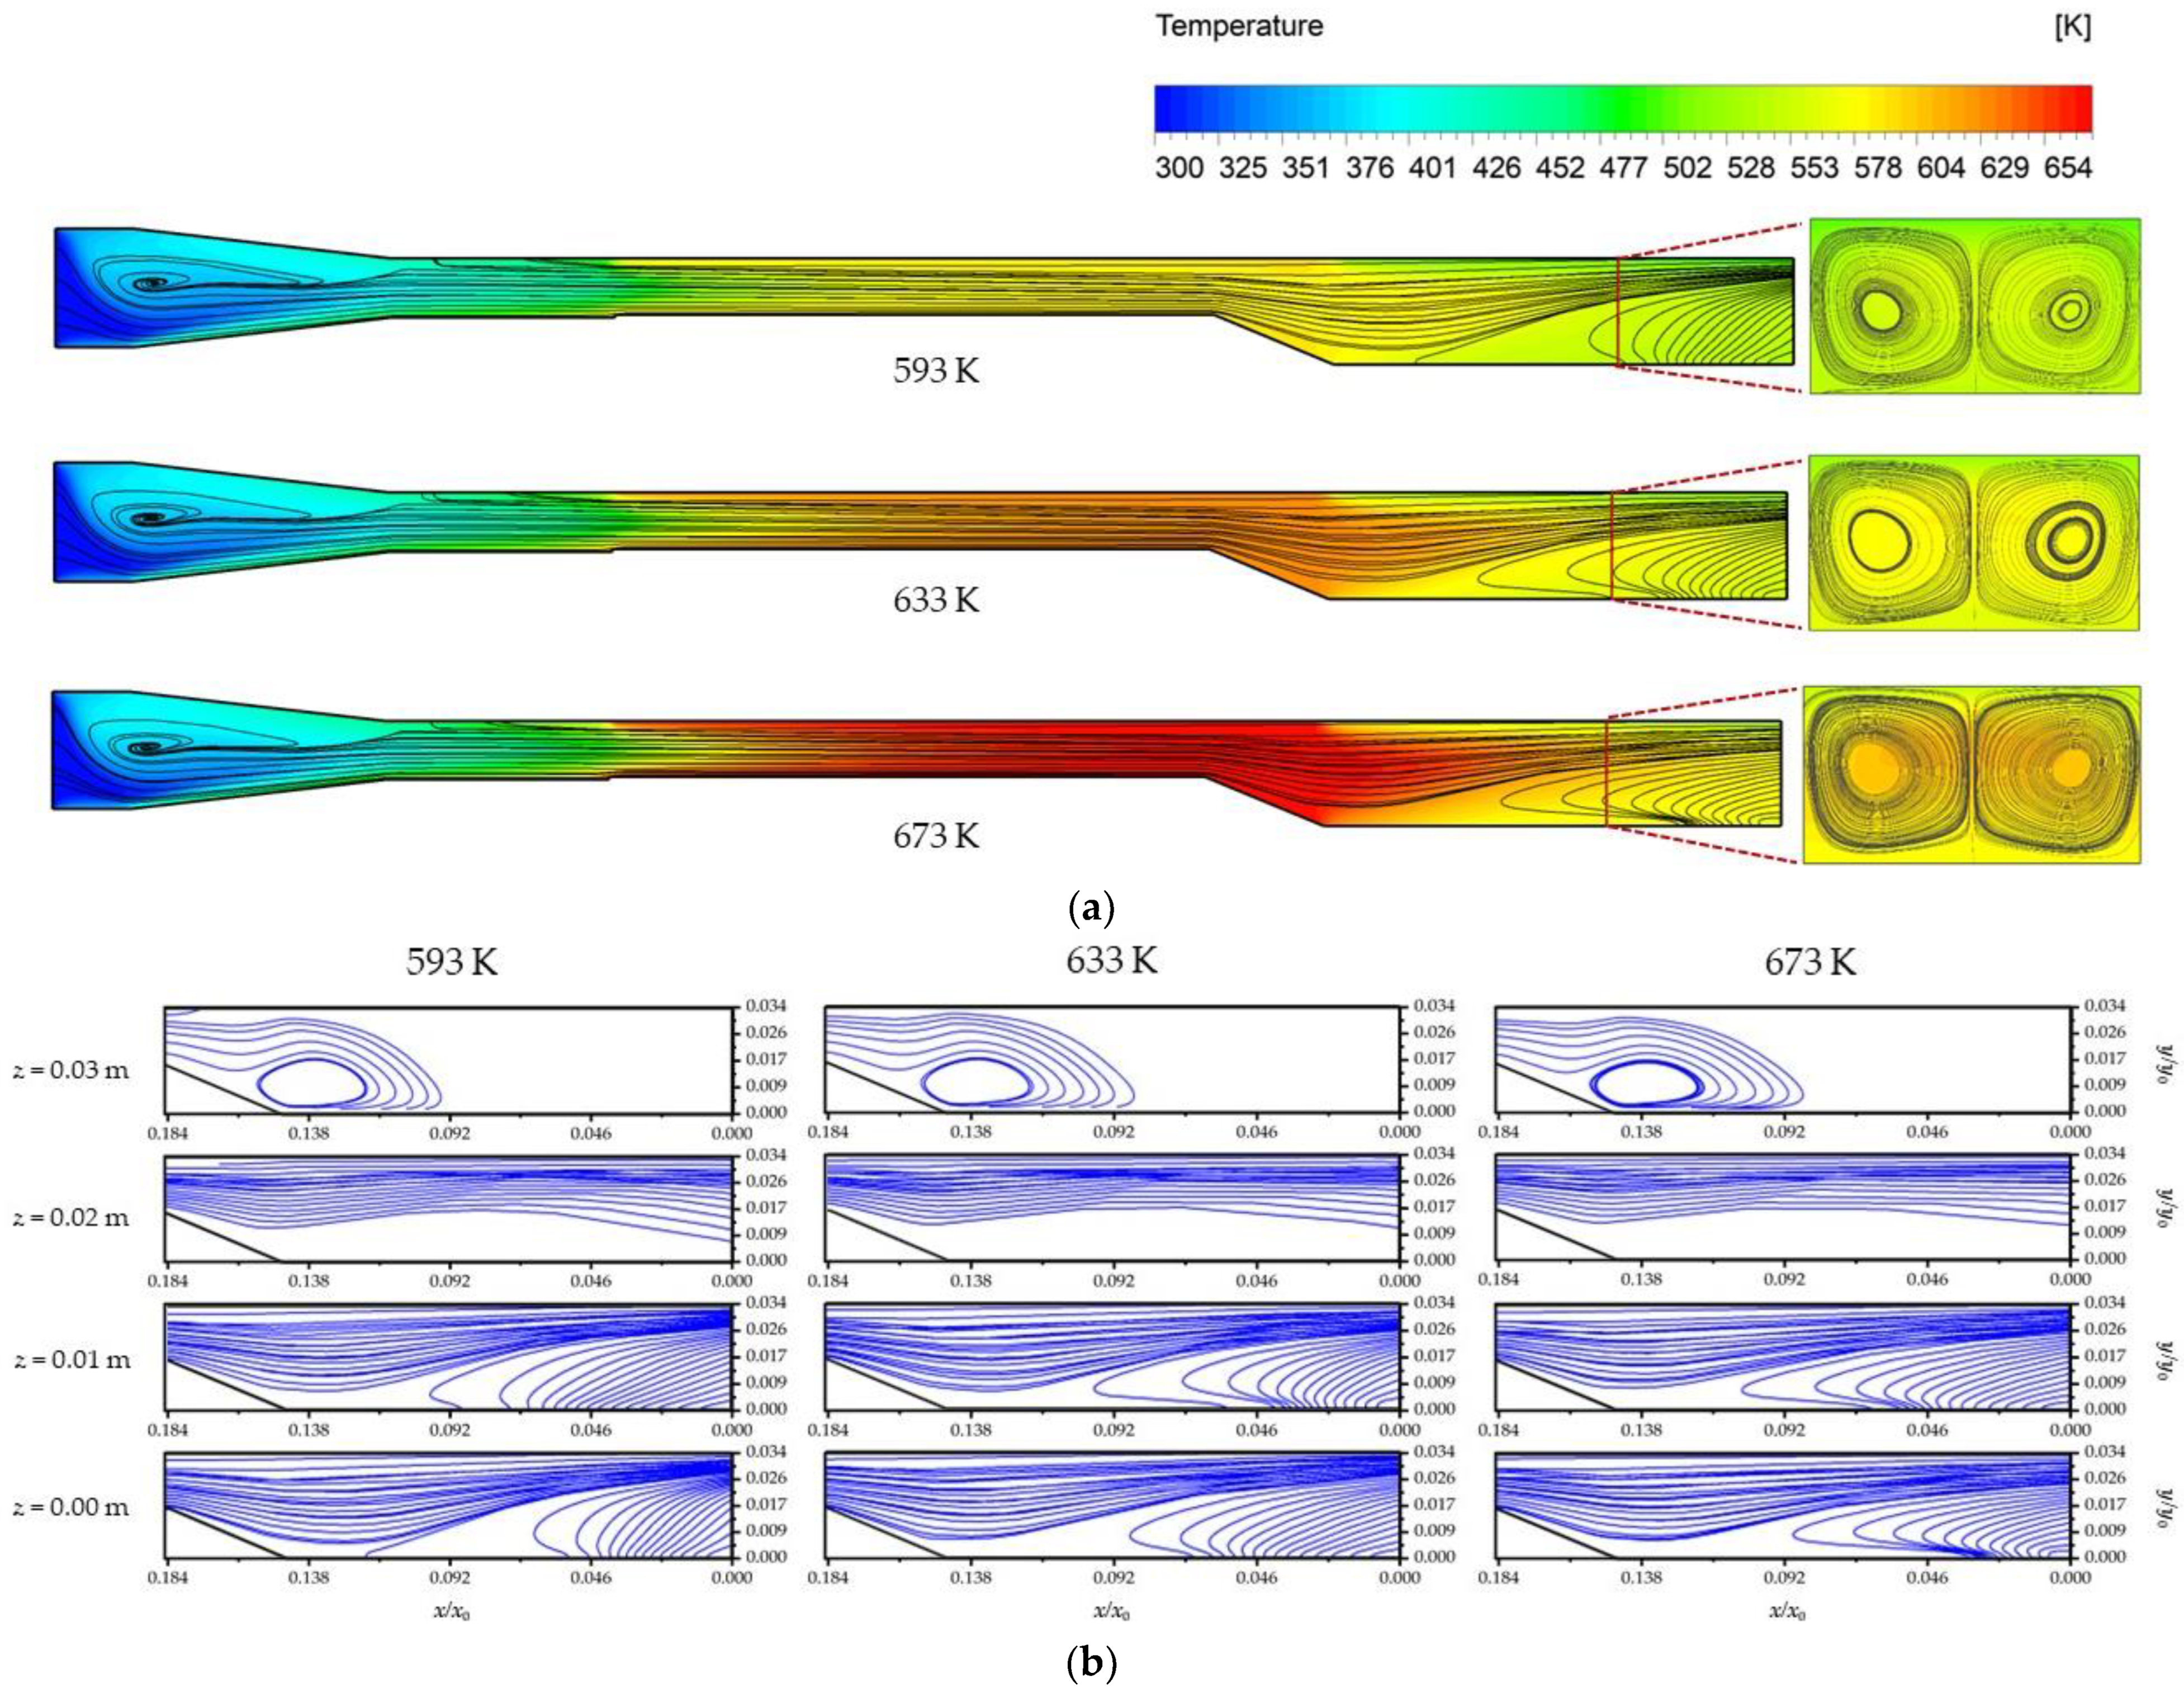
4.3. Flow, Thermal and Concentration Fields

The above results demonstrate that the distribution and uniformity of ZnO films was significantly affected by the heat transfer and flow characteristics. Figure 6 clearly presents the streamline of gas flow inside the horizontal reactor; a “snaking” flow motion was found at the leading and trailing edges of the susceptor, which was ascribed to the combination of the transversal rolls with longitudinal rolls. A high Rayleigh number (1290 < Ra < 3000) was also found in the temperature range of 593 to 673 K. This mixed thermal-induced flow motion was quite strong in the entrance zone but showed a neglectable difference under the effect of deposition temperature. However, a weaker mixed roll appeared again in the exhaust zone, and it was much more pronounced at the lower temperature of 593 K as seen in Figure 6a. Moreover, the temperature distributions and gas flow patterns exhibited a stable performance over the susceptor for the present flow conditions.
The predicted streamlines coupled with temperature contours at the mid-plane of the reactor are shown in Figure 7a. A transverse roll waves feature in both upstream and downstream, and the buoyancy-to-inertia ratio Gr/Re2 were found to have exceeded the threshold value of 10, indicating that the buoyancy-induced secondary flow was superimposed over the main convection flow. The buoyancy force gave rise to both longitudinal and transverse rolls in the reactor, resulting in a nonuniform heat flux distribution. In the entrance zone, the cold gas flow had a lower temperature than that of the surroundings, which caused the sudden expansion of the gas mixture and further led to the large entrance effect. However, such a strong upstream transverse roll was proven to have no discernible change, mainly because a similar temperature distribution was detected under the effect of the thermal boundary conditions at the side walls. In the heated reaction zone, a uniform heat flux boundary condition was imposed with the consideration of the effective protection of the heat shield. The thermal boundary layers were thus established adjacent to the top wall and susceptor surface, respectively, causing a “cold-finger” effect.
While the downstream transverse roll entrained the gas flow in exhaust zone, a symmetric flow structure was observed from the central plane (x = 0 m) towards the sidewalls (x = −0.032 m and x = 0.032 m). The symmetric planes of the flow structure (x = 0 m to x = 0.032 m) at different temperatures are shown in Figure 7b. The streamlines indicate the 3D transverse traveling waves gradually formed from edge to center. The downstream rolls first appeared at both sides of the reactor due to the steep susceptor surface and the temperature difference between gas flow and reactor walls. As the temperature increased to 673 K, the reverse flow showed a slightly stronger motion in intensity than the lower temperature. Compared with 593 K, the elongated rolls on the sides shifted the centered recirculation cell downstream at 673 K. It was noted that the temperature variation overall had only a minor effect on the transverse rolls, especially in the mid-temperature range (633 and 673 K).
In order to further investigate the effect of longitudinal rolls on the uniformities of ZnO depositions, the cross-sectional view of velocity vectors at various vertical planes with the temperature of 673 K is depicted in Figure 8. The longitudinal rolls were symmetrically located on both sides of the central plane. As expected, a large, buoyancy driven recirculation cell occurred in the highly unstable entrance zone due to large temperature gradient (above 130 K), as shown in Figure 8a. The cold gas flow was denser; the thermal buoyancy force may thus have driven the expansion of the gas flow and move upward near the side walls from bottom, which induced an outward (negative) vortex motion. As the reactor height decreased and the fluid heated up, the transverse vortex motion gradually weakened(see Figure 8b). However, Figure 8c,d shows no further changes in the side view velocity vectors above the susceptor, revealing that a stable flow was formed. These ideas are in accordance with results obtained from velocity distributions along susceptor. Once the gas flow passed through the heated susceptor, two recirculating flow structures with an inward (positive) vortex were reformed near the top corner of the reactor in the downstream region since the bulk gas temperature was slightly higher than the surroundings (see Figure 8e). The longitudinal rolls were found almost in the same shape, but weaker in intensity and more even in size along susceptor, which led to axial and lateral non-uniformities in the concentration distribution of species, and hence influenced the uniformity of ZnO thin film on the substrate.
Due to the excess of t-BuOH, DEZn became the limiting species that dominated the ZnO deposition process. The concentration distribution of DEZn on the susceptor was directly impacted by the thermal fields, and it was closely related to the growth rate and uniformity of the deposition in the reactor. Figure 9 shows the concentration distribution of DEZn at different temperatures. Affected by the “cold-finger” effect, the concentration of DEZn was depleted along the susceptor length, which led to the decay of ZnO growth rates downstream, consistent with the previous observations. The concentration profiles remained almost unaffected at varied temperatures. As was shown in the previous discussion, the ZnO deposition was kinetically controlled at 593 K. Figure 9a shows a thin concentration boundary layer, revealing that most of DEZn species were taken away by the bulk gas flow before the surface reaction took place. In the diffusion-dominated regime, the reaction rate of surface reaction was assumed to be very quick and a similar concentration profile was found above the substrate. The diffusion rates increased with increasing temperature, so that the consumption of DEZn species at 673 K was slightly greater than that at 633 K above substrate (see Figure 9b,c). Moreover, it was discovered that the upstream recirculation rolls tended to concentrate the heavier species, i.e., DEZn, in the colder regions, which improved the precursor supply for a more uniform deposition, and effectively prevented gas phase pre-reactions in the entrance zone. However, the downstream rolls drove unreacted species to the top surface of the reactor, which resulted in the unwanted postgrowth of an extra amount of film on the top wall, as shown in Figure 9d.

4.4. The Characterization of ZnO

The SEM surface morphological images of ZnO samples with a high magnification are depleted in Figure 10. The SEM images show that the size of ZnO grains was very sensitive to the deposition temperature and higher temperatures led to larger grain growth. A columnar structure of nanorods with a uniform grain size distribution appeared at the deposition temperature of 593 K (Figure 10a). ZnO seed layer was found predominantly perpendicular to the substrate surface. As the temperature rose to 613 K and the structure of the nanorods turned to be faceted hexagonal-shaped growth as shown in Figure 10b. When the temperature became higher, hexagon-like thin-flake structures were dominant with a larger grain size which densely covered the substrates, as seen in Figure 10c,d. However, Figure 10e shows the coalescence and merging of ZnO grains as the temperature further increased to 713 K, leading to surface defects with a considerably coarser morphology and increased intergranular porosity. The calculated average crystallite sizes based on the Scherrer’s equation at 673 and 713 K were found to be 34.6 nm and 38.0 nm, respectively.
The SEM observations were highly consistent with the three-stage variation results of numerical modelling. At 593 K, due to the relatively slow chemical reactions, the growth was kinetic-limited, and a large number of gaseous species were carried out by bulk flow (Figure 9a) before fully coalescing and growing into hexagonal-shaped ZnO, resulting in a less densely packed but uniform thin film. At the transition temperature of 613 K, a faster reaction rate gave ZnO sufficient time to form a hexagonal structure. As the temperature further increased to 633K and 673 K, the gaseous species diffused onto the substrate and reacted rapidly, which provided more nucleation sites for the growth, leading to a higher density twisted-flake surface. Only a few of the gaseous species were carried out by the bulk flow, as is confirmed in Figure 9b,c, which shows that the gas flow in exhaust zone only contained small amounts of DEZn. When the temperature reached 713K, due to the thermal desorption effect, the chemical species desorbed from the substrate surface, resulting in the observed defects in Figure 10e.
The XRD patterns of ZnO films with the 2θ angle ranging from 20° to 80°are shown in Figure 11 to demonstrate the temperature effects of deposited thin films. All the diffraction peaks were indexed as a high purity hexagonal ZnO wurtzite structure (JCPDS Card No. 36-1451). At the low- and mid-temperature region (593 K to 673 K), the dominated (002) peak was observed at 2θ value of 34.5°, indicating that ZnO thin films had a highly preferred c-axis orientation along the (002) plane. The XRD patterns also show the slight peak at 2θ of 29.6° and 63.0°corresponding to the lattice planes (100) and (102), as well as a very weak peak corresponding to the (103) plane at 47.6°. The detected peaks were almost unchanged with the increase in deposition temperature and a small difference in peak intensities of (100) and (103) plane was observed. When the temperature reached 673 K, the (002) peak intensity of ZnO thin film became significantly stronger, which indicates that the vertical alignment of ZnO film on the substrate was enhanced. It could be indexed to the excellent hexagonal structure and high degree of crystalline orientation. However, as the temperature further rose to 713 K, the pronounced diffraction peak changed into a 2θ value of 36.4° that corresponded to the lattice plane (101) and a minor contribution of (201) plane at 68.2°. This shows that the (101) plane of the ZnO film had a higher intensity than the (002) plane, and that the preferred orientation of the ZnO changed to a wurtzite structure. The possible reason for such change is the high temperature caused thermal desorption, the O species were removed from the crystal structure of ZnO and a number of Zn atoms became dominant, leading to the Zn-enriched (101) plane, and hence the hexagonal (002) plane was suppressed relative to wurtzite (101) [34].
According to the comparison of all SEM images, it can be found that although the uniformity of the Figure 10dwas not as good as that of other low temperatures, it appeared to have a denser and thicker ZnO coating; this finding was also reflected by the XRD. This phenomenon is consistent with the numerical results in Figure 4, which shows that a lower temperature produced a more uniform coating with a thinner layer, and vice versa. Overall, 673K is a preferable deposition temperature.

5. Conclusions

The ZnO thin film was successfully grown on a glass substrate by DEZn and t-BuOH precursors using the MOCVD technique. The temperature effect on the macro-scale (thickness) and micro-scale (composition and structural) uniformity of ZnO was investigated numerically and experimentally, respectively. The observed growth behavior may be further explained by the flow structure and heat transfer in a horizontal reactor through 3D CFD modelling. The structure and growth of ZnO films were confirmed with comprehensive characterization methods. The findings can be concluded as follows:
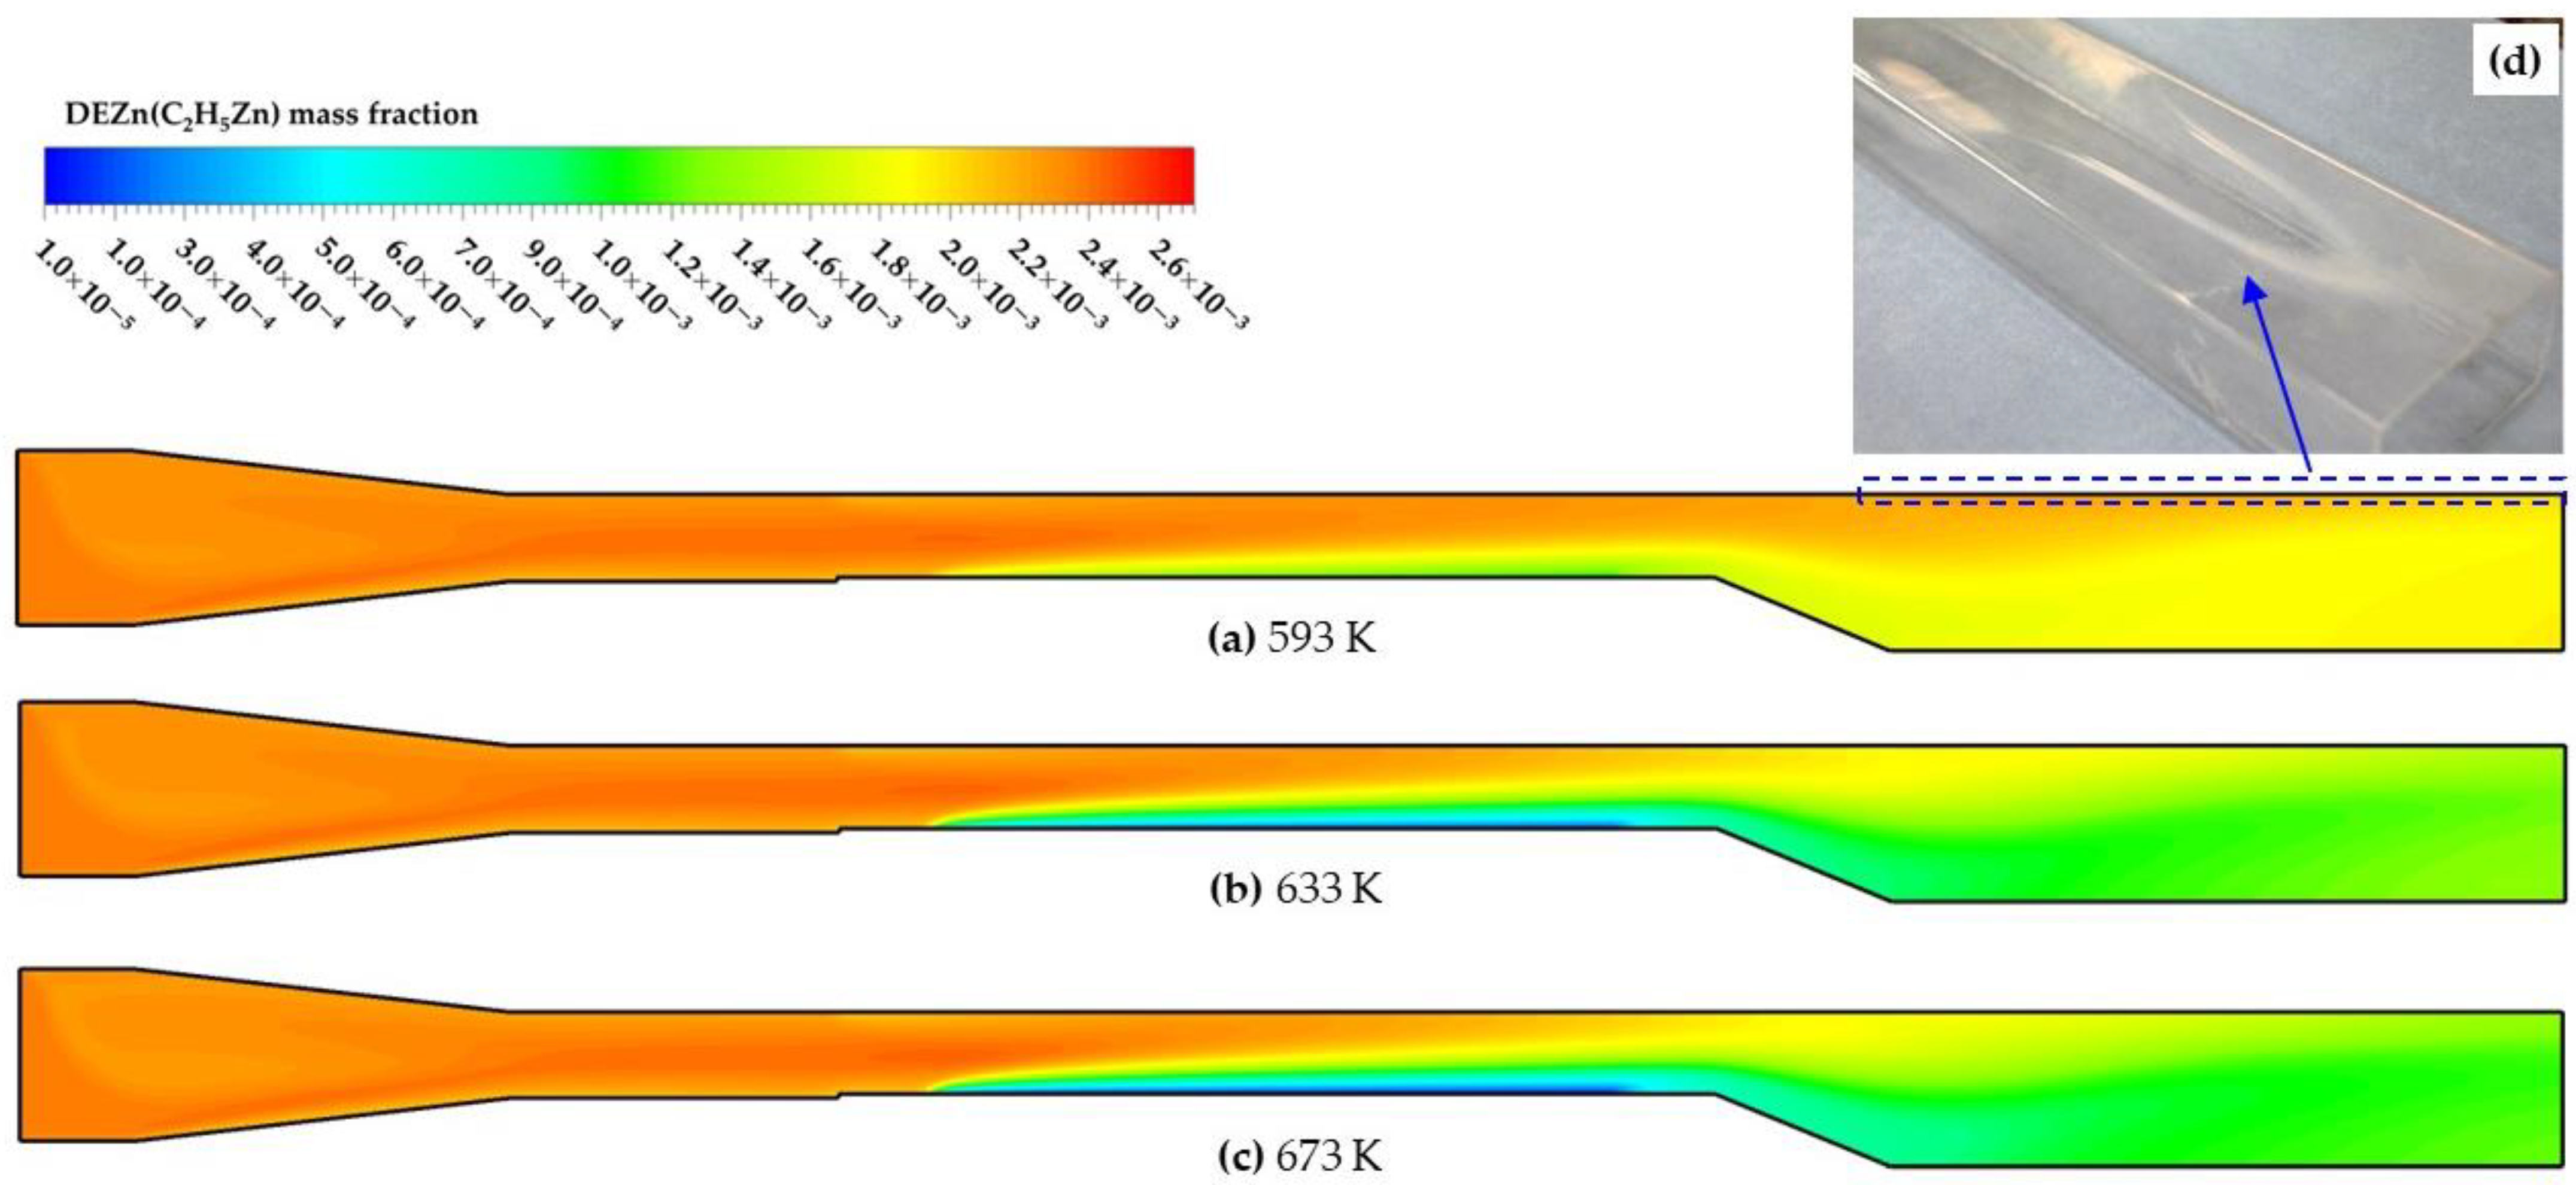
  • The increasing temperature contributed to ZnO growth below 673 K. It was confirmed that the mass transfer-dominated deposition process was more suitable for high-quality ZnO growth. Where the deposition temperature varied in the range from 633 K to 673 K, the highest deposition rate 3.7 × 10⁻⁶ kg/m2·s was obtained with an appropriate homogeneity at 673 K;
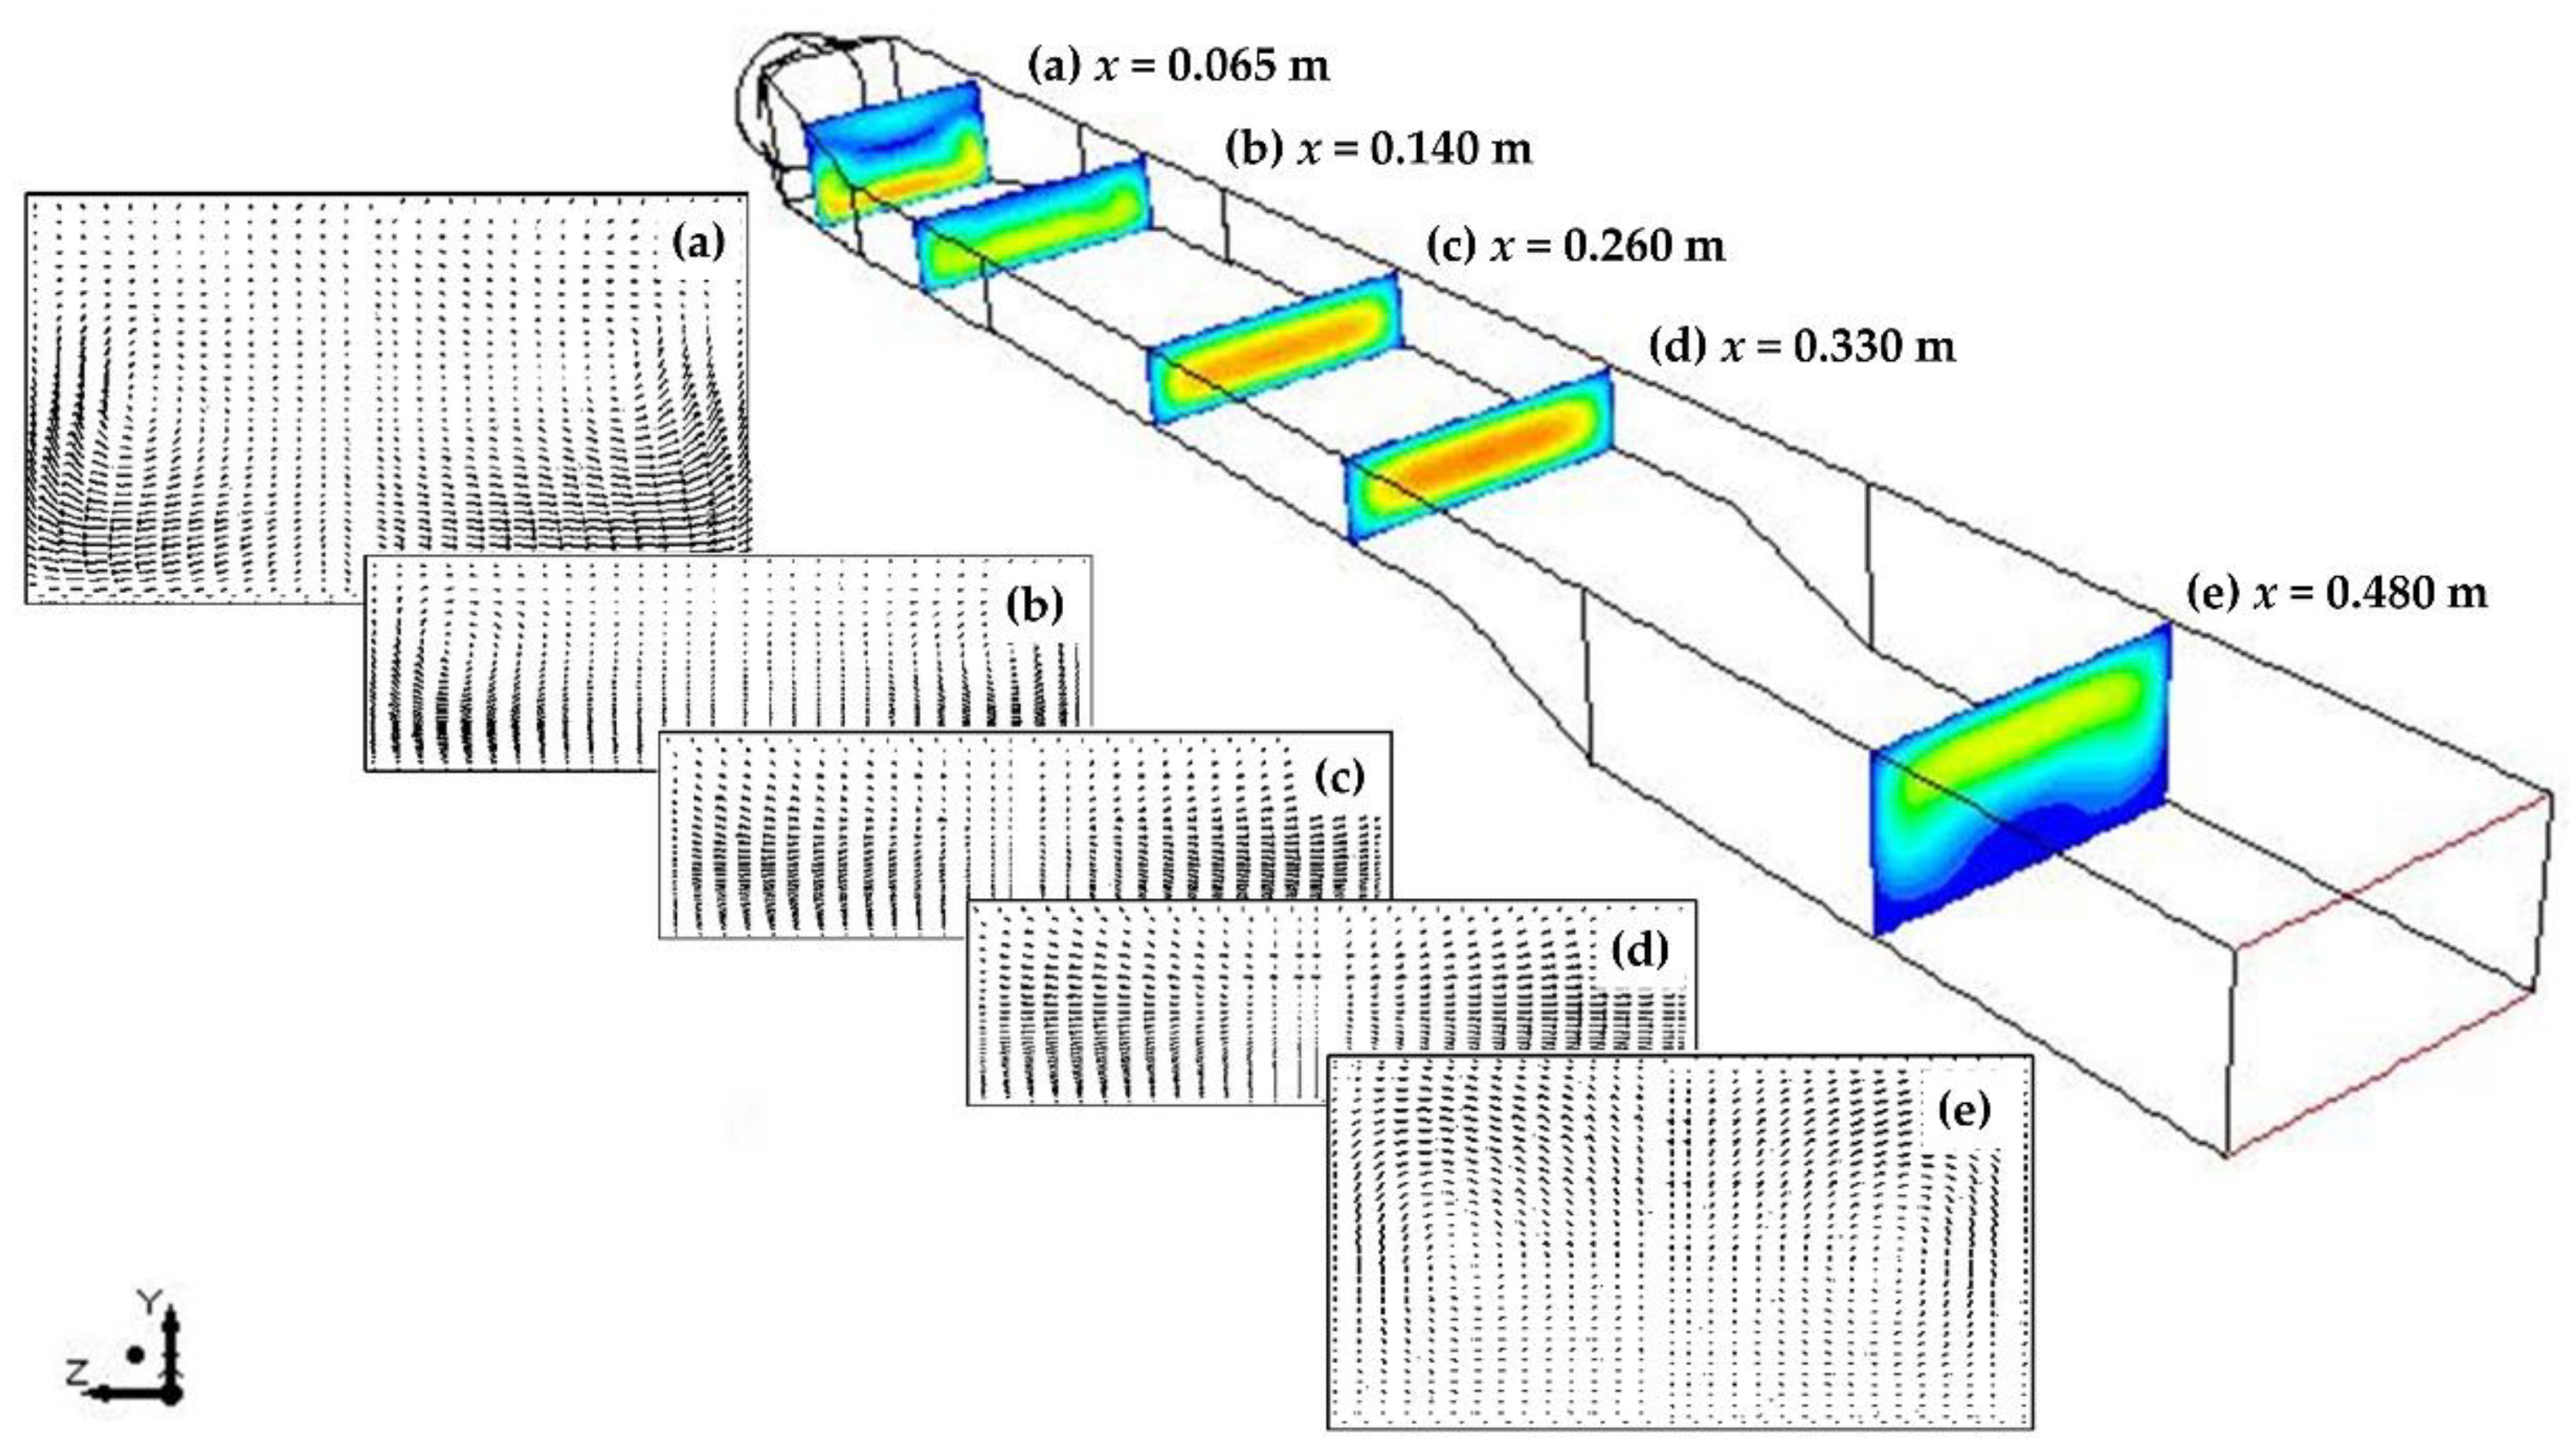
  • For the flow conditions studied (1290 < Ra < 3000 and 15 < Re < 60), the admixture of transverse and longitudinal rolls was observed in the upstream and downstream of the reactor. The size and location of transverse rolls was found to be almost independent of temperature variations; thus, it had a minor effect on the heat flux and hence on the deposition rate. However, the size of longitudinal rolls had a direct impact on the axial and lateral uniformity of the deposition. As the temperature decreased, the mixed convection rolls in the upstream had the drawback of lower growth rates, but it could enhance the precursors supply near the susceptor;
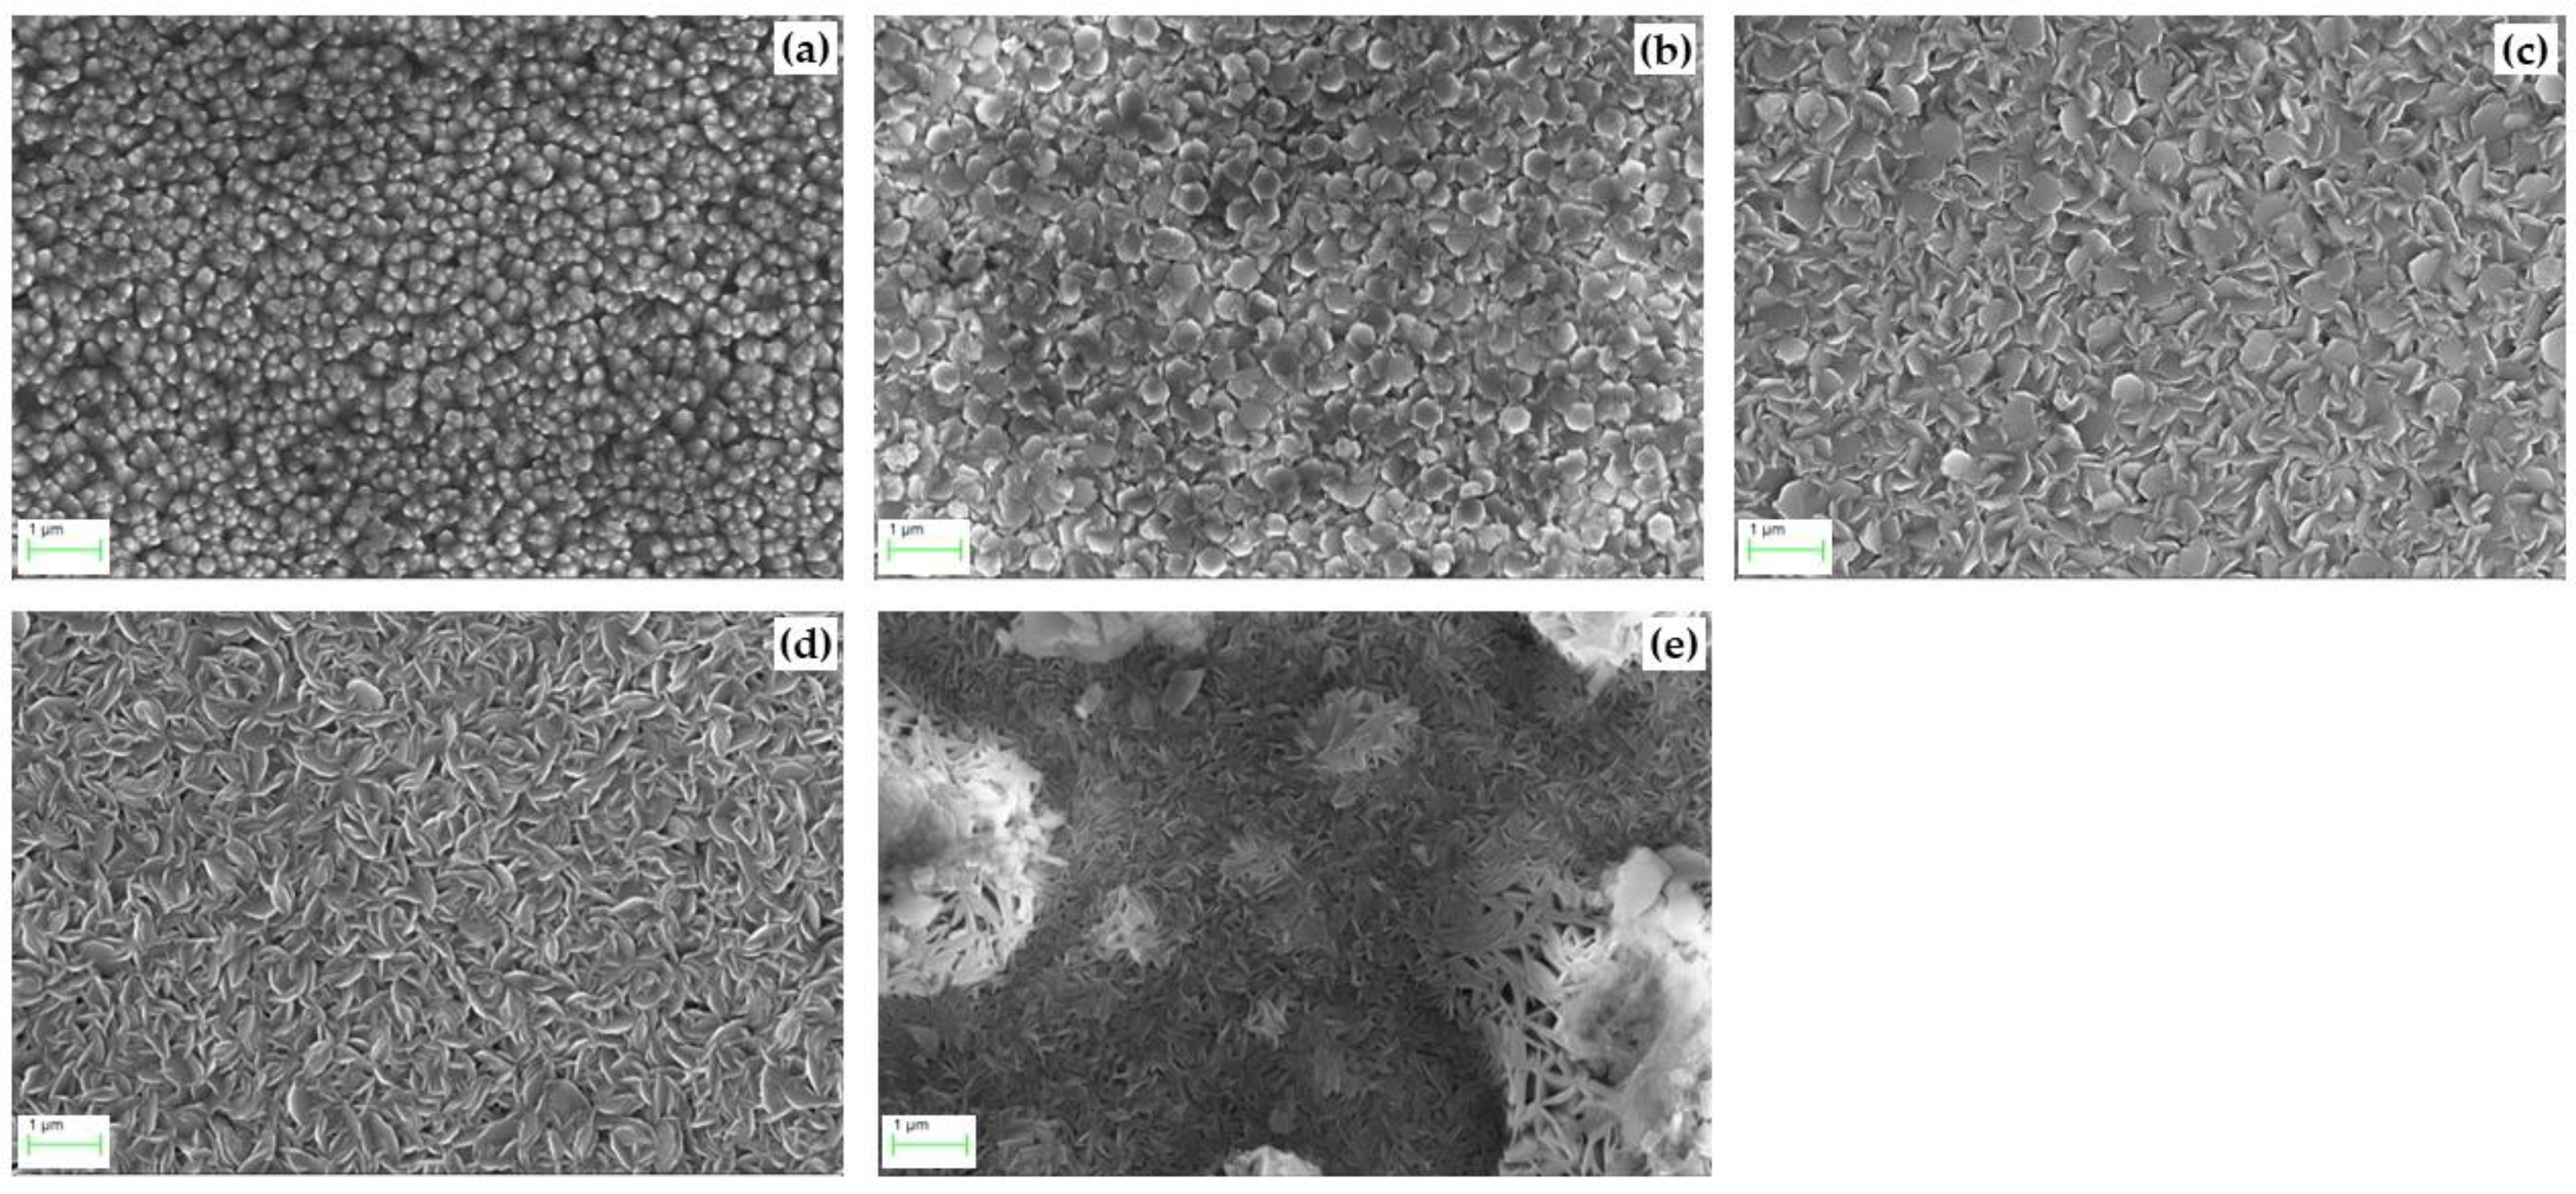
  • The crystallinity of ZnO films was enhanced by the increasing temperature. XRD analysis revealed that the ZnO preferential orientation was (002) at 593 K and 673 K, and the peak intensity increased with increasing temperature. Taking the growth rate and uniformity of the ZnO thin films into consideration, the preferrable deposition temperature is 673 K.

Author Contributions

Conceptualization and methodology, Y.W.; software and calculation, Y.W., R.W. and Y.H.; validation, R.W.; formal analysis, X.Z., R.W. and H.W.; investigation, and resources, D.N. and D.B.; data curation, Y.W.; writing—original draft preparation, Y.W.; writing—review and editing, X.Z. and Y.W.; visualization, X.Z. and H.W.; project administration, Y.W., X.Z., D.N. and D.B.; funding acquisition, Y.W. and D.N. All authors have read and agreed to the published version of the manuscript.

Funding

This research was funded by Science and Technology Project of Guizhou Province, grant number (2020) 1Y406, ZK (2022) YB326, (2020) 4Y014, (2021) YB484 and (2020)1Y211; Youth Project of Guizhou Education Department, grant number QJJ (2022) No.159 and KY (2022) No.169; Natural Science Foundation of China, Grant No. 51863004.

Institutional Review Board Statement

Not applicable.

Informed Consent Statement

Not applicable.

Data Availability Statement

Not applicable.

Acknowledgments

The authors gratefully thank technical supports from the research group in Centre for Solar Energy Research (CSER), OpTIC Centre, St Asaph Business Park, UK.

Conflicts of Interest

The authors declare no conflict of interest.

Nomenclature

bistoichiometric coefficients for reactant of species i
bistoichiometric coefficients for product of species i
cpJ/(kg·K)specific heat capacity at constant pressure
gm/s2gravitational acceleration
Gimol/m3molar concentration of gas-phase species i
Jimol/sdiffusion flux of species i
kmol/(m3·s)rate constant of chemical reaction
pPapressure
Rimol/schemical reaction rate of species i
SEinternal heat source term
Sicombined source term
tstime
TKtemperature
Um/svelocity of gas flow
ηrate exponent of gaseous species i
κW/m·Kthermal conductivity
ρkg/m3density of gas flow
τPaviscous stress tensor
ωimass fraction of species i
Φdissipation function
CFD computational fluid dynamics
DEZn diisopropyltelluride
DR deposition rate
Gr Grashof number
M mean thickness
MOCVD metal-organic chemical vapour deposition
Ra Rayleigh number
Re Renoylds number
SD standard deviation
SLM standard litre per minute
SIMPLE semi-implicit method for pressure-linked equations
t-BuOH tertiarybutanol
ZnO zinc oxide

References

  1. Borysiewicz, M.A. ZnO as a Functional Material, a Review. Crystals 2019, 9, 505. [Google Scholar] [CrossRef] [Green Version]
  2. Sharma, D.K.; Shukla, S.; Sharma, K.K.; Kumar, V. A review on ZnO: Fundamental properties and applications. Mater. Today: Proc. 2020, 49, 3028–3035. [Google Scholar] [CrossRef]
  3. Zhu, Y.; Ma, Y.; Wu, D.; Jiang, G. Preparation and gas sensing properties of ZnO/MXene composite nanomaterials. Sensors Actuators A Phys. 2022, 344, 113740. [Google Scholar] [CrossRef]
  4. Sulaiman, A.A.; Ali, G.G.; Thanon, A.I. Synthesis and Study of ZnO Thin Films Using CVD Technique For Waveguide Sensor Applications. J. Nanostructures. 2022, 12, 1–11. [Google Scholar]
  5. Di Mauro, A.; Fragalà, M.E.; Privitera, V.; Impellizzeri, G. ZnO for application in photocatalysis: From thin films to nanostructures. Mater. Sci. Semicond. Process. 2017, 69, 44–51. [Google Scholar] [CrossRef]
  6. Sandeep, K.M.; Bhat, S.; Dharmaprakash, S.M. Structural, optical, and LED characteristics of ZnO and Al doped ZnO thin films. J. Phys. Chem. Solids 2017, 104, 36–44. [Google Scholar] [CrossRef]
  7. Vinitha, V.; Preeyanghaa, M.; Vinesh, V.; Dhanalakshmi, R.; Neppolian, B.; Sivamurugan, V. Two is better than one: Catalytic, sensing and optical applications of doped zinc oxide nanostructures. Emergent Mater. 2021, 4, 1093–1124. [Google Scholar] [CrossRef]
  8. Müller, R.; Huber, F.; Töws, M.; Mangold, M.; Madel, M.; Scholz, J.-P.; Thonke, K. High-Quality ZnO Layers Grown by CVD on Sapphire Substrates with an AlN Nucleation Layer. Cryst. Growth Des. 2020, 20, 3918–3926. [Google Scholar] [CrossRef]
  9. Mao, H.; Gu, S.; Ye, J.; Tang, K.; Gu, R.; Zhu, S.; Huang, S.; Yao, Z.; Zheng, Y. Comparative study of the effect of H2 addition on ZnO films grown by different zinc and oxygen precursors. J. Mater. Res. 2015, 30, 935–945. [Google Scholar] [CrossRef]
  10. Muñoz-Sanjosé, V.; Irvine, S.J.C. ZnO and Related Materials. In Metalorganic Vapor Phase Epitaxy (MOVPE) Growth, Materials Properties, and Applications; Irvine, S.J.C., Capper, P., Eds.; John Wiley & Sons Ltd.: Hoboken, NJ, USA, 2019; pp. 355–422. [Google Scholar]
  11. Tena-Zaera, R.; Zuniga-Perez, J.; Martínez-Tomás, C.; Muñoz-Sanjosé, V. Numerical study of the ZnO growth by MOCVD. J. Cryst. Growth 2004, 264, 237–245. [Google Scholar] [CrossRef]
  12. Ye, J.; Gu, S.; Zhu, S.; Liu, S.; Liu, W.; Zhou, X.; Hu, L.; Zhang, R.; Shi, Y.; Zheng, Y. Comparative study of diethylzinc and dimethylzinc for the growth of ZnO. J. Cryst. Growth 2004, 274, 489–494. [Google Scholar] [CrossRef]
  13. Lamb, D.A.; Irvine, S.J.C. Growth properties of thin film ZnO deposited by MOCVD with n-butyl alcohol as the oxygen precursor. J. Cryst. Growth 2004, 273, 111–117. [Google Scholar] [CrossRef]
  14. Kirchner, C.; Gruber, T.; Reuß, F.; Thonke, K.; Waag, A.; Gießen, C.; Heuken, M. MOVPE growth of ZnO using various oxygen precursors. J. Cryst. Growth 2003, 248, 20–24. [Google Scholar] [CrossRef]
  15. Oleynik, N.; Adam, M.; Krtschil, A.; Bläsing, J.; Dadgar, A.; Bertram, F.; Forster, D.; Diez, A.; Greiling, A.; Seip, M.; et al. Metalorganic chemical vapor phase deposition of ZnO with different O-precursors. J. Cryst. Growth 2003, 248, 14–19. [Google Scholar] [CrossRef]
  16. Ellingsen, J.; Venkatachalapathy, V.; Azarov, A.; Nilsen, O.; Kuznetsov, A. Al incorporation during metal organic chemical vapour deposition of aluminium zinc oxide. Thin Solid Films 2020, 709, 138245. [Google Scholar] [CrossRef]
  17. Narin, P.; Kutlu-Narin., E.; Kayral., S.; Tulek., R.; Gokden., S.; Teke., A.; Lisesivdin., S.B. Morphological and optical characterizations of different ZnO nanostructures grown by mist-CVD. J. Lumin. 2022, 251, 119158. [Google Scholar] [CrossRef]
  18. Bhutto, W.A.; Soomro, A.M.; Nizamani, A.H.; Saleem, H.; Khaskheli, M.A.; Sahito, A.G.; Das, R.; Khan, U.A.; Saleem, S. Controlled growth of zinc oxide nanowire arrays by chemical vapor deposition (CVD) method. Int. J. Comput. Sci. Netw. Secur. 2019, 19, 135–141. [Google Scholar]
  19. Wen, T.; Lu, L.; Zhang, S.; Zhong, H. Experimental study and CFD modelling on the thermal and flow behavior of EG/water ZnO nanofluid in multiport mini channels. Appl. Therm. Eng. 2021, 182, 116089. [Google Scholar] [CrossRef]
  20. Zhou, X.; Wu, Y.; Yang, X.; Huang, C. Numerical Analysis of an Inline Metal-Organic Chemical Vapour Deposition Process Based on Sliding-Mesh Modelling. Coatings 2020, 10, 1198. [Google Scholar] [CrossRef]
  21. Shinde, V.M.; Deivendran, B.; Kumar, H.; Prasad, N.E. Investigation of transport processes in a commercial hot wall CVD reactor with multi-substrates for high-quality pyrocarbon deposition. Surf. Coatings Technol. 2021, 425, 127685. [Google Scholar] [CrossRef]
  22. Li, X.-G.; Xiao, W.-D. Model on transport phenomena and control of rod growth uniformity in siemens CVD reactor. Comput. Chem. Eng. 2018, 117, 351–358. [Google Scholar] [CrossRef]
  23. Li, J.; Luo, T.; Wang, J.; Wang, G.; Pei, Y.; Deng, J. Design of a new MD-600C ZnO-MOCVD reaction cavity and study of process parameters. Int. Commun. Heat Mass Transf. 2020, 110, 104394. [Google Scholar] [CrossRef]
  24. Zhang, Z.; Fang, H.; Yao, Q.; Yan, H.; Gan, Z. Species transport and chemical reaction in a MOCVD reactor and their influence on the GaN growth uniformity. J. Cryst. Growth 2016, 454, 87–95. [Google Scholar] [CrossRef]
  25. Wang, J.; He, Y.C.; Luo, T.C.; Li, Y.; Zhou, Z.; Fan, B.F.; Li, J.; Wang, G. Simulation and experimental verification study on the process parameters of ZnO-MOCVD. Ceram. Int. 2021, 47, 15471–15482. [Google Scholar] [CrossRef]
  26. Wang, J.; Li, J.; He, Y.-C.; Luo, T.-C.; Li, Y.; Fan, B.-F.; Wang, G. High-speed flow field prediction and process parameters optimization in a vertical MOCVD reactor based on a hybrid RSM-KNN model. Int. Commun. Heat Mass Transf. 2021, 129, 105741. [Google Scholar] [CrossRef]
  27. Fauzi, F.B.; Ismail, E.; Osman, M.N.; Rosli, M.S.; Ismail, A.F.; Mohamed, M.A.; Abu Bakar, S.N.S.; Ani, M.H. Influence of mixed convection in atmospheric pressure chemical vapor deposition of graphene growth. Mater. Today Proc. 2019, 7, 638–645. [Google Scholar] [CrossRef]
  28. Yousefian, P.; Pimputkar, S. Computational fluid dynamics modeling of a new high-pressure chemical vapor deposition reactor design. J. Cryst. Growth 2021, 566, 126155. [Google Scholar] [CrossRef]
  29. Li, J.; Cai, J.; Wu, Z.; Wang, J.; Pei, Y.; Wang, G. Numerical simulation and study of the metal-organic chemical vapor deposition growth of ZnO film. Phys. Fluids 2019, 31, 027104. [Google Scholar] [CrossRef]
  30. Li, J.; Xu, Y.F.; Ma, X.J.; Fan, B.F.; Wang, G. Stability and process parameter optimization for a vertical rotating ZnO-MOCVD reaction chamber. Vacuum 2018, 149, 60–68. [Google Scholar] [CrossRef]
  31. Venu Gopal, V.R.; Kamila, S. Effect of temperature on the morphology of ZnO nanoparticles: A comparative study. Appl. Nanosci. 2017, 7, 75–82. [Google Scholar] [CrossRef] [Green Version]
  32. Chang, J.F.; Kuo, H.H.; Leu, I.C.; Hon, M.H. The effects of thickness and operation temperature on ZnO: Al thin film CO gas sensor. Sens. Actuators B Chem. 2002, 84, 258–264. [Google Scholar] [CrossRef]
  33. Dauelsberg, M.; Talalaev, R. Progress in modeling of III-nitride MOVPE. Prog. Cryst. Growth Charact. Mater. 2020, 66, 100486. [Google Scholar] [CrossRef]
  34. Mehmood, S.; Rehman, M.A.; Ismail, H.; Mirza, B.; Bhatti, A.S. Significance of postgrowth processing of ZnO nanostructures on antibacterial activity against gram-positive and gram-negative bacteria. Int. J. Nanomed. 2015, 10, 4521. [Google Scholar] [CrossRef]
Figure 1. Scheme of (a) the horizontal MOCVD reactor geometry and (b) the structured hexahedral mesh of reactor (half view is shown for better clarity).
Coatings 12 01991 g001
Figure 2. Schematic diagram of the MOCVD system for ZnO growth by using DEZn and t-BuOH as precursors.
Coatings 12 01991 g002
Figure 3. ZnO deposition rate as a function of temperature ranging from 593 to 713 K.
Coatings 12 01991 g003
Figure 4. ZnO growth longitude distribution at position of (a) z = 0 m and lateral distribution at position of (b) x = 0.02 m; (c) x = 0.04 m and (d) x = 0.06 m on the substrate surface under the effect of the deposition temperatures from 573 K to 673 K.
Coatings 12 01991 g004
Figure 5. Contours of ZnO thickness on the substrate at the temperature of (a) 593 K; (b) 613 K; (c) 633 K; (d) 653 K and (e) 673 K (Note: due to symmetry, only half of the substrate width, the along z-axis with the interval of 0 to −0.0032 m, is shown for the experimental data).
Coatings 12 01991 g005
Figure 6. The streamline of gas flow inside the horizontal reactor at the deposition temperature of (a) 593 K; (b) 633 K and (c) 673 K.
Coatings 12 01991 g006
Figure 7. The flow structure (a) coupled with the temperature contour at the mid-plane of the reactor and (b) at symmetric planes of z = 0 m, 0.01 m, 0.02 m and 0.03 m with temperatures of 593 K, 633 K and 673 K.
Coatings 12 01991 g007
Figure 8. The cross-sectional velocity field along the axial direction at positions of (a) x = 0.065 m, (b) x = 0.140 m, (c) x = 0.260 m, (d) x = 0.330 m and (e) x = 0.480 m in MOCVD reactor at 673 K.
Coatings 12 01991 g008
Figure 9. Contours of concentration distribution of DEZn species at the mid-plane of horizontal MOCVD reactor at temperature of (a) 593 K; (b) 633 K and (c) 673 K; and (d) the excess film deposited on top wall of the reactor.
Coatings 12 01991 g009
Figure 10. SEM image of the ZnO thin film at temperatures of (a) 593 K; (b) 613 K; (c) 633 K; (d) 673 K; and (e) 713 K.
Coatings 12 01991 g010
Figure 11. XRD patterns of ZnO thin films at the deposition temperature of 573 K; 613 K; 633K; 673K and 713 K.
Coatings 12 01991 g011
Table 1. The detailed boundary conditions.
GeneralBoundary ConditionParameters
Operating temperature-300 K
Operating pressure-975 mbar
InletVelocity inlet4 slm; II/VI = 0.33
OutletPressure outletp = 0 (gauge)
SusceptorNo-slip–stationary wall with chemical reaction593 to 713 K
WallsNo-slip-
Publisher’s Note: MDPI stays neutral with regard to jurisdictional claims in published maps and institutional affiliations.

