Article

Microsurfacing Pavement Solutions with Alternative Aggregates and Binders: A Full Surface Texture Characterization

by
Sergio Copetti Callai
1,
Manuel De Rose
2,
Piergiorgio Tataranni
1,*,
Christina Makoundou
1,
Cesare Sangiorgi
1 and
Rosolino Vaiana
2
1
Department of Civil, Chemical, Environmental and Materials Engineering, University of Bologna, 40136 Bologna, Italy
2
DINCI, Department of Civil Engineering, Arcavacata Campus, University of Calabria, Via Pietro Bucci, 87036 Rende, Italy
*
Author to whom correspondence should be addressed.
Coatings 2022, 12(12), 1905; https://doi.org/10.3390/coatings12121905
Submission received: 9 November 2022 / Revised: 2 December 2022 / Accepted: 3 December 2022 / Published: 6 December 2022

Abstract

:
The road surface texture is responsible for controlling several quality/safety road indicators, such as friction, noise, and fuel consumption. Road texture can be classified into different wavelengths, and it is dependent on the material used in the paving solution. With the aim of evaluating and characterizing the surface texture of a microsurfacing road pavement, six microsurfacing samples were made in the laboratory with both traditional materials (basaltic aggregates and bituminous emulsion) and with innovative materials from recycling procedures (crumb rubber (CR) and artificial engineered aggregate (AEA)). The characterization was performed through the use of a conoscopic holography profilometer with high precision and post-processing of the profiles detected through consolidated algorithms (ISO standards). We found that the aggregate type plays a very important role in the pavement texture. The binder agent seems to be highly important, but more studies regarding this are necessary. The use of crumb rubber as an aggregate proved to be feasible, and the texture parameters that were obtained were in accordance with the benchmark ones. In addition, the study shows that the use of artificial engineered aggregates does not impair the surface texture. Finally, the use of the texture parameters defined by the ISO standards, together with a statistical analysis, could be useful for defining the surface texture characteristics of microsurfacing.

1. Introduction

The texture of the road pavement is directly responsible for several indicators, namely: internal and external noise [1,2,3], safety [4,5], heat island mitigation [6,7,8], fuel consumption [4], tire wear, and overall costs of road operation. All of these aspects are regulated in one or another fashion by the texture of the pavement.
The pavement can be classified according to the texture wavelength [9], which starts from the unevenness of the road and megatexture, through the surface macrotexture up to the microtexture of the aggregate itself. Macrotexture and microtexture scales mostly impact the tire/road interaction and are related to many functional characteristics of the pavement, such as the drainability, friction, and noise, which affect the safety, social, and environmental costs [10,11,12].
The pavement texture is a product of the mix of a binder (bitumen, resin, Portland cement, and asphalt emulsion), fillers, and aggregates. The mix design and aggregate origin play a major role in the pavement texture [11,13,14,15,16,17], and consequently in noise and friction [18]. The surface texture of the pavement can be measured using different techniques, both in the laboratory and in the field. The main methods are volumetric, laser, and permeability [19,20,21,22]. Photogrammetric techniques have been implemented and are showing promising results [19,23,24,25]. Texture can also be evaluated using tribological parameters, such as skewness, kurtosis, and the Abbott curve [26,27,28,29].
One of the possible solutions to improve the surface texture of a pavement is microsurfacing, sometimes called slurry sealing [30]. Microsurfacing is a preventive maintenance technology that involves the application of a mixture consisting of polymer-modified bituminous emulsion, dense-graded mineral aggregates, mineral filler, water, and additives (if needed) at an ambient temperature. Several studies have been conducted to assess the properties of microsurfacing regarding noise and friction [31,32,33,34]. Recently, more and more research has focused on substituting either the asphalt binder [17,35,36] or replacing the natural aggregate with alternative aggregates, such as steel slag, recycled materials, rubber, and alkali-activated or geopolymeric materials [17,37,38,39,40]
The present study aimed to carry out a detailed texture analysis of six different microsurfacing mixtures by means of a laser profilometer. The experiment was designed to assess the use of two different binders (asphalt emulsion and resin) and three different aggregates (natural aggregate, 3D printed artificial geopolymeric aggregate, and crumb rubber) by evaluating the pavement surface texture features of the mixtures. The texture analysis was carried out not only through the use of traditional parameters, but also using statistical/tribological parameters.

2. Materials and Methods

2.1. Materials

Three types of aggregates were used in this study:
  • Natural aggregate (NA)—Basaltic origin—0/6 or 0/8 mm (the latter is obtained from a combination of 0/6 and 4/8, whose physical and mechanical properties are described in Table 1);
  • Crumb rubber (CR)—0.8/4 mm [41,42];
  • Artificial engineered aggregate (AEA)—10 mm single size [40].
In particular, the artificial engineered aggregates were produced using an alkali-activation technique. It consists of mixing the basalt powder and metakaolin with an activator (alkali solution). This mixture produces a mortar that is poured into 3D printed molds and is cured in the oven. The final aggregate has a 10 mm diameter in a truncated octahedron shape, as shown in Figure 1.
For the scope of this research, six different microsurfacing mixtures were prepared, as summarized in Table 2. In order to make a comparison between the different mixture combinations, two benchmark samples were made, called the natural aggregate sample, “NAS1” and “NAS2”, produced with a 0/8 mm basaltic aggregate and modified asphalt emulsion, which represent a standard microsurfacing mixture.
Basalt aggregate with a 0/6 mm granulometric curve was used in the “Yellow” sample, replacing the modified asphalt emulsion with a commercial non-asphaltic resin binder, whose color is the name of the sample. The “Rubber” sample used asphalt emulsion, whereas the granulometric curve was built up using 40% NA and 60% CR [42]. The last two samples used a combination of both NA and AEA blended with asphalt emulsion. Sample “AA” used an Australian gradation curve (0/10 mm) [43], replacing the maximum aggregate size (retained at sieve 9.5 mm) with the AEA. Mixture “AA5050” is a discontinuous mix made with 50% of 0/6 mm NA (<sieve #2) and 50% AEA (10 mm). The samples are shown in Figure 2.

2.2. Methods

Microsurfacing samples produced with asphalt emulsion were made by following the ISSA mix design procedures [44], whereas the “Yellow” sample, which used a resin emulsion, was made using the producer’s instructions. The samples were manufactured by roughly following the indications contained in ISSA TB 100 [45]; therefore, mixtures were poured in circular molds and levelled using a strike-off.
Once the samples were cured, a texture analysis was conducted by means of a contactless laser profilometer based on conoscopic holography [46]. According to the classification made by the standard ISO 13473-3 [20], the latter had the following characteristics: (i) mobility: stationary, slow; (ii) texture wavelength range: range covered BD class 0.20 ÷ 50 mm; (iii) pavement contact: contactless devices; (iv) principle of operation: laser profilometer; (v) objective focal length: 100 mm; (vi) maximum vertical measuring range: 35 mm; (vii) vertical resolution for class 0.003 ÷ 0.03 mm: 0.012 mm; (viii) stand-off distance: 90 mm; (ix) minimum horizontal resolution Δx (sampling interval) BD for class 0.05 ÷ 1 mm: 0.01 mm; and (x) angle coverage: 170°.
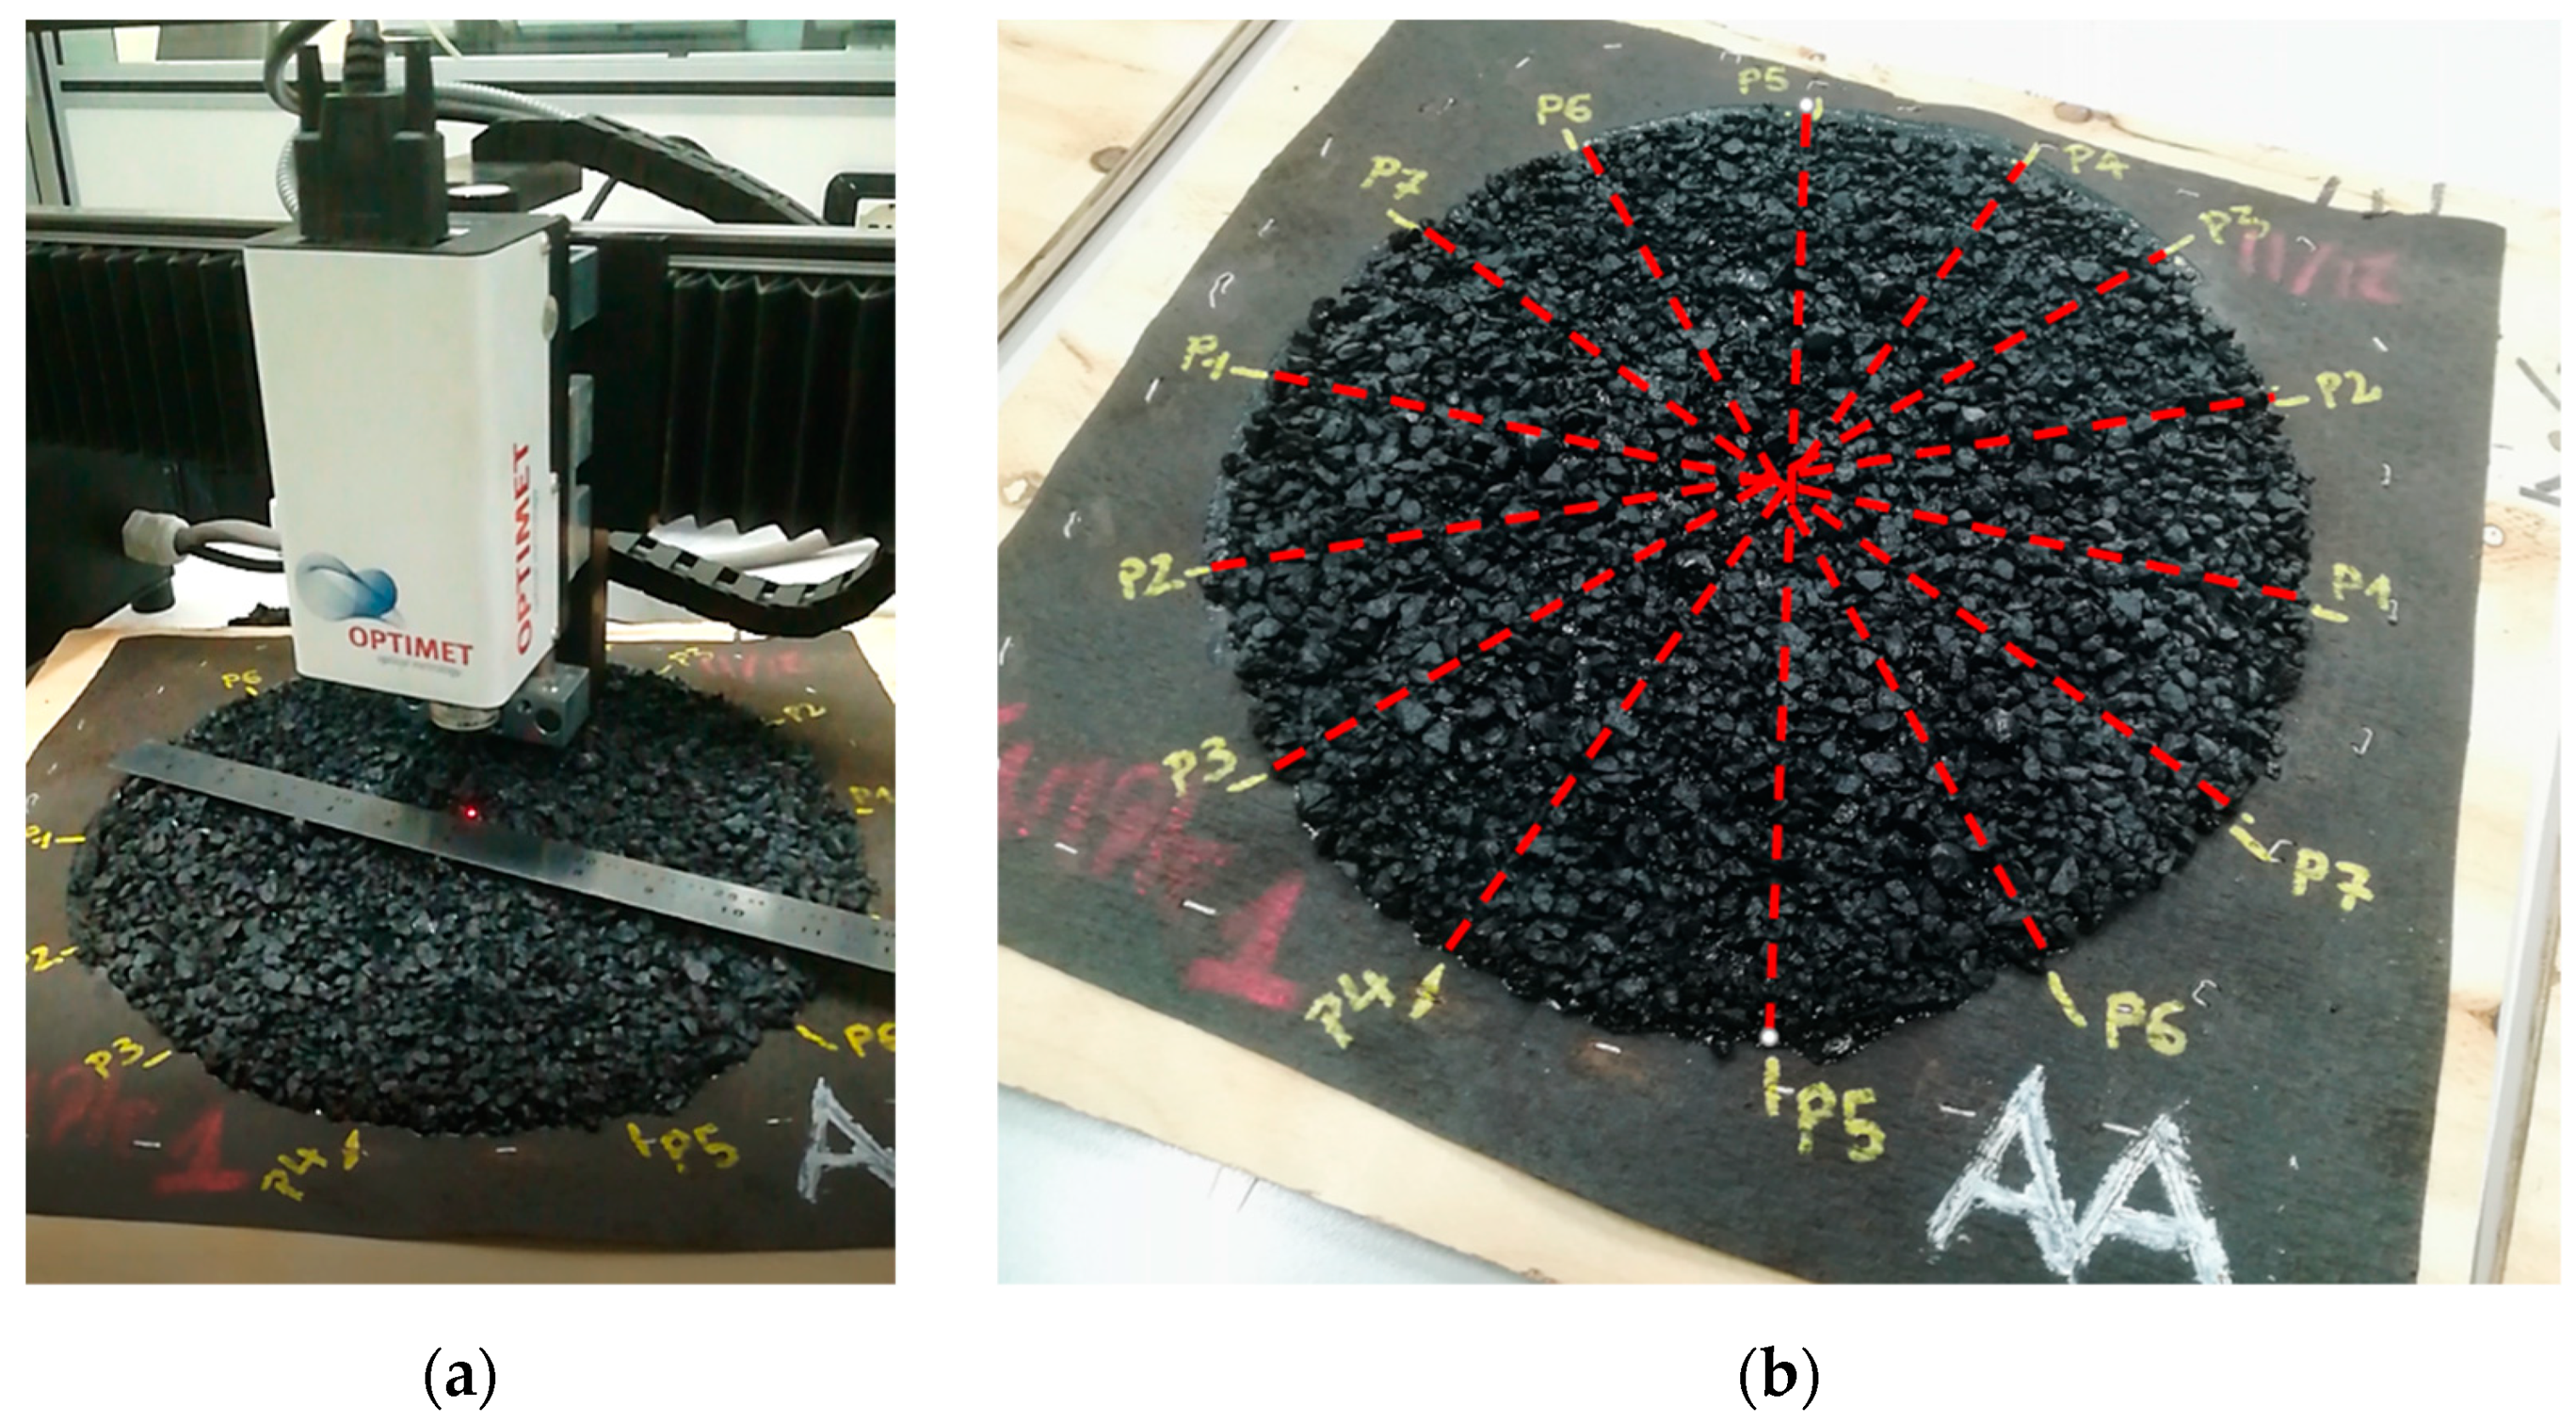
The profilometer conducted seven diametral profiles (dotted red line) spaced at a fixed angle for each profile, with a length of about 30 cm (depending on the sample), as can be seen in Figure 3. This allowed for obtaining a linear profile with a total length of at least 2 m for each sample, ensuring good representativeness.
The texture data obtained from each sample and returned from the laser profilometer were post-processed through the use of the software U-PaveTex, developed for the University of Calabria within an Italian project of relevant national interest (PRIN) “USR342—Urban safety, Sustainability, and Resilience: three paving solutions, four sets of modules, two platforms”. The software analyzed each profile and returned the roughness parameters, which will be discussed in the following paragraph. Moreover, the software was able to combine the seven profiles for each sample together, and return them as the spectral intrinsic indicator of the texture level (LTX). On the other hand, the other texture aggregate intrinsic indicators, such as skewness, kurtosis, and the bearing Abbot curve, were evaluated by processing the data in Excel and using the software Origin2021.

2.3. Surface Texture Indicators

In general, the surface texture analysis is carried out through different survey methods, with different types of instruments and data post-processing. However, the measurements never exactly match the actual surface, as they represent geometrical entities (succession of heights) that are a discrete approximation of the real surface, and that correspond to a random process. In order for the texture analysis to be significant, the sample must be representative and of an adequate size; in addition, the survey’s techniques and data processing must be of an adequate quality. Thus, the characterization of the surface texture must be assumed as a random, stationary, and ergodic signal [47].
Surface texture can be assessed by means of intrinsic criteria, in which the surface geometry is described through the use of discrete functions such as Z(x,y), for a surface, or Z(x), for a profile, or by means of extrinsic criteria, which analyze the surface texture through the use of correlated parameters, such as friction or outflow [48].
For the present study, only intrinsic indicators were used. The latter could be divided into aggregate indicators, which look at the profile as a set of several wavelengths, or spectral indicators, for which the profile is disaggregated by Fourier analysis as the sum of several elementary components, each of which is referred to as a single wavelength λ [49,50,51].
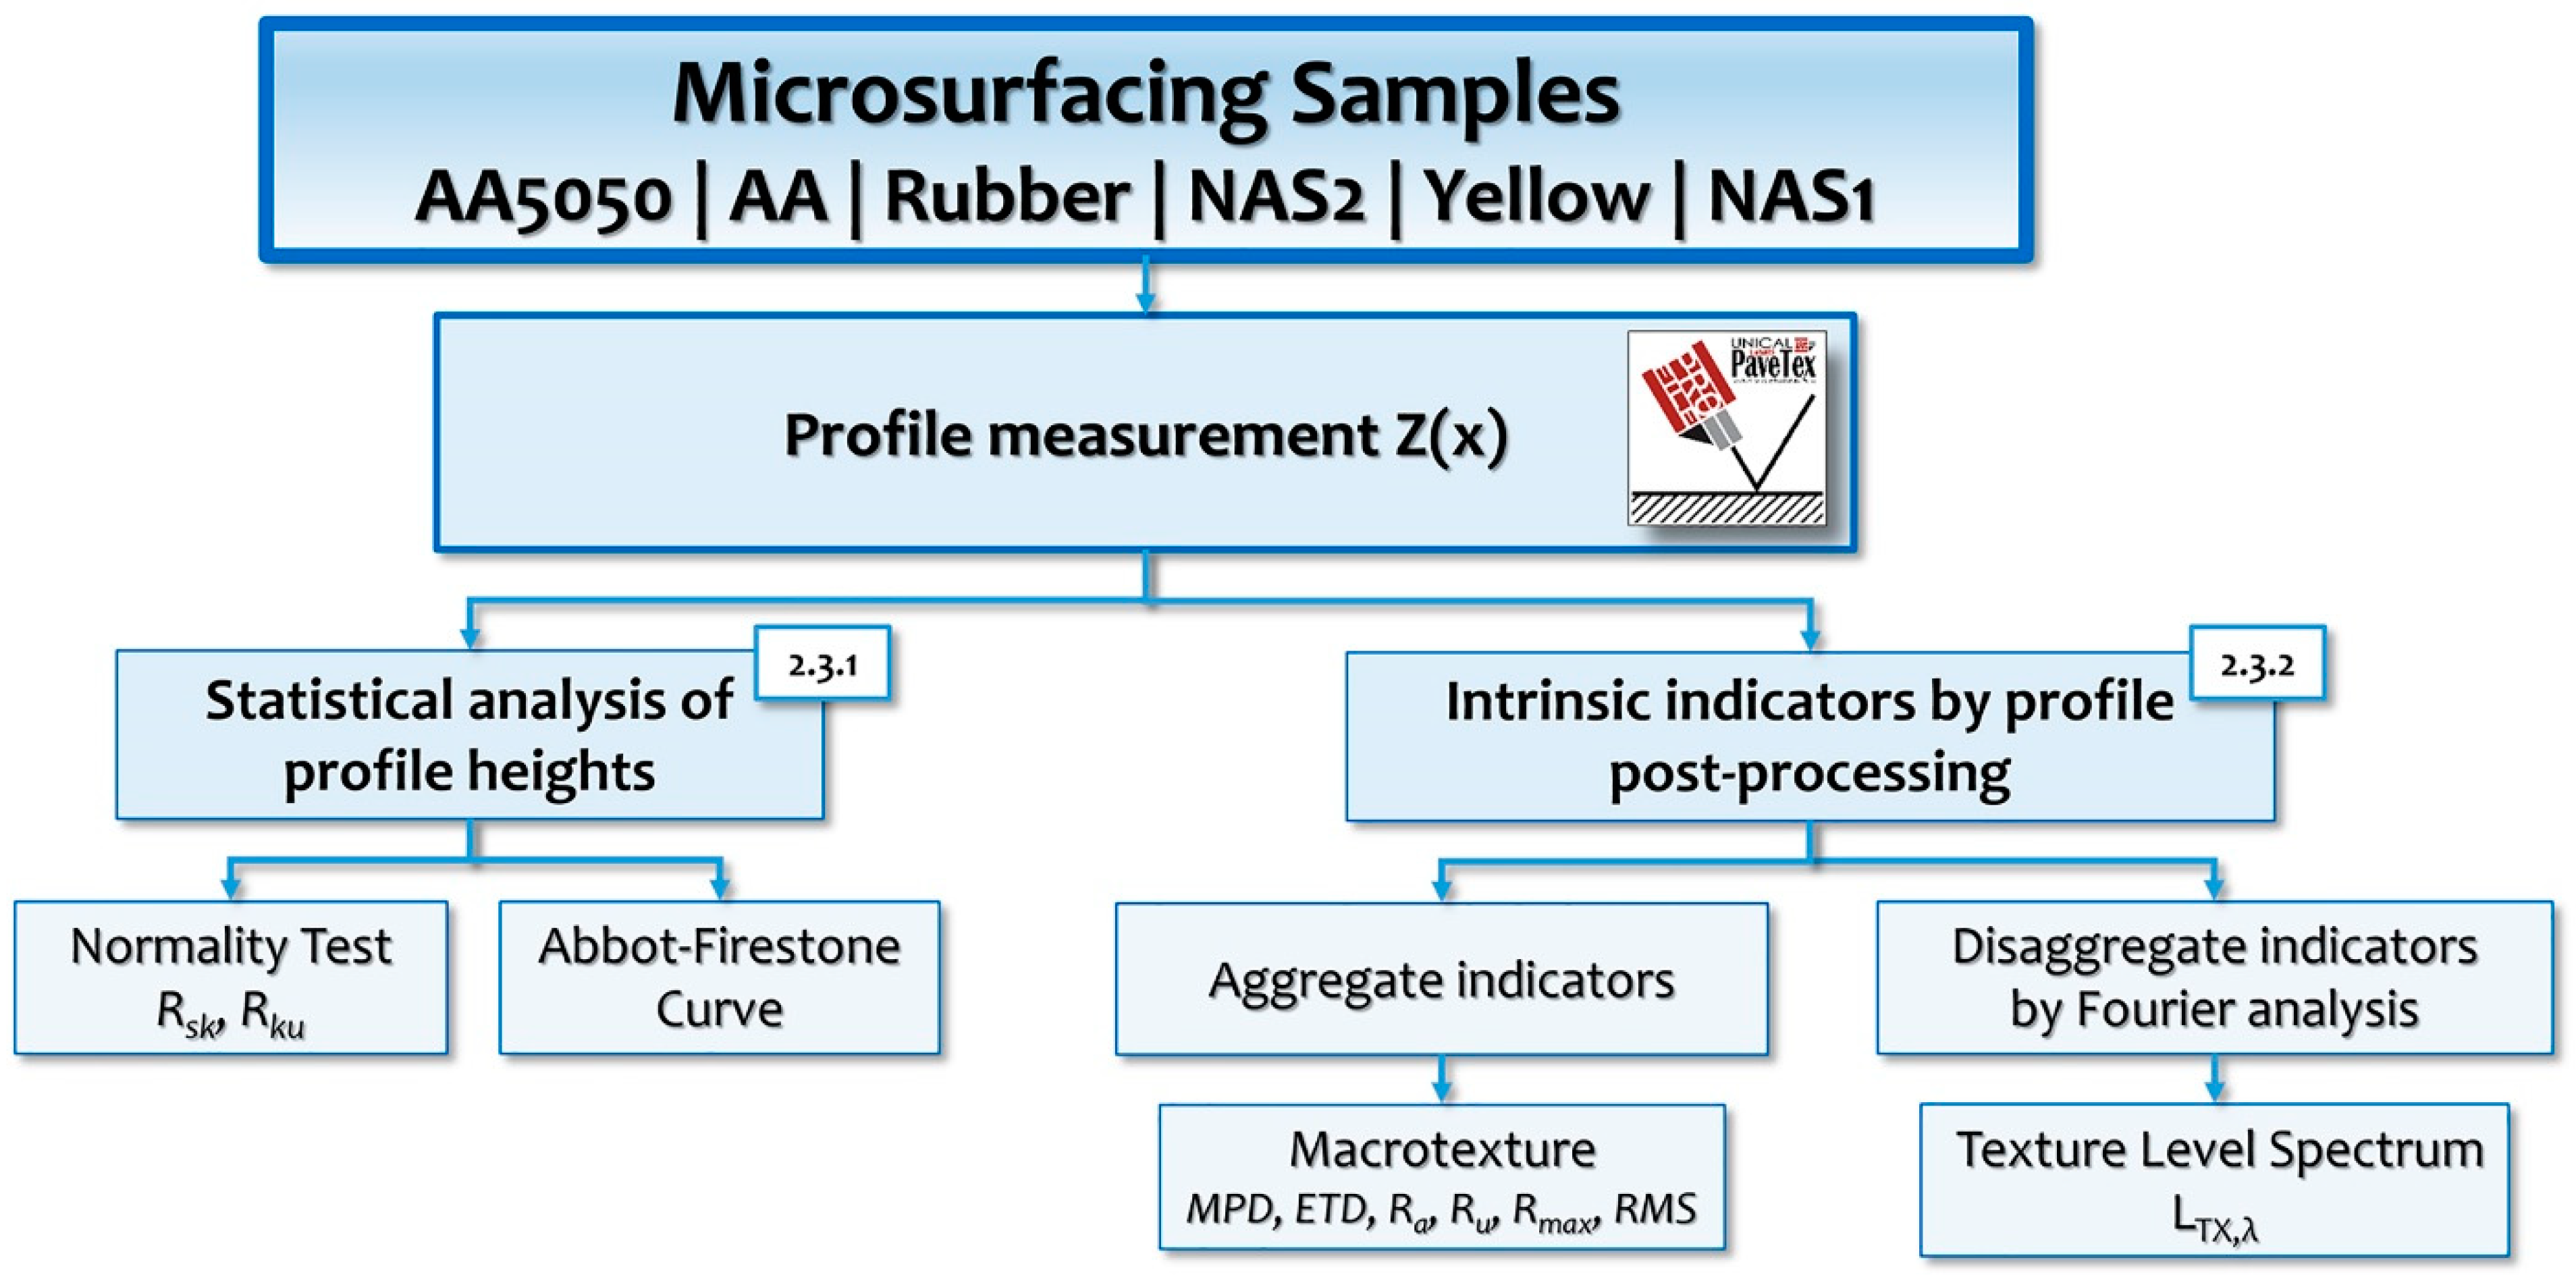
The methodology used in the surface texture analysis follows the scheme reported in Figure 4; moreover, Section 3, Results and Discussion, is structured following the same scheme.

2.3.1. Statistical Analysis of Profile Heights

The analysis of a surface using aggregated descriptors takes place through simple statistical operations carried out starting from the representative data of the profile, i.e., the discrete function Z(x). Therefore, it is useful to establish the distribution of the heights of the profile by performing a normality test. In addition, it is possible using the provided profiles to calculate some statistical parameters such as the skewness, Rsk, the kurtosis, Rku, and the bearing Abbot curve, as presented in Table 3.
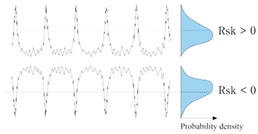
Skewness represents the degree of symmetry of the profile and gives information on how the peaks and valleys are distributed in reference to the profile’s average value. Skewness assumes a value equal to 0 if the probability density curve of the profile’s height is symmetrical. If the number of peaks above the average value is relatively higher than that of the valley, the skewness assumes a negative value, whereas it will be positive if not.
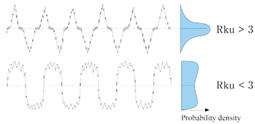
Kurtosis is a good indicator of the probability density function’s sharpness [52,53]. When Kurtosis is equal to 3 (or 0 if normalized by subtracting 3), the distribution will have the same shape of a Gaussian distribution: where a value of Kurtosis much greater than 3 shows a curve that is really sharp, whereas if it is much lower the curve becomes rounder and flatter.
Thus, when applied to the study of the surface texture, skewness and kurtosis are both parameters that characterize the shape of the probability density distributions of the profile’s height [47].
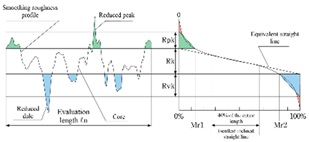
Finally, the probability density curve, also called the bearing Abbott curve or Abbot-Firestone (or just Abbot) curve, is a parameter usually used in tribology in order to evaluate the functional behavior of surfaces in relative motion subjected to mechanical loading, and it is good indicator of the real area that will support the contact between the surfaces [54,55,56]. Although the Abbott curve is generally used in mechanical applications, it is possible to extend its use to evaluate the macrotexture of asphalt mix surfaces and so the road–tire contact, with the possibility of inferring drainability and friction properties [2,57]. Mathematically, it represents the cumulative probability density function of the surface’s profile heights, so that, given a certain elevation level, it is possible to have information on the percentage of matter that lies above or below that height. In this context, the following three parameters can be identified on the Abbot curve:
  • Rpk, which corresponds to the fraction of the profile with the highest peaks and might be linked to the part of the profile that will stick to the tire and be polished under traffic during the pavement service life;
  • Rk, which is the contact area region and represents the core of the surface effectively subjected to the traffic loads;
  • Rvk, which represents the percentage of the profile with the deepest valleys and is perhaps related to the ability of the surface to evacuate or store water [58].

2.3.2. Intrinsic Indicators by Profile Post-Processing

Regarding the aggregate indicators, the ones most used to describe the pavement texture are the mean profile depth (MPD) and the estimated texture depth (ETD) [9,22,59,60]. MPD and ETD are parameters created to assess the pavement macrotexture, and they are based on the traditional sand patch method.
As reported in Table 4, MPD has two different representation. MPDiso is the average value of the profile depth over a certain distance, the baseline, which assumes a value of 100 ± 0.5 mm. Instead, MPDaipcr is the average difference between the regression line of the profile and a line through the top of the highest peak within the sampling length, with a baseline of 138 ± 0.5 mm [9].
ETD is a parameter used to estimate the mean texture depth (MTD) starting from the MPD by using a transformation equation. Thanks to this equation, with ETD it is possible to approximate the MTD measured with the sand patch method well. The only difference between the indicators ETD1995iso and ETD2019iso is in their formulas [20].
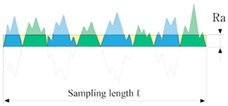
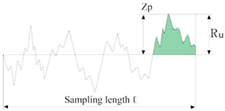
The average roughness, Ra, is one of the most widely used parameters, which gives a gross measure of the surface roughness, and it represents the average height difference (taken in absolute value) in reference to the profile’s average line. The parameter Ru, height to the mean or levelling depth, is the height difference between the profile’s average line and the maximum profile peak. It gives information on how the peaks diverge from the mean: a low value indicates that the profile is flatter in the part above the average value.
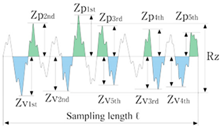
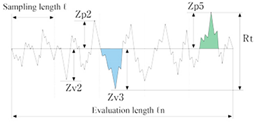
The average peak to valley height, Rz, represents the sum of the mean value of the five tallest peaks and the mean of the five deepest valleys of a profile within the sampling length. Rmax or Rt is called the maximum total height, and it represents the sum of the maximum peak height Zp and the maximum valley depth Zv of a profile within the evaluation length, not sampling length.
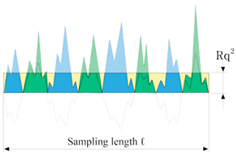
The last parameter is the root mean square (RMS or Rq), which is the deviation in height. Some studies have shown that there is an inverse proportion between RMS and friction, either dry or wet [35,61,62].
Finally, regarding the disaggregate descriptors, the texture level, indicated as LTX,λ and expressed in decibels (dB), is a logarithmic transformation of an amplitude representation of a surface profile curve Z(x), given a single texture wavelength λ. The texture wavelength describes the horizontal dimension of the amplitude variations of a surface profile and it is expressed in millimeters (mm) [63].

3. Results and Discussions

3.1. Texture Profiles

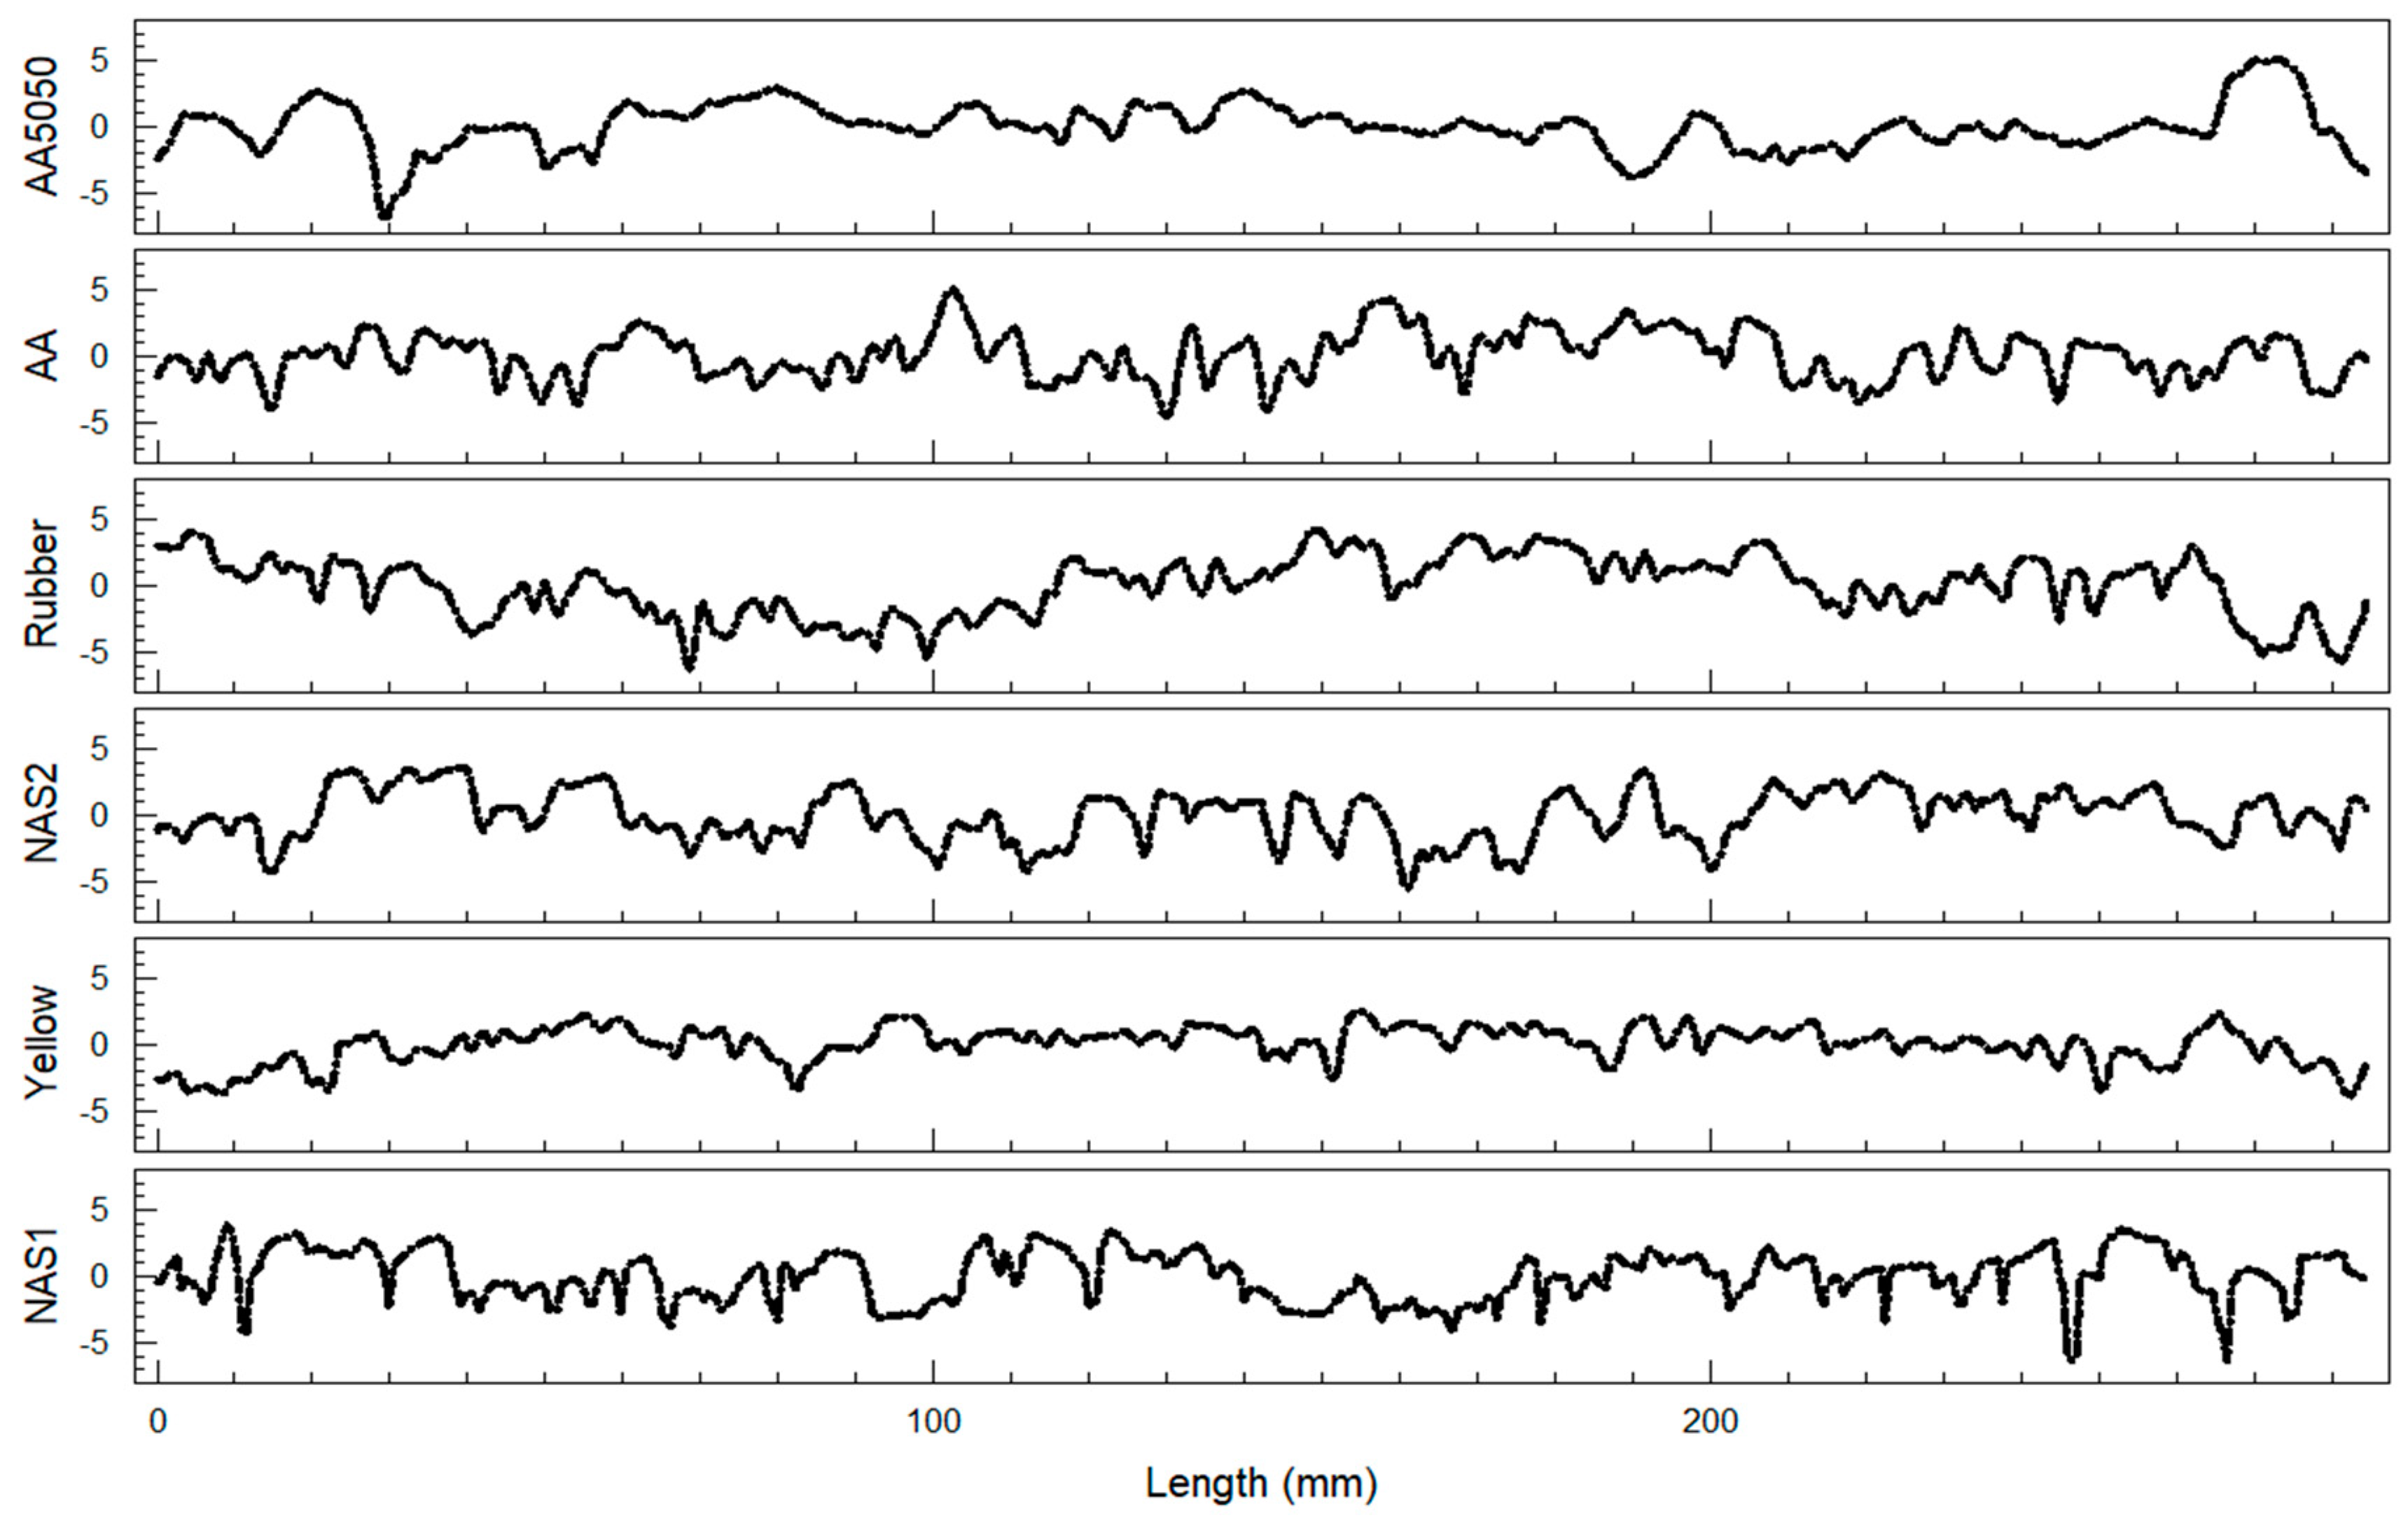
The contactless laser collected seven profiles for each sample. One profile for each sample was selected as a representative profile, as presented in Figure 5.
All of the profiles had the same length and were scaled at the same height. It is possible to note that some profiles appeared to be smoother than others, mainly “AA5050” and “Yellow”. However, the profile by itself is not enough to assess and understand the pavement texture. It is necessary to assess the roughness through the parameters presented in Table 3 and Table 4.

3.2. Normality Test

In order to understand how the peaks and valleys are distributed in sample profiles, it is possible to make a comparison using a Gaussian (normal) distribution. The Gaussian distribution has a very interesting property, in that the mean, mode, and median are equal. In Figure 6a, it is possible to see all samples’ probability distributions plotted together and Figure 6b the box plot of the same data.
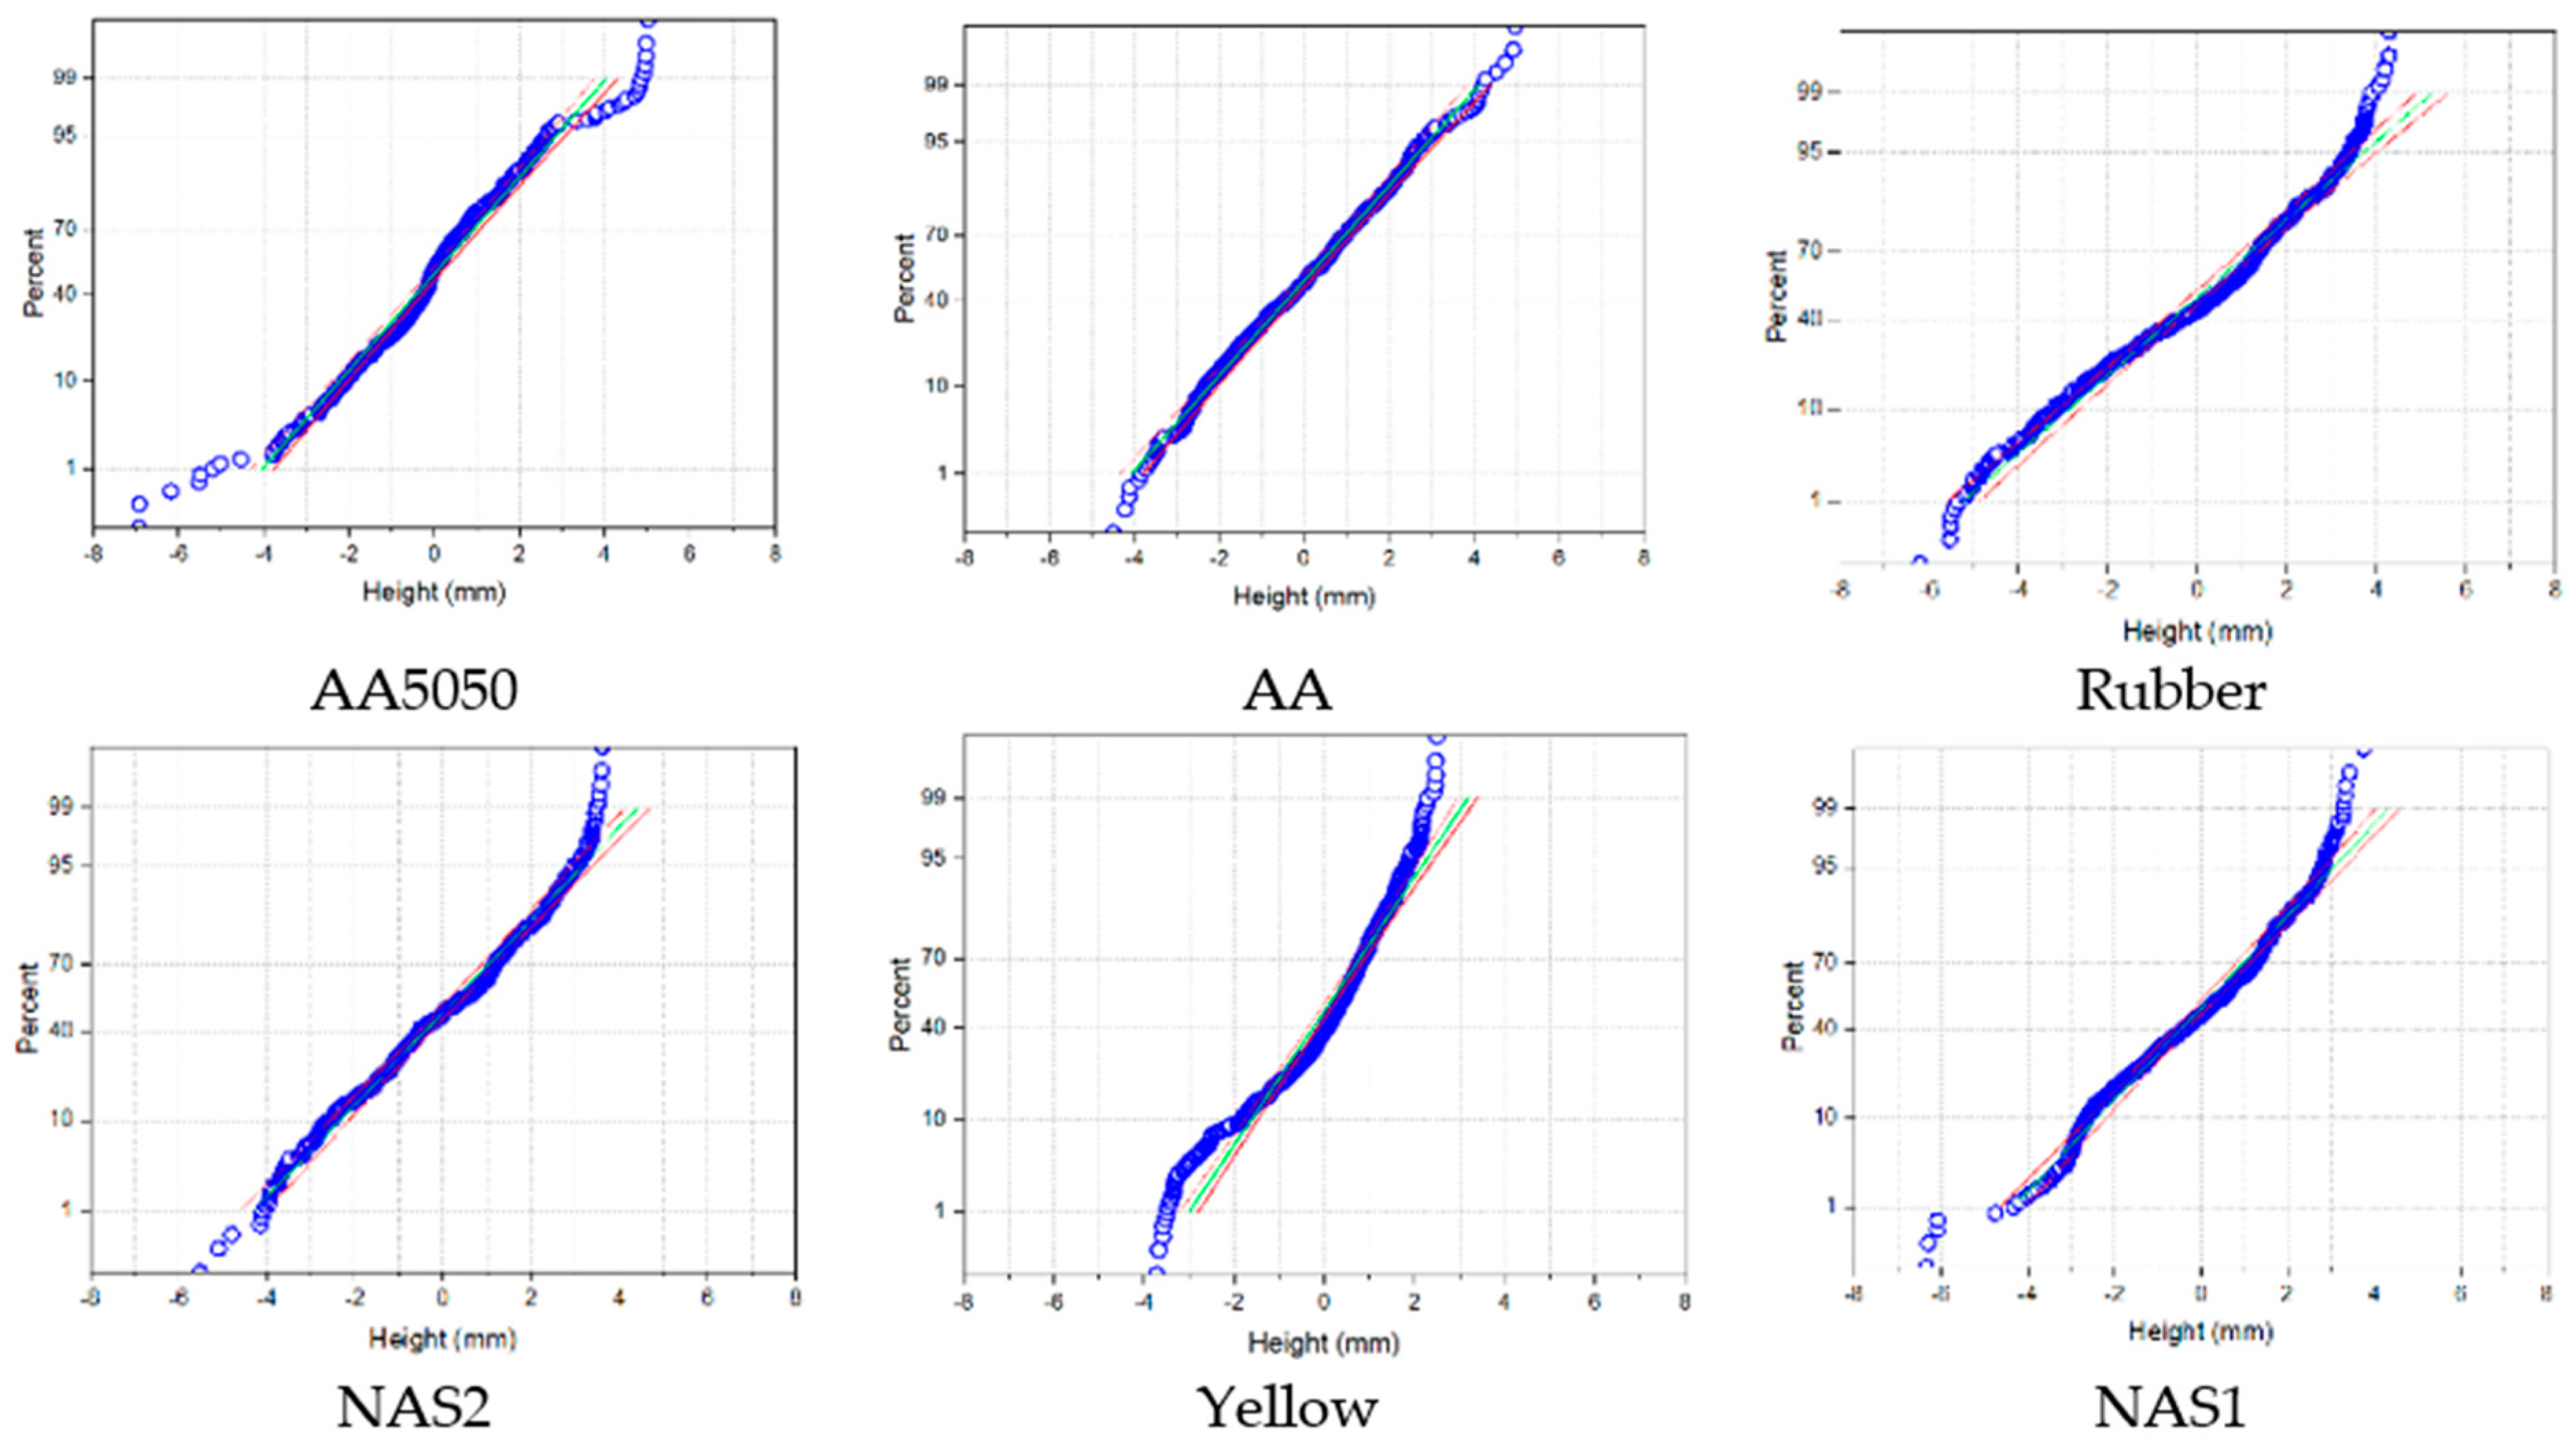
For the purpose of assessing if the samples have a Gaussian distribution, we needed to proceed with a specific test. To conduct this evaluation, the Kolmogorov–Smirnov goodness of fit test (KS test) was applied using the Software Origin2021. The KS test compares the data to a normal distribution and calculates the p-value and the data statistics. If the former is higher than the p-value, the data are not Gaussian (reject normal), this is converse if it is lower. The plotted distribution is in Figure 7, and the data are in Table 5.
The only sample that had a Gaussian-like distribution was sample “AA”. It is possible, through the descriptive statistics in Table 5, to note some relevant differences, the first being that “AA5050” had the highest kurtosis, meaning that the heights were more distributed around the mean value and so it was close to a “flat” surface. This was true also for sample “Yellow”, which shows a quite high kurtosis. In addition, all of the samples had a negative skewness, which means that in all the profiles there is a greater concentration of peaks in respect to the average values.
The reason the samples do not have a Gaussian-like distribution probably depends on the sample’s manufacturing, and on the other hand, as the profiles are conducted radially by the laser profilometer, the sample’s surface finishing is probably affected by the scraping directionality. It could be said that this approach guarantees the stationarity of the signal profile, but not its ergodicity [48].
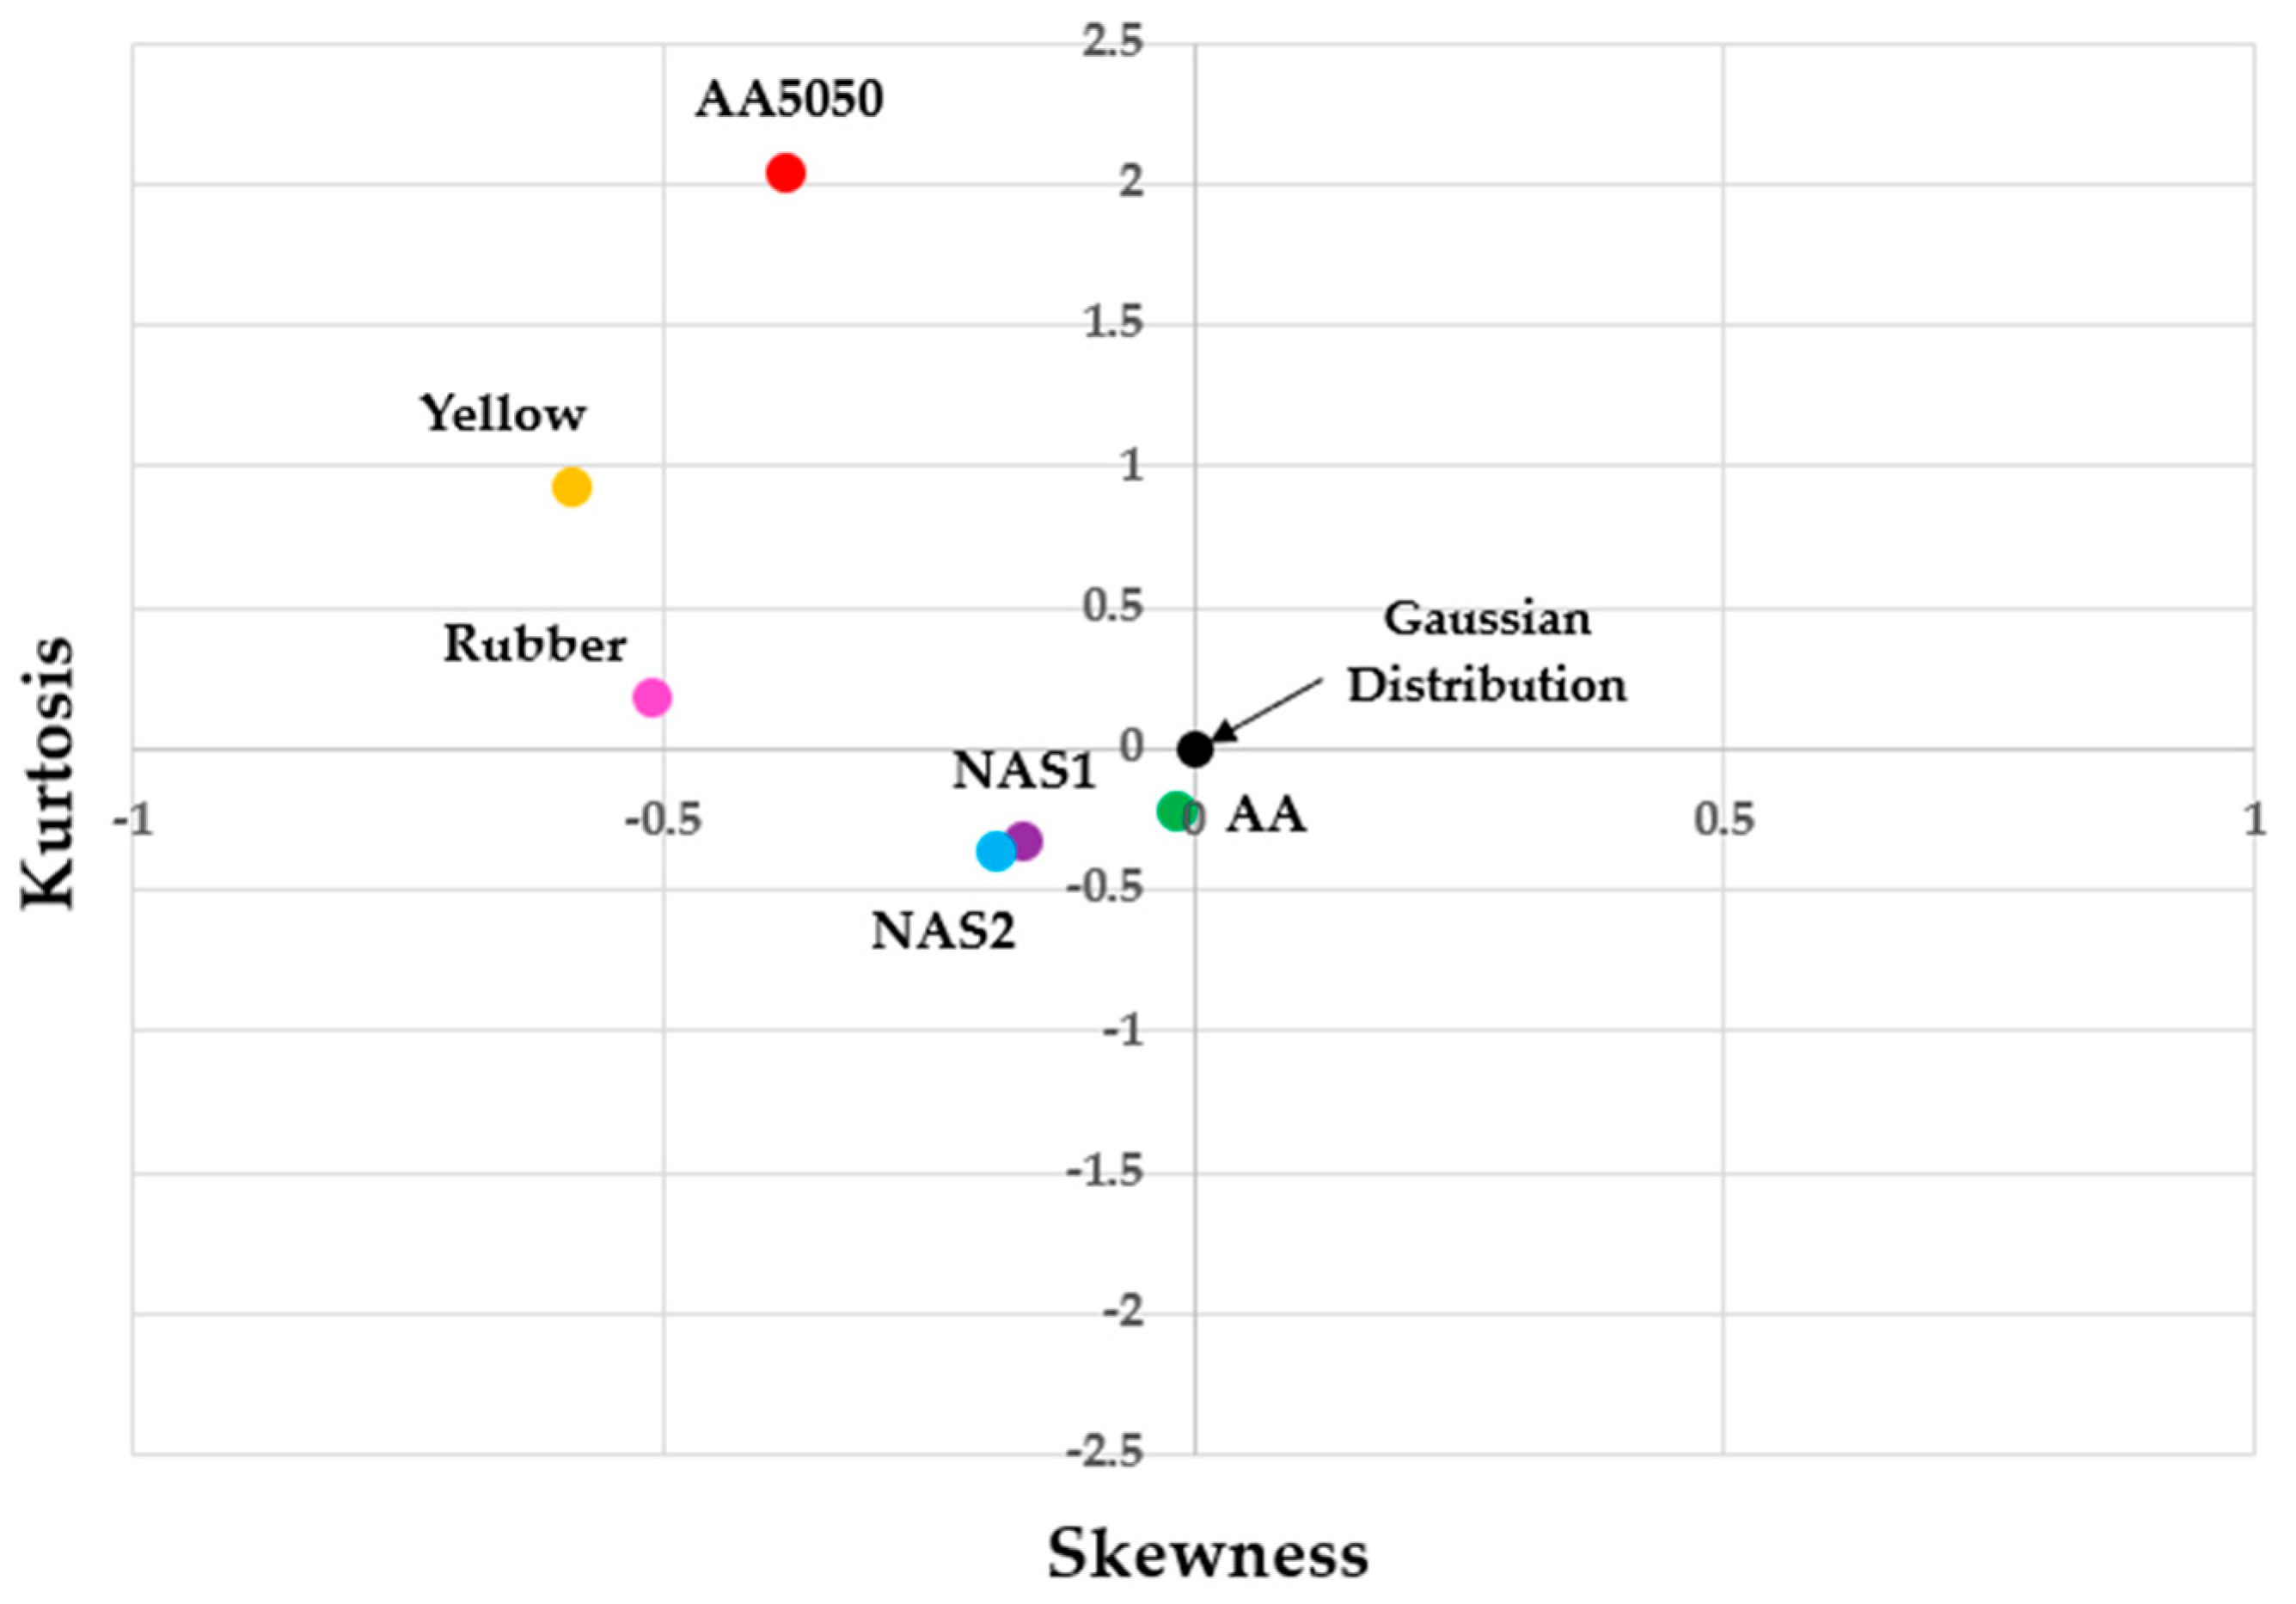
With the help of a topological graphical representation, a well-stablished tool in tribology [64,65], it is possible to group and even rank the samples according to their texture properties, as represented in Figure 8.
Sample “AA”, which is close to a normal distribution, has a kurtosis close to zero, although still negative, and a negative skewness. Samples “NAS1” and “NAS2” show quite similar results, with a low negative kurtosis and skewness. However, their profiles cannot be approximated to a normal distribution. Samples “AA5050” and “Yellow” are similar as they are both positive in the kurtosis. However, they have quite different skewness. The sample “Yellow” has a quite negative skewness but a lower kurtosis, denoting that the data are highly concentrated in the center, with low tails in the distribution. Finally, “AA5050” has a negative skewness and the highest kurtosis.

3.3. Abbott-Firestone Curve

Finally, the last parameters are presented in Figure 9, where the profile is plotted for each sample, followed by the histogram and the distribution, and finally by the bearing Abbot curve.
The Mr1 and Mr2 points in the Abbott curve represent the height of the profile above or below which a certain portion of peaks or valleys is located, respectively. For this purpose, we chose the peak above which 10% of the profile peaks lay and the valley beneath which 20% of the valleys were included (80% of the whole profile).
The inclination between the Mr1 and Mr2 in the Abbot-Firestone curve (Figure 8) is a good indicator of how the potential contact area of the sample is structured. This contact area can be related to friction, skid, and even noise. An Abbot curve with a steeper inclination has a less “flat” area, which can indicate that it has a high volume of peaks or valleys. These proportions, peaks, and valleys are given by Rpk (peaks) and Rvk (valleys), and Rk is the contact area region. This data are presented in Table 6.
It is possible to note that the samples “AA5050” and “Yellow”, which were previously cited as being smother due to the other indicators, indeed had a smother inclination, 4.897% and 3.581%, respectively, than the rest of the samples. Samples “AA”, “NAS1”, and “NAS2” showed almost the same inclination and these results were consistent with those found in the topological representation.

3.4. Intrinsic Aggregate Indicators

The texture of the pavement was collected and is presented in Table 7, summarizing the average of seven profiles for each indicator.
It is noted that the lowest MPD was from the “Yellow” mix, followed by “AA5050”, with the highest values found for “AA” and “NAS2”. It is clear that the smother surfaces, indicated in Figure 5, were indeed “Yellow” and “AA5050”, as indicated by Ra close to 1 and the lowest RMS values. “NAS1” and “NAS2” had quite similar values in all indicators, with the exception of Rmax. This could be due to a lack of homogeneity in the surface, as they were the samples manufactured with the same mixture.
Finally, by plotting the relationships between the MPD values and roughness indicators, as shown in Figure 10, it was seen that they were well-correlated, and thus it was possible to use any of them as a general indicator. Either way, they had different meanings and conveyed different information.

3.5. Texture Level Spectrum

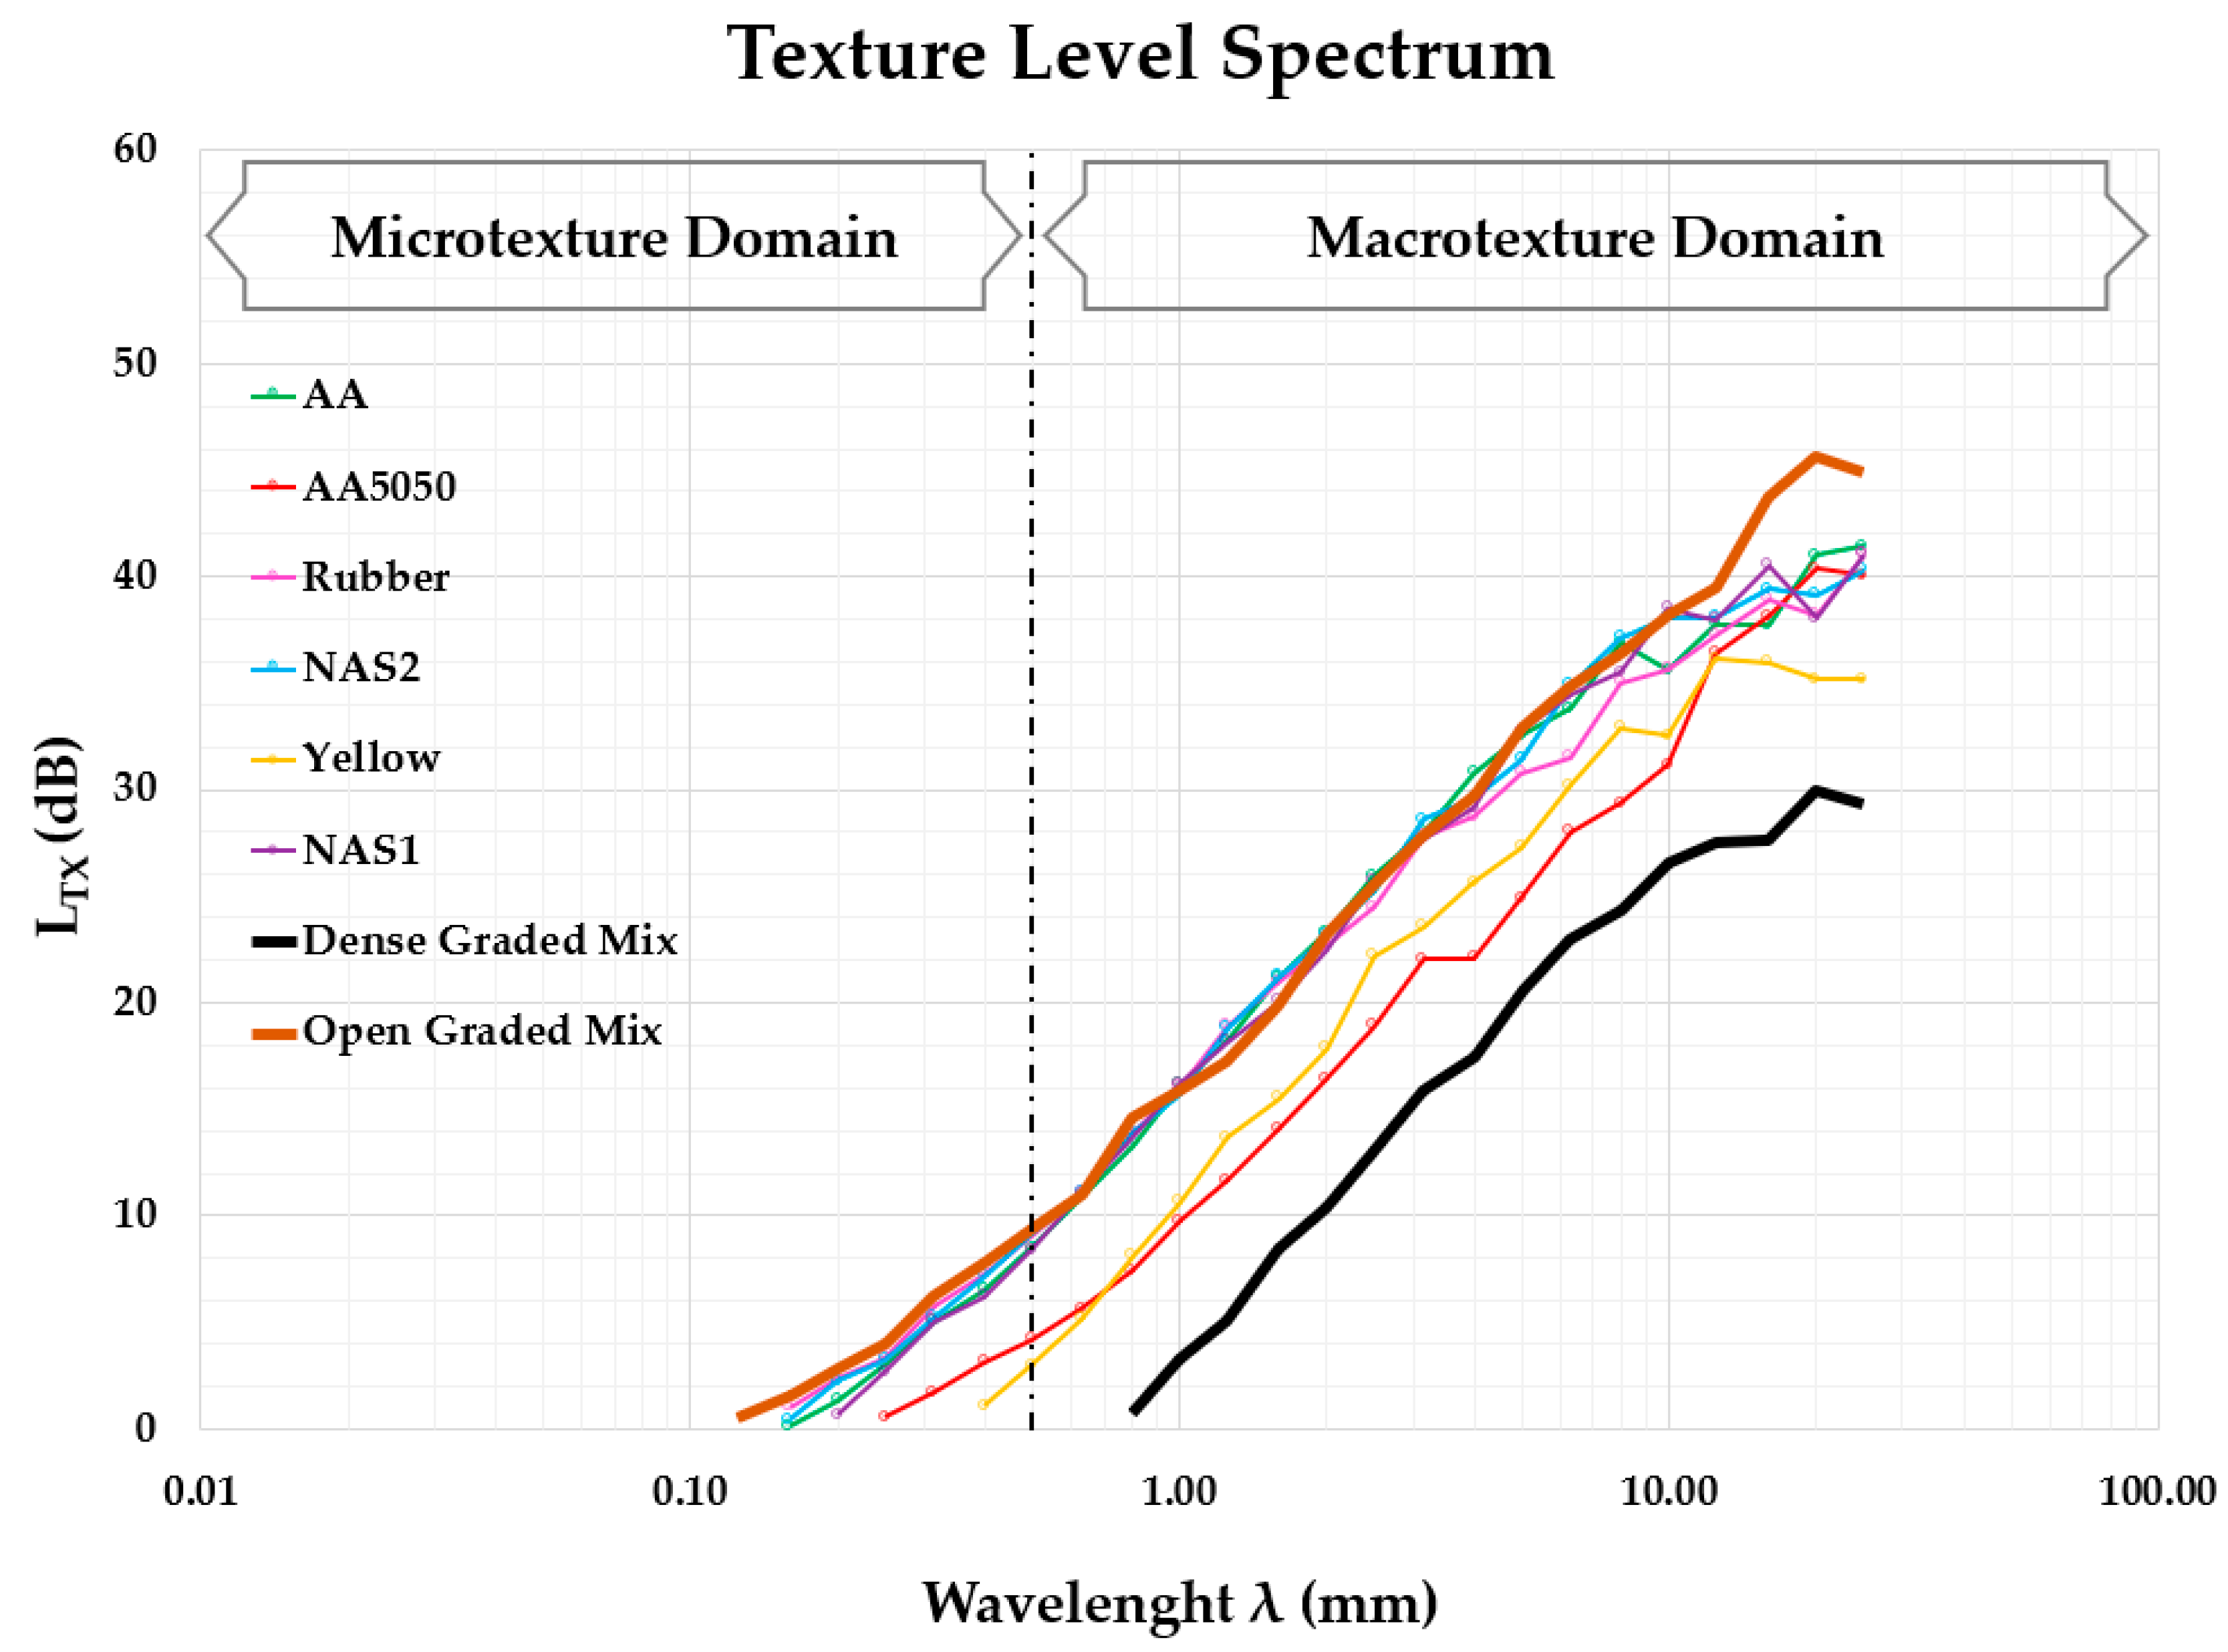
In Figure 11, it is possible to observe the texture level spectrum of the different microsurfacing samples, which shows the texture level (LTX) for a certain class of wavelengths λ, from 0.063 mm to 20 mm. In particular, it is possible to observe the microtexture domain for wavelengths below 0.5 mm, whereas the macrotexture domain ranges from 0.5 mm to 50 mm [47,49].
For comparative purposes, the microsurfacing samples were compared to an on-site application of an Open Graded (OG) mix and a Dense Graded (DG) mix. The OG texture data were acquired at the time of traffic opening, whereas the DG texture data were deliberately taken after conditioning by traffic. The OG mix used basalt with a maximum aggregate size between 15 to 20 mm, whereas DG was a mixture made up of basalt and limestone with a 0/8 granulometric curve.
As for the OG spectra, it was noted that at a larger wavelength, the texture level was higher compared with the other mixtures, and this trend was also true in the microtexture domain. The DG spectra lay below all of the mixtures: it was clear that the traffic action exposed the surface to raveling, which led to a loss of aggregates and thus to a reduction in the texture level in the macrotexture domain, and polishing, which explains the complete lack of microtexture. In conclusion, the OG and DG spectra appeared to include the microsurfacing, indicating that microsurfacing is a maintenance solution that could offer a texture level between them.
As for the microsurfacing samples, it was clearly noticeable that all of the mixtures had similar results, except for the “AA5050” and “Yellow” samples; these last ones were placed lower down in the spectra. This can be explained by comparing these results with the granulometric distribution of the samples. In fact, “AA5050” had a particle size obtained by combining 50% of a 0/6 granulometric curve passing sieve 2# and 50% AEA of 10 mm in size, whereas the “Yellow” sample was made up with 0/6 mm. Therefore, this explains the similar trend until the wavelength of 2 mm was reached, then there was an upturn of the “Yellow” curve due to the lack of particle between 2 and 10 mm in the “AA5050” mixture. Lastly, the “AA5050” curve rose due to the presence of AEA, whereas the “Yellow” curve reached a plateau.
The other mixtures’ spectra followed the same trend, especially at shorter wavelengths. In fact, there were no major differences between the 0/8 mm granulometric distribution (“NAS1” and “NAS2”) and the Australian curve (“AA”). In addition, the “AA” sample did not show particular differences, despite the presence of AEA, because of the small percentage used in the mixture. The spectra of “Rubber” exhibited a lower texture level between wavelengths of 4 and 10 mm. Finally, it could be said that the small difference between the last discussed mixtures could be attributable to the way the mixtures were laid, and were not statistically relevant.
By looking at the microtexture domain, it seems that the texture level of each sample was outlined. The microtexture in the “Yellow” sample did not emerge, probably due to the use of resin, which covered the roughness of the single aggregate itself. The “AA5050” sample showed a positive level of texture until reaching a 0.25 mm wavelength, but the microtexture was still more hidden than that of the rest of the mixtures. This could be attributable to the shape and the surface finish of AEA, considering that they were casted in molds.
These results might be related to the inclinations found in the Abbott curves; actually, the microtexture was obtained by the surface properties of the individual chippings or other small particles of the surface that come into direct contact with the tire [21], and thus the core of the surface. In fact, as previously noted, the “Yellow” and “AA5050” samples had a smoother surface than the other samples.

4. Conclusions

The present paper aimed to assess and evaluate the texture of different microsurfacing samples. The proposed work consisted of testing two benchmark mixtures that used a traditional mix design made with natural aggregates, one with asphalt emulsion and the other with a resin binder. Different mixtures were tested in comparison: a mixture with asphalt emulsion, 60% crumb rubber and 40% natural aggregate, and two mixtures with artificial geopolymer aggregates, with different granulometric curves.
The analysis carried out in the present work showed microsurfacing to be a maintenance solution that, depending on the mix design composition (i.e., particle size and amount of bitumen emulsion), give a texture spectrum level that lies in a range between a dense graded and an open graded asphalt mix. It will be the designer’s responsibility to decide the mix design in order to reach the desired surface texture performances.
Moreover, it is possible to conclude the following:
  • Microsurfacing is confirmed to be a preventative maintenance solution that can restore the pavement surface, providing good texture properties;
  • The texture parameters, traditional or statistical, are dependent on the type/size of aggregates and type/proportion of the binder used; similarly, it is noted that the samples’ manufacturing and profile’s survey directionality could also impact them;
  • Based on the adopted mix design, the use of crumb rubber as an aggregate, even at a smaller nominal size, did not present relevant differences in terms of the texture indicator when compared to the other mixtures with the same granulometric distribution;
  • The use of AEA has been shown to have an influence on the texture indicators, probably due to its size, 10 mm, but also due to its shape;
  • The authors believe that it is necessary to reproduce these tests with a more diverse sample scenario, using different binders and aggregates, while also including information on skid resistance.
In conclusion, the use of topological maps to describe and classify the surfaces according to skewness, kurtosis, and the Abbot curve could provide interesting information as it is widely used in tribology. Therefore, the use of the well-known and established texture parameters, supported by such a statistical analysis, could be useful in the laboratory phase to manage the resulting surface texture of microsurfacing and, to some extent, to explain the tire/pavement interaction, the rolling resistance offered by the surface, and the polishing action due to vehicles.

Author Contributions

Conceptualization, S.C.C. and C.S.; methodology, S.C.C., M.D.R. and C.M.; software, S.C.C. and M.D.R.; writing—original draft preparation, S.C.C.; writing—review and editing, M.D.R., P.T., C.M., R.V. and C.S.; supervision, C.S. and R.V. All authors have read and agreed to the published version of the manuscript.

Funding

This research was funded by the European Union’s Horizon 2020 research and innovation program under the Marie Sklodowska–Curie grant agreement N°765057.

Institutional Review Board Statement

Not applicable.

Informed Consent Statement

Not applicable.

Data Availability Statement

The data presented in this study are available on request from the corresponding author.

Conflicts of Interest

The authors declare no conflict of interest.

References

  1. Sandberg, U.; Ejsmont, J.A. Tyre/Road Noise Reference Book, 1st ed.; INFORMEX Ejsmont & Sandberg Handelsbolag: Kisa, Sweden, 2002; ISBN 91-613-2610-9. [Google Scholar]
  2. Vieira, T.; Sandberg, U.; Erlingsson, S. Negative texture, positive for the environment: Effects of horizontal grinding of asphalt pavements. Road Mater. Pavement Des. 2019, 22, 1–22. [Google Scholar] [CrossRef] [Green Version]
  3. Praticò, F.G.; Vaiana, R.; Fedele, R. A study on the dependence of PEMs acoustic properties on incidence angle. Int. J. Pavement Eng. 2015, 16, 632–645. [Google Scholar] [CrossRef]
  4. Christory, J.; Miet, D.; Barre, E.; Sicard, D.; Mahut, B.; Piau, J.; Luminari, M.; Beeldens, A.; Kalman, B. New Road Construction Concepts. Towards Reliable, Green, Safe & Smart and Human Infrastructure in Europe. FEHRL Sixth Framew. Program 2008, 12–13. Available online: https://docplayer.net/10203534-Nr2c-new-road-construction-concepts.html (accessed on 1 December 2022).
  5. Davies, B.R.; Cenek, D.P.; Henderson, J.R. The Effect of Skid Resistance and Texture on Crash Risk. Christchurch, New Zealand. 2005, 17P (SESSION 6). Available online: https://saferroadsconference.com/wp-content/uploads/2016/05/Peter-Cenek-Effect-Skid-Resistance-Texture-Crash-Risk.pdf (accessed on 1 December 2022).
  6. Tataranni, P.; Sangiorgi, C. Synthetic aggregates for the production of innovative low impact porous layers for urban pavements. Infrastructures 2019, 4, 48. [Google Scholar] [CrossRef] [Green Version]
  7. Kousis, I.; Fabiani, C.; Pisello, A.L. A study on the thermo-optical behaviour of phosphorescent coatings for passive cooling applications. E3S Web Conf. 2021, 238, 06002. [Google Scholar] [CrossRef]
  8. Kousis, I.; Pisello, A.L. For the mitigation of urban heat island and urban noise island: Two simultaneous sides of urban discomfort. Environ. Res. Lett. 2020, 15, 103004. [Google Scholar] [CrossRef]
  9. Wambold, J.C.; Henry, J.J. International PIARC experiment to compare and harmonize texture and skid resistance measurements. Nord. Road Transp. Res. 1995, 14, 8263–8268. [Google Scholar] [CrossRef] [Green Version]
  10. Copetti Callai, S.; Sangiorgi, C. A review on acoustic and skid resistance solutions for road pavements. Infrastructures 2021, 6, 41. [Google Scholar] [CrossRef]
  11. Heitzman, M.; Turner, P.; Greer, M. High Friction Surface Treatment Alternative Aggregates Study; Auburn University: Auburn, AL, USA, 2015. [Google Scholar]
  12. Kogbara, R.B.; Masad, E.A.; Woodward, D.; Millar, P. Relating surface texture parameters from close range photogrammetry to Grip-Tester pavement friction measurements. Constr. Build. Mater. 2018, 166, 227–240. [Google Scholar] [CrossRef]
  13. Praticò, F.G.; Vaiana, R.; Iuele, T. Acoustic absorption and surface texture: An experimental investigation. Noise Control Qual. Life 2013, 4, 2901–2909. [Google Scholar] [CrossRef]
  14. Praticò, F.G.; Anfosso-Lédée, F. Trends and Issues in Mitigating Traffic Noise through Quiet Pavements. Procedia-Soc. Behav. Sci. 2012, 53, 203–212. [Google Scholar] [CrossRef]
  15. Knabben, R.M.; Trichês, G.; Gerges, S.N.Y.; Vergara, E.F. Evaluation of sound absorption capacity of asphalt mixtures. Appl. Acoust. 2016, 114, 266–274. [Google Scholar] [CrossRef]
  16. Ahammed, M.A.L.T. Pavement Surface Mixture, Texture and Skid Resistance: A Factorial Analysis. ASCE-Airf. Highw. Pavements 2008, 11, 370–384. [Google Scholar]
  17. Woodward, D.; Friel, S. Predicting the wear of high friction surfacing aggregate. Coatings 2017, 7, 71. [Google Scholar] [CrossRef] [Green Version]
  18. Vaiana, R.; Praticò, F. Pavement surface properties and their impact on performance-related pay adjustments. In Proceedings of the 3rd International Conference on Transportation Infrastructure, Pisa, Italy, 22–25 April 2014. [Google Scholar]
  19. Kuchiishi, K.; Vieira, T.; Copetti Callai, S.; Bernucci, L.L.B. Estudo da macrotextura do pavimento a partir de ensaios de mancha de areia e drenabilidade em conjunto com análise da superfície por estereoscopia. In Proceedings of the XXVIII Anpet-Congresso de Pesquisa e Ensino em Transportes, Curitiba, Brasil, 24–28 November 2014. [Google Scholar]
  20. ISO 13473-3:2002; ISO Characterization of Pavement Texture by Use of Surface Profiles—Part 3: Specification and Classification of Profilometers. ISO: Geneva, Switzerland, 2002.
  21. ISO 13473-1:1997; ISO Characterization of Pavement Texture by Use of Surface Profiles—Part 1: Determination of Mean Profile Depth. ISO: Geneva, Switzerland, 1997.
  22. Praticò, F.G.; Vaiana, R. A study on the relationship between mean texture depth and mean profile depth of asphalt pavements. Constr. Build. Mater. 2015, 101, 72–79. [Google Scholar] [CrossRef]
  23. Edmondson, V.; Woodward, J.; Lim, M.; Kane, M.; Martin, J.; Shyha, I. Improved non-contact 3D field and processing tech-niques to achieve macrotexture characterisation of pavements. Constr. Build. Mater. 2019, 227, 116693. [Google Scholar] [CrossRef]
  24. Puzzo, L.; Loprencipe, G.; Tozzo, C.; D’Andrea, A. Three-dimensional survey method of pavement texture using photo-graphic equipment. Meas. J. Int. Meas. Confed. 2017, 111, 146–157. [Google Scholar] [CrossRef]
  25. Woodham, R.J. Photometric Method For Determining Surface Orientation From Multiple Images. Opt. Eng. 1980, 19, 191139. [Google Scholar] [CrossRef]
  26. Abdel-Aal, H.A. Functional surfaces for tribological applications: Inspiration and design. Surf. Topogr. Metrol. Prop. 2016, 4, 43001. [Google Scholar] [CrossRef]
  27. Franco, L.A.; Sinatora, A. 3D surface parameters (ISO 25178-2): Actual meaning of Spk and its relationship to Vmp. Precis. Eng. 2015, 40, 106–111. [Google Scholar] [CrossRef]
  28. Stoeterau, R.L.; Sinatora, A.; Tertuliano, I.; Pavesi, C.; Fruchtengarten, F.; Ono, F.S. Study of Dimple Texturized Surfaces Op-erating without Lubrication. In Proceedings of the 23rd SAE Brasil International Congress and Display, Sao Paulo, Brazil, 30 September–2 October 2014; SAE International: Warrendale, PA, USA, 2014. [Google Scholar]
  29. Praticò, F.G.; Vaiana, R. Permeable friction courses: Area-based vs. Line-based surface performance and indicators. Noise Control Qual. Life 2013, 1, 117–126. [Google Scholar]
  30. Grilli, A.; Graziani, A.; Carter, A.; Sangiorgi, C.; Pivoto Specht, L.; Copetti Callai, S. Slurry surfacing: A review of definitions, descriptions and current practices. RILEM Tech. Lett. 2019, 4, 103–109. [Google Scholar] [CrossRef]
  31. Li, S.; Xiong, R.; Yu, D.; Zhao, G.; Cong, P.; Jiang, Y. Friction Surface Treatment Selection: Aggregate Properties, Surface Characteristics, Alternative Treatments, and Safety Effects; Purdue University: West Lafayette, IN, USA, 2017; ISBN 9781622604784. [Google Scholar]
  32. De Larrard, F.; Martinez-Castillo, R.; Sedran, T.; Hauza, P.; Poirier, J.E. Cementitious artificial aggregate particles for high-skid resistance pavements. Road Mater. Pavement Des. 2012, 13, 376–384. [Google Scholar] [CrossRef]
  33. Bennert, T.; Hanson, D.; Maher, A.; Vitillo, N. Influence of Pavement Surface Type on Tire/Pavement Generated Noise. J. Test. Eval. 2005, 22, 98–103. [Google Scholar] [CrossRef] [Green Version]
  34. Sangiorgi, C.; Bitelli, G.; Lantieri, C.; Irali, F.; Girardi, F. A Study on Texture and Acoustic Properties of Cold Laid Micro-surfacings. Procedia-Soc. Behav. Sci. 2012, 53, 223–234. [Google Scholar] [CrossRef] [Green Version]
  35. Do, M.T.; Cerezo, V.; Beautru, Y.; Kane, M. Modeling of the connection road surface microtexture/water depth/friction. Wear 2013, 302, 1426–1435. [Google Scholar] [CrossRef]
  36. Goubert, L. A new test track with the ultra noise reducing Poro-elastic Road Surface (PERS) in Gent, Belgium. In Proceedings of the INTER-NOISE 2019 MADRID-48th International Congress and Exposition on Noise Control Engineering, Madrid, Spain, 16–19 June 2019. [Google Scholar]
  37. Li, W.; Han, S.; Huang, Q. Performance of noise reduction and skid resistance of durable granular ultra-thin layer asphalt pavement. Materials 2020, 13, 4260. [Google Scholar] [CrossRef]
  38. Vaiana, R.; Balzano, F.; Iuele, T.; Gallelli, V. Microtexture performance of EAF slags used as aggregate in asphalt mixes: A comparative study with surface properties of natural stones. Appl. Sci. 2019, 9, 3197. [Google Scholar] [CrossRef] [Green Version]
  39. Callai, S.C.; Tataranni, P.; Sangiorgi, C. Preliminary evaluation of geopolymer mix design applying the design of experiments method. Infrastructures 2021, 6, 35. [Google Scholar] [CrossRef]
  40. Provis, J.L.; Rees, C. Geopolymers: Structures, Processing, Properties and Industrial Applications; Woodhead: Sawston, UK, 2009. [Google Scholar]
  41. Makoundou, C.; Johansson, K.; Wallqvist, V.; Sangiorgi, C. Functionalization of crumb rubber surface for the incorporation into asphalt layers of reduced stiffness: An overview of existing treatment approaches. Recycling 2021, 6, 19. [Google Scholar] [CrossRef]
  42. Makoundou, C.; Sangiorgi, C.; Johansson, K.; Wallqvist, V. Development of functional rubber-based impact-absorbing pavements for cyclist and pedestrian injury reduction. Sustainability 2021, 13, 11283. [Google Scholar] [CrossRef]
  43. Patrick, S. Guidelines and specifications for microsurfacing. In Austroads Research Report AP-R569-18; Austroads: Sydney, Australia, 2018. [Google Scholar]
  44. ISSA. 143 Recommended Performance Guidelines for Micro Surfacing, International Slurry Surfacing Association, Annapolis. In ISSA Guideline A143; ISSA: Glen Ellyn, IL, USA, 2010. [Google Scholar]
  45. ISSA. TB 100 Laboratory Test Method for Wet Track Abrasion of Slurry Surfacing Systems, International Slurry Surfacing Association; ISSA: Glen Ellyn, IL, USA, 2018. [Google Scholar]
  46. Praticò, F.G.; Vaiana, R. A study on volumetric versus surface properties of wearing courses. Constr. Build. Mater. 2013, 38, 766–775. [Google Scholar] [CrossRef]
  47. Boscaino, G.; Pratico, F.G. Classification and inventory of indicators of pavement surface texture. Bull. La-Boratoires Ponts Chaussées 2001, 234, 17–34. [Google Scholar]
  48. Boscaino, G.; Praticò, F.G.; Vaiana, R. Tyre/road noise on different road pavements: Synergetic influence of acoustical absorbing coefficient and surface texture. In Proceedings of the 10th EAEC European Congress, Belgrade, Serbia, 30 May–1 June 2005; Volume 30. [Google Scholar]
  49. Aavik, A.; Kaal, T.; Jentson, M. Use of Pavement Surface Texture Characteristics Measurement Results in Estonia. In Proceedings of the The XXVIII International Baltic Road Conference, Vilnius, Lithuania, 26–28 August 2013; pp. 1–10. [Google Scholar]
  50. Ongel, A.; Harvey, J.T.; Kohler, E.; Lu, Q.; Steven, B.D. Investigation of Noise, Durability, Permeability, and Friction Performance Trends for Asphalt Pavement Surface Types: First- and Second-Year Results; University of California Pavement Research Center: Sacramento, CA, USA, 2008. [Google Scholar]
  51. Ongel, A.; Harvey, J. Pavement characteristics affecting the frequency content of tire/pavement noise. Noise Control Eng. J. 2010, 58, 563–571. [Google Scholar] [CrossRef]
  52. Vaiana, R.; Praticó, F.G.; Iuele, T.; Gallelli, V.; Minani, V. Effect of asphalt mix properties on surface texture: An experimental study. Appl. Mech. Mater. 2013, 368–370, 1056–1060. [Google Scholar] [CrossRef]
  53. Zhan, W.; Huang, P. Modeling tangential contact based on non-Gaussian rough surfaces. Proc. Inst. Mech. Eng. Part J J. Eng. Tribol. 2019, 233, 51–60. [Google Scholar] [CrossRef]
  54. Gabriel, P.; Thomas, A.G.; Busfield, J.J.C. Influence of interface geometry on rubber friction. Wear 2010, 268, 747–750. [Google Scholar] [CrossRef]
  55. Salcedo, M.C.; Coral, I.B.; Ochoa, G.V. Characterization of surface topography with Abbott Firestone curve. Contemp. Eng. Sci. 2018, 11, 3397–3407. [Google Scholar] [CrossRef]
  56. Schmähling, J.; Hamprecht, F.A. Generalizing the Abbott-Firestone curve by two new surface descriptors. Wear 2007, 262, 1360–1371. [Google Scholar] [CrossRef]
  57. Vieira, T. Asphaltic Pavement Surface Analysis and Its Effects on the Tyre-Pavement Friction Performance. Ph.D. Thesis, Universidade de São Paulo, São Paulo, Brazil, 2014. [Google Scholar]
  58. Ech, M.; Morel, S.; Yotte, S.; Breysse, D.; Pouteau, B. An Original Evaluation of the Wearing Course Macrotexture Evolution using the Abbot Curve. Road Mater. Pavement Des. 2009, 10, 471–494. [Google Scholar] [CrossRef]
  59. Meegoda, J.N.; Gao, S.; Liu, S.; Gephart, N.C. Pavement texture from high-speed laser for pavement management system. Int. J. Pavement Eng. 2013, 14, 697–705. [Google Scholar] [CrossRef]
  60. Vaitkus, A.; Andriejauskas, T.; Šernas, O.; Čygas, D.; Laurinavičius, A. Definition of concrete and composite precast concrete pavements texture. Transport 2019, 34, 404–414. [Google Scholar] [CrossRef] [Green Version]
  61. Do, M.T.; Cerezo, V. Road surface texture and skid resistance. Surf. Topogr. Metrol. Prop. 2015, 3, 043001. [Google Scholar] [CrossRef]
  62. Edjeou, W.; Cerezo, V.; Zahouani, H.; Salvatore, F. Multiscale analyses of pavement texture during polishing. Surf. Topogr. Metrol. Prop. 2020, 8, 024008. [Google Scholar] [CrossRef]
  63. ISO 13473-4:2008; Characterization of Pavement Texture by Use of Surface Profiles–Part 4: Spectral Analysis of Texture Profiles. International Organization for Standardization: Geneva, Switzerland, 2008.
  64. Kovács, Z.F.; Viharos, Z.J.; Kodácsy, J. Determination of the working gap and optimal machining parameters for magnetic assisted ball burnishing. Meas. J. Int. Meas. Confed. 2018, 118, 172–180. [Google Scholar] [CrossRef] [Green Version]
  65. Krolczyk, G.M.; Krolczyk, J.B.; Maruda, R.W.; Legutko, S.; Tomaszewski, M. Metrological changes in surface morphology of high-strength steels in manufacturing processes. Meas. J. Int. Meas. Confed. 2016, 88, 176–185. [Google Scholar] [CrossRef]
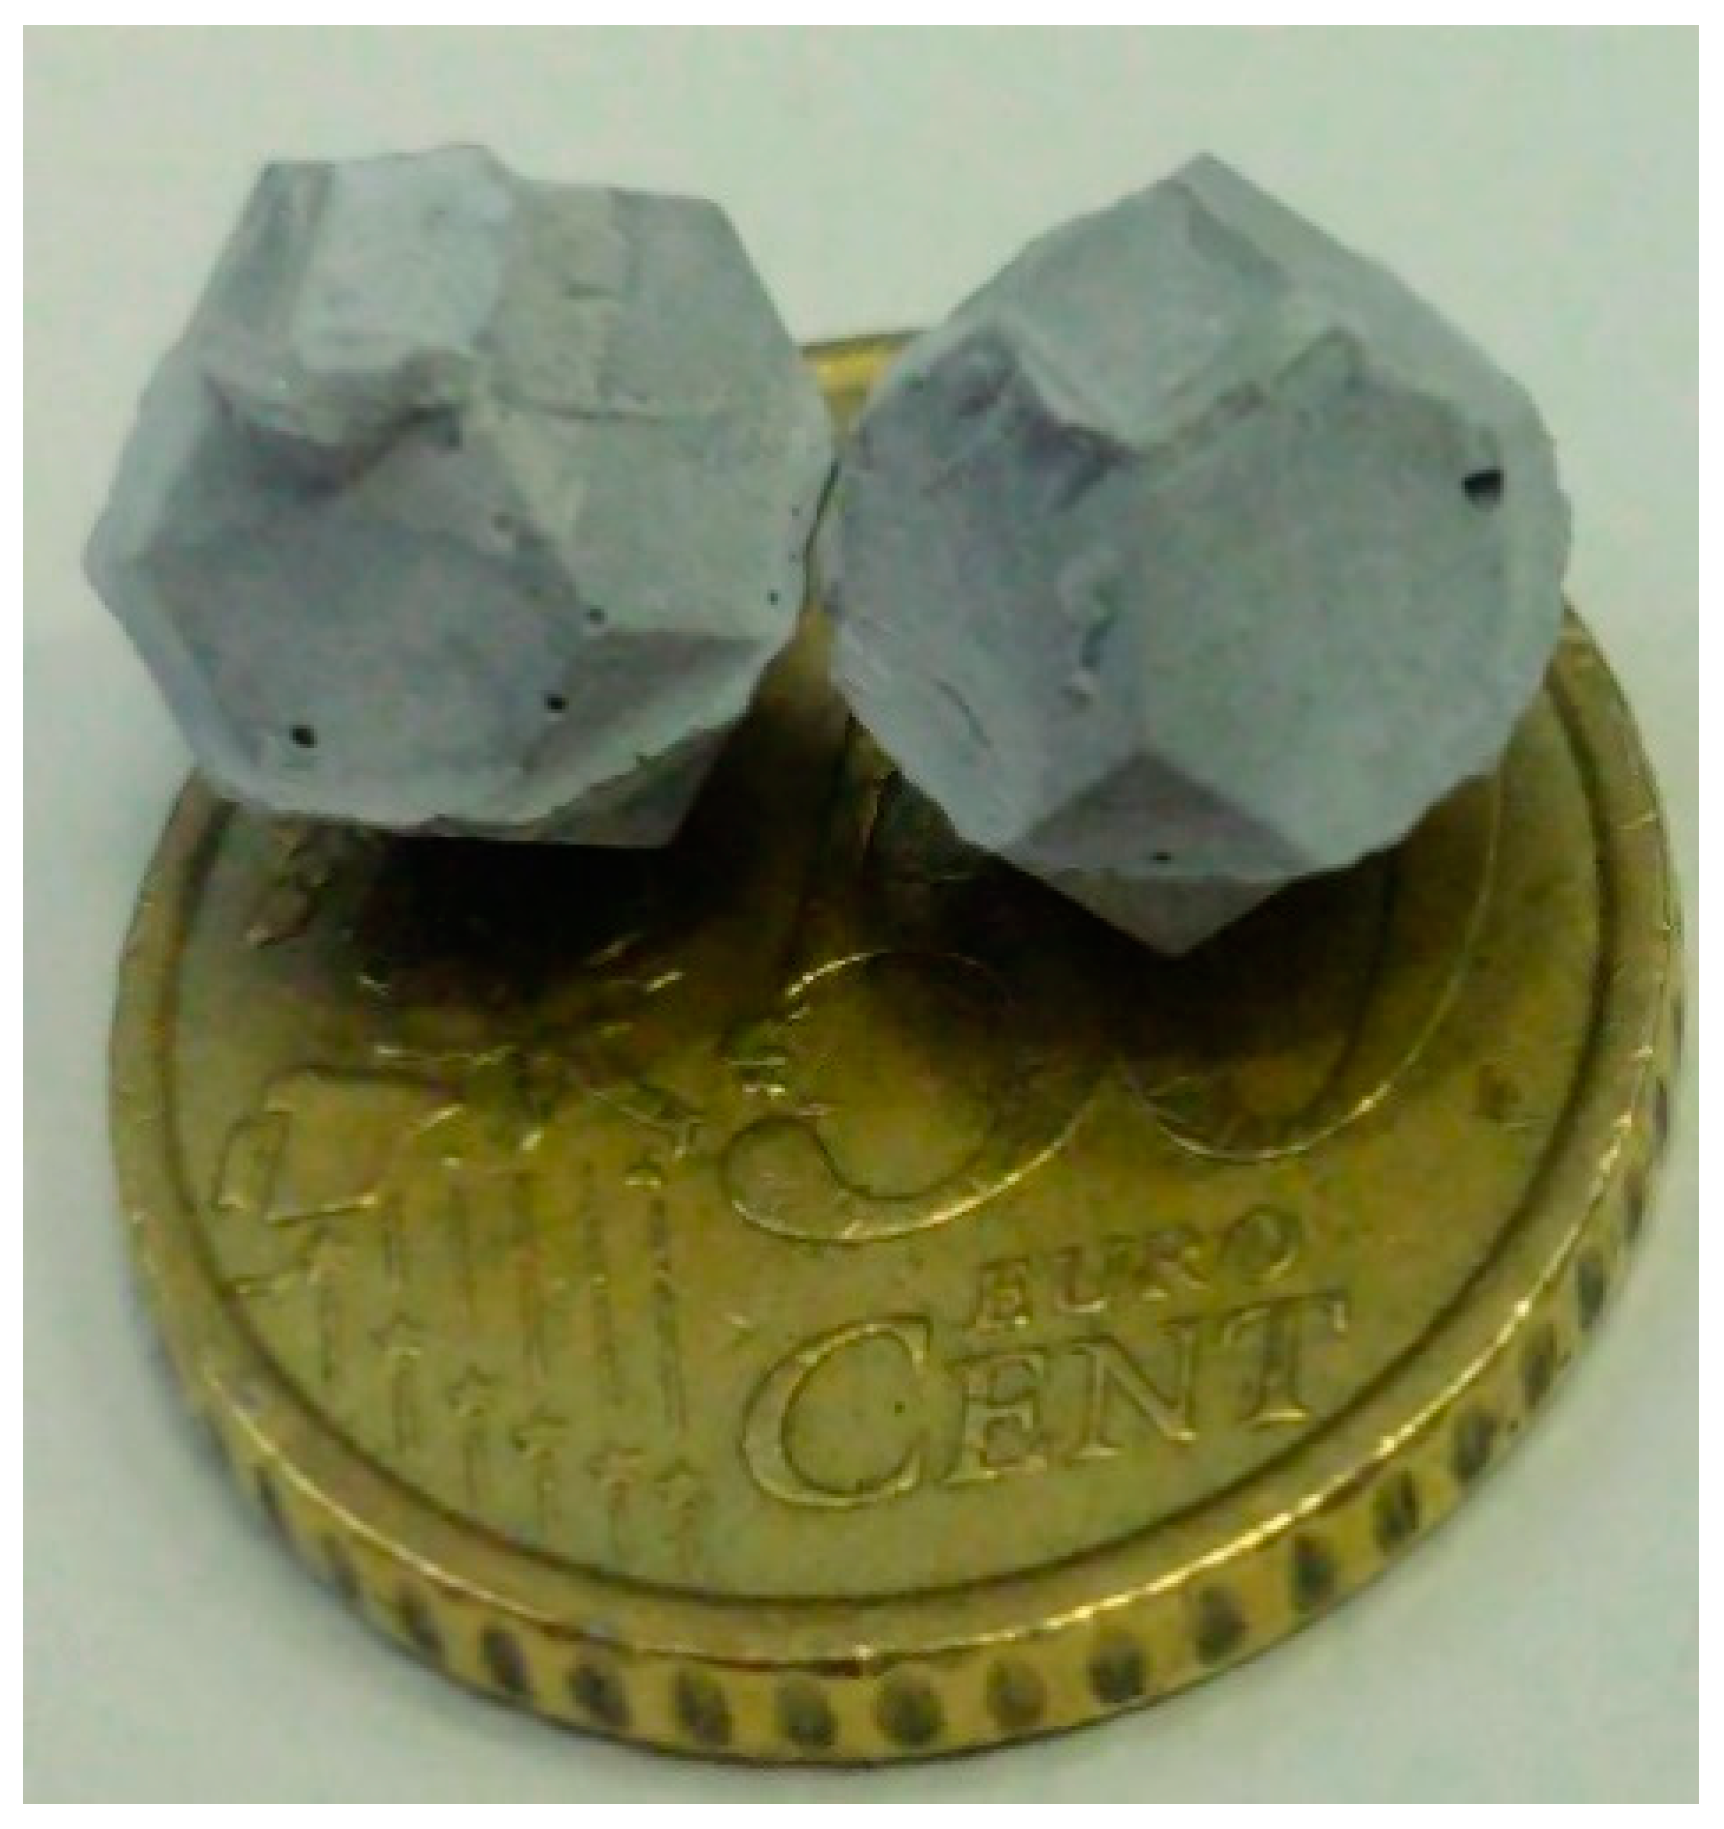
Figure 1. Artificially engineered aggregate.
Coatings 12 01905 g001
Figure 2. Microsurfacing samples.
Coatings 12 01905 g002
Figure 3. Texture analysis by means of a conoscopic holography laser profilometer: (a) capturing of a profile; (b) alignments identification on a sample.
Coatings 12 01905 g003
Figure 4. Methodology used for the surface texture analysis.
Coatings 12 01905 g004
Figure 5. Representative profiles of each sample.
Coatings 12 01905 g005
Figure 6. Plot probability density curves (a) and box plot of the samples (b).
Coatings 12 01905 g006
Figure 7. Probability distribution curves.
Coatings 12 01905 g007
Figure 8. Topological graphical representation.
Coatings 12 01905 g008
Figure 9. Profiles, histograms, and probability density curve and Abbot-Firestone curves.
Coatings 12 01905 g009
Figure 10. MPD by other height indicators.
Coatings 12 01905 g010
Figure 11. Texture Level Spectrum of the samples.
Coatings 12 01905 g011
Table 1. Physical and mechanical properties of the natural aggregate.
PropertiesSpecificationBasaltic Aggregate 0/6Basaltic Aggregate 4/8
Bulk Specific Gravity [Mg/m3]UNI EN 1097-62.682.66
Crushed Particles [%]UNI EN 933-5100100
Methylene Blue TestUNI EN 933-90.8-
Shape Index [-]UNI EN 933-4-15
Flakiness Index [-]UNI EN 933-3-10
Micro Deval [-]UNI EN 1097-1-10
Los Angeles [%]UNI EN 1097-2-20
Polished Stone Value [-]UNI EN 1097-8-50
Table 2. Description of the analyzed samples.
NameType of BinderType of AggregateGranulometric Information
AA5050Asphalt emulsion modified with latexNA
AEA
50% < sieve #2 of 0/6 NA
50% 10 mm single size AEA
AAAsphalt emulsion modified with latexNA
AEA
Australian gradation curve (0/10 mm)
replacing 10 mm NA by 10 mm AEA
RubberAsphalt emulsion modified with latexNA
CR
40% NA
60% 0/4 mm CR
NAS2Asphalt emulsion modified with latexNA0/8 mm
YellowNon-asphaltic resinNA0/6 mm
NAS1Asphalt emulsion modified with latexNA0/8 mm
Table 3. Statistical parameters of the height distribution.
IndicatorNameFormulaGraphical Explanation
RskSkewness R s k = i = 1 n 1 n ( z i z ¯ ) 3 ( i = 1 n 1 n ( z i z ¯ ) ) 3 2 Coatings 12 01905 i001
RkuKurtosis R k u = i = 1 n 1 n ( z i z ¯ ) 4 ( i = 1 n 1 n ( z i z ¯ ) 2 ) 2 Coatings 12 01905 i002
Probability Density CurveBearing curve (Abbot curve)-Coatings 12 01905 i003
Table 4. Intrinsic indicators of the surface texture by profile post-processing.
Aggregate Intrinsic IndicatorsNameFormulaGraphical Explanation
MPDisoMean Profile Depth [52] M P D = 1 s t P e a k + 2 n d P e a k 2 + A v e r a g e   l e v e l Coatings 12 01905 i004
MPDaipcrMean Profile Depth [8]-Coatings 12 01905 i005
ETD1995isoEstimated Texture Depth [18] E T D = 0.2 + 0.8 · M P D -
ETD2019isoEstimated Texture Depth [52] E T D = 1.1 · M P D -
RaAverage Roughness R a = 1 L · i = 1 n | Z i Z m e a n | Coatings 12 01905 i006
RuHeight to the mean R m a x = Z m a x Z m e a n Coatings 12 01905 i007
RzAverage peak-to-valley height R z = 1 5 · i = 1 n Z p i Z v i Coatings 12 01905 i008
Rmax (Rt)Maximum total height R m a x = max ( Z p i ) + max ( Z v i ) Coatings 12 01905 i009
RMS (Rq)Root Mean Square R M S =   1 n · i = 1 n y i 2 Coatings 12 01905 i010
Spectral Intrinsic IndicatorsNameFormulaGraphical Explanation
LTX,λTexture Level
(for given wavelength λ)
L T X , λ = 10 l g ( 2 | Z k a r e f | 2 )
For k = 0 ,   ,   ( 1 2 N 1 )
-
Table 5. KS test results and descriptive statistics.
SampleK-S TestDescriptive Statistics
Statisticsp-ValueDecision at Level (5%)MeanMedianRkuRsk
AA50500.052710.02158Reject normal0.002580.080752.03850−0.38128
AA0.015510.02130Can’t reject normal−0.005700.01032−0.22259−0.01487
Rubber0.047280.02140Reject normal0.002420.174870.17292−0.50802
NAS20.035690.02099Reject normal0.002070.04557−0.37487−0.18550
Yellow0.040560.02143Reject normal−0.000810.067570.92019−0.58339
NAS10.025590.02130Reject normal−0.005140.01069−0.33301−0.15955
Table 6. Abbot curve data and curve inclination.
SampleMr1 (mm)Mr2 (mm)Inclination (%)Rpk (mm)Rvk (mm)Rk (mm)
AA50502.072−1.3564.8972.9965.5803.428
AA2.381−1.5745.6493.2264.9083.954
Rubber2.500−1.6395.9131.8923.2687.098
NAS22.391−1.5685.6552.8345.4893.959
Yellow1.511−0.9963.5811.2894.5722.507
NAS12.392−1.5825.6782.2336.0533.974
Table 7. Average roughness indicators for the whole captured profile.
IndicatorAA5050
(Avg mm)
AA
(Avg mm)
Rubber
(Avg mm)
NAS2
(Avg mm)
Yellow
(Avg mm)
NAS1
(Avg mm)
MPDiso2.2553.5872.6313.0541.9712.930
MPDaipcr2.7763.9072.6373.5682.2093.396
ETD1995iso2.0043.0702.3052.6431.7762.544
ETD2019iso2.4813.9462.8943.3602.1683.223
Ra1.0111.4991.3931.4400.8351.411
Ru2.5644.0352.9943.5842.3183.505
Rz3.4275.6964.4635.4143.0824.617
Rmax4.8936.9946.3187.1434.3925.935
RMS1.3831.8501.8961.7971.1081.776
Publisher’s Note: MDPI stays neutral with regard to jurisdictional claims in published maps and institutional affiliations.