Article

Experimental and Theoretical Study of Forced Synchronization of Self-Oscillations in Liquid Ferrocolloid Membranes

by
Vladimir Chekanov
1,2,
Anna Kovalenko
3,* and
Natalya Kandaurova
2
1
Department of Digital Development, North-Caucasus Federal University, 355017 Stavropol, Russia
2
Department of Information Technologies, MIREA-Russian Technological University, 355000 Stavropol, Russia
3
Department of Data Analysis and Artificial Intelligence, Kuban State University, 350040 Krasnodar, Russia
*
Author to whom correspondence should be addressed.
Coatings 2022, 12(12), 1901; https://doi.org/10.3390/coatings12121901
Submission received: 28 September 2022 / Revised: 29 November 2022 / Accepted: 30 November 2022 / Published: 5 December 2022
(This article belongs to the Special Issue Advances in Liquid Systems: Aerosols, Foams, and Emulsions)

Abstract

:
A ferrocolloid is a suspension of nanometer-sized ferromagnetic particles (magnetite) in a carrier liquid (kerosene). A unique feature of a ferrocolloid is the fact that layers consisting of densely packed particles are formed near the electrode surface under the influence of an external electric field. Each layer is a liquid membrane, and its formation significantly affects the various properties of the system. For example, the development of a unique phenomenon in a ferrocolloid is self-organization (self-oscillations and autowaves). The applied external periodic force leads to a change (capture) of the frequency of the autowave process-forced synchronization of autowaves. The experimentally obtained synchronization was investigated by the method of electrically controlled interference. After multiple experiments and theoretical studies, a physical mechanism for the synchronization of the autowave process in a cell with a ferrocolloid was proposed for the first time. A mathematical model of forced synchronization of autowaves, which is described by a system of nonlinear differential equations, was proposed for the first time as well. Adding an external periodic force into the model led to a change in the frequency of autowaves; synchronization by an external force was confirmed by computational experiments.

1. Introduction

Liquid-dispersed nanostructured systems (ferrocolloids or magnetic fluids) have unique electrical and electro-optical properties, which are of scientific interest from the point of view of studying the interaction of dispersed particles with external fields and with each other [1,2,3,4,5]. A ferrocolloid is a colloidal system of ferromagnetic particles (magnetite) with a size of ~10 nm in a carrier liquid (kerosene). To avoid coagulation, particles are usually covered with a protective shell of oleic acid [6]. A unique feature of ferrocolloids is the formation of dense layers of magnetite particles with a protective shell near the electrodes in a constant electric field. The layer does not mix with the main volume of the liquid and behaves as a liquid ferrocolloid membrane [7,8,9,10]. The membrane is formed as a result of electrophoresis of particles of the dispersed phase. It is a stable structure, the thickness of which depends on the magnitude of the applied electric field. The stability of the membrane comes from the magnetic interaction between magnetite particles [11]. The formation of a liquid membrane has a significant effect on the macroscopic properties of a ferrocolloid. The liquid ferrocolloid membrane has a special property—the recharging of colloidal particles [12]. In turn, the recharging of particles in the membrane is the basis of the physical mechanism for the development of self-sustaining nonlinear waves (autowaves) [13].
Autowaves—one of the examples of self-organization of matter—are currently the object of close attention for specialists in various scientific fields [14,15,16,17].
Interest in this topic is caused primarily by the fact that the laws of behavior and propagation of autowaves are the same and are used to explain phenomena in biology, chemistry, medicine, urban studies, and other fields. Autowaves in the near-surface layer of a ferrocolloid (magnetic fluid) are a unique phenomenon. The ease of reproduction makes the autowave process (AWP) convenient for research. The number of cycles flowing in it can exceed several thousand. Therefore, a cell with a ferrocolloid is a good model environment for studying and simulating ARP in biological objects, such as a heart muscle or a nerve fiber. Autowaves in a ferrocolloid were studied in [13,18,19].
One of the main trends in the living world is the tendency to achieve a common rhythm in collective behavior—the tendency to synchronize.
The term “synchronization” refers to a wide class of phenomena from the scientific and social fields. Adjustment of the heart rate to breathing, birds in a flock, violins in an orchestra, and the radiation of a population of fireflies are phenomena that seem different but obey the same laws: the object adjusts the rhythm of its actions to other objects. Resonance interactions leading to the observation of standing waves have previously been observed in biological systems (e.g., circadian rhythms).
The main provisions of the theory of synchronization are most fully described in monographs [20,21,22,23]. It is known [20] that if a self-oscillatory system is affected by an external periodic force, the frequency of which is a multiple of the natural frequency of self-oscillations, then synchronization (or capture) of the frequency occurs, that is, the frequency of self-oscillations becomes exactly the same number of times less or more than the frequency of the external force. If the frequency of the external force is close to the frequency of its own self-oscillations, one speaks of synchronization on the fundamental tone.
Synchronization of autowaves in chemical systems (the Belousov-Zhabotinsky reaction) was obtained in [24], wherein it was experimentally shown that the reaction–diffusion processes that rule the evolution and selection of patterns in many chemical and biological systems can also exhibit frequency-blocking phenomena.
In the present work, forced synchronization (frequency blocking) of an autowave process in a thin layer of a ferrocolloid by an external periodic electric force was experimentally obtained for the first time for different ratios of the natural oscillation frequencies and the frequency of the driving force. A physical synchronization mechanism was established. A mathematical model of synchronization of the autowave process, which takes into account the action of the driving force, was proposed.

2. Materials and Methods: Experimental Technique

The experimental medium was a thin layer of ferrocolloid (ferrocolloid membrane) placed between two electrodes. One of the electrodes was glass with a conductive transparent ITO (indium tin oxide) coating, a semiconductor material that is transparent to visible light (Figure 1a). A glass prism was installed on the electrode to eliminate the flare effect.
The concentration of the dispersed phase in the liquid used in the experiment was 9 vol.% The thickness l of the ferrocolloid layer in the cell was 280 µm. The surface area of the electrodes was S = 36 × 30 mm2. In the experiments, we used two samples of ITO-coated glasses (manufactured by LLC Politech, St. Petersburg). The glass thickness was 4 mm, and the thickness of the conductive coating was h01 = (280 ± 5) nm. The measurements were taken at five different points on the surface and then averaged. The optical parameters of the ITO coating were measured with an SE 800 SENTECH spectroscopic ellipsometer. According to measurements at a wavelength of λ = 650 nm at ten points at a distance of 5 mm from each other, after averaging, the complex refractive index of the conductive coating was n1 = 1.76 (1 + 0.04i). The refractive index of glass was n2 = 1.52, and the refractive indices of the ferrocolloids with concentrations of 9 vol.% and 27 vol.% were n3 = 1.48 (1 + 0.01i) and n4 = 1.75 (1 + 0.03i), respectively.
When a cell with a ferrocolloid was placed in a constant electric field, a liquid membrane was formed at the electrodes, the thickness of which increased with increasing voltage. If the surface of the cell was illuminated with white light, then the change in the membrane thickness was visually observed with the changing of the surface color. This effect was associated with the interference of falling rays from the upper and lower boundaries of the liquid membrane (Figure 1b) and this is called electrically controlled interference [25]. After the voltage on the electrodes increased to the value Vcr, the membrane became unstable, and the concentration of magnetic particles fluctuated with a frequency ω0 (autowave process (AWP)) (Figure 4a). The liquid membrane is a reaction-diffusion medium and can be considered as a two-dimensional array of nonlinear oscillators [26,27,28]. To determine the oscillation frequency ω0, a cell with a ferrocolloid was illuminated with monochromatic light (a laser with a wavelength of λ = 650 nm) at an angle of 45 degrees (Figure 2).
The beam reflected from the glass-conductive coating and conductive coating-liquid membrane surfaces and continued to the PD-256 photodiode through a diaphragm (6 in Figure 2) and a Polaroid camera (7 in Figure 2). The photodiode was connected to the GDS-71022 oscilloscope, which showed the dependence of the voltage on the photodiode on time (Figure 3, beam 2). Taking into account that the photodiode operated in a linear mode, the voltage at the input resistor of the oscilloscope Uosc was proportional to the reflected light intensity and proportional to the coefficient reflections R: Uosc (t) = kR (t). The shape of the curves in Figure 3 is explained as follows: at a certain critical voltage Vcr (~8 V), the intensity of the reflected light began to change periodically (beam 2), which indicated a periodic change (fluctuations) in the layer thickness. The moment of occurrence of self-oscillations was considered to be the voltage Vcr at which the oscillogram of the optical response took a periodic form. The period (frequency) of oscillations was taken from the oscillogram. Beam 1 is the ampere-time characteristic of the process.
Simultaneously, with a constant voltage V, a cell with a ferrocolloid was affected by a rectangular pulsed voltage U, the amplitude of which was less than the amplitude of the constant voltage, so it did not suppress autowaves.
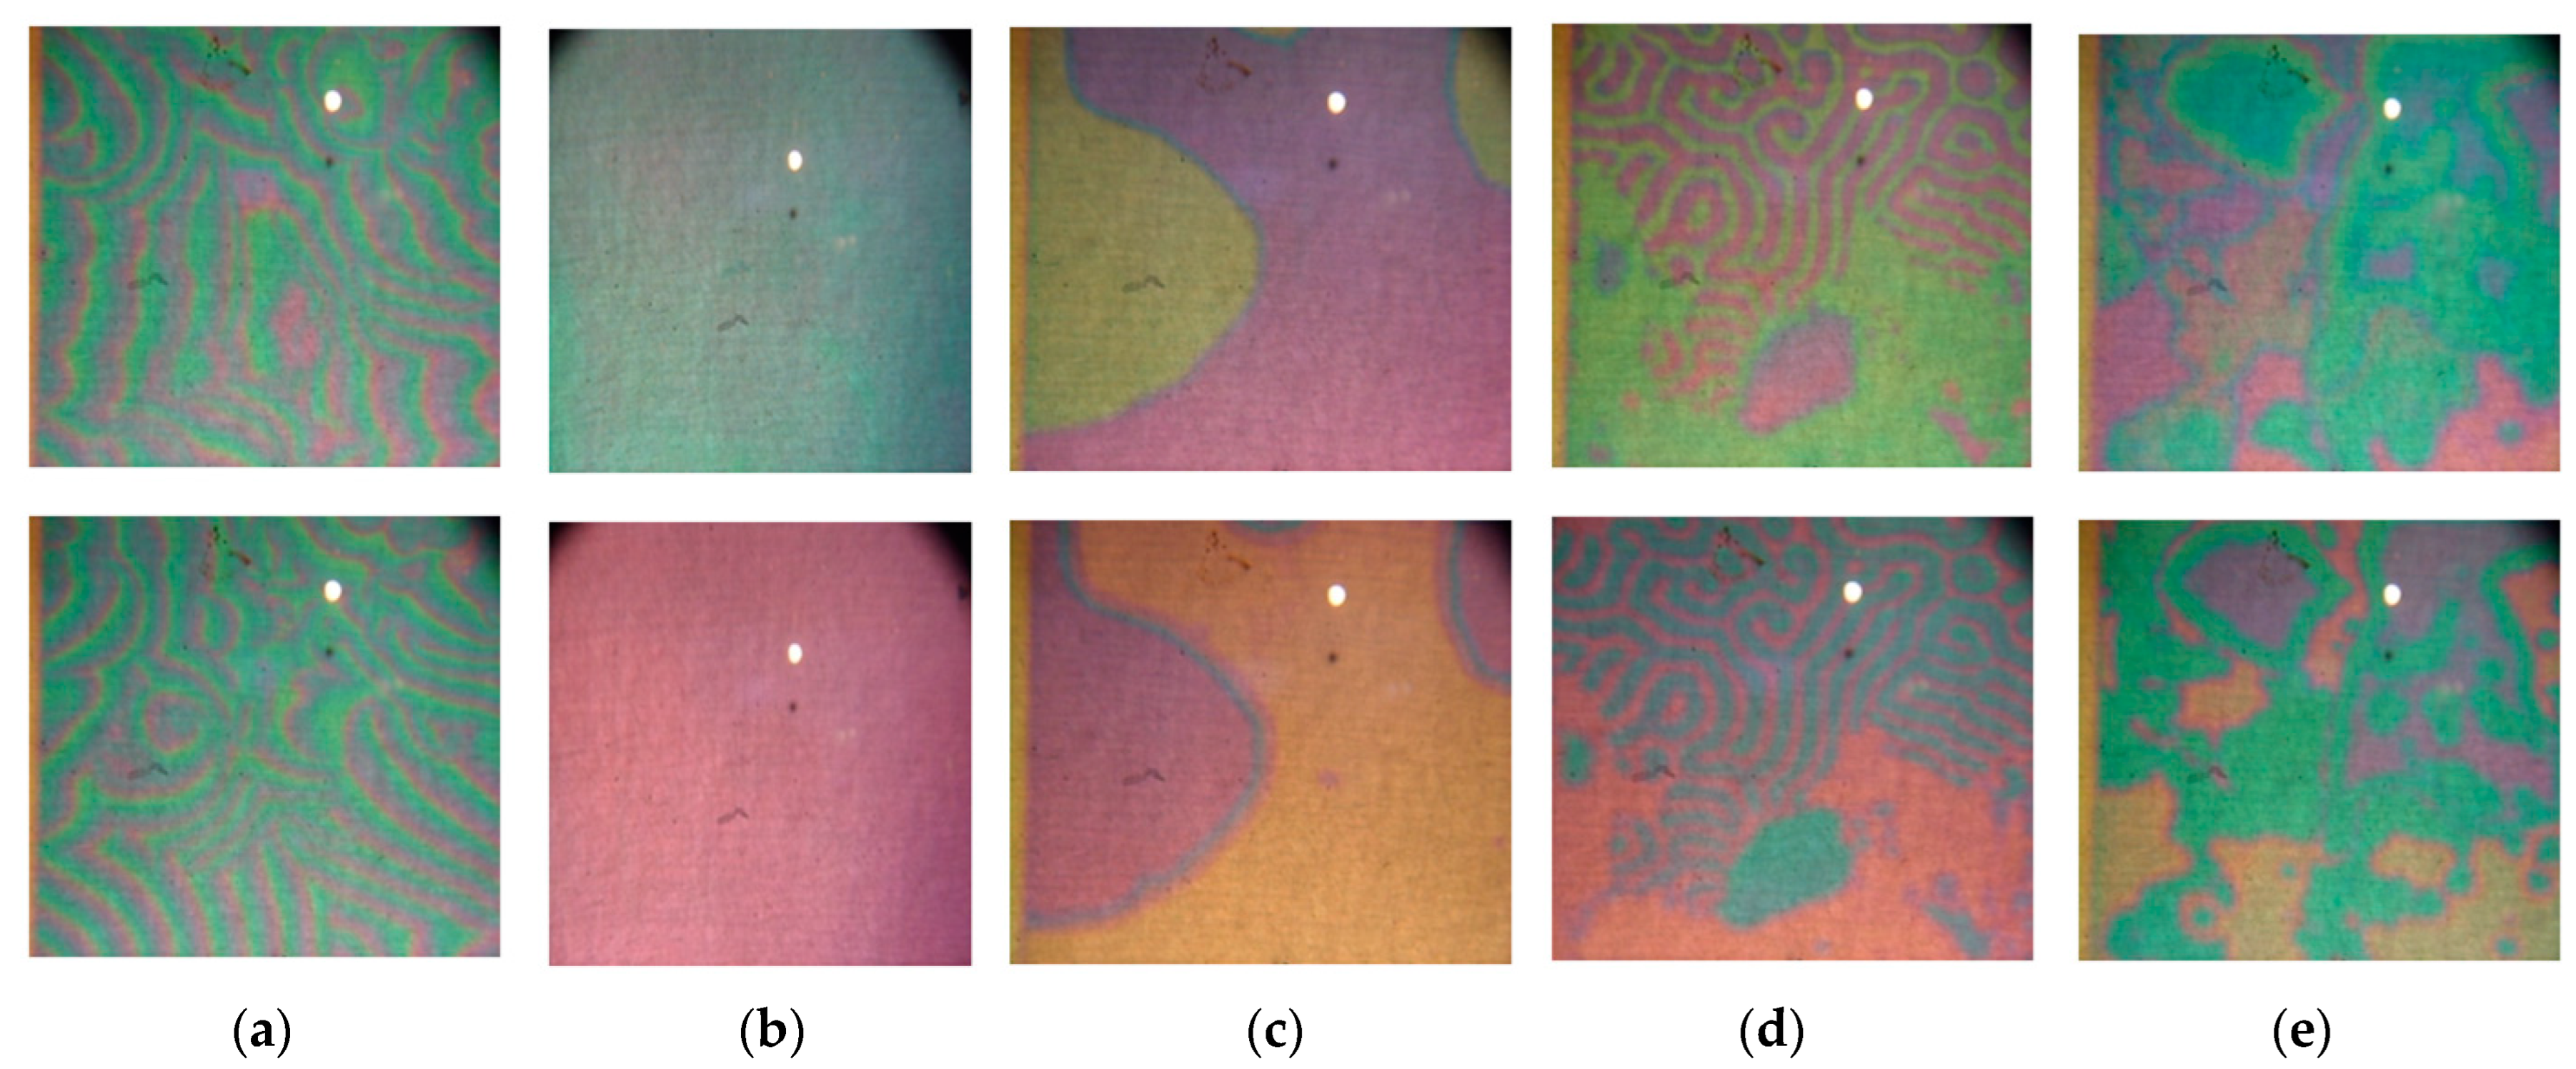
The frequency of the external force was varied in such a way as to obtain zero detuning or a very small one (ω0−ωp). With a change in the pulse frequency ωp from 0.9 to 5 Hz, after some time t, the frequency was captured, and a sequence of synchronization patterns shown in Figure 4b–e was observed. Oscillations had the observing frequency Ω, which in a private case of zero detuning was equal to the natural frequency ω0. Video files are available at https://disk.yandex.ru/d/ku3tiAlaITWjpQ, accessed on 4 December 2022.
At constant voltage V = 8.1 V, impulse voltage U = 2.5 V, and frequency ωp = 1.35 Hz, the entire surface of the cell with the ferrocolloid changed color (which meant that the thickness of the entire membrane changed). This means that the detuning was zero and the frequency of concentration oscillations of the entire cell surface was equal to the frequency of the external periodic force—ωp0 = 1:1 (Figure 4b). Figure 5 shows the time dependence of the intensity of the reflected light (beam 1) and the type of impulse voltage (beam 2), which shows that the period of concentration fluctuations was equal to the period of the impulse voltage, so the frequency capture occurred.
Figure 4c shows the synchronization of oscillations at the frequency ratio ωp0 = 2:1. The constant voltage on the electrodes was V = 16 V, and the amplitude of the pulse voltage was U = 8 V. It can be seen that two spatially homogeneous regions of the liquid membrane oscillated in antiphase. The strip separating these regions (in Figure 4c it is blue) was a stationary front, its color (and hence the membrane thickness in this region) did not change, and there were no concentration fluctuations. In [24], such strips are called “nodal lines”. The synchronization modes listed above can go over many cycles.
With a frequency ratio ωp0 = 1:2.5, standing waves or labyrinth structures were obtained (Figure 4d).
The experimental obtaining of synchronization of reverberators—spiral waves or autowave vortices—deserves special attention. A reverberator arose as a result of the evolution of a flat autowave front break. Reverberators rotated at a variable speed, so the formation of standing waves in the event of periodic external force acting on the reverberator was impossible. In the experimental cell in the ferrocolloid, the modulation of the reverberator speed was obtained (Figure 6).
Video files are available at https://disk.yandex.ru/d/ku3tiAlaITWjpQ accessed on 4 December 2022.

3. Discussion of Experimental Results

It is known [20] that if a self-oscillating system, which oscillates with a natural frequency ω0, is acted upon by an external periodic force, the frequency of which is ωp, and if the detuning (ω0−ωp) is sufficiently small, then the frequency of the observed oscillations Ω becomes equal to the frequency of the external force—this is called synchronization (or frequency capture). The coincidence of frequencies in a finite range of detuning is the main property of synchronization. In a more complicated case, self-oscillations with a natural frequency ω0 can be captured by a force with a frequency close (but not necessarily equal) to ω0/2, ω0/3, etc. Then the frequency of the observed oscillations will be equal to Ω = 2ωp or Ω = 3ωp. This mode is called n:m synchronization. Since we consider the autowave process in the near-electrode layer of a ferrocolloid from the position of the oscillations of coupled oscillators [29,30], each element of the layer (particle ensemble) interacts with its nearest neighbors or, in a more complex case, with several neighbors. Each oscillator has its own frequency, but there may also be clusters of oscillators that oscillate with the same frequency [31].
Sections of the near-electrode layer can be considered as a system of coupled nonlinear oscillators, each of which tends to synchronize its motion with the neighboring one and with an external harmonic force. If the oscillators do not interact with each other, then with the frequency ratio ω0p = 1:m, where m is an integer, neighboring oscillators would have equal phase differences 2π/m·i, where i = 1, …, m−1. However, since the oscillators are coupled (including due to the magnetic dipole–dipole interaction of ferrocolloid particles), they tend to have the same phases as their neighbors. Clusters of particles oscillate with the same frequency, and clouds are formed. The phase difference between the clouds is /m∙i [20].
The synchronization mode shown in Figure 4c, when the frequency of the observed oscillations Ω and the frequency of the driving force ωp are equal, demonstrates a simultaneous periodic change in the color of the entire surface of the cell with a ferrocolloid—the entire medium oscillates uniformly. This mode is observed when the natural oscillation frequency ω0 is equal or close to the frequency of the driving force.
When we changed the frequency of a periodic force (impulse voltage) in such a way that two regions were formed on the cell surface that oscillated in antiphase (Figure 4c), the frequency of the observed oscillations Ω and the frequency of the driving force were related as ωp:Ω = 1:2 The natural frequency ω0 will be close or equal to Ω. At this frequency ratio, a cell with a ferrocolloid acted as a bistable system with two states corresponding to two possible vibrational phases. It is very interesting that between two boundaries that oscillate in antiphase there was always a stationary region that did not oscillate. This result was also observed in [24,32], which supports the theoretical hypothesis that such behavior is a fundamental property of interfaces in reliable systems.
An interesting result was obtained with a frequency ratio ωp:Ω = 1:2.5 (Figure 4d); the photograph shows labyrinth structures—standing waves. In [24], similar structures appeared only when the intensity of the external action was above a certain critical value. In our experiments, the appearance of labyrinths depended only on the ratio of the frequencies of the external force and the natural oscillation frequency. The amplitude of the external force in all experiments was less than the amplitude of the constant force, which is the source of energy for the generation of autowaves.

4. Mathematical Model of Forced Synchronization of an Autowave Process in a Ferrocolloid

A mathematical model was developed that confirms the synchronization of the AWP in a ferrocolloid by a periodic electric force. It is based on the model of a self-oscillatory process in a ferrocolloid, which is described in [33]. The model consisted of a research area (Figure 7), a system of Equations (1)–(7) and initial and boundary conditions in Equations (8)–(15).
Let x = 0 and x = H be the conditional points at which the process of charging particles takes place (no space charge in x = 0); in a particular case, these can be an anode and a cathode. The initial distribution of neutral particles of a ferrocolloid with a known concentration (initial conditions C 1 ( 0 , x ) = C 10 ( x ) and C 2 ( 0 , x ) = C 20 ( x ) ) is determined by diffusion. In an electric field at the initial moment of time t = 0, the particles become charged. Around the point x = H, the particles become charged negatively, and around x = 0, they become charged positively. In an electric field, negatively charged magnetic particles begin to move towards the anode, and positively charged ones move towards the cathode, so the dense layers form near the electrodes.
The model of AWP is based on the mechanism of particle recharging in layers and is a classical system of differential equations [34,35,36,37], without simplifications and fitting parameters:
j i = F R T z i D i C i E D i C i + C i V , i = 1 , 2 ,
C i t = d i v j i , i = 1 , 2 ,
ε r Δ φ = F ( z 1 C 1 + z 2 C 2 ) ,
I = F ( z 1 j 1 + z 2 j 2 )
V t + ( V ) V = 1 ρ 0 P + ν Δ V + 1 ρ 0 f ,
d i v ( V ) = 0 ,
f = ρ E
The Nernst–Planck Equation (1) describes the charged particles’ flow due to diffusion convection and electric migration, the charge numbers of positively charged particles z 1 = 1 , and negatively charged particles z 2 = 1 . Equation (2) is the material balance equation, Equation (3) is the potential Poisson equation, and Equation (4) is the current flow equation, where ε r is the dielectric constant, φ is the potential, C i is the concentration, j i is the flux, D i is the diffusion coefficient, I is the current density, and V is the flow rate of the magnetic fluid. The Navier–Stokes Equation (5) and continuity equations for an incompressible fluid (6) describe the velocity field formed, in particular, under the action of a spatial electric force (7), with f being electric force density, where ρ = F ( z 1 C 1 + z 2 C 2 ) is the space-charge density, ρ 0 is the ferrocolloid density, and ν is the kinematic viscosity.
The process of the wave appearance is associated with the process of charging and recharging of the particles, which is reflected in the boundary conditions in Equations (8)–(15).
At all boundaries of the study area, the adhesion condition is used for the velocity. The initial condition is defined as a stable solution.
V x ( 0 , x , y , z ) = V y ( 0 , x , y , z ) = 0 .
Voltage on the electrodes is higher than zero.
To describe the recharge process of MF particles in a liquid membrane, we used the following boundary conditions:
At the anode (x = 0):
( F R T 0 D 1 z 1 C 2 φ x D 1 C 2 x ) | x = 0 = j 1 A
( F R T 0 D 2 z 2 C 1 φ x D 2 C 1 x ) | x = 0 = j 2 A
At the cathode (x = H):
( F R T 0 D 1 z 1 C 2 φ x D 1 C 2 x ) | x = H = j 1 K
( F R T 0 D 2 z 2 C 1 φ x D 2 C 1 x ) | x = H = j 2 K
The recharge conditions in Equations (9)–(12) reflect the process of two flows (positive and negative) turning into each other after recharging on both electrodes.
The model considers the equipotentiality of the cathode and anode surfaces as the boundary conditions for the potential
φ ( t , 0 , y , z ) = α φ ( t , H , y , z ) = 0
Insulators are considered to be impermeable:
n j i = 0 , i = 1 , 2
n φ = 0
At the initial moment of time, the particles are concentrated on both electrodes; i.e., C 10 ( 0 , x , y , z ) ,   C 20 ( 0 , x , y , z ) are located near the anode x = 0 and cathode x = H.
For the initial distribution of magnetic particles, we used the following functions:
C 1 ( 0 , x , y , z ) = C 10 ( 0 , x , y , z ) = 0.074 e x / ( 0.01 H ) mol / m 3
C 2 ( 0 , x , y , z ) = C 20 ( 0 , x , y , z ) = 0.074 e ( H x ) / ( 0.01 H ) mol / m 3
φ ( 0 , x , y , z ) = α α x H
To simulate AWP synchronization, we considered two different options for setting Δ φ = U : in the first case, we took a fixed value of the voltage, for example, Δ φ = 4 V . It was shown in [13] that for a fixed voltage, self-oscillations arise in the system, the frequency of which depends on this jump. For example, with a voltage Δ φ = 4 V , the frequency of natural oscillations is 18.5 Hz. In the second step, we set a periodic change in the voltage with a 25% amplitude relative to the initial one, so that the oscillation frequency is almost equal to but slightly different from the natural frequency of self-oscillations. For example, for the case Δ φ = 4 V , we took the forcing oscillations 2 sin ( 10 t ) . Thus, the total voltage has the form Δ φ = 4 + 2 sin ( 10 t ) .

5. Results of the Implementation of the Mathematical Model (Computer Experiment)

The numerical solution is based on the finite element method and the splitting of the problem at each current layer in time into the hydrodynamic (Navier-Stokes equation) and electrochemical (Nernst-Planck-Poisson) parts with their sequential solution to complete convergence of the specified accuracy. This method was successfully applied to solve some problems of physical chemistry [7,33,38,39].
The method was implemented in the software developed by the authors, “1D modeling of an autowave process in a thin layer of a magnetic colloid (AutoWave01)” [40], created in the Comsol Multiphysics environment.
The convergence of the solution and the quality of the grid were checked by reducing the grid step by half, and the results coincided. The grid spacing decreased (the number of elements increased) until the calculation results stopped changing (the results coincided).
The parameters of the task were H = 5·10–5 m; the calculation was carried out for t [ 0 , 10 ] seconds with a memorization step of 0.01 s. The mesh parameters were n = 100,000 elements. In the calculations below, a certain initial distribution of the concentration of the magnetic parts corresponding to the experimental data is accepted:
C1 (0, x) = C2 (0, x) = 9 vol.%%
The volumetric concentration of magnetite particles expressed in mol/m3 is
C = 0.73593 10 3 mol / m 3
C 1 ( 0 , x ) = C 10 ( x ) = 0.0074 e x ( 0 / 01 H ) mol / m 3
C 2 ( 0 , x ) = C 20 ( x ) = 0.0074 e ( H x / ( 0 / 01 H ) mol / m 3
According to these initial conditions, initially, the particles were distributed near the electrodes quite densely, that is, the liquid membrane had already formed. The results of a numerical analysis for two waves were obtained.
As a result of the implementation of the computer experiment, the graphs shown in Figure 8a,b were obtained.
Figure 8a shows that over time, the natural oscillations of the system (green color) became adjusted to the forcing ones (red color), i.e., process synchronization started after 5 s, because at the beginning, the process was established, and then it was captured by an external influence.
Let us calculate the frequency of natural oscillations of the system; since the period of natural oscillations of the system T = 0.34 s, then ω0 = 18.5 Hz is the frequency of natural oscillations of the system. Let us take the frequency of external oscillations less than two times, i.e., ωp = 9.25 Hz.
From the analysis (Figure 8a,b) of the AWP synchronization by an external periodic action with different parameters, for example, sin ( 10 t ) and sin ( 40 t ) , it can be seen that initially (up to 5 s), external periodic forcing oscillations practically did not affect the system. However, it is clearly seen that after 5 s (Figure 8a), the oscillations of the system became adjusted to the forcing ones with a frequency of external oscillations ωp = 10 Hz. If the driving oscillations had a frequency ωp = 40 Hz, then the adjustment of the system oscillations began a little later than 6 s (Figure 8b).

6. Conclusions

  • The action of an external periodic force on an autowave in a ferrocolloid led to a change in the frequency of observed autowaves. If the frequency detuning was small, then the natural frequency of the autowaves ω0 became equal to the frequency of the external force ωp or proportional to it.
  • The periodic application of electrical force transformed spiral waves. Since the reverberator rotated at a variable speed, the frequency of its rotation was modulated.
  • A sequence of frequency-blocked modes was observed by changing the frequency of external periodic exposure. The structures obtained experimentally in a cell with a ferrocolloid under the action of an external periodic force are similar to those described in [24], where the same structures were observed by the authors in a quasi-two-dimensional reaction-diffusion system with a light-sensitive Belousov-Zhabotinsky reaction. This result is convincing evidence that the phenomenon of synchronization when pairing the internal oscillatory dynamics with an external periodic action can arise in a variety of chemical, biological, and other systems [41,42,43,44,45,46].
  • A mathematical model of the synchronization of self-oscillations was developed as a boundary value problem for a nonlinear system of partial differential equations, and a numerical solution was obtained. The frequency capture of autowaves by an external periodic force was confirmed in a computer experiment, which shows the adequacy of the developed model. Mathematical modeling of autowave synchronization confirmed the fact that a complex of coupled nonlinear oscillators can exhibit spatial reorganization under the influence of an external periodic action.

Author Contributions

Conceptualization and methodology, V.C. and A.K.; software and writing—original draft preparation, V.C. and A.K.; resources and data curation, N.K. All authors have read and agreed to the published version of the manuscript.

Funding

This research received no external funding.

Institutional Review Board Statement

Not applicable.

Informed Consent Statement

Not applicable.

Data Availability Statement

Not applicable.

Acknowledgments

This research was carried out within the framework of the work of the International Laboratory “Computer and mathematical modeling of nonlinear processes”.

Conflicts of Interest

The authors declare no conflict of interest.

References

  1. Dikansky, Y.I.; Ispiryan, A.G.; Arefyev, I.M.; Kunikin, S.A. Effective fields in magnetic colloids and features of their magnetization kinetics. Eur. Phys. J. E 2021, 44, 2. [Google Scholar] [CrossRef] [PubMed]
  2. Dikansky, Y.I.; Bedzhanyan, M.A.; Kolesnikova, A.A.; Gora, A.Y.; Chernyshev, A.V. Dynamic Effects in a Magnetic Fluid with Microdrops of Concentrated Phase in a Rotating Magnetic Field. Tech. Phys. 2019, 64, 337–341. [Google Scholar] [CrossRef]
  3. Ryapolov, P.A.; Sokolov, E.A.; Postnikov, E.B. Behavior of a gas bubble separating from a cavity formed in magnetic fluid in an inhomogeneous magnetic field. J. Magn. Magn. Mater. 2022, 549, 169067. [Google Scholar] [CrossRef]
  4. Bashtovoi, V.G.; Reks, A.G.; Motsar, A.A. On shapes and stability of the magnetic fluid surface in uniform magnetic field. Magnetohydrodynamics 2019, 55, 271–277. [Google Scholar] [CrossRef]
  5. Pelevina, D.A.; Sharova, O.A.; Merkulov, D.I.; Turkov, V.; Naletova, V. Spherical magnetizable body partially immersed in a magnetic fluid in a uniform magnetic field. J. Magn. Magn. Mater. 2022, 494, 165751. [Google Scholar] [CrossRef]
  6. Rosensweig, R.E. Ferrohydrodynamics; Cambrige University Press: Cambridge, UK, 1985; p. 344. [Google Scholar]
  7. Nechifor, A.; Stoian, M.; Voicu, Ş.I.; Nechifor, G. Modified Fe3O4 colloidal dispersed magnetic particles as carrier in liquid membranes. Optoelectron. Adv. Mater. Rapid Commun. 2010, 4, 1118–1123. [Google Scholar]
  8. Chekanov, V.V.; Kandaurova, N.V.; Chekanov, V.S. Calculation of the membrane thickness of magnetite nanoparticles on the surface of the transparent conductive electrode in the electric field. J. Nano-Electron. Phys. 2015, 7, 04041. [Google Scholar]
  9. Pérez, A.D.; Van der Bruggen, B.; Fontalvo, J. Modeling of a liquid membrane in Taylor flow integrated with lactic acid fermentation. Chem. Eng. Proc. 2019, 144, 107643. [Google Scholar] [CrossRef]
  10. Chekanov, V.V.; Kovalenko, A.V. Experimental and Theoretical Study of an Autowave Process in a Magnetic Fluid. Int. J. Mol. Sci. 2022, 23, 1642. [Google Scholar] [CrossRef]
  11. Ivanov, A.O.; Zubarev, A. Chain formation and phase separation in ferrofluids: The influence on viscous properties. Materials 2020, 13, 3956. [Google Scholar] [CrossRef]
  12. Chekanov, V.S.; Kirillova, E.V.; Kovalenko, A.V.; Diskaeva, E.N. Experimental study and mathematical modelling of self-oscillation at the electrode-magnetic fluid interface in an electric field. Cond. Mat. Int. 2021, 23, 626–636. [Google Scholar] [CrossRef]
  13. Chekanov, V.V.; Kandaurova, N.V.; Chekanov, V.S. Phase autowaves in the near-electrode layer in the electrochemical cell with a magnetic fluid. J. Magn. Magn. Mater. 2017, 431, 38–41. [Google Scholar] [CrossRef]
  14. Mallphanov, I.L.; Vanag, V.K. Chemical micro-oscillators based on the Belousov-Zhabotinsky reaction. Rus. Chem. Rev. 2021, 90, 1263–1286. [Google Scholar] [CrossRef]
  15. Kudryashova, N.; Nizamieva, A.; Tsvelaya, V.; Panfilov, A.V.; Agladze, K.I. Self-organization of conducting pathways explains electrical wave propa-gation in cardiac tissues with high fraction of nonconducting cells. PLoS Comput. Biol. 2019, 15, e1006597. [Google Scholar] [CrossRef] [Green Version]
  16. Davydov, V.A.; Davydov, N.V. The propagation of autowaves in capillaries filled with a moving viscous excitable medium. Biophysics 2015, 60, 269–273. [Google Scholar] [CrossRef]
  17. Sidorova, A.E.; Malyshko, E.V.; Tverdislov, V.A.; Levashova, N.T. Autowave Self-Organization in the Folding of Proteins. Mosc. Univ. Phys. Bull. 2019, 74, 213–226. [Google Scholar] [CrossRef]
  18. Kozhevnikov, V.M.; Chuenkova, I.; Danilov, M.I.; Yastrebov, S.S. Voltage self-sustained oscillation and phase separation dynamics in a thin layer of a weakly conducting ferromagnetic liquid with periodically emerging electrohydrodynamic flows. Tech. Phys. 2008, 53, 192–198. [Google Scholar] [CrossRef]
  19. Kozhevnikov, V.M.; Chuenkova, I.Y.; Danilov, M.I.; Yastrebov, S.S. Dynamics of self-organization in a thin layer of a magnetic fluid placed in a constant electric field. Tech. Phys. 2006, 51, 946–948. [Google Scholar] [CrossRef]
  20. Pikovsky, A.S.; Rosenblum, M.G.; Kurts, Y. Synchronization: A Universal Concept in Nonlinear Sciences; Cambridge University Press: New York, NY, USA, 2003; p. 396. [Google Scholar]
  21. Landa, P.S. Nonlinear Vibrations and Waves in Dynamical Systems; (MAIA book series); Springer: Berlin/Heidelberg, Germany, 1996; p. 533. [Google Scholar]
  22. Awrajcewicz, J. Deterministic Vibrations of Discrete Systems; WNT: Warsaw, Poland, 1996. [Google Scholar]
  23. Awrajcewicz, J.; Krysko, W.A. Vibrations of Continuous Systems; WNT: Warsaw, Poland, 2000. [Google Scholar]
  24. Petrov, V.; Ouyang, Q.; Swinney, H.L. Resonant pattern formation in a chemical system. Nature 1997, 388, 655–657. [Google Scholar] [CrossRef]
  25. Chekanov, V.V.; Kandaurova, N.V.; Chekanov, V.S.; Romantsev, V.V. The use of electrically controlled interference in an electrically tunable light filter and for observing the autowave process in the near-electrode layer of a magnetic fluid. Opt. J. 2019, 86, 21–26. [Google Scholar]
  26. Wood, C.J.; Camley, R.E. Synchronization of oscillators arising from second-order, and higher, nonlinear couplings. Nonlinear Dyn. 2022, 108, 597–611. [Google Scholar] [CrossRef]
  27. Zhu, Y.; Zhou, S.; Gao, D.; Liu, Q. Synchronization of Non-linear Oscillators for Neurobiologically Inspired Control on a Bionic Parallel Waist of Legged Robot. Front. Neurorobotics 2019, 13, 59. [Google Scholar] [CrossRef] [Green Version]
  28. Robson, V.; Martins, W.S.; Barreiro, S.; de Oliveira, R.A.; Chevrollier, M.; Oriá, M. Synchronization of a nonlinear oscillator with a sum signal from equivalent oscillators. Chaos Solitons Fractals 2021, 153, 111581. [Google Scholar]
  29. Shima, S.; Kuramoto, Y. Rotating spiral waves with phase-randomized core in nonlocally coupled oscillators. Phys. Rev. E 2004, 69, 036213. [Google Scholar] [CrossRef] [PubMed]
  30. Shima, S.; Kuramoto, Y.; Battogtokh, D.; Shiogai, Y. Mean-field theory revives in self-oscillatory fields with non-local coupling. Prog. Theor. Phys. Suppl. 2006, 161, 127–143. [Google Scholar]
  31. Chekanov, V.V.; Kandaurova, N.V.; Chekanov, V.S.; Shevchenko, M.Y.; Mirzahanov, S.R. Mathematical modeling of autowave processes in a cell with nanostructured liquid. J. Math. Sci. 2021, 259, 341–348. [Google Scholar] [CrossRef]
  32. Bennett, C.H.; Grinsten, G.; He, Y.; Jayaprakash, C.; Mukamel, D. Stability of temporally periodic states of classical many-body system. Phys. Rev. A 1990, 41, 1932–1935. [Google Scholar] [CrossRef]
  33. Chekanov, V.S.; Kovalenko, A.V.; Diskaeva, E.N.; Kirillova, E.V. Mathematical modeling of an autowave process in a thin layer of a magnetic colloid. Ecol. Bull. Sci. Cent. Black Sea Econ. Coop. 2020, 17, 57–67. [Google Scholar] [CrossRef]
  34. Urtenov, M.K.; Uzdenova, A.M.; Kovalenko, A.V.; Nikonenko, V.V.; Pismenskaya, N.D.; Vasil’eva, V.I.; Sistat, P.; Pourcelly, G. Basic mathematical model of overlimiting transfer enhanced by electroconvection in flow-through electrodialysis membrane cells. J. Membr. Sci. 2013, 447, 495–520. [Google Scholar] [CrossRef]
  35. Nikonenko, V.V.; Vasil’eva, V.I.; Akberova, E.M.; Uzdenova, A.M.; Urtenov, M.K.; Kovalenko, A.V.; Pismenskaya, N.P.; Mareev, S.A.; Pourcelly, G. Competition between diffusion and electroconvection at an ion-selective surface in intensive current regimes. Adv. Colloid Interface Sci. 2016, 235, 233–246. [Google Scholar] [CrossRef]
  36. Gudza, V.A.; Pismenskiy, A.V.; Urtenov, M.K.; Shkorkina, I.V.; Chubyr, N.O.; Kovalenko, A.V. The influence of water dissociation/recombination on transport of binary salt in diffusion layer near ion exchange membrane. J. Adv. Res. Dyn. Control Syst. 2020, 12, 923–935. [Google Scholar] [CrossRef]
  37. Kovalenko, A.V.; Yzdenova, A.M.; Sukhinov, A.I.; Chubyr, N.O.; Urtenov, M.K. Simulation of galvanic dynamic mode in membrane hydrocleaning systems taking into account space charge. DTS Electron. Ed. 2019, 2188, 050021. [Google Scholar] [CrossRef]
  38. Nikonenko, V.; Kovalenko, A.; Urtenov, M.; Pismenskaya, N.; Han, J.; Sistat, P.; Pourcelly, G. Desalination at overlimiting currents: State-of-the-art and perspectives. Desalination 2014, 342, 85–106. [Google Scholar] [CrossRef]
  39. Kovalenko, A.V.; Wessling, M.; Nikonenko, V.V.; Mareev, S.A.; Moroz, I.A.; Evdochenko, E.; Urtenov, M.K. Space-Charge breakdown phenomenon and spatio-temporal ion concentration and fluid flow patterns in overlimiting current electrodialysis. J. Mol. Sci. 2014, 636, 119583. [Google Scholar] [CrossRef]
  40. Kovalenko, A.V.; Chekanov, V.S.; Urtenov, M.K.; Grishchenko, V.I. 1D Modeling of an Autowave Process in a Thin Layer of a Magnetic Colloid (AUTOWAVE01). Patent No. 2022661478, 2 July 2022. [Google Scholar]
  41. Petrov, V.; Hagberg, A.; Meron, E. Complex pattern in reaction-diffusion systems: A tale of two front instabilities. Chaos 1994, 4, 477–484. [Google Scholar]
  42. Walgraef, D. Spatio-Temporal Pattern Formation; Springer: New York, NY, USA, 1997. [Google Scholar]
  43. Rudzick, O.; Mikhailov, A.S. Trapping of Phase Fronts and Twisted Spirals in Periodically Forced Oscillatory Media; World Scientific Publishing: Hackensack, NJ, USA, 2007; pp. 213–224. [Google Scholar]
  44. Zhan, M.; Wang, X.; Gong, X.; Lai, C.-H. Phase synchronization of a pair of spiral waves. Phys. Rev. E Stat. Nonlinear Soft Matter Phys. 2005, 71, 036212. [Google Scholar] [CrossRef]
  45. Parlitz, U.; Schlemmer, A.; Luther, S. Synchronization patterns in transient spiral wave dynamics. Phys. Rev. E Stat. Nonlinear Soft Matter Phys. 2011, 83, 057201. [Google Scholar] [CrossRef]
  46. Sukkoo, J.; Watkins, B.; Delong, L.; Ketterson, J.; Chandrasekhar, V. Ferromagnetic resonance in periodic particle arrays. Phys. Rev. B 2001, 66, 13. [Google Scholar] [CrossRef]
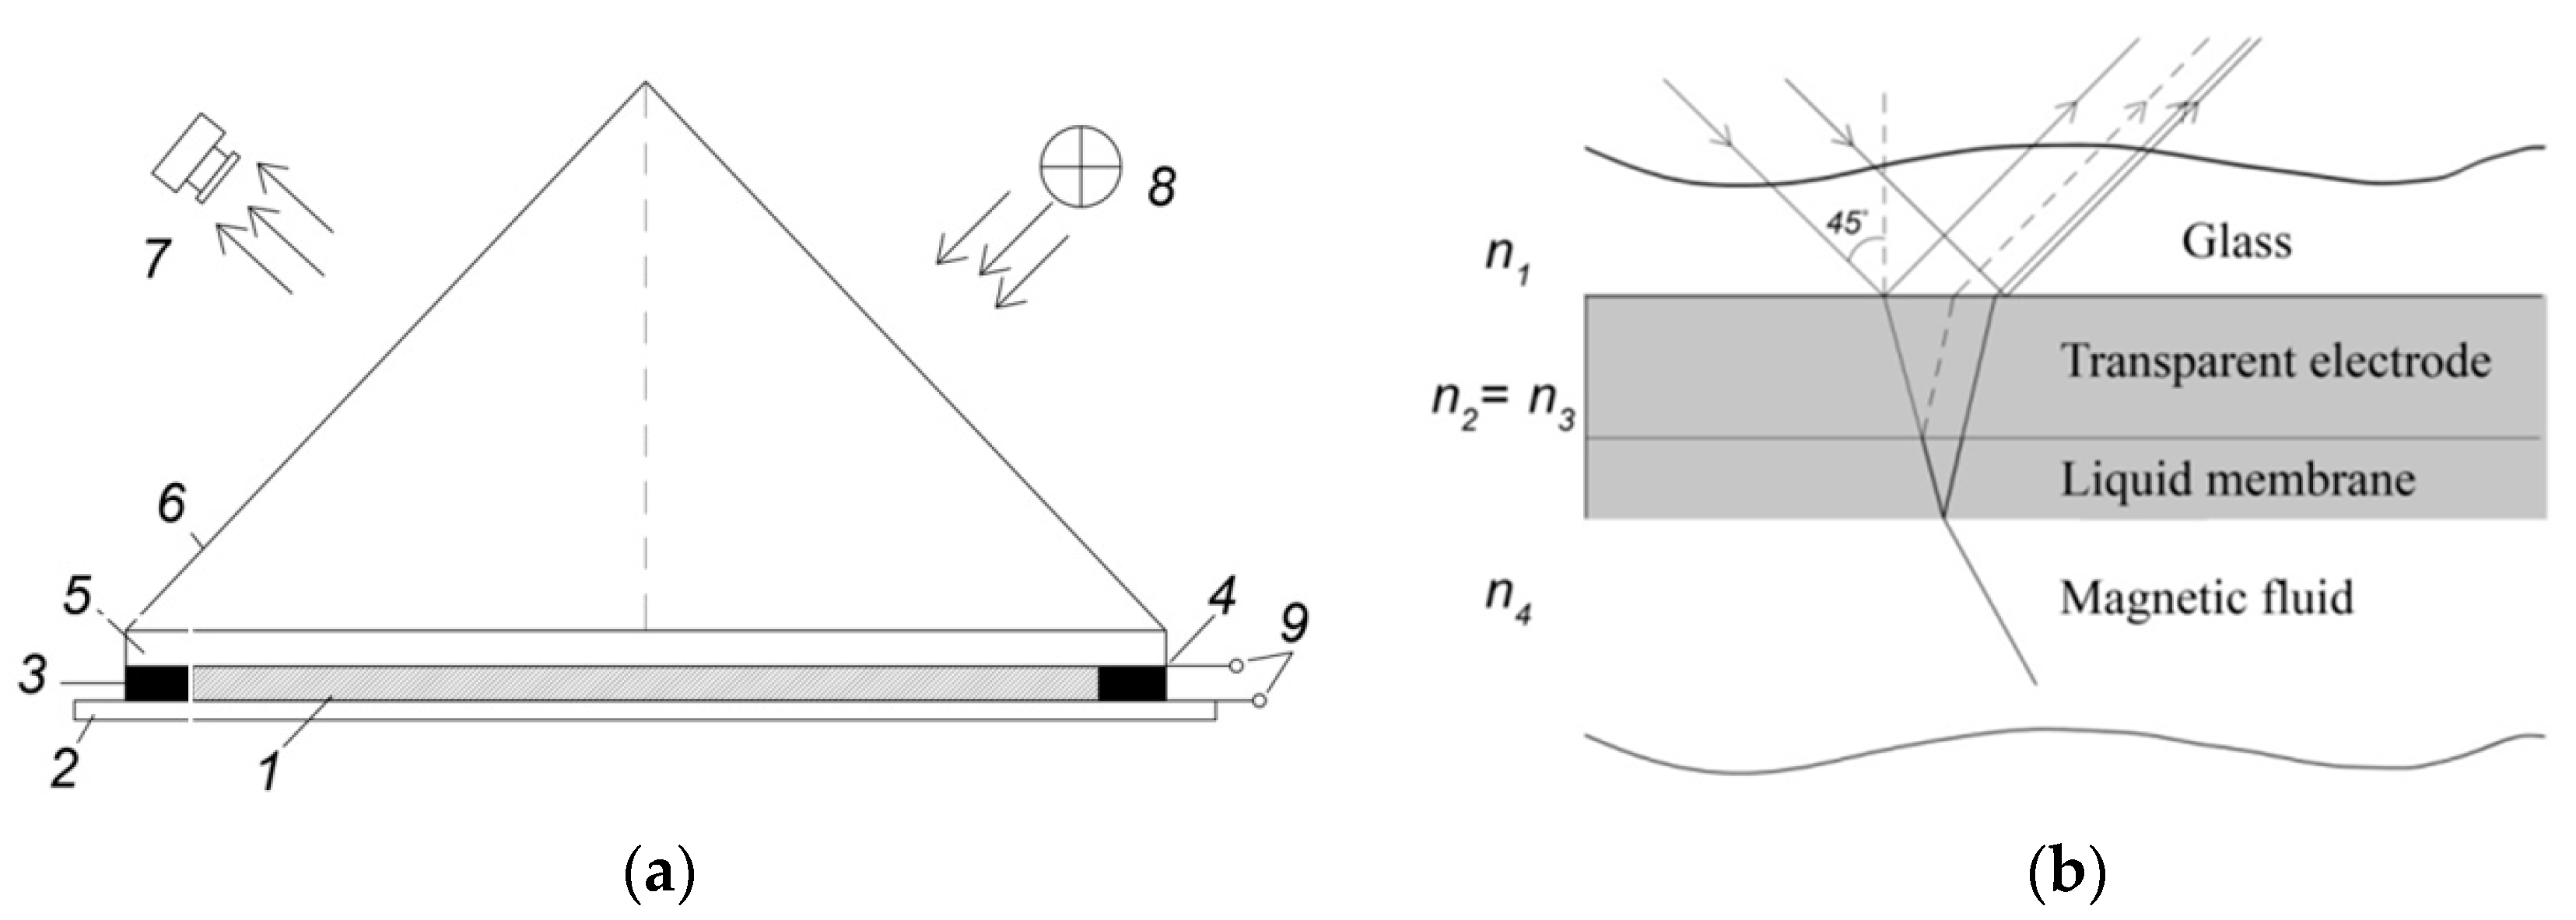
Figure 1. (a) Schematic of an experimental device: 1—ferrocolloid; 2 and 5—ITO-covered glass; 3 and 4—polystyrene insulating gaskets; 6—rectangular isosceles prism; 7—camera; 8—light source; 9—electrodes. (b) Multilayer structure: glass–transparent electrode-liquid membrane-ferrocolloid. The light path is shown by arrows.
Coatings 12 01901 g001
Figure 2. Experimental setup for determining the frequency of fluctuations in the concentration of particles in a liquid membrane. 1—ferrocolloid; 2—a plate of foil getinax; 3 and 11—insulating gaskets; 4—ITO-covered glass; 5—rectangular isosceles prism; 6—diaphragm; 7 and 10—Polaroid camera; 8—photodiode; 9—laser; 12—electrodes.
Coatings 12 01901 g002
Figure 3. Plotted graph based on the oscillogram obtained by the GDS-71022 oscilloscope. Dependence of the reflection coefficient of the cell surface on time (optical response) during self-oscillations of the particle concentration in the liquid membrane. Beam 1—current passing through the cell; beam 2—periodic change in the intensity of reflected light (optical response).
Coatings 12 01901 g003
Figure 4. Illustration of various frequency-blocked modes of the AWP in a cell under the influence of a periodic electric force (pulse voltage). Frequency ratios: (a) 0, (b) 1:1, (c) 1:2, (d) 1:2.5, and (e) 1:3. The exposure times in the upper and lower rows differ by half of a period.
Coatings 12 01901 g004
Figure 5. Plotted graph based on the oscillogram obtained by the GDS-71022 oscilloscope. Forced synchronization of fluctuations in the concentration of the dispersed phase of the ferrocolloid. Beam 1—optical signal: time dependence of the intensity of reflected light; beam 2—pulse voltage U = 2.5 V, frequency ωp = 1.35 Hz.
Coatings 12 01901 g005
Figure 6. Modulation of the reverberator rotation frequency under the influence of a periodic external force: (a) autowave process without external periodic influence and (b,c) rotation of the reverberator under additional external periodic action.
Coatings 12 01901 g006
Figure 7. Scheme of a 3D cell with a magnetic fluid (electrodes are highlighted in color) with research areas in the form of a rectangular parallelepiped.
Coatings 12 01901 g007
Figure 8. (a) Periodic change in the total concentration (self-oscillations) on the cathode surface at a potential jump of 4 V (purple), the same self-oscillations with forcing oscillations Δ φ = 4 + sin ( 10 t ) (green) and periodic forcing oscillations 0.01 sin ( 10 t ) (red). (b) Periodic change in the total concentration (self-oscillations) on the surface of the cathode with the potential jump of 4 V (purple), as well as the same oscillations with force fluctuations Δ φ = 4 + sin ( 40 t ) (yellow) and periodic forcing vibrations 0.01 sin ( 40 t ) (pink).
Coatings 12 01901 g008
Publisher’s Note: MDPI stays neutral with regard to jurisdictional claims in published maps and institutional affiliations.