Article

Recycling of Glass Waste by Deposition of TiO2 for the Intensification of the Photocatalytic Effect in the Purification of Wastewater

1
Department of Chemical and Biochemical Engineering, Faculty of Chemical Engineering and Biotechnologies, University Politehnica of Bucharest, 1-7 G. Polizu, 011061 Bucharest, Romania
2
Department of Science and Engineering of Oxide Materials and Nanomaterials, Faculty of Chemical Engineering and Biotechnologies, University Politehnica of Bucharest, 1–7 G. Polizu, 011061 Bucharest, Romania
3
Department of Analytical Chemistry and Environmental Engineering, Faculty of Chemical Engineering and Biotechnologies, University Politehnica of Bucharest, 1–7 G. Polizu, 011061 Bucharest, Romania
*
Author to whom correspondence should be addressed.
Coatings 2022, 12(11), 1794; https://doi.org/10.3390/coatings12111794
Submission received: 26 October 2022 / Revised: 9 November 2022 / Accepted: 16 November 2022 / Published: 21 November 2022
(This article belongs to the Special Issue Recent Advances in Antibacterial Composite Coatings)

Abstract

:
In this study, the photocatalytic effect of TiO2 (1 wt. % and 3 wt. %) deposited on the surface of sintered cathode ray tube glass was examined, as well as its effect on an E. coli strain (BL21(DE3)). DTA analysis indicated the sintering temperature for samples to be 820 °C while scanning electron microscopy (SEM)showed an intimate contact and a strong interface between the support and photocatalyst. Near-ambient pressure X-ray photoelectron spectroscopy (NAP-XPS) was employed to establish the chemical and bonding environment of the samples. The investigations of the bacterial viability were conducted using flow cytometry, a specific cellular viability assay, while bacterial growth was measured using the turbidimetric method. The experimental results show the influence of the TiO2 concentration on the bacterial inactivation process: higher concentrations (3% wt.) have a bactericidal effect in the long term, whereas lower concentrations (1% wt.) render them inactive for a shorter time in the exponential growth stage. The preliminary results were used to calculate the efficiency of microbial inactivation and the parameters of the kinetics of inactivation using ANOVA software. The results indicate that this material could be an effective solution for water disinfection.

Graphical Abstract

1. Introduction

Numerous studies have aimed to identify less costly depollution techniques for water treatment, both from the energy and efficiency points of view [1,2].
In the last decade, there have been various studies on the chlorine and UV disinfection of wastewater containing antibiotics [3], UV radiation simulating the sun’s irradiative action [4], or the use of photocatalytic substances as suspended particles or thin films [5,6,7]; innovative strategies are needed to develop new methods for the effective control of bacterial infections in water [6,8,9].
Photocatalytic disinfection, as a method of water treatment, has attracted extensive attention during the last few decades, and now it can be a large-scale alternative to conventional water treatment technologies [10,11,12,13]. Studies on the activity of several photocatalysts used in water purification have been conducted using metal oxides (ZnO, Fe2O3, CdO, SnO2, ZrO2, V2O5, and TiO2) and metal sulfides (ZnS, CdS) [14,15].
Analyzing the photochemical potential, chemical and photochemical stabilities, availability, non-toxicity, and cost, it was found in recent years that the most suitable photocatalyst for water purification is titanium dioxide (TiO2), as anatase, which possesses an appropriate energy band structure [7,12,16,17,18,19].
Escherichia coli is one of the most widely used biological expression systems for experimental research because it is easy to cultivate and has a short cell life cycle. The cellular components of microorganisms are composed of organic complex substances, and exposure to reactive oxygen species, e.g., O2 and HO generated through photocatalysis, can lead to oxidative damage on their cell membranes [20,21,22,23,24], DNA and RNA [25,26,27].
Thus, the use of advanced oxidative technologies based on photocatalytic processes continues to be a research subject of interest, considering the change in the intensity of solar UV radiation in the context of increasing urban pollution [28,29,30].
Soda-lime and borosilicate glasses, either as bulk or cylinder support for the photocatalyst [31], have been used in the last few decades due to their chemical stability, their ability to provide, through sintering, a porous surface for the catalyst [32] to bind to for over 4000 h (5 months) of continuous operation [33] or due to their surface wettability, which can enhance the activity of the photocatalyst [34].
Consequently, the use of cathode ray tube (CRT) glass wastes, generated by the recycling of the old-generation TV-sets and computer monitors [35], as a sintered low-cost support for the deposition of photocatalytic substances, represents a new subject of research, one that has not yet been covered in the literature on TiO2, in terms of reusing this valuable waste as a substrate, as well as its ability to not interfere with the photocatalytic effect of TiO2 on microorganisms.
Generally, TiO2 is deposited as thin film from precursors, such as titanium oxysulfate [36], or is obtained through a sol-gel route [37]. This research experimentally investigates the dynamics of a bacterial population of Escherichia coli using the photocatalytic effect of a TiO2 layer, deposited as oxide in an aqueous solution on the sintered CRT glass samples, excited by UV radiation.

2. Materials and Methods

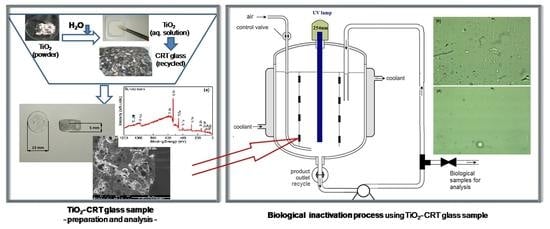
2.1. TiO2 Covered CRT Glass Samples

CRT glass waste was used as raw material due to its low cost (its price is almost null); energy saving qualities (the glass is already made, and its sintering requires a lower temperature than melting it does); and to green the environment through waste reuse while contributing to the sustainable development of society.
The chemical composition of CRT waste is specific for the distinct parts of the CRT tube: the silicate glass from the front panel has a high sodium oxide (Na2O) content, while the glass from the cone has lower sodium oxide content and a significant percentage of lead oxide (PbO). The final powder was made from a 1:1 mixture of shards from the front panel and cone. Table 1 presents the CRT waste’s composition, obtained through chemical analysis, for the distinct parts of it.
CRT glass waste was cleaned of other residues, washed, and dry-milled to a specific surface between 3500 and 4200 cm2/g. Then, a few drops of polyvinyl alcohol were added to maintain the integrity of the samples after pressing. The mixture was introduced in a mold and uniaxially pressed at 50 MPa. TiO2 as anatase (Sigma-Aldrich—particle size less than 25 nm, 99.7% purity, Saint Louis, MO, USA), in 1% and 3% by mass of the glass sample, was deposited from aqueous solution onto the surfaces of the pressed samples to enhance the photocatalytic effect.
The samples with TiO2 on the surface were fast-sintered, based on previous experience [38], at 820° C for 15 mins, using a heating rate of 10 °C/min to produce the strongest interface between the sintered CRT glass and the deposited TiO2 layer. The value of the optimum temperature was obtained via DTA analysis (NETZSCH STA 449 F3 Jupiter) in air and with a heating rate of 10° C/min. A HITACHI S2600N high-resolution scanning electron microscope (SEM, Tokyo, Japan) with an EDS probe was used in the interface’s analysis. Near-ambient pressure X-ray photoelectron spectroscopy (NAP-XPS, SPECS, Berlin, Germany) is a less traditional form of XPS that allows samples to be analyzed at relatively high pressures, i.e., greater than 2500 Pa. With NAP-XPS, XPS can probe polymeric materials, biological samples, coatings, and porous materials. A SPECS EnviroESCA NAP-XPS with monochromatic Aluminum Kα excitation ( = 1486.7 eV) was used to identify the elements on the surface of the samples.

2.2. The Experimental Set-Up

The experiment simulated the photocatalytic action of TiO2 on microorganisms present in sewage water. For this purpose, in a bioreactor, with a working volume of 1.5 L, provided with a fluorescent lamp (254 nm, 50 W) with a 15 mm range of action in the growing medium, a medium simulating the composition of urban sewage was introduced. Since it presented a large amount of water (99%) and only 1% suspended solids, the aim was to reduce the microbial load, possibly pathogenic, to use these waters in irrigation. Thus, in an environment of tap water with a source of carbon and nitrogen, an E. coli strain (BL21(DE3) a strain resistant to antibiotics) from the Culture Collection of the Bioreactors Laboratory from the University “Politehnica” of Bucharest was inoculated, with the total amount of added substances being 1% and the optical density (OD) of inoculum having the value of 1.987 at 600 nm wavelength.
Bacterial inoculum was grown successively in 100 ml Erlenmeyer flasks with a mean volume/vial of 1–5 with a 10% (v/v) inoculum concentration at the beginning of the bacterial exponential growth phase, at pH = 7 in a Grand Bio ES- 80 (37 °C, 200 rpm) orbital shaker incubator. The cultivation media were Luria-Bertani with standard composition (10 g/L Tryptone, 5 g/L yeast extract, 5 g/L NaCl) - LB Broth (Lennox) (Sigma-Aldrich). All equipment and liquid solutions used in the experiments were autoclaved at 121 °C, for 20 min (RAYPA AES-75).
The energy flux radiated by the UV lamp inside the cultivation medium was thermodynamically balanced by the cooling agent in the reactor sheath, which maintained an optimal growth temperature (35–40 °C). The UV lamp was put into operation after one hour after the inoculation to allow the microorganisms to pass the lag phase of the cell growth, as determined by the cultivation volume stress. In addition, to stimulate microbial growth, the reactor was provided with a constant airflow rate of 2 cc/min, sterilized inline using a Millipore filter.
The cultivation medium was recycled using a peristaltic pump (Labortechnik PA-ST1, IKA, Staufen, Germany) and a sampling connection was mounted on the recirculation route, as indicated in Figure 1.
The samples of glass covered with TiO2 were distributed vertically in the bioreactor, their total surface area directly exposed to the UV light being 9 cm2.
The experimental matrix used to design the experiment was as follows:
Control sampleCultivation of the bacterial strain in the photoreactor (under the conditions described above) under UV and without photocatalytic material
Experiment 1Cultivation of the bacterial strain under UV and in the presence of photocatalytic material (3 wt. % TiO2)
Experiment 2Cultivation of the bacterial strain under UV and in the presence of photocatalytic material (1 wt. % TiO2)

2.3. Instrumental Analysis

The optical density of the cell culture was determined using a spectrophotometer (uniSPEC 4 UV/VIS-LLG, Lab Logistics Group GmbH, Meckenheim, Germany) with software that provides full spectrophotometer control on a computer using the built-in USB port. Absorbance was read in-line at 600 nm wavelength at 30 min intervals.
The accurate estimates of cell number and cell viability during cultivation were measured using a flow-cytometry technique (Apogee Flow System). To assess total number of cells and cell viability, samples were taken from the bioreactor simultaneously with those for optical density determination. The total number of cells was estimated directly using a flow cytometer. An alternative staining and sample analysis procedure was used for cell viability. Samples collected from the bioreactor (250 μL) were treated with 2.5 μL propidium iodide (PI) 10× and 2.5 μL of SYBR Green (Life Technology) to distinguish the viable cells (whose membrane is permeable only for SYBR Green) and dead ones (whose cell membrane is not intact and allows both dyes to bind to the DNA of the bacterium). For intact membrane cells, since SYBR Green emits both the red and green fluorescence spectra, the bacterial population will be positioned diagonally on the cytogram with the green-red fluorescence emission axis. With damaged membrane cells, when PI also penetrates the cells, the two dyes will interact because of the resonance phenomenon of fluorescence. In practice, emissions from the green fluorescence spectrum of "dead" cells will be “neutralized” by the presence of PI because these cells emit a stronger fluorescence signal. To determine the accuracy of the total cell counts, an uncolored sample was used as a control. Samples were processed in-line (for total cell counts) and off-line (at about 5 h after sampling) to determine cell viability. For the off-line samples, the cells were suspended in a neutral buffer (SPB—Sorensen’s Phosphate Buffer).
The imagistic study was conducted using the Motic B + series optical microscope provided with a Moticam 5.0 digital camera.

3. Results and Discussions

3.1. Thermal and Microstructural Characterization of CRT Waste

Figure 2 presents a thermal analysis of the CRT waste, performed to determine the sintering temperature of the glass, which occurs at the lowest point on the DTA curve, where the highest endothermic reaction is recorded in the sample. In this case, the temperature of 820 °C was chosen as the sintering temperature for our samples. The exothermic peak at around 200 °C accounted for the decomposition of the polyvinyl alcohol, while the endothermic peak that occurred at 600 °C is attributable to the glass transition.
In Figure 3 we present the SEM micrographs for 1% and 3% TiO2 covered samples after thermal treatment at 820 °C.
The images demonstrate that the glass is sintered, having a sponge-like structure with large and closed pores. The coated layer of TiO2 has a uniform thickness of about 150 μm and contains some gaseous inclusions. The interface between TiO2 and the glass support is difficult to distinguish, indicating that an intimate contact and a strong interface formed. The oxide layer was well combined with the substrate, and no cracks were observed at the interface. During thermal oxidation treatment, a thick oxide layer forms on the surface due to the increased adsorption, diffusion, and reaction rate of oxygen.

3.2. NAP-XPS Analysis

The near ambient pressure XPS measurements were taken to determine the chemical and bonding environment of the samples. Survey spectra, presented in Figure 4, were measured at 1 mbar of argon to compensate for sample charging. The binding energy scale was corrected using the Ti 2p peak of TiO2 at 458.8 eV.
The survey spectrum of the samples shows a nitrogen signal around 405 eV from the residual nitrogen gas used for charge compensation. The C 1s peak is present at 285.3 eV attributable to hydrocarbons (CC/CH) present on the surface. XPS signals of Ti 2p were noted at binding energies around 458.5 eV for Ti 2p3/2 and 464.3 eV for Ti 2p1/2, in good agreement with standard TiO2 [39]. The FWHM of the Ti 2p3/2 peak is smaller than that of the 2p1/2 peak, due to the Coster-Kronig effect. For samples with 1% TiO2, O 1s can be fitted with two peaks at 532 eV and 529.7 eV, while for the samples with 3% TiO2 O 1s, the peaks are at 529.7 eV and 528 eV. The peaks located at 529.7 eV and 532 eV correspond to the O 1s binding energy for TiO2, while the peak at 532 eV is attributed to H–O from the chemisorbed water on the surface, which further contributes to the photocatalytic activity [40]. Si 2p (103 eV) and Si 2s (155 eV) peaks are due to SiO2 from the CRT glass substrate.

3.3. Microbial Dynamics

The spectrophotometric analysis (at OD 600 nm), which shows the microbial growth assimilated with the increase in the turbidity of the cultivation media, reveals the evolution of bacterial growth in the three situations described above in the experimental matrix. In Figure 5 we present the curves of bacterial evolution in the presence of UV rays, without the photocatalyst, and in the presence of the photocatalyst. We can see that, in the absence of TiO2, the UV effect upon the bacterial growth is significant within the first 120 mins from the beginning of cultivation, the subsequent evolution being stationary, slightly increased, due to the floating capacity of the inactivated microorganisms and cellular debris.
According to the spectrophotometric analysis, we found that, in the presence of TiO2, the turbidity of the culture media disappears more rapidly (60 min for a 3% TiO2 concentration and 90 min for a 1% TiO2 concentration) due to the inactivation of microorganisms and the accumulation of cellular debris, which settles much faster. Therefore, the slope of the OD curve decreases faster for Experiments 1 and 2 than for the control sample.
Figure 6 summarizes the flow cytometry analysis, as presented in detail in Appendix A, to highlight the evolution, in time, of bacterial populations subjected to UV action for the control sample.
The results for the control sample reveal the presence of a long lag phase and a short exponential cell growth trend, which occurs in the first 100 mins, after which the effect of UV radiation on the concentration of the total number of cells decreases by 30%. The samples kept for viability testing demonstrated the reversible effect of UV action on cell development—the overall cells count variation curve-highlighting cell growth with lag and exponential growth phases but with a low slope (38%), compared with the normal growth of this strain [41].
Death cell count show a slight upward trend (in leaps, highlighting cell cycles), whereas the living cell concentration after the lag period shows a slight downward trend, which indicates reduced cell viability (1–4%).
The effect of UV radiation on the number of cells and their viability when, in the cultivation medium, the samples with 3% TiO2 were introduced is summarized in Figure 7.
Analyzing the resulting flow cytometric data for Experiment 1, it can be concluded that, at a concentration of 3% TiO2, the bactericidal effect is irreversible, and the efficiency effect of inactivation is consistent, considering the initial cells concentration before the UV radiation impact. Except for the first two points in the graph, which correspond to the growth duration without the UV rays induced by the laboratory lamp, the result for the total amount of cells and viability (living and dead cells) in-line and after 5 h indicates a conjugate bactericidal effect from the UV-TiO2 system.
To establish the minimal value of TiO2 concentration for cells inactivation, and the effects on cell number and cell viability, the TiO2 concentration used in Experiment 2 was dropped down to 1%. The results of the analysis of samples taken during the experiment and those processed after 5 h are summarized in Figure 8.
The presence of TiO2 at a lower concentration (1% wt.) shows also a stronger bacteriostatic action.
UV radiation and TiO2 in different concentrations act in the form of an irreversible loss of cell viability [42]. Considering the values at t = 0, after 1 h of culture in the absence of UV, one can see that the total cell concentration (in-line and off-line) takes a decreasing variation with a comparable slope. At a higher concentration of TiO2, the effect persists over time, with a deviation of 1%-8% from the control sample, whereas in the presence of a lower concentration of TiO2, although in-line, the inactivation effect is more pronounced, but the off-line cell viability slowly increases, being 30%–55% similar to the control sample. In Experiment 1, the concentration of affected cell membranes/deaths is 50% higher, having a steady-state level in the second half of the experiment, compared with the concentration in Experiment 2, where it shows a steadily decreasing trend. In Experiment 1, the live cell concentration after the activation of the photocatalytic material stood at very low concentrations (below 1000 cells/μL), whereas, in Experiment 2, the local cyclical growth trend of the live cell concentration can be observed, indicating a possible recovery of cell viability.
The microscopic images (40×) from Figure 9, taken in-line, in the liquid phase, revealed a decrease in the number of microorganisms and changes in cell morphological integrity.
It can be observed that after 240 min, the number of active cells (cylindrical forms with light emission) was reduced, both for Experiment 1 and 2, compared with the control sample. Non-specific forms with dark emission were obtained due to the destruction of the cell wall and modification of the plasmatic membrane, while the microscopic field was covered in the background with solid debris resulting from cell decomposition. The evolution of cellular behavior upon exposure to UV is in agreement with similar data from the literature [43,44].

3.4. Mathematical Calculus

The parameters were determined in triplicate, showing the standard deviation (SD) of the measurements reported to the mean of the experiments. All the experimental results are presented as mean ± SD. Data analysis was conducted with analysis of variance (ANOVA) and the Tukey test at a 5% probability level (p < 0.05) using SPSS software (Version 19.0, SPSS Inc., UPB, Bucharest, Romania).
The efficiency of the inactivation of microorganisms is
E = N 0 N N 0 · 100
where N is the number of cells at time t expressed as the concentration of colony-forming units (CFU/μL) and N0 is the initial number of cells at t = 0 min expressed as a concentration (CFU/μL).
According to Table 2, the efficiency of the UV in the presence of TiO2 steadily increases for the 3% TiO2 concentration, which explains the persistence of the bacteriostatic effect in time, while for 1% TiO2 the effect is noticeable in the exponential phase of growth, which confirms the lower cell concentration observed.

3.5. Kinetics of Inactivation

According to data from the literature [16], the equation describing microbial inactivation kinetics has the form
log N N 0 = k · t  
where k is the kinetic constant, min−1, and t is the duration of exposure of the microorganisms to the source of inactivation, min.
From the experimental data obtained, the kinetic constant, k, was determined for each of the three experimental sets, the obtained values being comparable to the literature data [16], as can be seen in Table 3.
The values obtained follow the observations made during the experimental research, i.e., the higher efficiency of inactivation at a lower concentration of TiO2, but with a reversible effect if the time of exposure is not long enough.

4. Conclusions

This study highlights the bacteriostatic effect of UV radiation on an E. coli strain, as well as the quasi-irreversible effect on cellular viability at different concentrations of TiO2 deposited on the surface of fast-sintered samples made from CRT glass as the photocatalytic material used to enhance the bacteriostatic effect of UV radiation. The DTA analysis led to the selection of a sintering temperature of 820 °C for 15 min, while scanning electron microscopy (SEM) showed an intimate contact and a strong interface between the support and photocatalyst. Near-ambient pressure X-ray photoelectron spectroscopy (NAP-XPS) was used to determine the chemical and bonding environment of the samples. A higher concentration of 3% TiO2 deposited on the functionalized material led to a clear bacterial cell inactivation. At low concentrations of TiO2 (1%) the inactivation of cell growth in the exponential phase was observed, which led to a drastic decrease in the number of viable cells over time.
The experimental results show that, if UV exposure is of short duration, it is necessary to use a higher concentration of TiO2 on the coated surface for a pronounced and irreversible bacteriostatic effect. If the UV exposure last longer, and reference is made to the possibility of using natural UV radiation, the TiO2 concentration can be lower in the photocatalytic coating layer covering the recycled CRT glass.

Author Contributions

Conceptualization, G.I and M.E.; methodology, G.I, M.E., A.M. and A.M.D.; software, G.I.; validation, A.M., G.I. and M.M.; formal analysis, G.I; investigation G.I., M.E., A.M.D. and M.M.; resources, M.E.; data curation, G.I.; writing—original draft preparation, G.I., M.E. and A.M.; writing—review and editing, M.E., A.M. and G.I.; visualization, G.I.; supervision, M.E.; project administration, M.E.; funding acquisition, M.E. All authors have read and agreed to the published version of the manuscript.

Funding

This research was funded by the University Politehnica of Bucharest through the Excellence Grant Program, grant number 66/2016.

Institutional Review Board Statement

Not applicable.

Informed Consent Statement

Not applicable.

Data Availability Statement

Data supporting the reported results can be obtained directly from the authors.

Acknowledgments

The authors would like to thank Roxana Trușcă for SEM investigations, and Paul Dietrich for NAP-XPS investigations.

Conflicts of Interest

The authors declare no conflict of interest. The funders had no role in the design of the study; in the collection, analyses, or interpretation of the data; in the writing of the manuscript; or in the decision to publish the results.

Appendix A

The flow cytometric analysis results for the initial and final samples are presented in Figure A1, Figure A2, Figure A3, Figure A4, Figure A5, Figure A6, Figure A7, Figure A8, Figure A9, Figure A10, Figure A11 and Figure A12 for the control sample, Experiment 1, and Experiment 2.
Figure A1. Cytogram of the control sample at t = 0 min in-line (total uncolored cell concentration—6211 cells/µL).
Coatings 12 01794 g0a1
Figure A2. Cytogram of the control sample at t = 0 min off-line: (a) total colored cell concentration (7532 cell/µL) and (b) viability of the cells (7395 cell/µL dead; alive—undetectable).
Coatings 12 01794 g0a2
Figure A3. Cytogram of the control sample at t = 240 min in-line (total uncolored cell concentration—5362 cell/µL).
Coatings 12 01794 g0a3
Figure A4. Cytogram of the control sample at t = 240 min off-line (a)—total colored cell concentration (10,591 cell/µL) and (b) viability of the cells (8235 cell/µL dead; 1568 cell/µL alive).
Coatings 12 01794 g0a4
Figure A5. Cytogram of Experiment 1 at t = 0 min in-line (total uncolored cell concentration—8303 cells/µL).
Coatings 12 01794 g0a5
Figure A6. Cytogram of Experiment 1 at t = 0 min off-line (a) total colored cell concentration (8183 cell/µL) and (b) viability of the cells (7052 cell/µL dead; 1002 cell/µL alive).
Coatings 12 01794 g0a6
Figure A7. Cytogram of Experiment 1 at t = 240 min in-line (total uncolored cell concentration—2046 cells/µL).
Coatings 12 01794 g0a7
Figure A8. Cytogram of Experiment 1 at t = 240 min off-line (a) total colored cells concentration (2401 cell/µL) and (b) viability of the cells (1969 cell/µL dead; 252 cell/µL alive).
Coatings 12 01794 g0a8
Figure A9. Cytogram of the Experiment 2 at t = 0 min in-line (total uncolored cell concentration—1635 cells/µL).
Coatings 12 01794 g0a9
Figure A10. Cytogram of Experiment 2 at t = 0 min off-line (a) total colored cell concentration (5498 cell/µL) and (b) viability of the cells (3591 cell/µL dead; 1197 cell/µL alive).
Coatings 12 01794 g0a10
Figure A11. Cytogram of Experiment 2 at t = 240 min in-line (total uncolored cell concentration—869 cells/µL).
Coatings 12 01794 g0a11
Figure A12. Cytogram of Experiment 2 at t = 240 min off-line (a) total colored cell concentration (1320 cell/µL) and (b) viability of the cells (1290 cell/µL dead; undetectable alive cells).
Coatings 12 01794 g0a12

References

  1. Skuras, D.; Tyllianakis, E. The perception of water related risks and the state of the water environment in the European Union. Water Res. 2018, 143, 198–208. [Google Scholar] [CrossRef] [PubMed]
  2. Wen, G.; Deng, X.; Wan, Q.; Xu, X.; Huang, T. Photoreactivation of fungal spores in water following UV disinfection and their control using UV-based advanced oxidation processes. Water Res. 2019, 148, 1–9. [Google Scholar] [CrossRef]
  3. Templeton, M.R.; Oddy, F.; Leung, W.; Rogers, M. Chlorine and UV disinfection of ampicillin-resistant and trimethoprim-resistant Escherichia coli. Can. J. Civ. Eng. 2009, 36, 889–894. [Google Scholar] [CrossRef]
  4. Santos, A.L.; Oliveira, V.; Baptista, I.; Henriques, I.; Gomes, N.C.M.; Almeida, A.; Correia, A.; Cunha, Â. Wavelength dependence of biological damage induced by UV radiation on bacteria. Arch. Microbiol. 2013, 195, 63–74. [Google Scholar] [CrossRef] [PubMed]
  5. Gemici, B.T.; Karel, F.B.; Karaer, F.; Koparal, A.S. Water disinfection with advanced methods: Successive and hybrid application of antibacterial column with silver, ultrasound and UV radiation. Appl. Ecol. Environ. Res. 2018, 16, 4667–4680. [Google Scholar] [CrossRef]
  6. Quang, D.V.; Sarawade, P.B.; Jeon, S.J.; Kim, S.H.; Kim, J.-K.; Chai, Y.G.; Kim, H.T. Effective water disinfection using silver nanoparticle containing silica beads. Appl. Surf. Sci. 2013, 266, 280–287. [Google Scholar] [CrossRef]
  7. Xu, N.; Cheng, X.; Wang, D.; Xu, X.; Huangfu, X.; Li, Z. Effects of Escherichia coli and phosphate on the transport of titanium dioxide nanoparticles in heterogeneous porous media. Water Res. 2018, 146, 264–274. [Google Scholar] [CrossRef]
  8. Oh, J.; Salcedo, D.E.; Medriano, C.A.; Kim, S. Comparison of different disinfection processes in the effective removal of antibiotic-resistant bacteria and genes. J. Environ. Sci. 2014, 26, 1238–1242. [Google Scholar] [CrossRef]
  9. Zazouli, M.A.; Yousefi, M.; Kor, Y.; Roohafzaee, M. Inactivation of Escherichia coli in Water by Combined Process of Silver Nanoparticle and Ultraviolet Radiation. Health Scope 2016, 6, e39102. [Google Scholar] [CrossRef]
  10. Alrousan, D.M.A.; Dunlop, P.S.M.; McMurray, T.A.; Byrne, J.A. Photocatalytic inactivation of E. coli in surface water using immobilised nanoparticle TiO2 films. Water Res. 2009, 43, 47–54. [Google Scholar] [CrossRef]
  11. Ashkarran, A.A.; Hamidinezhad, H.; Haddadi, H.; Mahmoudi, M. Double-doped TiO2 nanoparticles as an efficient visible-light-active photocatalyst and antibacterial agent under solar simulated light. Appl. Surf. Sci. 2014, 301, 338–345. [Google Scholar] [CrossRef]
  12. Venieri, D.; Fraggedaki, A.; Kostadima, M.; Chatzisymeon, E.; Binas, V.; Zachopoulos, A.; Kiriakidis, G.; Mantzavinos, D. Solar light and metal-doped TiO2 to eliminate water-transmitted bacterial pathogens: Photocatalyst characterization and disinfection performance. Appl. Catal. B Environ. 2014, 154–155, 93–101. [Google Scholar] [CrossRef] [Green Version]
  13. Wei, X.; Yang, Z.; Tay, S.L.; Gao, W. Photocatalytic TiO2 nanoparticles enhanced polymer antimicrobial coating. Appl. Surf. Sci. 2014, 290, 274–279. [Google Scholar] [CrossRef]
  14. Pelaez, M.; Nolan, N.T.; Pillai, S.C.; Seery, M.K.; Falaras, P.; Kontos, A.G.; Dunlop, P.S.M.; Hamilton, J.W.J.; Byrne, J.A.; O’Shea, K.; et al. A review on the visible light active titanium dioxide photocatalysts for environmental applications. Appl. Catal. B Environ. 2012, 125, 331–349. [Google Scholar] [CrossRef] [Green Version]
  15. Wang, L.; Wu, W.; Xie, X.; Chen, H.; Lin, J.; Dionysiou, D.D. Removing Escherichia coli from water using zinc oxide-coated zeolite. Water Res. 2018, 141, 145–151. [Google Scholar] [CrossRef] [PubMed]
  16. Faure, M.; Gerardin, F.; André, J.-C.; Pons, M.-N.; Zahraa, O. Study of photocatalytic damages induced on E. coli by different photocatalytic supports (various types and TiO2 configurations). J. Photochem. Photobiol. A Chem. 2011, 222, 323–329. [Google Scholar] [CrossRef]
  17. Moma, J.; Baloyi, J. Modified titanium dioxide for photocatalytic applications. In Photocatalysts—Applications and Attributes; IntechOpen: London, UK, 2019. [Google Scholar] [CrossRef] [Green Version]
  18. Monteiro, R.A.R.; Miranda, S.M.; Vilar, V.J.P.; Pastrana-Martínez, L.M.; Tavares, P.B.; Boaventura, R.A.R.; Faria, J.L.; Pinto, E.; Silva, A.M.T. N-modified TiO2 photocatalytic activity towards diphenhydramine degradation and Escherichia coli inactivation in aqueous solutions. Appl. Catal. B Environ. 2015, 162, 66–74. [Google Scholar] [CrossRef]
  19. Rojviroon, T.; Sirivithayapakorn, S. E. coli Bacteriostatic Action Using TiO2 Photocatalytic Reactions. Int. J. Photoenergy 2018, 2018, 8474017. [Google Scholar] [CrossRef] [Green Version]
  20. Figoli, A.; Hoinkis, J.; Altinkaya, S.A.; Bundschuh, J. Application of Nanotechnology in Membranes for Water Treatment; CRC Press: London, UK, 2017. [Google Scholar] [CrossRef]
  21. Gayan, E.; Manas, P.; Alvarez, I.; Condon, S. Mechanism of the Synergistic Inactivation of Escherichia coli by UV-C Light at Mild Temperatures. Appl. Environ. Microbiol. 2013, 79, 4465–4473. [Google Scholar] [CrossRef] [Green Version]
  22. Leung, Y.H.; Xu, X.; Ma, A.P.Y.; Liu, F.; Ng, A.M.C.; Shen, Z.; Gethings, L.A.; Guo, M.Y.; Djurišić, A.B.; Lee, P.K.H.; et al. Toxicity of ZnO and TiO2 to Escherichia coli cells. Sci. Rep. 2016, 6, 35243. [Google Scholar] [CrossRef] [Green Version]
  23. Matafonova, G.G.; Batoev, V.B.; Linden, K.G. Photocatalytic-based inactivation of E. coli by UV 282 nm XeBr Excilamp. J. Environ. Sci. Health Part A 2013, 48, 1670–1676. [Google Scholar] [CrossRef] [PubMed]
  24. Varnagiris, S.; Urbonavicius, M.; Sakalauskaite, S.; Daugelavicius, R.; Pranevicius, L.; Lelis, M.; Milcius, D. Floating TiO2 photocatalyst for efficient inactivation of E. coli and decomposition of methylene blue solution. Sci. Total Environ. 2020, 720, 137600. [Google Scholar] [CrossRef] [PubMed]
  25. Hirakawa, K. Fundamentals of medicinal application of titanium dioxide nanoparticles. In Nanoparticles Technology; InTech: London, UK, 2015. [Google Scholar] [CrossRef] [Green Version]
  26. Jiang, X.; Lv, B.; Wang, Y.; Shen, Q.; Wang, X. Bactericidal mechanisms and effector targets of TiO2 and Ag-TiO2 against Staphylococcus aureus. J. Med. Microbiol. 2017, 66, 440–446. [Google Scholar] [CrossRef] [Green Version]
  27. Nyangaresi, P.O.; Qin, Y.; Chen, G.; Zhang, B.; Lu, Y.; Shen, L. Effects of single and combined UV-LEDs on inactivation and subsequent reactivation of E. coli in water disinfection. Water Res. 2018, 147, 331–341. [Google Scholar] [CrossRef] [PubMed]
  28. Fendrich, M.; Quaranta, A.; Orlandi, M.; Bettonte, M.; Miotello, A. Solar Concentration for Wastewaters Remediation: A Review of Materials and Technologies. Appl. Sci. 2018, 9, 118. [Google Scholar] [CrossRef] [Green Version]
  29. Ferro, G.; Fiorentino, A.; Alferez, M.C.; Polo-López, M.I.; Rizzo, L.; Fernández-Ibáñez, P. Urban wastewater disinfection for agricultural reuse: Effect of solar driven AOPs in the inactivation of a multidrug resistant E. coli strain. Appl. Catal. B Environ. 2015, 178, 65–73. [Google Scholar] [CrossRef]
  30. Yahya, N.; Aziz, F.; Jamaludin, N.A.; Mutalib, M.A.; Ismail, A.F.; Salleh, W.N.W.; Jaafar, J.; Yusof, N.; Ludin, N.A. A review of integrated photocatalyst adsorbents for wastewater treatment. J. Environ. Chem. Eng. 2018, 6, 7411–7425. [Google Scholar] [CrossRef]
  31. Mansilla, H.D.; Mora, A.; Pincheira, C.; Mondaca, M.A.; Marcato, P.D.; Durán, N.; Freer, J. New photocatalytic reactor with TiO2 coating on sintered glass cylinders. Appl. Catal. B Environ. 2007, 76, 57–63. [Google Scholar] [CrossRef]
  32. Anpo, M.; Che, M.; Werner, O.; Haag, B.C.G.; Knoezinger, H. Advances in Catalysis; Academic Press: New York, NY, USA, 1999. [Google Scholar]
  33. Hidalgo, M.C.; Bahnemann, D. Highly photoactive supported TiO2 prepared by thermal hydrolysis of TiOSO4: Optimisation of the method and comparison with other synthetic routes. Appl. Catal. B Environ. 2005, 61, 259–266. [Google Scholar] [CrossRef]
  34. Schneider, J.; Matsuoka, M.; Takeuchi, M.; Zhang, J.; Horiuchi, Y.; Anpo, M.; Bahnemann, D.W. Understanding TiO2 Photocatalysis: Mechanisms and Materials. Chem. Rev. 2014, 114, 9919–9986. [Google Scholar] [CrossRef]
  35. Yu, M.; Liu, L.; Li, J. An overall Solution to Cathode-Ray Tube (CRT) Glass Recycling. Procedia Environ. Sci. 2016, 31, 887–896. [Google Scholar] [CrossRef] [Green Version]
  36. Choi, B.-C.; Xu, L.-H.; Kim, H.-T.; Bahnemann, D.W. Photocatalytic Characteristics on Sintered Glass and Micro Reactor. J. Ind. Eng. Chem. 2006, 12, 663–672. [Google Scholar]
  37. Dey, T. UV-reflecting sintered nano-TiO2 thin film on glass for anti-bird strike application. Surf. Eng. 2021, 37, 688–694. [Google Scholar] [CrossRef]
  38. Eftimie, M.; Melinescu, A. Glassceramics from CRT glass waste with TiO2 as nucleating agent. Rev. Rom. Mater. Rom. J. Mater. 2015, 45, 424–427. [Google Scholar]
  39. Ren, W.; Ai, Z.; Jia, F.; Zhang, L.; Fan, X.; Zou, Z. Low temperature preparation and visible light photocatalytic activity of mesoporous carbon-doped crystalline TiO2. Appl. Catal. B Environ. 2007, 69, 138–144. [Google Scholar] [CrossRef]
  40. Zhu, L.; Lu, Q.; Lv, L.; Wang, Y.; Hu, Y.; Deng, Z.; Lou, Z.; Hou, Y.; Teng, F. Ligand-free rutile and anatase TiO2 nanocrystals as electron extraction layers for high performance inverted polymer solar cells. RSC Adv. 2017, 7, 20084–20092. [Google Scholar] [CrossRef] [Green Version]
  41. Chi Fru, E.; Ofiţeru, I.D.; Lavric, V.; Graham, D.W. Non-linear population dynamics in chemostats associated with live–dead cell cycling in Escherichia coli strain K12-MG1655. Appl. Microbiol. Biotechnol. 2011, 89, 791–798. [Google Scholar] [CrossRef]
  42. Ajiboye, T.O.; Babalola, S.O.; Onwudiwe, D.C. Photocatalytic Inactivation as a Method of Elimination of E. coli from Drinking Water. Appl. Sci. 2021, 11, 1313. [Google Scholar] [CrossRef]
  43. Benabbou, A.K.; Derriche, Z.; Felix, C.; Lejeune, P.; Guillard, C. Photocatalytic inactivation of Escherischia coli: Effect of concentration of TiO2 and microorganism, nature, and intensity of UV irradiation. Appl. Catal. B Environ. 2007, 76, 257–263. [Google Scholar] [CrossRef]
  44. Janus, M.; Kusiak-Nejman, E.; Rokicka-Konieczna, P.; Markowska-Szczupak, A.; Zając, K.; Morawski, A.W. Bacterial Inactivation on Concrete Plates Loaded with Modified TiO2 Photocatalysts under Visible Light Irradiation. Molecules 2019, 24, 3026. [Google Scholar] [CrossRef]
Figure 1. The experimental set-up.
Coatings 12 01794 g001
Figure 2. TGA—DTA analysis of the CRT waste glass.
Coatings 12 01794 g002
Figure 3. SEM micrographs on the sintered sample at different magnification scales with 1% TiO2 (a) and 3% TiO2 (b) heat-treated at 820 °C for 15 mins.
Coatings 12 01794 g003
Figure 4. NAP-XPS survey spectra and Ti 2p and O 1s narrow scans of the (a) sample with 1% TiO2 and (b) sample with 3% TiO2.
Coatings 12 01794 g004
Figure 5. The bacterial growth in time in the presence of UV radiation (red line), and in the presence of UV radiation and sintered glass samples with TiO2 (green and blue lines).
Coatings 12 01794 g005
Figure 6. The cell viability tendency of the control sample.
Coatings 12 01794 g006
Figure 7. The cell viability tendency for Experiment 1.
Coatings 12 01794 g007
Figure 8. The cell viability tendency for Experiment 2.
Coatings 12 01794 g008
Figure 9. E coli control sample (a) t = 0; (b) t = 240 min, Experiment 1 (c) t = 0; (d) t = 240 min, and Experiment 2 (e) t = 0; (f) t = 240 min.
Coatings 12 01794 g009
Table 1. Chemical composition of CRT waste.
Composition (wt %)Frontal panelCone
SiO271.5755.22
Na2O18.0513.78
K2O3.573.14
PbO-18.83
Al2O33.144.44
BaO3.48-
MgO-3.2
CaO-1.07
Table 2. Inactivation efficiency of E. coli in the presence of UV and TiO2.
Time, minEfficiency, %
ControlExperiment 1Experiment 2
095.0 ± 0.2148.54 ± 0.3355.59 ± 0.47
3077.64 ± 0.1175.83 ± 0.2760.07 ± 0.36
6065.53 ± 0.0979.84 ± 0.2454.59 ± 0.41
9070.59 ± 0.1081.18 ± 0.1569.43 ± 0.29
12073.61 ± 0.1282.20 ± 0.1973.92 ± 0.11
15077.67 ± 0.1191.30 ± 0.0750.00 ± 0.43
18079.91 ± 0.0591.10 ± 0.0988.21 ± 0.12
21081.82 ± 0.0690.64 ± 0.0796.18 ± 0.09
24088.81 ± 0.0789.28 ± 0.2394.70 ± 0.08
Table 3. The values of the kinetic constant for the inactivation process.
ExperimentInactivation Kinetic Constant, k, min-1
Control5.094
Experiment 14.120
Experiment 23.547
Publisher’s Note: MDPI stays neutral with regard to jurisdictional claims in published maps and institutional affiliations.

