Article

Effect of Deposition Temperature on the Surface, Structural, and Mechanical Properties of HfO2 Using Chemical Vapor Deposition (CVD)

1
Kunming Institute of Precious Metals, Kunming 650106, China
2
City College, Kunming University of Science and Technology, Kunming 650093, China
*
Author to whom correspondence should be addressed.
Coatings 2022, 12(11), 1731; https://doi.org/10.3390/coatings12111731
Submission received: 15 September 2022 / Revised: 7 November 2022 / Accepted: 8 November 2022 / Published: 12 November 2022
(This article belongs to the Section Thin Films)

Abstract

:
A high-temperature-resistant and high-performance hafnium oxide (HfO2) coating for aerospace engines was developed. HfO2 thin film coatings were prepared by chemical vapor deposition (CVD) at 1200, 1250, 1300, and 1350 °C, respectively. The crystal structure and surface morphology of the HfO2 thin films at different deposition temperatures were studied by X-ray diffraction (XRD), scanning electron microscopy (SEM), and atomic force microscopy (AFM). The effect of deposition temperature on the mechanical properties of the HfO2 thin films was studied by means of the drainage method and nanoindentation. The results showed that the HfO2 coatings deposited at different deposition temperatures are monoclinic crystal structures, and the surface morphology changes from cellular particles to columnar particles, and finally, to a loose and porous layered structure. When the deposition temperature is 1300 °C, the density of the HfO2 film is the highest, 9.62 ± 0.03 g/cm3, and the hardness is the highest, 7.33 ± 0.04 GPa. A HfO2 coating with the best comprehensive mechanical properties was prepared by changing the deposition temperature, which provided an experimental basis for the application of a HfO2 coating in the aerospace field.

1. Introduction

At present, the availability of suitable materials is one of the factors limiting the rapid development of the aerospace industry. Aerospace engines are important parts of rockets, and their operation directly determines whether rockets can be successfully launched. However, the engines produce large quantities of heat when operating, which can consume the engine wall material. Therefore, a thermal insulation coating is required to isolate this heat from the engine wall and this coating must have good high-temperature mechanical stability. Among the high melting point metal oxides, zirconium oxide (ZrO2) and aluminum oxide (Al2O3) coatings are commonly used after considering the properties of vapor pressure and thermal conductivity. ZrO2 and Al2O3 coatings have high melting point properties, low thermal expansion coefficient and good thermal compatibility with the substrate, which are the common research topics of high-temperature oxidation resistant coating materials. However, when the working temperature is higher than 1650 °C, ZrO2 has a higher evaporation rate, which greatly reduces the service life of the ZrO2 coating. The thermal conductivity of Al2O3 is large, which cannot resist most of the external heat for the engine wall matrix. Elemental hafnium (Hf) and zirconium (Zr) are in the same periodic table sub-group, and its oxide, HfO2, has a high melting point [1], low thermal conductivity and low evaporation rate. It is an ideal material for high-temperature oxidation-resistant coatings [2,3]. It can be used as a thermal and diffusion barrier for aerospace engines to prevent heat from entering and burning the circuitry to ensure the safe operation of the engine.
HfO2 thin film is a type of insulator, which has the advantages of a wide band gap, high dielectric constant [4,5,6,7,8,9] and large refractive index. Its thermal and chemical properties are stable, which can also protect the substrate. It has important applications in optoelectronics [10], ferroelectric transistors [11] of HfO2 thin film materials, high-K gate dielectric films [12], high-temperature refractory materials [13] and other fields. Thin film preparation techniques include pulse laser deposition, sol-gel, atomic layer deposition [14,15,16,17] and chemical vapor deposition (CVD) and other deposition methods. However, the growth of HfO2 coatings at different deposition temperatures is significantly different. At ambient pressure, the HfO2 crystal structure exhibits three thermodynamically stable phases with temperature. At room temperature, HfO2 is monoclinic (m-HfO2); HfO2 transforms into tetragonal (t-HfO2) at 2000 K; when heated to 2900 K, it turns into a cubic phase; it is liquid when heated to 3031 K [18]. The deposition thickness of HfO2 films varies with temperature [19].
CVD is one of the commonly used methods for preparing nano-films. Its raw material is a gaseous material. It is a technology for preparing solid materials on solid surfaces. The reactants have one or more solid products through chemical reactions. The principle is to use the chemical contact reaction on the surface of the substrate film to deposit the film [20]. The characteristics are that the composition of the deposited film is easy to control, it is not easily contaminated with impurities, the deposition rate is high, the uniformity is good, it is suitable for complex substrates and can be formed over a large area [21].
In this study, HfO2 films were prepared by CVD at different deposition temperatures under atmospheric pressure. The microstructure, density and mechanical properties of HfO2 were studied by the control variable method. In order to explore the most suitable deposition temperature for HfO2 coatings, the deposition gradient temperature is designed: 1200, 1250, 1300 and 1350 °C.

2. Experiments and Methods

2.1. Experimental Materials

The experimental materials were Hf (≥99.9%, Nanjing Ruifenghang Co., Ltd., Nanjing, China), Cl2 (≥99.6%, Yunnan Salt Chemical Co., Ltd., Kunming, China), H2 (≥99.6%, Kunming Mercer Co., Ltd., Kunming, China), and CO2 (≥99.6%, Kunming Mercer Co., Ltd., Kunming, China). HfO2 films were prepared on molybdenum (Mo, ≥99.9%, Baoji Tengfeng Metal Materials Co., Ltd., Baoji, China).

2.2. Experimental Methods

HfO2 thin films were prepared by low-pressure cold wall CVD using the open tube method. The experimental setup is shown in Figure 1. The chlorination-reduction combined reaction occurred in the deposition device. The chlorination temperature was 235 °C, and the Cl2 flow rate was 50 mL/min. The redox reaction temperature was 1200, 1250, 1300, and 1350 °C, the H2 flow was 400 mL/min, and the CO2 flow was 200 mL/min. The Cl2 in the chlorination chamber reacts with the Hf to form hafnium chloride (HfCl4) gas, as shown in Equation (1); the HfCl4 gas was introduced into the deposition chamber to undergo the redox reaction with H2 and CO2 to form HfO2 deposited on the Mo substrate, as shown in Equation (2):
Hf + 2Cl2 → HfCl4
HfCl4c + 2CO2 + 2H2 → HfO2 + 2CO + 2HCl

2.3. Measurement Methods

The surface morphology of the samples was tested by an SPM-S3400 N scanning electron microscope (SEM) (Hitachi, Tokyo, Japan). The phase structure of the coating was tested by a Rigaku D/max-2200 X-ray diffractometer (XRD) (Rigaku, Tokyo, Japan). The density was measured by the drainage method (GB/T1423-1996), and the ratio of the measured density to theoretical density was relative density. The Vickers hardness was measured by an HXS-1000 (Shangguang, Shanghai, China). A microhardness tester, and the elastic modulus and indentation hardness were tested by a Nano Indenter XP instrument (MTS, Eden Prairie, MN, USA).

2.4. Thermodynamic Calculation of the Deposition Zone

It can be seen from the above equation that the main reaction in the deposition zone is HfCl4 + 2CO2 + 2H2 → HfO2 + 2CO + 2HCl. Although HfCl4 may generate low-valent hafnium chloride in the process of hydrogen reduction, from the final product, the reaction system generates HfO2. Therefore, how does the reaction progresses, the final product is thermodynamically determined and is not affected by the intermediate processes. In the thermodynamic calculation of the deposition zone, this study only considers the hydrogen reduction and oxidation processes of HfCl4.
When the temperature is 298 K, it can be calculated from the formula for the Gibbs free energy:
Δ G T θ = Δ H 298 θ T Δ Φ Φ T
of which:
Δ Φ T = Δ ( G T θ H T 298 θ T ) = Δ ( Δ H T θ Δ H T 298 θ T + S T θ )
and given by:
Δ Φ T = Δ ( G T θ H T 0 θ T ) = Δ ( Δ H T θ Δ H T 0 θ T + S T θ ) = ( n i Φ i , T ) p r o d u c t ( n i Φ i , T ) r e a c t a n t
to get:
Δ Φ T = ( n i Φ i , T ) p r o d u c t ( n i Φ i , T ) r e a c t a n t
Δ G T θ is the standard reaction Gibbs free energy at temperature T, Δ H 298 θ is the standard reaction heat effect at 298 K, T is the temperature, Δ H T θ Δ H T 298 θ T is defined as the Gibbs free energy function Φ T of a substance, Δ Φ T is the reaction Gibbs free energy function, Δ S T θ is the standard reaction entropy difference at temperature T, and Δ Φ T is the reaction Gibbs free energy function at T0 = 298 K.
From Equations (3), (4) and (6), combined with the thermodynamic data table related to the material, the Gibbs free energy function of the substance and the Gibbs function of the reaction at different temperatures can be obtained, so as to obtain the chemical reaction.
When calculating the Gibbs free energy of a chemical reaction, since the thermodynamic data table in the relevant thermodynamic data manual provides a row of thermodynamic data for every 100 K temperature difference from 300 K, in order to obtain the critical temperature point of the chemical reaction, the Gibbs free energy of matter from 300 to 2000 K must be calculated.
According to the Gibbs free energy values of the substances given in the far right column of Table 1, it can be concluded that with an increase in deposition temperature, the standard Gibbs free energy value of HfCl4, H2, and CO2 to form HfO2 decreases and becomes negative, indicating that the thermodynamic driving force of the reaction is increasing, the chemical reaction is more intense at this time, and the deposition rate of HfO2 increases accordingly. From a thermodynamic point of view, the higher the deposition temperature, the easier the deposition reaction is. However, as the deposition temperature increases, the requirements for the deposition equipment in the experiment are also higher, and the corresponding energy consumption is also higher. Therefore, an ideal Deposition temperature range should be selected. The deposition temperatures selected for this experiment were: 1200 °C (1473 K), 1250 °C (1523 K), 1300 °C (1573 K), and 1350 °C (1623 K).
In the Gibbs free energy calculation for the chemical reaction, because the thermodynamic data tables in the relevant thermodynamic data manual provide one row of thermodynamic data for the temperature difference every 100 K from 300 K, in order to obtain the critical temperature point of the chemical reaction, the Gibbs free energy of matter from 300 to 2000 K was calculated.
According to the Gibbs free energy values of the materials given in the rightmost column of Table 1, it can be seen that the Gibbs free energy functions ΦT (HfCl4), ΦT (H2), ΦT (CO2), ΦT (HfO2), Φ T   (CO), ΦT (HCl) of HfCl4, H2, CO2, HfO2, CO, and HCl increase with an increase in temperature, while the reaction Gibbs free energy function Δ Φ T at T0 = 298 K and the standard reaction Gibbs free energy ΔGT at T decrease with an increase in temperature. It can be concluded that with an increase in the deposition temperature, the standard Gibbs free energy of HfO2 generated by the reaction of HfCl4, H2, and CO2 decreases and is negative, indicating that the thermodynamic driving force of the reaction increases. At this time, the chemical reaction is more intense, and the deposition rate of HfO2 increases. From the thermodynamic point of view, the higher the deposition temperature, the easier the deposition reaction, but with an increase in the deposition temperature, the higher the requirements of the experiment on the deposition equipment, the higher the corresponding energy consumption. Therefore, an ideal deposition temperature range should be selected. The deposition temperatures selected in this experiment were: 1200 °C (1473 K), 1250 °C (1523 K), 1300 °C (1573 K), and 1350 °C (1623 K).

3. Experimental Results and Analysis

3.1. X-ray Diffraction Analysis

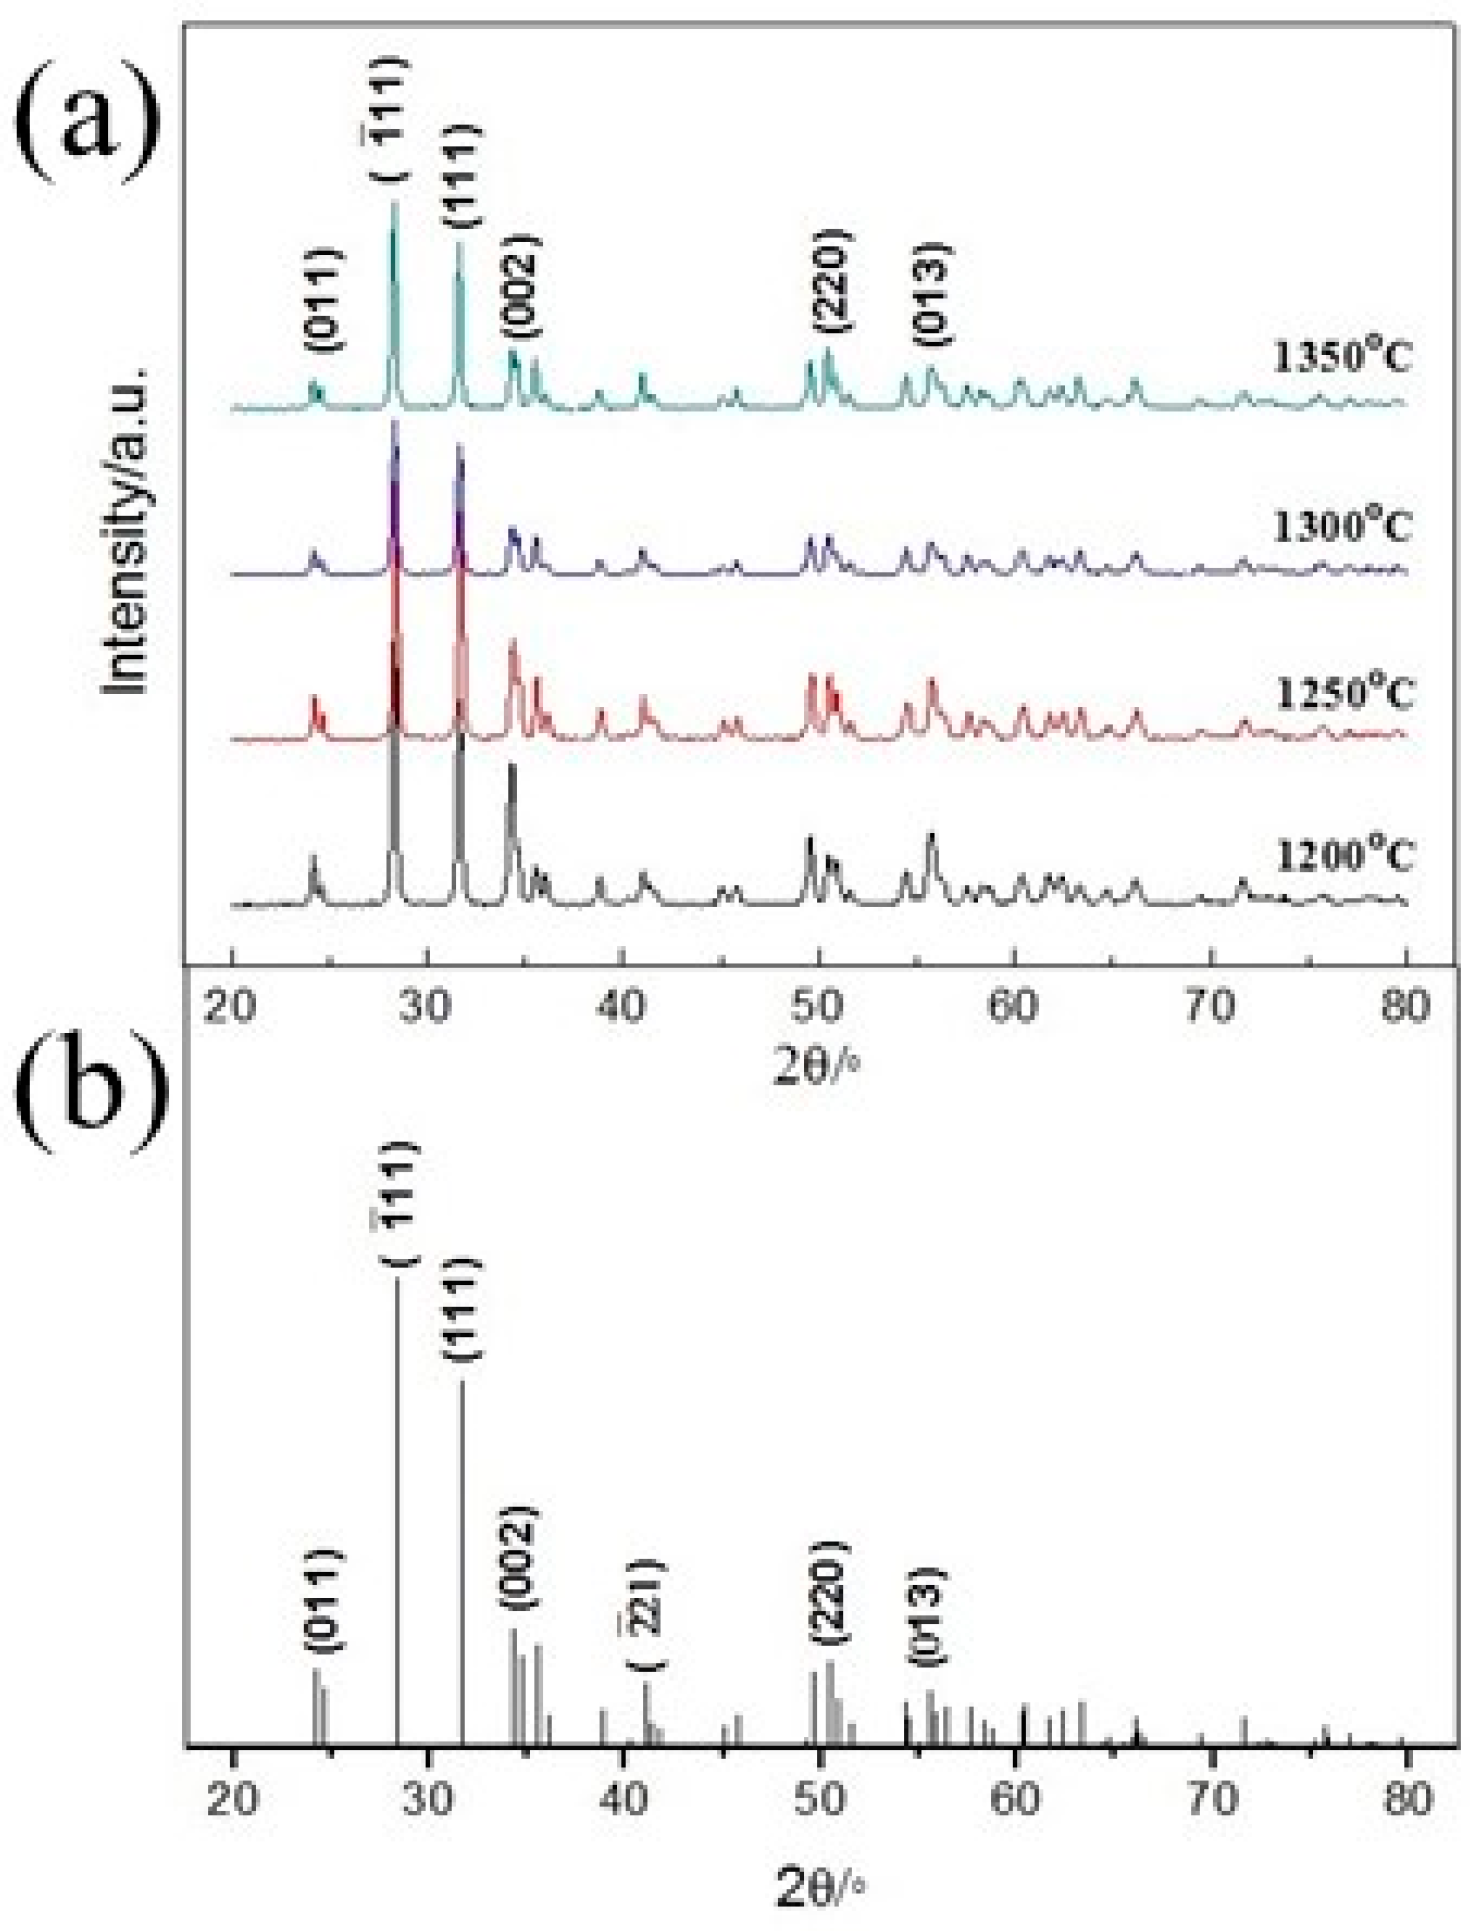
It can be seen from Figure 2 that the positions of the diffraction peaks in the HfO2 coating prepared by the CVD method are consistent with those of the standard. There is no obvious shift and broadening phenomenon, nor does the diffraction peak of the matrix Mo appear, indicating that the obtained coating is a pure HfO2 coating with a monoclinic crystal structure at room temperature.
As the deposition temperature increased, the XRD diffraction peaks of the coatings changed continuously, indicating that the preferred orientation of the coatings changed with an increase in the deposition temperature, and the preferred orientation could be characterized by the texture coefficient. The texture coefficient of the coating can be calculated by the Harris [22] formula, as follows:
T C ( h k l ) = I ( h k l ) / I 0 ( h k l ) 1 / N [ I ( h k l ) / I 0 ( h k l ) ]
where TC(hkl) is the texture coefficient of the (hkl) crystal plane, I(hkl) is the diffraction peak intensity of the measured crystal plane, I0 (hkl) is the standard diffraction peak intensity of the corresponding crystal plane in the standard, and N is the number of diffraction peaks to be calibrated. According to the diffraction peak intensity values in the standard, the eight diffraction peaks, (−111), (111), (002), (020), (200), (022), (220), and (013), were selected for comparison. The large crystal planes were analyzed, and the results obtained are shown in Table 2.
It can be seen from Table 2 that with an increase in the deposition temperature, the texture coefficient of the strongest peak (−111) crystal plane increases continuously, the texture coefficient of the (002) crystal plane decreases continuously, and the second strongest peak (111) crystal plane continues to decrease. The texture coefficients of the (020) and (200) planes first increased and then decreased, but the texture coefficients were all <1, indicating that the grains of the coating had no obvious preferential growth trend along these planes. The texture coefficients of the (022) crystal plane, (220) crystal plane and (013) crystal plane are >1 at different deposition temperatures, indicating that the grains of the coating tend to preferentially grow along these crystal planes. When the grain structure grows along these crystal planes, the system free energy of the coating is minimized, so that the coating reaches the most stable state.

3.2. Surface Topography Analysis

3.2.1. Surface Morphology and Thickness Characterization

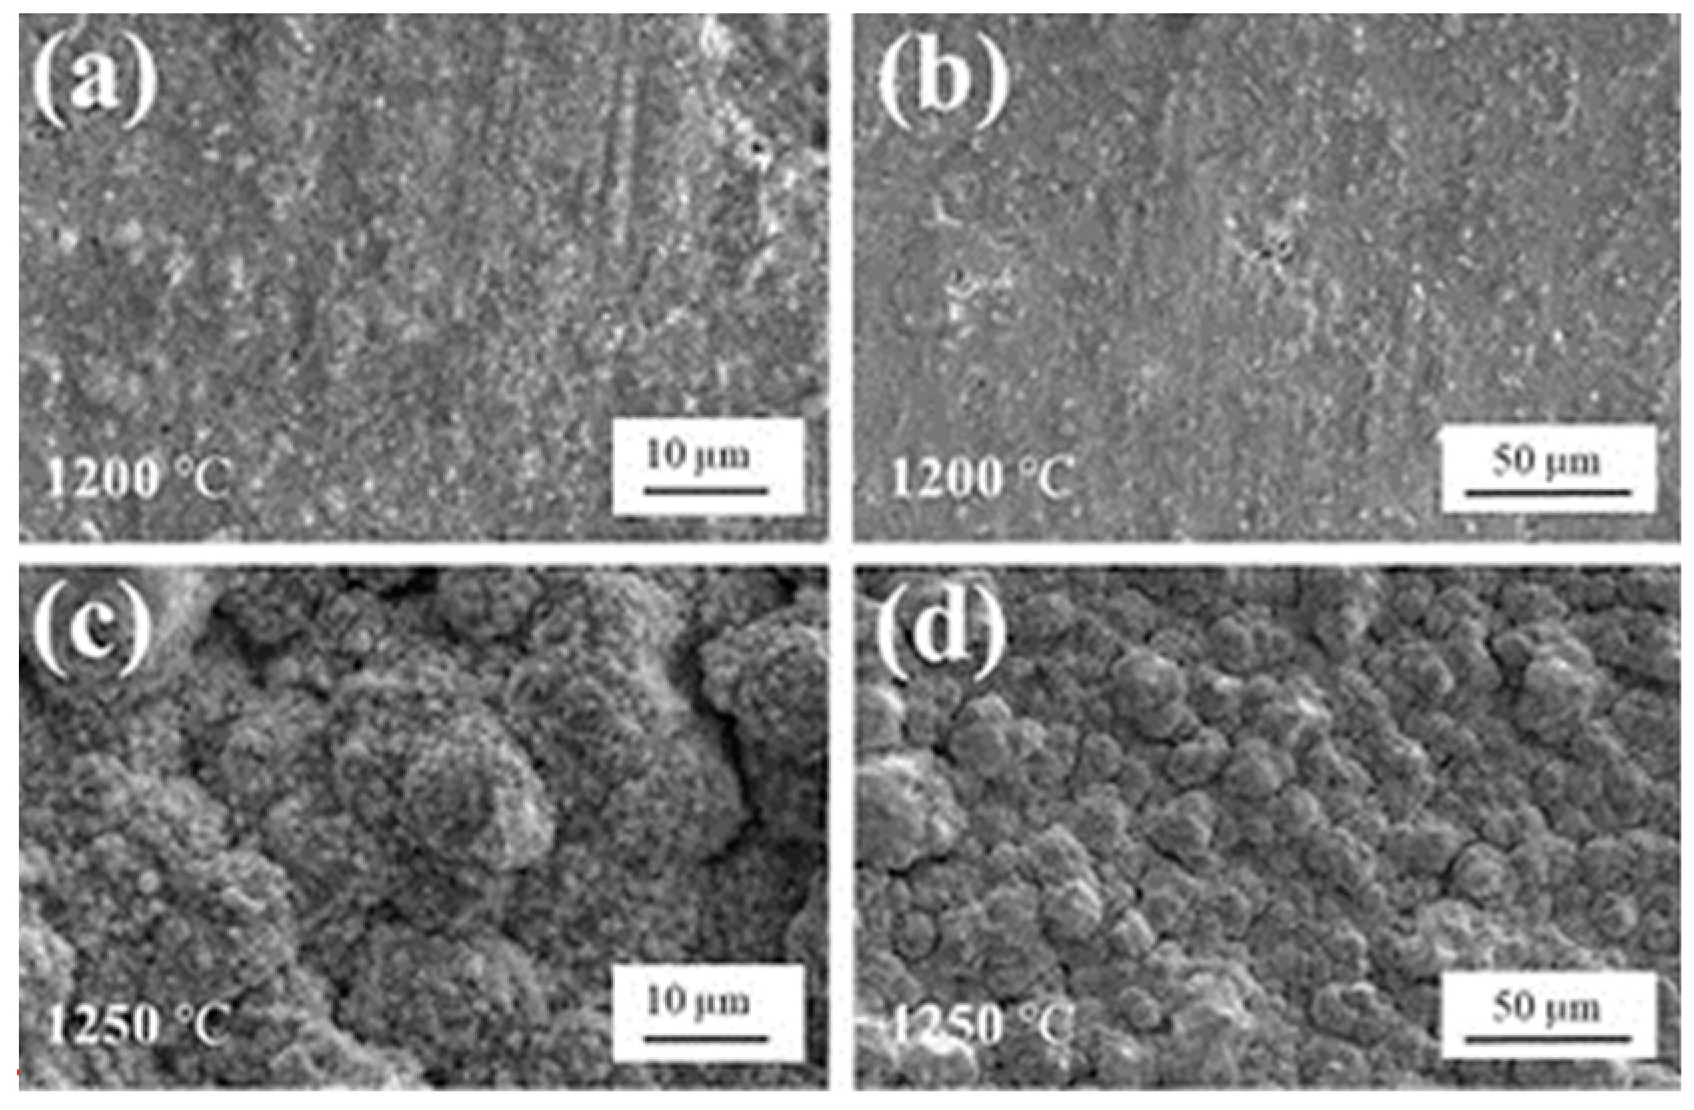
It can be seen from Figure 3a,b that at 1200 °C there are many relatively uniform point-like protrusions on the deposition surface, with low continuity and uniformity, composed of small particles, and it is obvious that there are many vertical protrusions-scratches. This is because when the temperature is low, the migration, adsorption, and chemical reaction of gas molecules on the surface of the substrate are slow, and the reaction gas has enough time to diffuse to the surface of the substrate. At this time, the deposition rate is determined by the adsorption rate of the substrate surface. With an increase in the deposition time on the surface, the supersaturation of the gas reactant near the surface of the substrate will continue to increase, and the critical radius of nucleation will continue to decrease. The distribution is more uniform, and the size is small. Due to the small size, the particles are tightly deposited on the Mo substrate, so scratches on the substrate can be clearly seen.
From Figure 3c,d it can be seen that at 1250 °C, HfO2 is mainly composed of cellular particles with a size of about 10 µm. The small particles that make up the cellular particles are not well-fused, and the surface unevenness is obvious. The reason is that the temperature increases, the gas molecules move, the adsorption rate on the surface of the substrate increases, and the supersaturation in the atmosphere decreases so that the rate of the deposition process is gradually changed from the surface adsorption control to the gas flow control, and the surface nucleation growth rate is accelerated, but the nucleation rate slows down, and it is difficult to form new nuclei, so the accumulation of small particles makes the size of the surface-deposited particles larger, and the aggregation of the particles causes the particles to fuse to form cellular particles that increase with an increase in temperature. At this stage, the coating is in the stage of cellular particle formation.
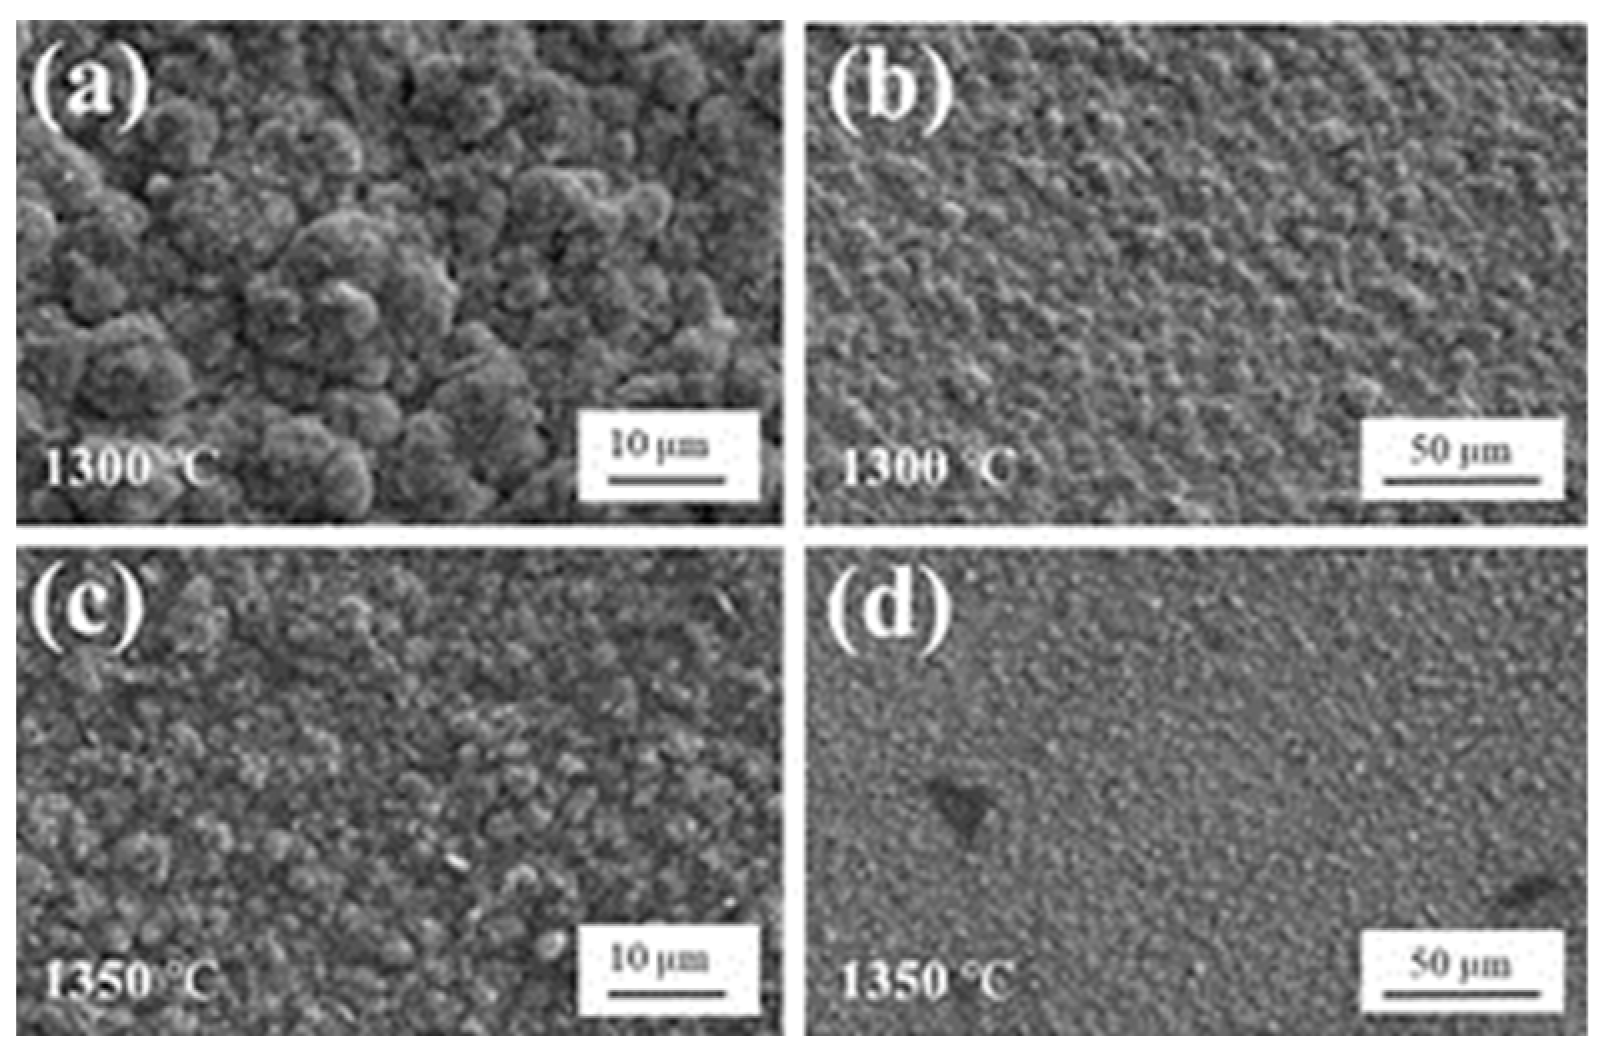
It can be seen from Figure 4a,b that at 1300 °C, HfO2 is mainly composed of small particle clusters formed by cell-like particles, and the surface of the particles becomes smoother, the coating begins to become dense, and the particles are more uniform. The phenomenon of unevenness is also improved, and the degree of fusion between the grains is higher. The reason is that the temperature continues to rise, the surface process rate increases rapidly, the deposition process is mainly controlled by the diffusion rate of the gas molecules, the chemical reaction rate accelerates, the supersaturation in the reaction system decreases, the critical size of nucleation increases, and nucleation becomes difficult. The growth rate of the crystals increases with an increase in the deposition temperature so that the number of crystal nuclei decreases, but the size of the small grains grown by each crystal nucleus increases, and the aggregation and fusion between the small particles intensifies and continues to agglomerate to form cellular granules. The size of the cellular particles increases with an increase in the deposition temperature.
From Figure 4c,d it can be seen that at 1350 °C, HfO2 is mainly composed of small columnar particles. It is obvious that it is not a cell-shaped particle with a smooth surface, but a large particle with columnar particle edges and corners deposited on the surface, and there are obvious defects on the surface of the film. This is because the temperature continues to rise, and part of the reaction gas has not yet been adsorbed on the surface of the substrate. In the gas phase, enough energy can be obtained to chemically react to form HfO2. These HfO2 molecules will agglomerate with each other to form nuclei and gradually grow as the reaction proceeds. Columnar particles are formed and eventually settle directly onto the surface of the substrate, resulting in the appearance of corners of the columnar particles. These large particles are not firmly bonded to the matrix, so the structure is relatively loose, and obvious defects can be seen.
The SEM analysis results show that with an increase in the deposition temperature, the HfO2 small particle clusters that constitute the coating surface continue to grow and gradually cluster into cellular HfO2 particles, and the size of the cellular particles increases with an increase in the deposition temperature, becomes larger, and the particle surface is smoothest at 1300 °C. The deposition rate was gradually transformed from the surface adsorption control to the gas flow control. The surface nucleation and growth rate are accelerated, but the supersaturation of the gas molecules decreases, and the critical size of nucleation increases, resulting in a decrease in the nucleation rate. When the deposition temperature exceeds a certain value (at 1300 °C), as the deposition temperature increases, the coating is formed in the form of columnar HfO2 particles, but the particle size is larger at this time.
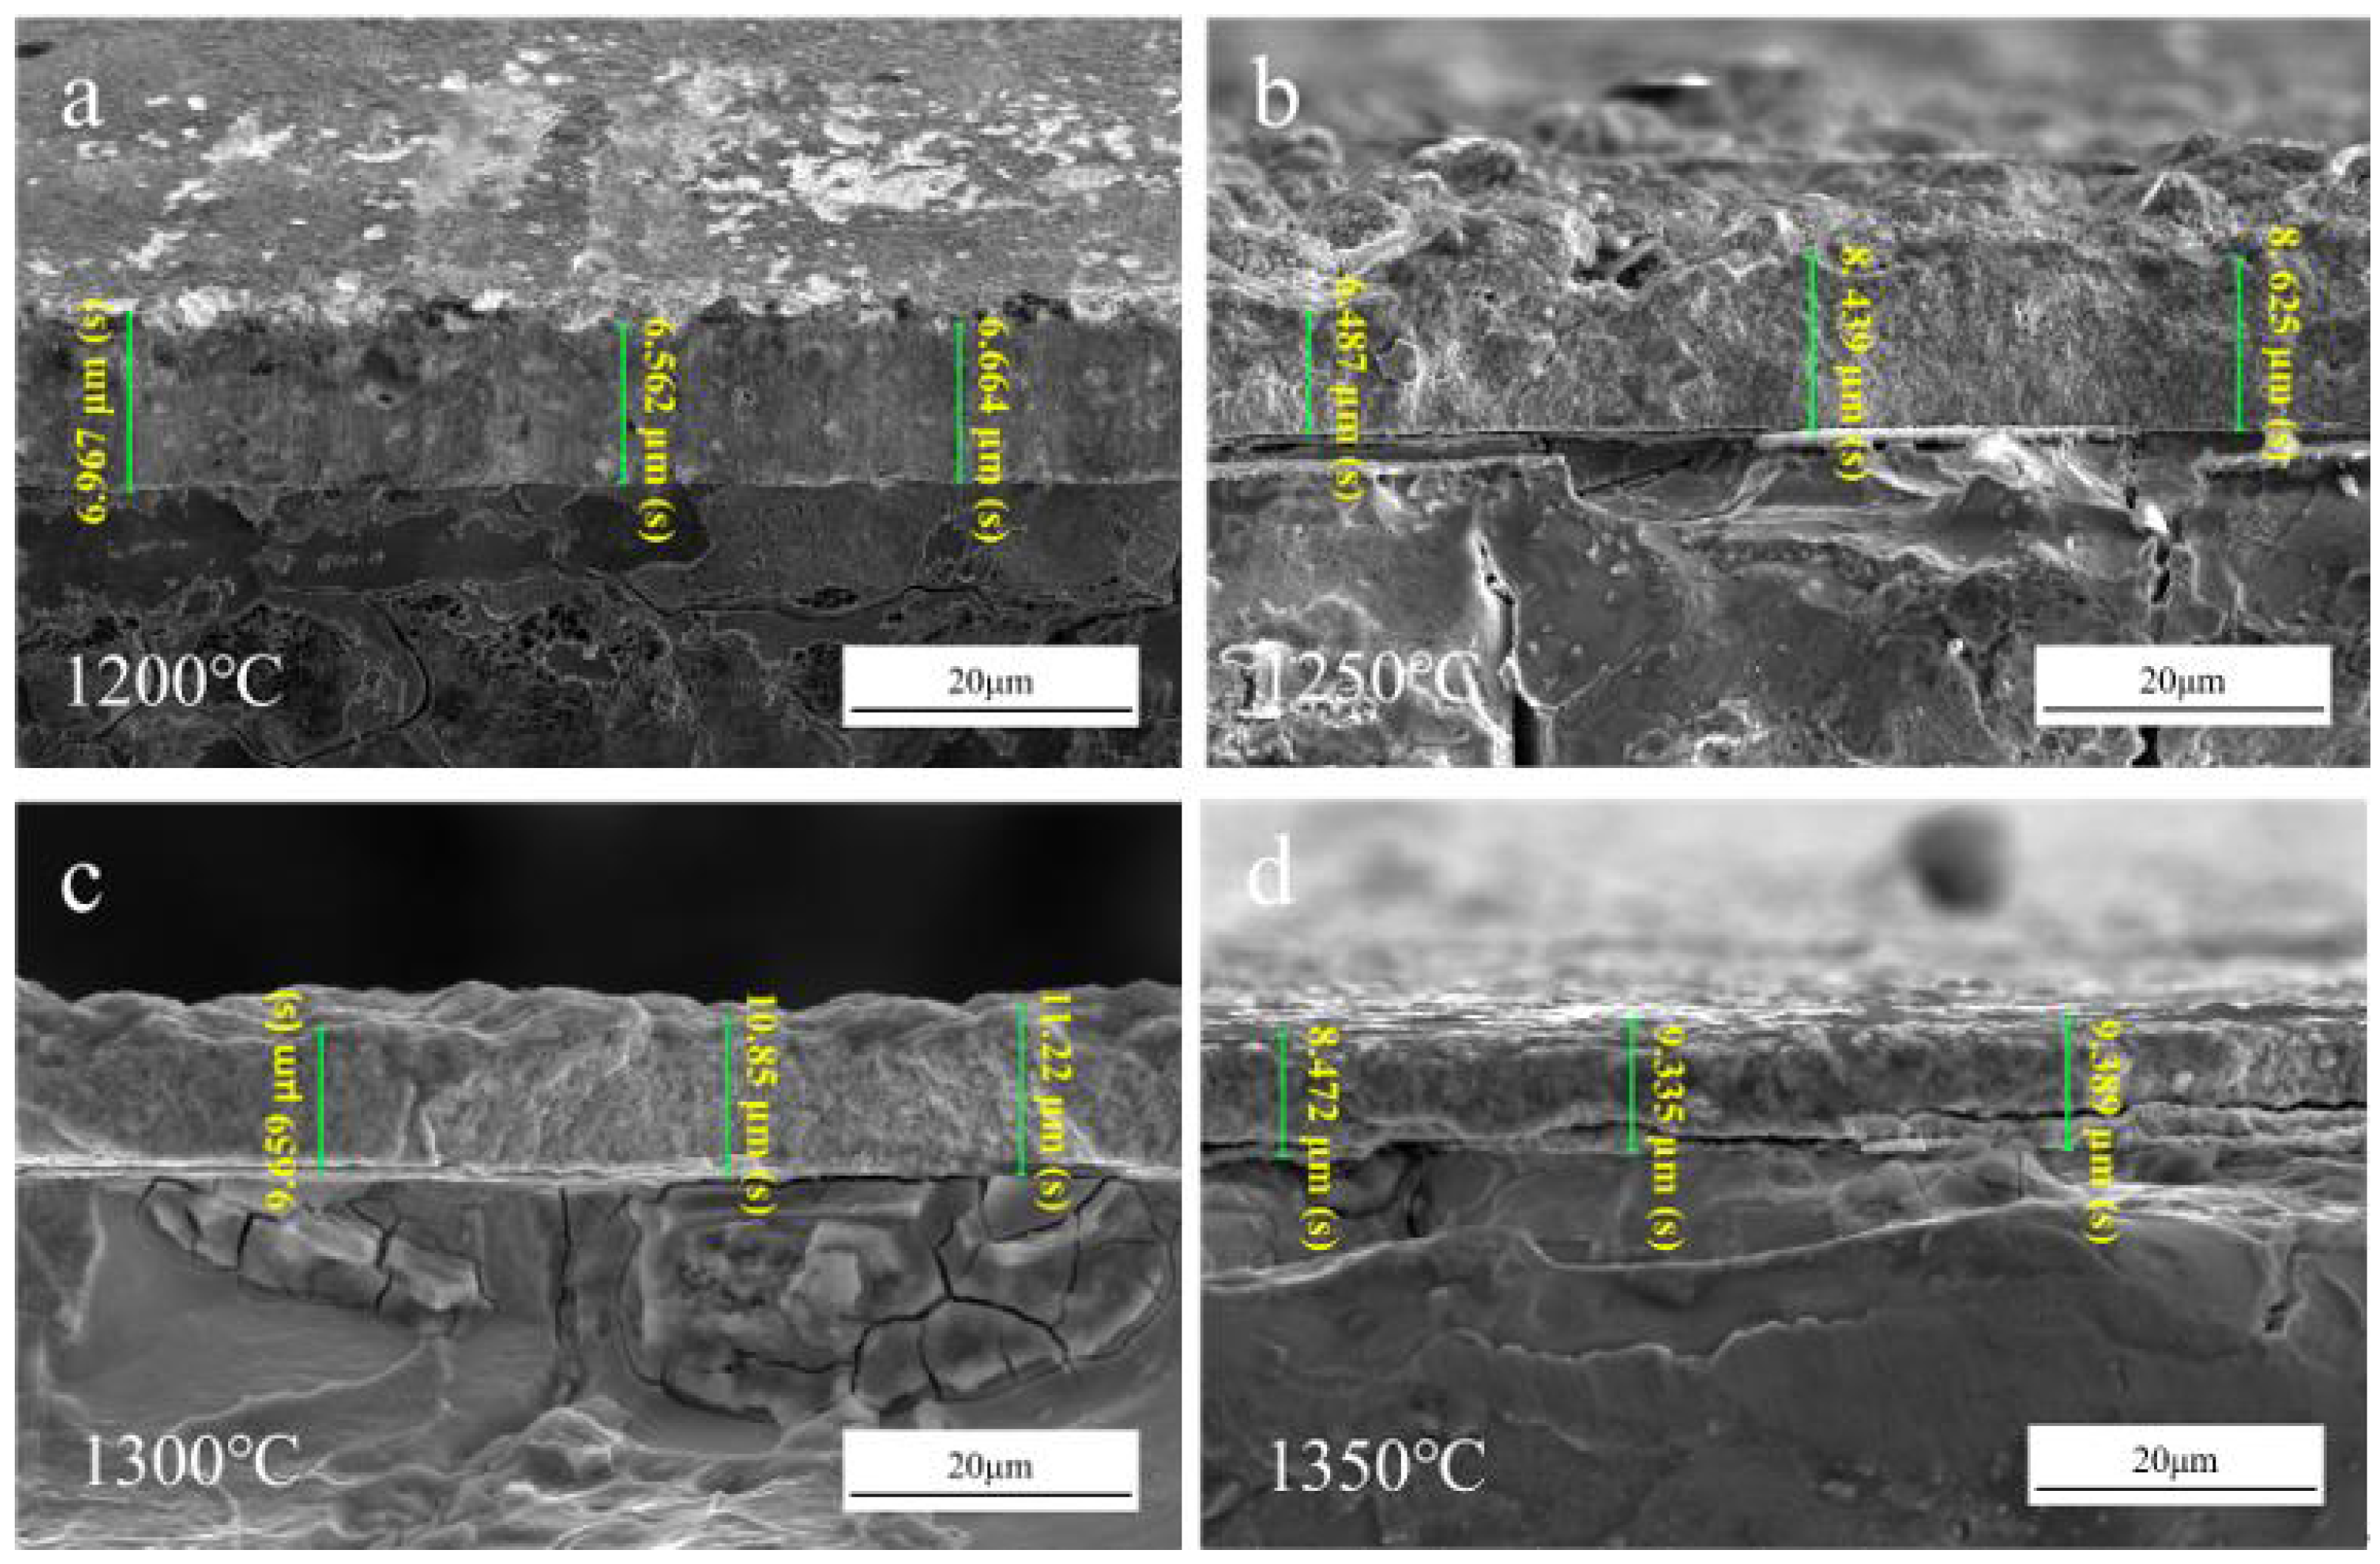
It can be seen from Figure 5a,b that the thickness of the HfO2 coating prepared by CVD increases first and then decreases. With an increase in the temperature within a certain range, the particles of the deposition layer gradually become larger, so the thickness also gradually increases. The average thickness increased from 6.731 μm (s) to 7.850 μm (s) and then to 10.576 μm (s). The maximum thickness is 10.576 μm (s) at 1300 °C, as shown in Figure 5c. At 1250 °C, the surface of the cross-section can be clearly seen at a large fluctuation, and at 1300 °C, there is no gap in the coating from the cross-section, indicating that the deposited film structure is intact, and the growth effect of the HfO2 particles is optimized. Figure 5d shows that as the temperature continues to increase, the coating average thickness decreased to 9.065 μm (s), and it can be clearly seen that there are cracks below. At 1350 °C, because the particles are agglomerated in the atmosphere and deposited, there is a lot of space at the bottom, resulting in cracks. Therefore, the thickness of the HfO2 coating increases first and then decreases with an increase in the temperature, reaching a maximum of 10.576 μm (s) at 1300 °C.

3.2.2. Surface Roughness Characterization

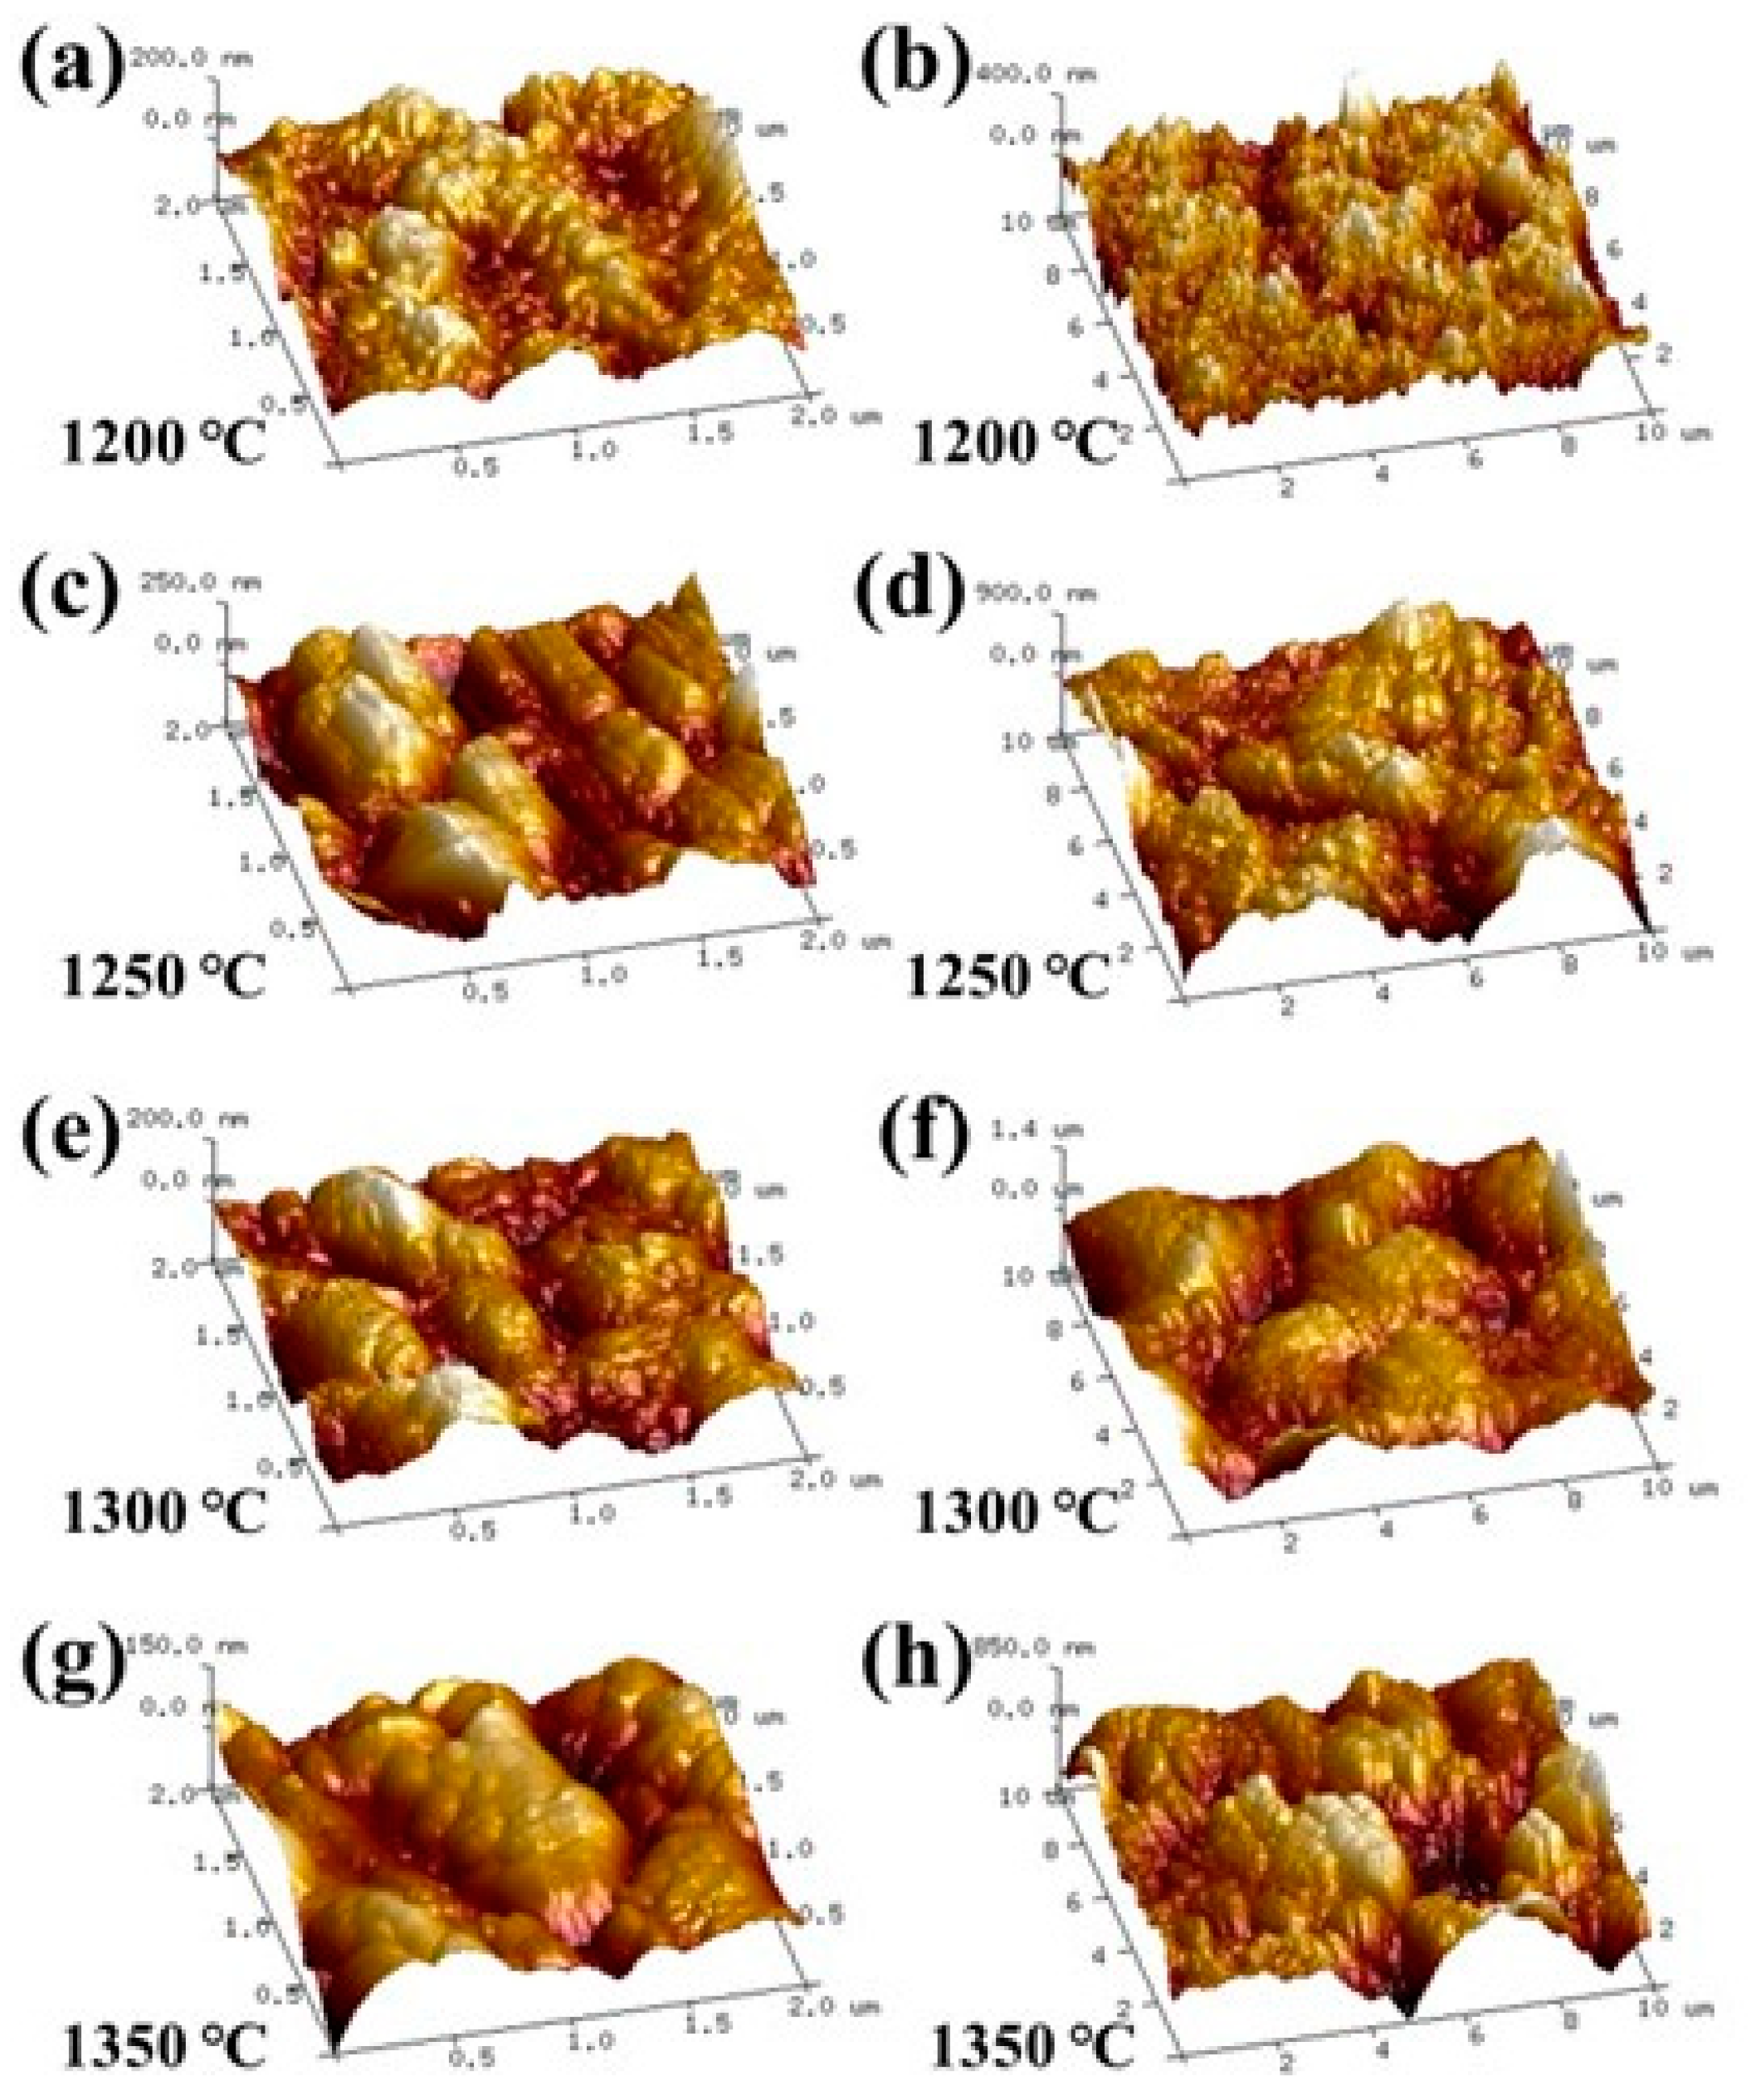
It can be seen from Figure 6 that the surface is dotted at 1200 °C. Because the temperature is not high enough, the particles have not yet grown up, forming a dot-like protrusion on the surface of the substrate. When the temperature rises to 1250 °C, the particles begin to grow, making the point-like protrusions become mountain-like protrusions, and the size of some small particles becomes larger. When the temperature continues to rise to 1300 °C, the particles continue to become larger, and the mountain-like protrusions gradually become smooth. This is because all of the small particles grow evenly and connect together to form a better coating surface. When the temperature rises to 1350 °C, the AFM image shows an angular state. Because the temperature is too high, the HfO2 particles agglomerate in the atmosphere and fall, depositing on the surface of the substrate. Therefore, the edges and corners in the AFM image come from the small particles exposed on the surface.
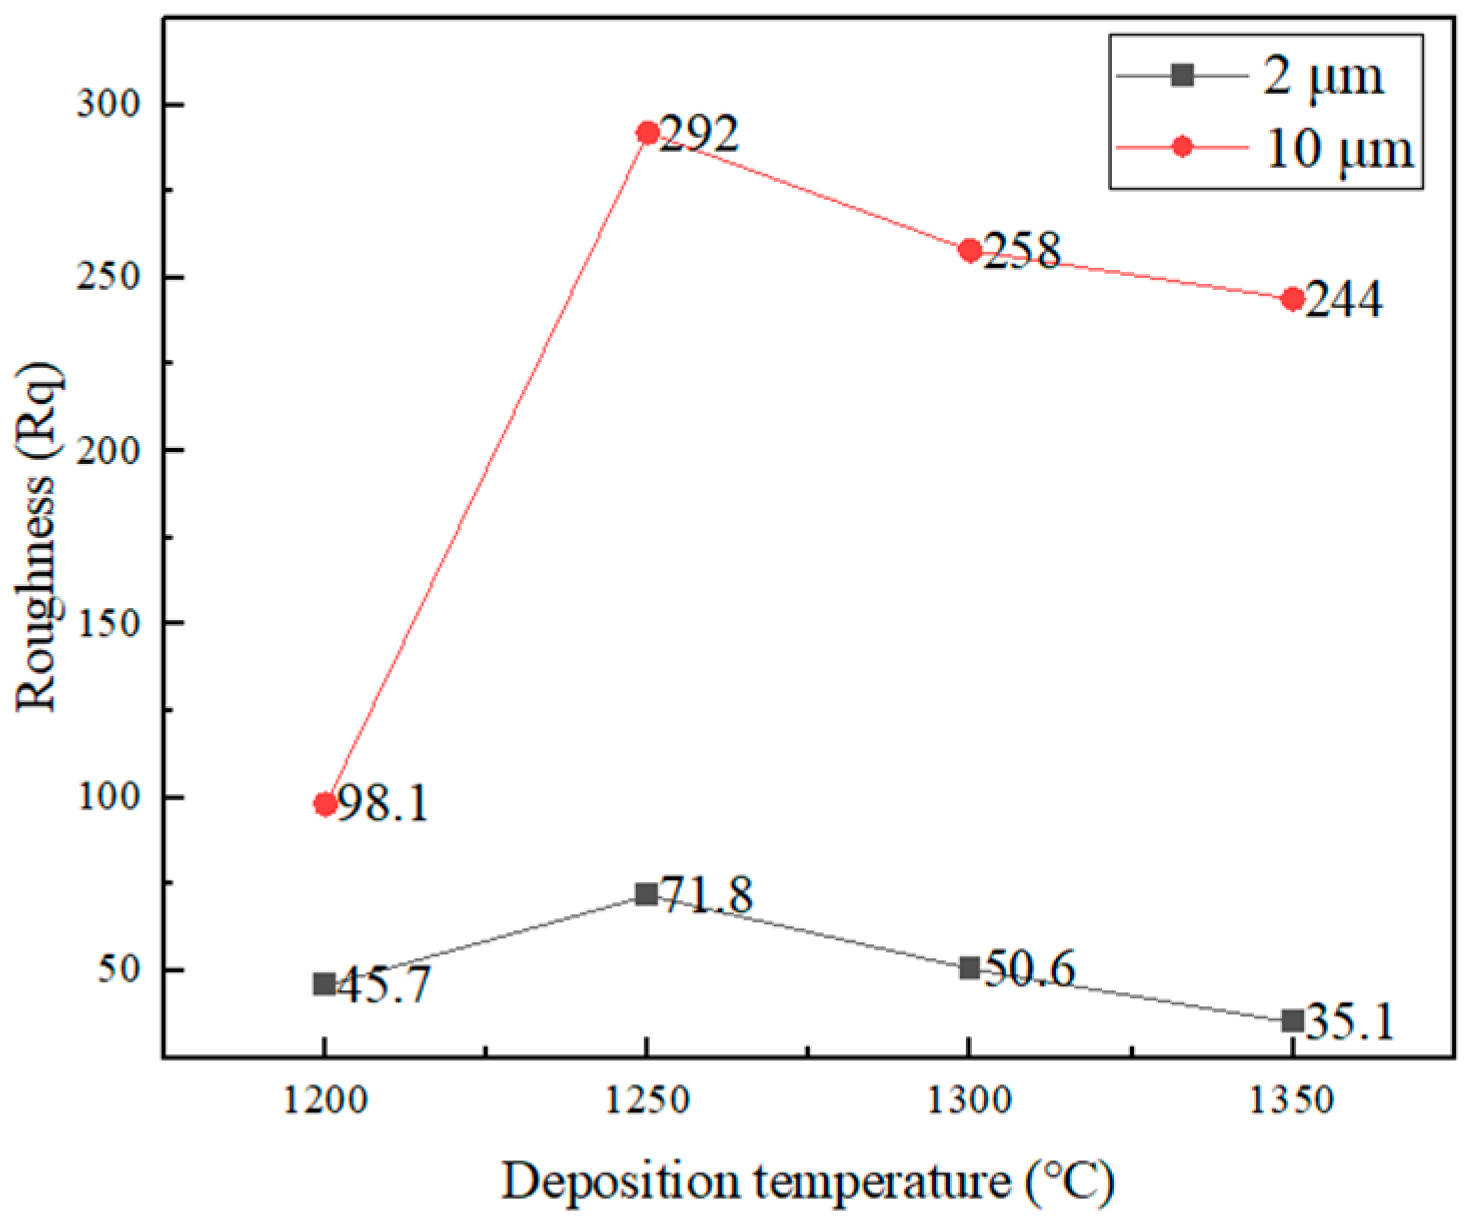
It can be seen from Figure 7 that the deposition surface roughness increases first and then decreases with an increase in the deposition temperature and reaches a maximum at 1200 °C. The reason for this phenomenon is that when the deposition temperature is low, the HfO2 particles cannot grow up due to insufficient temperature, and the particle size is uniform, so the roughness is small. When the temperature rises to 1250 °C, the particles begin to grow, and the roughness increases and reaches a peak. When the temperature continues to rise to 1300 °C, the particles continue to grow, but the roughness decreases. At 1300 °C, because the particles grow more uniformly than at 1250 °C, it can also be seen from the AFM image that the HfO2 coating particles are more complete and uniform at 1300 °C. When the temperature rises to 1350 °C, the roughness continues to fall, because the temperature continues to rise, and the HfO2 coating particles agglomerate in the atmosphere after the deposition on the surface of the substrate, so that the coating surface fluctuation is reduced, loose porous but flatter. Therefore, the surface roughness increases first and then decreases with an increase in the temperature, reaching a peak at 1250 °C.

3.3. Density and Relative Density

The density of the HfO2 coating was measured and calculated by the drainage method.
Figure 8 shows that with an increase in the deposition temperature, the density and relative density of the coating increase first and then decrease. When the deposition temperature is 1300 °C, the density and relative density of the coating reach the maximum value, which is 9.622 g/cm3 and 99.19%, respectively.
The density of the coating is determined by the binding of the HfO2 particles. When the deposition temperature is 1200 °C, the coating is in the surface adsorption control stage, and the nucleation rate is high, but the growth rate is slow. When the deposition temperature is 1250 °C, due to the increase in the temperature, the nucleation rate decreases, the growth rate of the nuclei increases, the nuclei gradually grow, and the particles begin to fuse with each other to form cellular particles, so the bonding between the particles is tightness. The porosity of the coating decreases sharply, and its density and relative density increase sharply. When the deposition temperature is 1300 °C, the deposition rate is mainly controlled by the gas flow rate, the nucleation rate decreases, and the growth rate of the crystal nucleus increases, so that the crystal nucleus decreases, the crystal grain increases, and the small particles are no longer discretely distributed but are further fused. The formation of the cellular particles minimizes the porosity of the coating. Therefore, its density and relative density reach the maximum value. When the deposition temperature is 1350 °C, the HfO2 particles first aggregated in the atmosphere and were then deposited on the substrate. The particle size was larger, and the surface morphology appeared to be columnar particles, which reduced the density and relative density of the coating.

3.4. Hardness and Nanoindentation Load-Displacement Curves

The hardness and load-displacement curves of the HfO2 coatings prepared by the CVD method at different deposition temperatures were measured with a nanoindenter. The measured hardness values of the samples are shown in Figure 9, and the nanoindentation load-displacement curve is shown in Figure 10.
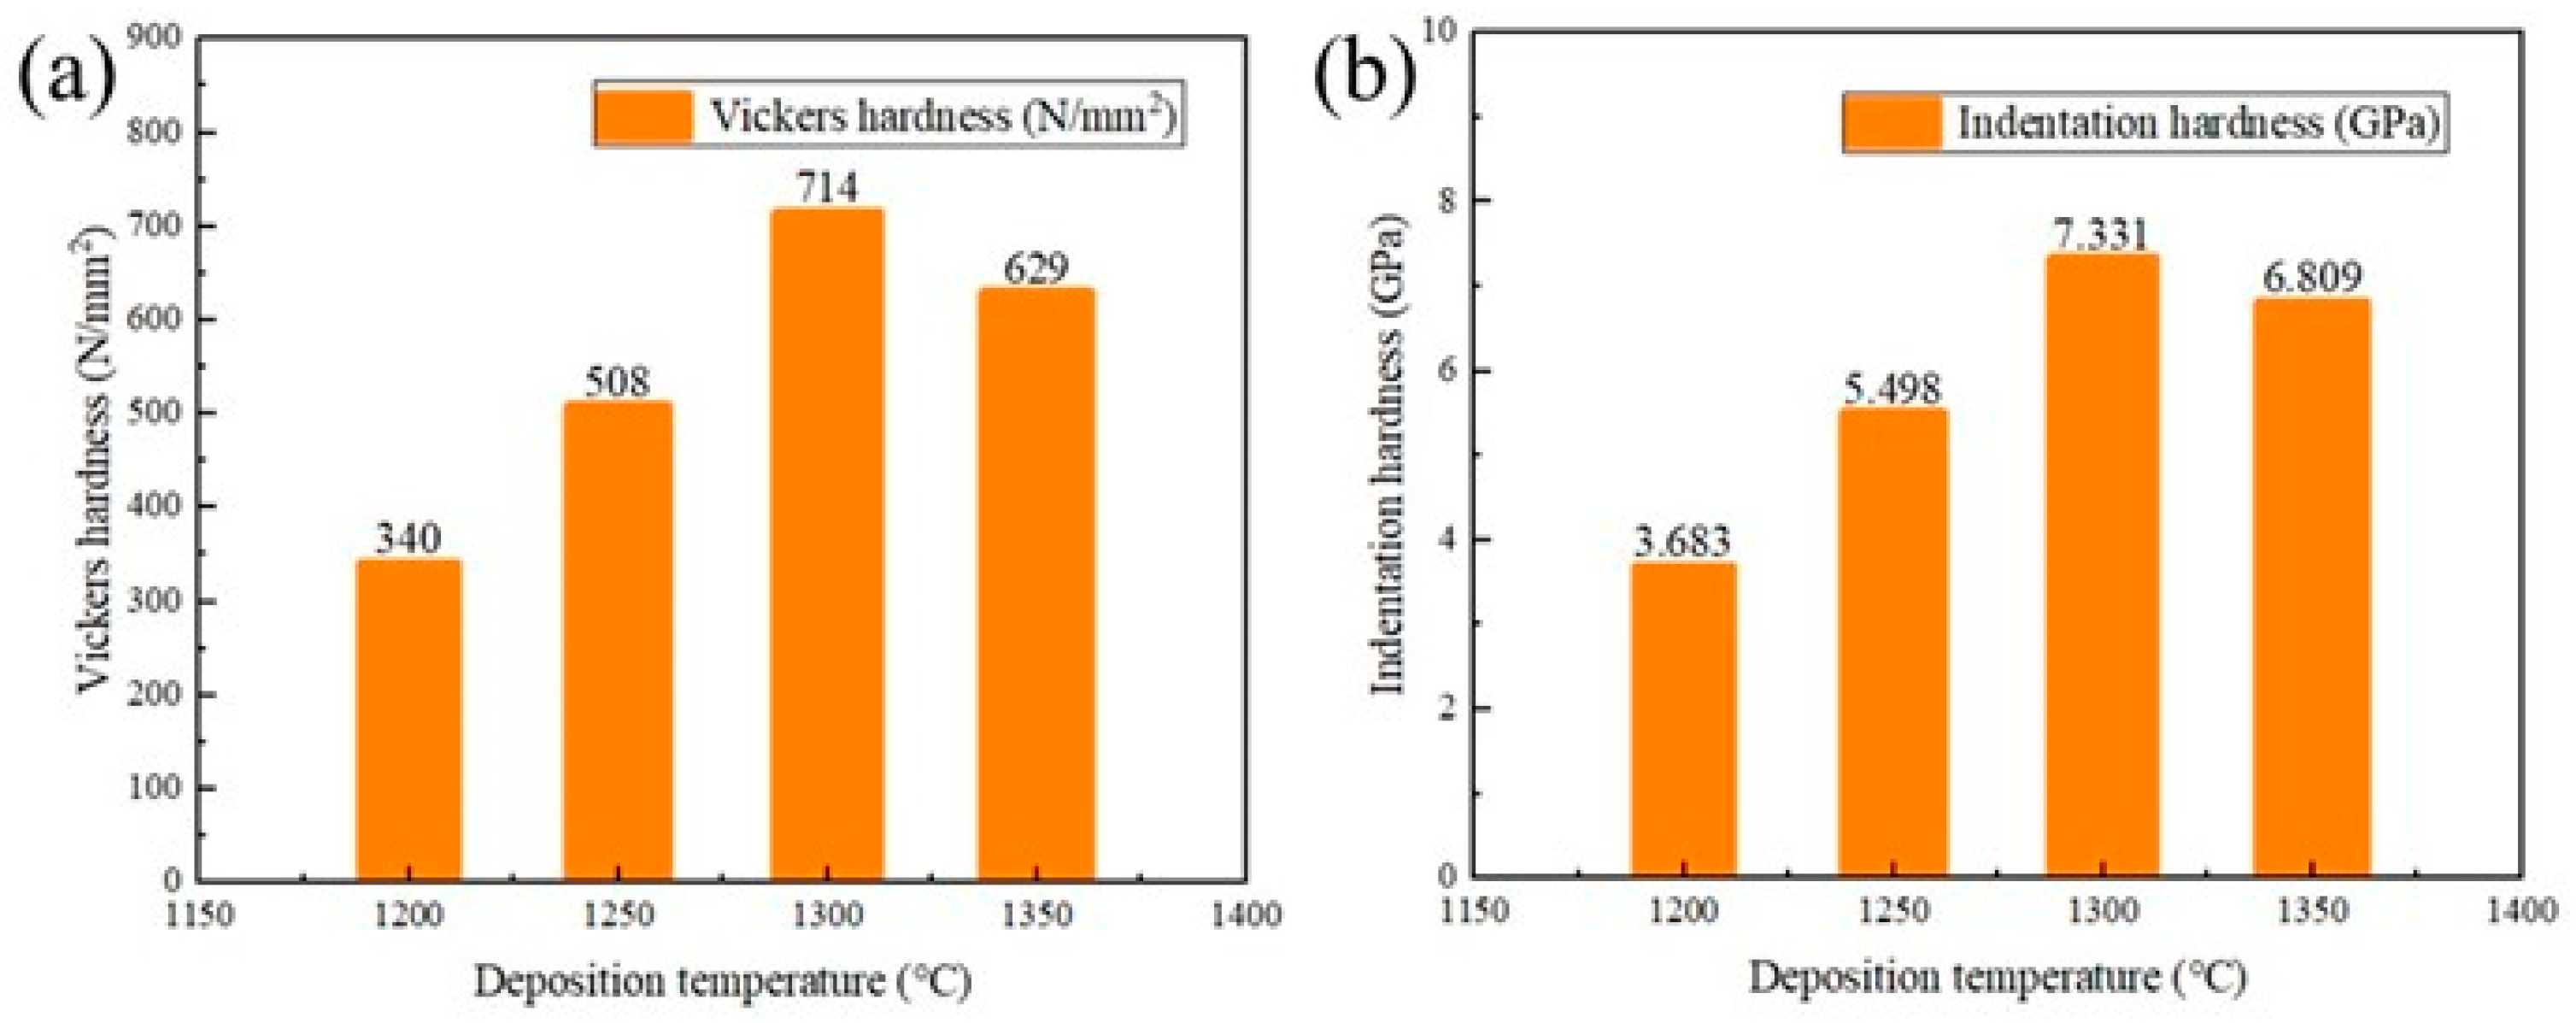
It can be seen from Figure 9 that the indentation hardness value measured by the nanoindentation method increases first and then decreases with an increase in the deposition temperature, and the indentation hardness can be converted to the Vickers hardness by the following formula:
H V = H I T × A p g n × A s = 0.0924 × H I T
where HV is the Vickers hardness, HIT is the indentation hardness, Ap is the contact projection area under the corresponding load, gn is the gravitational acceleration, usually 9.80665 m/s2, and As (mm2) is the surface area of the material indentation.
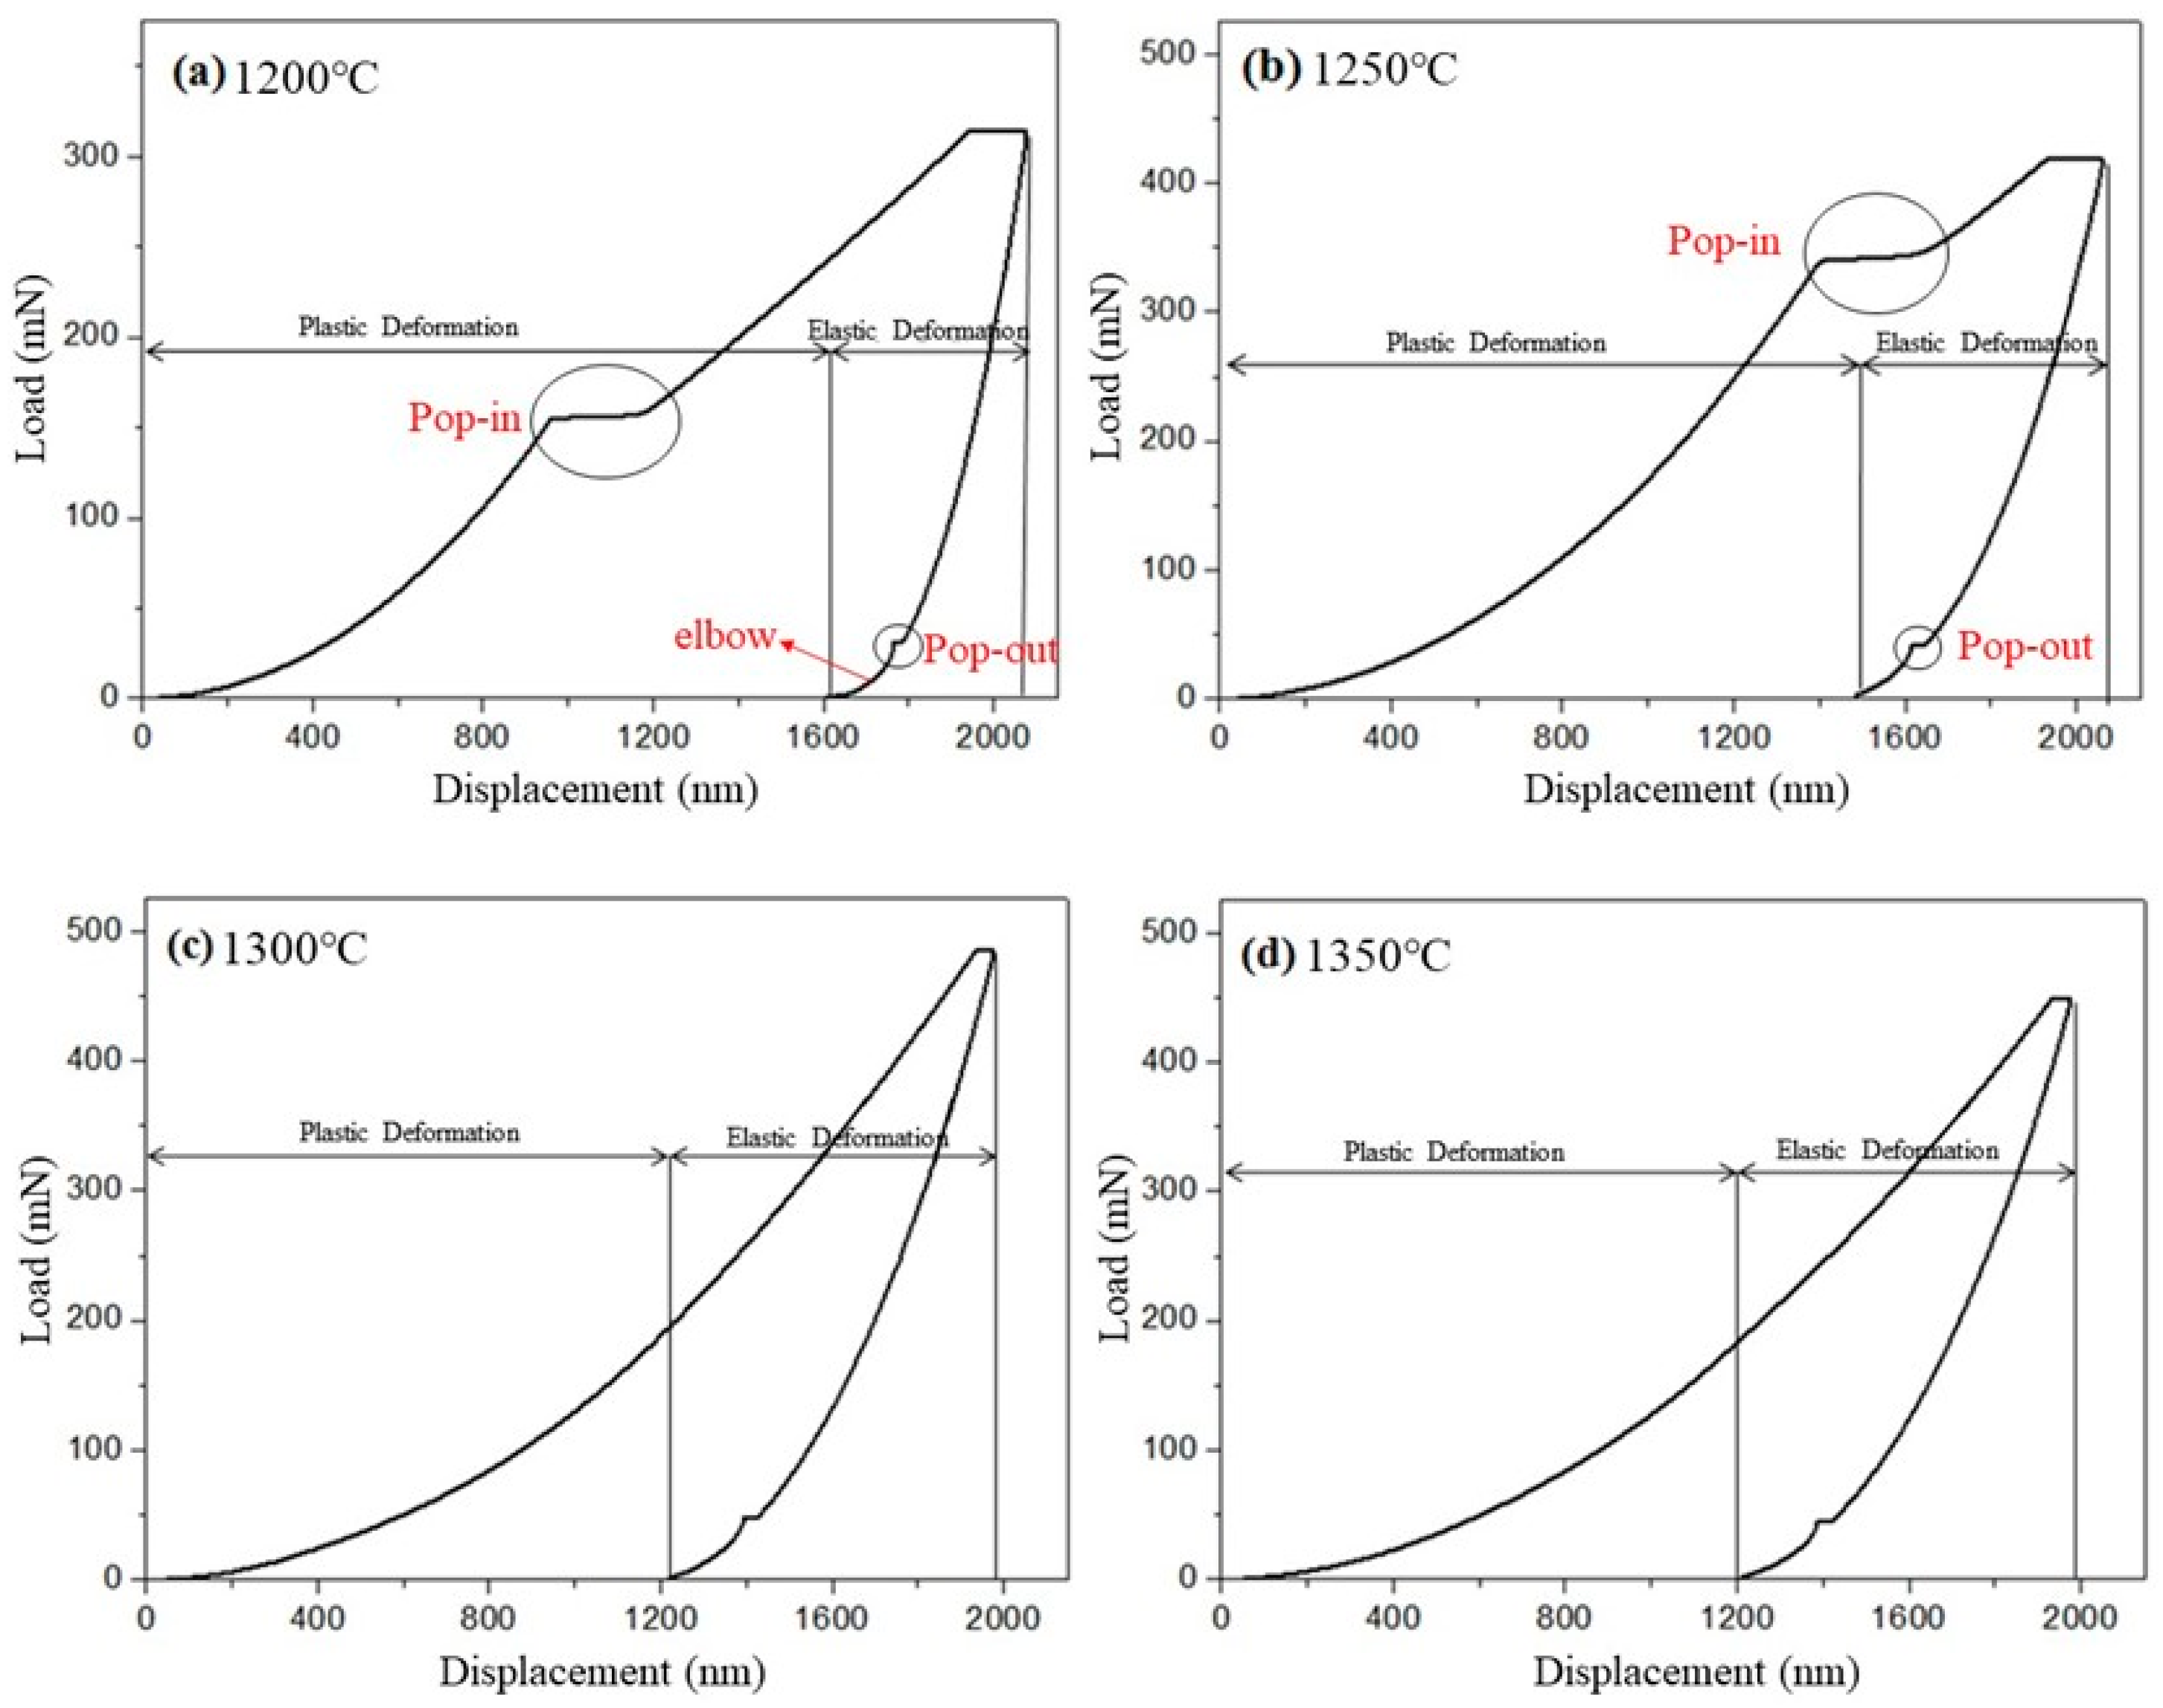
It can be seen from Figure 10 that the indentation depth during nanoindentation is only 2 µm, so the hardness of the coating is determined by the bonding between the particles constituting the coating and the deformation resistance of the coating.
As shown in Figure 9 and Figure 10, when the deposition temperature is 1200 °C, the surface coating of the substrate is composed of non-uniform particle point-like protrusions. These point-like protrusions are small-sized HfO2 particles that are discretely distributed and have a structure. When the indenter is pressed in, the particles are squeezed away from their original positions and filled to the periphery, resulting in a lower hardness of the coating prepared at this deposition temperature. When the displacement is 0–900 nm, the indenter contacts the surface of the coating, and the HfO2 coating begins to produce plastic deformation. Due to the small load, the surface particles will not have an excessive reaction force to the indenter, and the displacement increases with an increase in the load. When the displacement is between 900 nm and 1200 nm, a large depth pop-in appears. This is because the large enough load breaks the small particles around the indenter, and the indenter loses its support instantly, and the driving load will push the indenter to continue to move forward, corresponding to a deep sag on the load-displacement curve. When the displacement is 1200–1900 nm, the load continues to increase, because the probe touches the surface of the HfO2 coating again, so the load continues to increase. When the displacement is between 1900 nm and 2000 nm, the load has a plateau again. At this time, it is in a load-holding process that increases between the loading and unloading, that is, by keeping the load of the indenter unchanged for a certain period of time, the displacement of the indenter will continue to increase. The displacement curve will show a plateau phase. This is because, in the holding stage, the coating has a room temperature creep phenomenon. During the loading process, the movement of the HfO2 crystals being squeezed by the indenter is inhibited, and it is fully developed in the holding stage, which has obvious creep deformation in the maximum load. During the unloading stage of the indentation curve, a pop-out phenomenon can be clearly seen. The reason is that the indenter is elastically restored by the sample, and the abrupt retreat point is the critical point of the transition from elastic deformation to plastic deformation, and there is an elbow phenomenon.
When the deposition temperature is 1250 °C, the coating is mainly in the formation stage of the cellular HfO2 particles. At this time, the cellular HfO2 particles in the coating are mainly formed by clusters of small HfO2 particles, but the fusion degree of the HfO2 small particles that is higher than that of 1300 °C is low; when the coating is compressed, there are still some small column particles that can rotate to increase the number of particles that undergo plastic deformation under compression. At this time, the deformation resistance is relatively small, but the hardness value is still large, and with nanoindentation, the dash phenomenon is larger than the displacement at 1200 °C. The depth of plastic indentation reflects the size of elastic recovery during unloading. The smaller the depth of plastic indentation, the greater the recovery elasticity. The final load of plastic deformation at 1250 °C is lower than 1200 °C, indicating that the elastic recovery is larger at 1250 °C. This is because the small particles grow up and start to fuse, which is consistent with the surface topography analysis.
When the deposition temperature is 1300 °C, the coating is mainly formed by stacking cellular HfO2 particles layer by layer. At this time, the HfO2 small particles constituting the cellular particles in the coating have a certain degree of fusion, so when the coating is compressed, the particles produce plasticity. At this time, only the columnar particles with the better median orientation of the cellular particles are deformed, and the deformation resistance is large, so the hardness value is the highest. Because the coating deposition is relatively uniform, the cell-like particles completely cover the surface of the substrate, and there are almost no micro-cracks or micro-holes, so there is no unloading and sudden retreat, and the platform disappears. The coating has good hardness and an elastic modulus. Therefore, the nano load increases with the displacement almost all of the way [23].
When the deposition temperature is 1350 °C, the prepared coating is mainly composed of columnar HfO2 particles. The HfO2 coating is first agglomerated and then deposited, which makes the structure loose. Under certain pressure, plastic deformation occurs, so that the hardness value of the coating will decrease to a certain extent. The value of the maximum pressure of the nanoindentation load-displacement curve is smaller than that at 1300 °C. This is because the temperature continues to increase, and the hardness and elastic modulus decrease. Therefore, the maximum load that the HfO2 coating can bear when the deposition temperature is 1350 °C is reduced.
The analysis results of the hardness and nanoindentation load-displacement curves show that the coating undergoes plastic deformation during the loading process, and the amount of plastic deformation decreases with an increase in the deposition temperature. The unloading curve is a non-vertical abscissa curve, indicating that the coating has elastic recovery during the unloading process, and the elastic recovery of the coating increases with an increase in the deposition temperature. The indentation hardness and Vickers hardness first increased and then decreased, with an increase in the deposition temperature, and reached a maximum value at 1300 °C, which was 7.331 GPa and 714 N/mm2, respectively.

4. Conclusions

These experiments investigated the performance of HfO2 coatings deposited by CVD on Mo substrates at different temperatures. At different deposition temperatures, the deposited HfO2 coatings were all monoclinic structures at room temperature, and the grain growth trends of the coatings at different deposition temperatures were along the (022), (220), and (013) crystal planes. As the deposition temperature increased, the HfO2 particles on the surface of the film continued to grow in clusters and gradually merged into cellular HfO2 particles, and the particle size gradually increased. The thickness of the film increased first and then decreased with an increase in the deposition temperature, and reached a maximum value of about 10 μm (s) when the deposition temperature was 1300 °C. The surface roughness of the coating increased first and then decreased with an increase in temperature and reached the maximum at the deposition temperature of 1250 °C. The density and relative density both increased first and then decreased, reaching a peak at 1300 °C, which were 9.622 g/cm3 and 99.19%. When the deposition temperature was 1300 °C, the mechanical properties of the coating were the best, and the hardness was 7.331 GPa. Therefore, at 1300 °C, the overall performance of the coating was optimized.

Author Contributions

Data curation, J.Z. and X.L.; Methodology, X.W. (Xian Wang), Y.W., J.H., G.Z., X.W. (Xingqiang Wang) and X.Z.; Writing—original draft, M.B.; Writing—review & editing, Y.L., H.C., X.W. (Xiao Wang) and C.H. All authors have read and agreed to the published version of the manuscript.

Funding

This research was funded by the National Science Foundation of China (Grant Nos. 51361014 and 51661014) and Excellent Youth Project of Yunnan Basic Research Program (Grant No. 2019FI020).

Institutional Review Board Statement

Not applicable.

Informed Consent Statement

Not applicable.

Data Availability Statement

Not applicable.

Conflicts of Interest

The authors declare no conflict of interest.

References

  1. Xu, B.S.; He, R.J.; Hong, C.Q. Ablation behavior and mechanism of double-layer ZrB2-based ceramic coating for lightweight carbon-bonded carbonfiber composites under oxyacetylene torch at elevate temperature. J. Alloy Comp. 2018, 702, 551–561. [Google Scholar] [CrossRef]
  2. Ren, X.R.; Mo, H.S.; Wang, W.H. Ultrahigh temperature ceramic HfB2-SiC coating by liquid phase sintering method to protect carbon materials from oxidation. Mater. Chem. Phys. 2018, 217, 504–512. [Google Scholar] [CrossRef]
  3. Yoo, H.; Kim, H.S.; Hong, B.G. Hafnium carbide protective layer coatings on carbon/carbon composites deposited with a vacuum plasma spray coating method. J. Eur. Ceram. Soc. 2016, 36, 1581–1587. [Google Scholar] [CrossRef]
  4. Shiryaeva, S.; Baranova, A.; Kiselev, O. Hafnium oxide as a nanoradiosensitizer under X-Ray irradiation of aqueous organic systems: A model study using the spin-trapping technique and Monte Carlo simulations. J. Phys. Chem. C. 2019, 123, 27375–27384. [Google Scholar] [CrossRef]
  5. Choi, H.H.; Jaesung, P.; Huh, O.S. Photoelectric memory effect in graphene heterostructure field-effect transistors based on dual dielectrics. ACS Photonics 2018, 5, 329–336. [Google Scholar] [CrossRef]
  6. Ramavenkateswari, K.; Venkatachalam, P. Proficiency of acceptor-donor-acceptor organic dye with Spiro-MeOTAD HTM on the photovoltaic performance of dye sensitized solar cell. Electron. Mater. Lett. 2016, 12, 628–637. [Google Scholar] [CrossRef]
  7. Jayaraman, V.; Sagadevan, S.; Sudhakar, R. Studies on optical and electrical properties of hafnium oxide nanoparticles. J. Electron. Mater. 2017, 46, 4392–4397. [Google Scholar] [CrossRef]
  8. Kumar, R.; Chauhana, V.; Koratkar, N. Influence of high energy ion irradiation on structural, morphological and optical properties of high-K dielectric hafnium oxide (HfO2) thin films grown by atomic layer deposition. J. Alloy. Compd. 2020, 931, 154698. [Google Scholar] [CrossRef]
  9. Nigro, R.L.; Schilirò, E.; Mannino, G. Comparison between thermal and plasma enhanced atomic layer deposition processes for the growth of HfO2 dielectric layers. J. Cryst. Growth 2020, 539, 125624. [Google Scholar] [CrossRef]
  10. Yu, Z.; Zhang, W.L.; Zhu, R. Structural, optical, chemical and laser damage resistant properties of HfO2 films deposited by reactive electron beam evaporation. J. China Laser 2020, 47, 170–176. [Google Scholar]
  11. Zhang, W.Q.; Xiong, Y.H.; Wei, F. Preparation and properties of Nd2O3 doped HfO2 High K gate dielectric films by ALD. Rare Met. 2017, 7, 780–784. [Google Scholar]
  12. Wang, H.P.; Stevens, R. Hafnia and hafnia-toughened ceramics. J. Mater. 1992, 27, 5397–5430. [Google Scholar] [CrossRef]
  13. Rammula, R.; Aarik, J.; Mändar, H. Atomic layer de-position of HfO2: Effect of structure development on growth rate, morphology and optical properties of thinfilms. Appl. Surf. Sci. 2010, 257, 1043–1052. [Google Scholar] [CrossRef]
  14. Lukosius, M.; Walczyk, C.H.; Fraschke, M. High performance metal–insulator–metal capacitors with atomic vapor deposited HfO2 dielectrics. Thin Solid Film. 2010, 518, 4380–4384. [Google Scholar] [CrossRef]
  15. Lukosius, M.; Dabrowski, J.; Wolff, A. Direct growth of HfO2 on graphene by CVD. J. Vac. Sci. Technol. B. 2015, 1, A110. [Google Scholar] [CrossRef]
  16. Wei, Y.; Xu, Q.; Wang, Z. Growth properties andoptical properties for HfO2 thinfilms deposited by atomic layer deposition. J. Alloy. Comp. 2018, 735, 1422–1426. [Google Scholar] [CrossRef]
  17. Gao, H.J.; Xiong, Y.Q.; Zhang, W.T. Principles of atomic layer deposition technology and its application in aerospace. J. J. Vac. Sci. Technol. 2022, 42, 237–243. [Google Scholar]
  18. Zhong, L.J.; Zhang, Z.H.; Stephen, A. Combinatorial CVD of ZrO2 or HfO2 compositional spreads with SiO2 for high K dielectrics. J. Mater. Chem. 2004, 14, 3203–3209. [Google Scholar] [CrossRef]
  19. Kang, B.R.; Kim, H.S. Characteristics of ZrC barrier coating on SiC-coated carbon/carbon composite developed by thermal spray process. Materials 2019, 12, 747. [Google Scholar] [CrossRef] [Green Version]
  20. Zhao, P. Preparation and Properties of Hafnium(IV) Oxide Films by Magnetron Sputtering; Dalian University of Technology: Dalian, China, 2019. [Google Scholar]
  21. Wan, Y.F.; Li, S.; Yang, P.Z. Progress in preparation and photoelectric properties of Hafnium oxide films. J. Yunnan Norm. Univ. 2021, 41, 12–21. [Google Scholar]
  22. Korotkov, R.Y.; Ricou, P.; Farran, J.E. Preferred orientations in polycrystalline SnO2 films grown by atmospheric pressure Chemical Vapor Deposition. J. Thin Solid Film. 2006, 502, 79–82. [Google Scholar] [CrossRef]
  23. Wang, Y.L.; Li, Z.H.; Xiong, X. Action mechanism of hydrogen gas on deposition of HfC coating using HfCl4-CH4-H2-Ar system. Appl. Surf. Sci. 2016, 390, 903–908. [Google Scholar] [CrossRef]
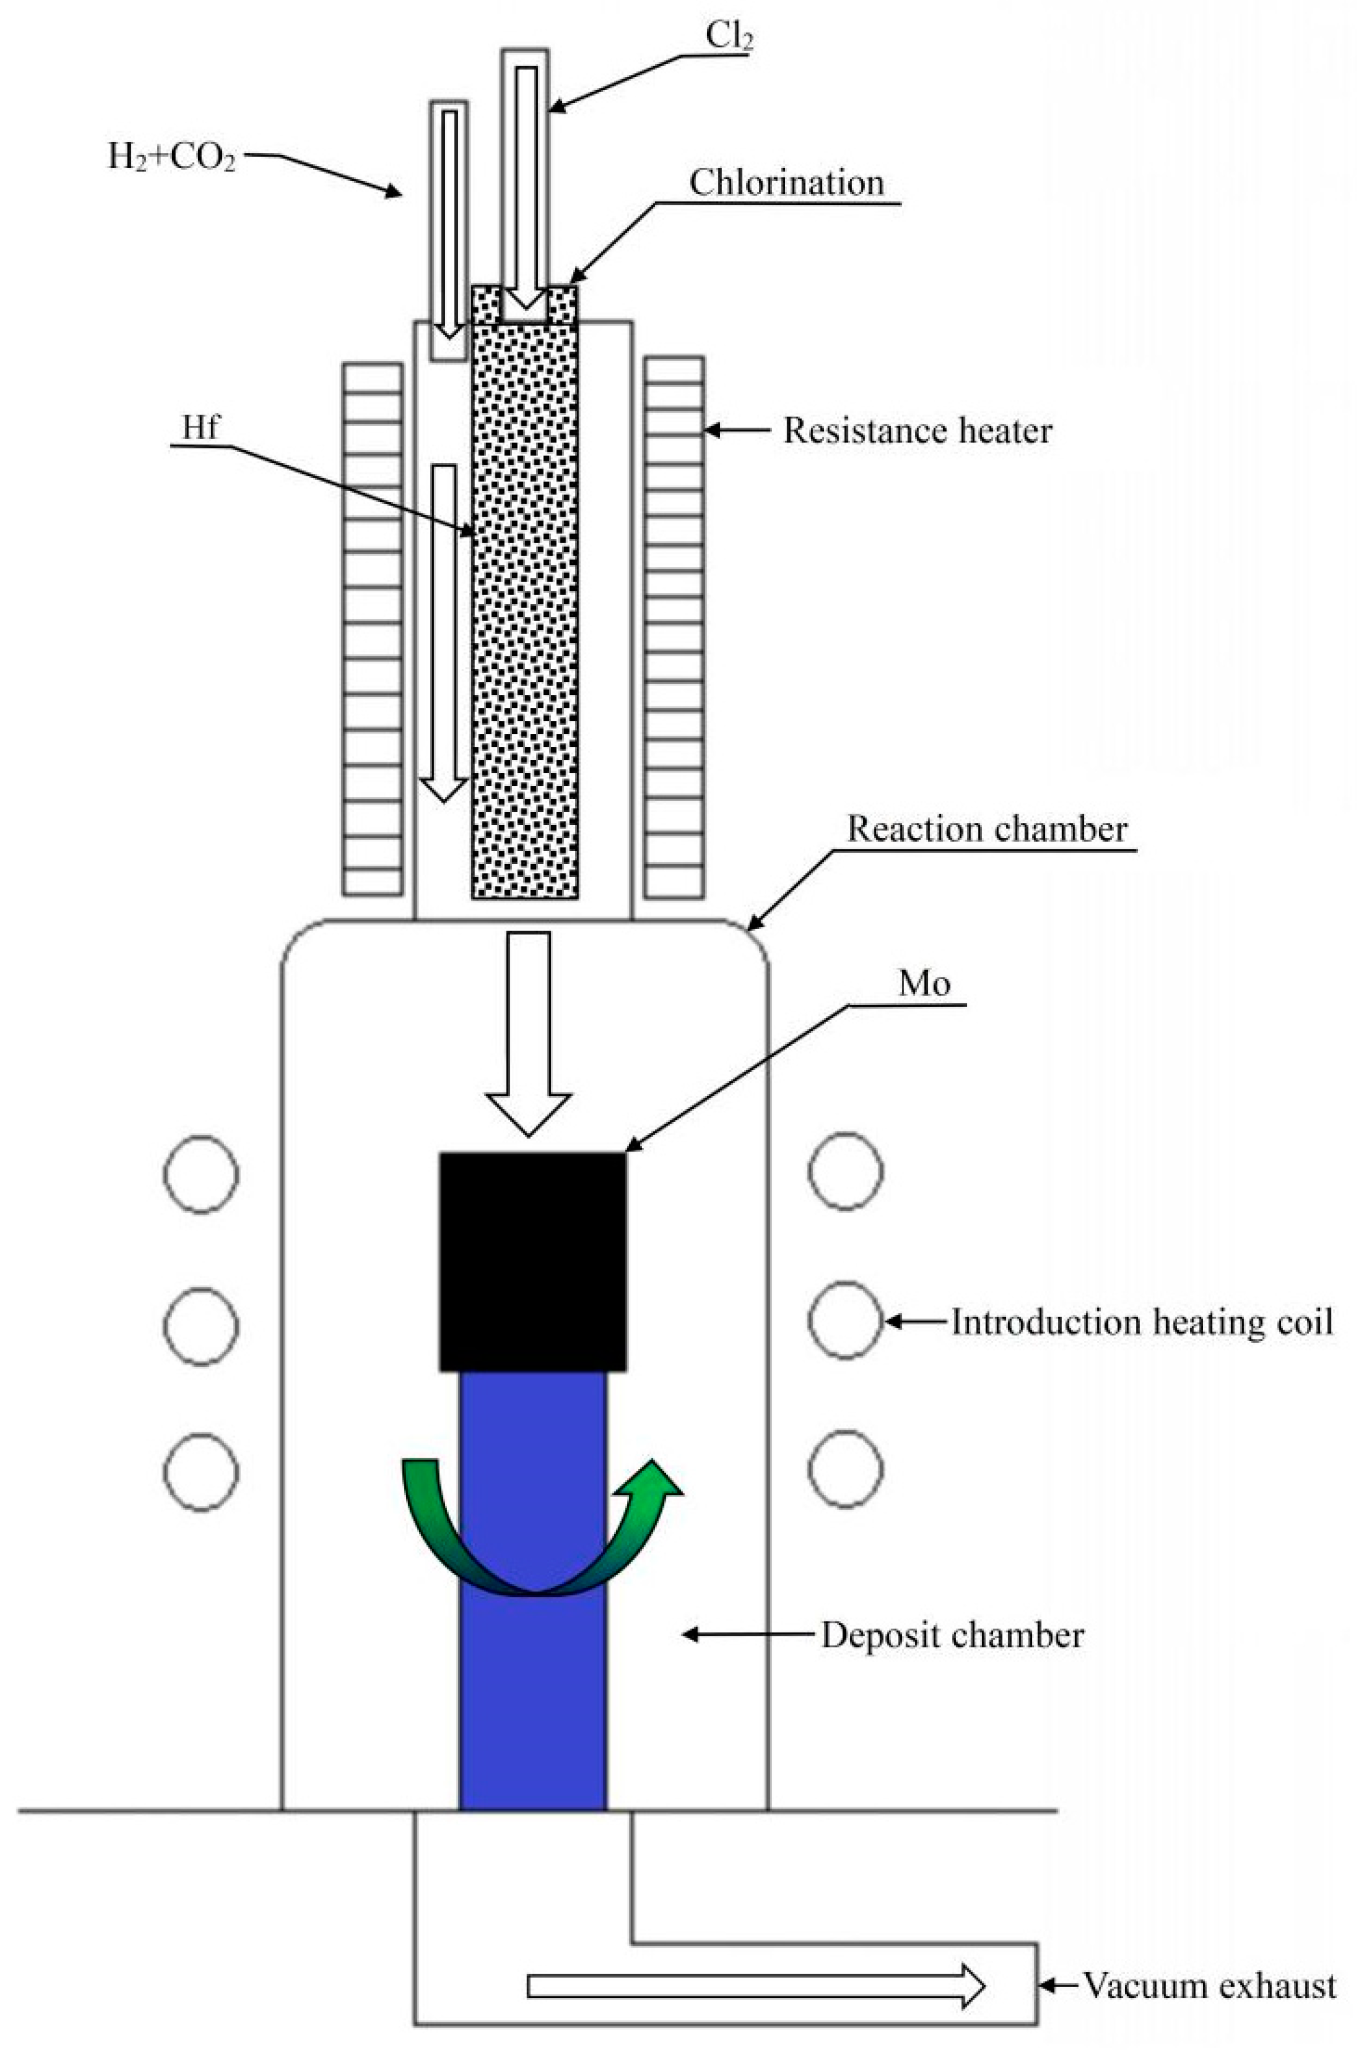
Figure 1. CVD schematic diagram.
Coatings 12 01731 g001
Figure 2. XRD patterns of HfO2 coatings deposited at different temperatures. (a) is the XRD diagram of HfO2 and (b) is standard XRD spectrum of HfO2.
Coatings 12 01731 g002
Figure 3. Surface morphology of HfO2 coatings prepared at different deposition temperatures. (a) 1200 °C, (b) 1200 °C, (c) 1250 °C, and (d) 1250 °C.
Coatings 12 01731 g003
Figure 4. Surface morphology of HfO2 coatings prepared at different deposition temperatures. (a) 1300 °C, (b) 1300 °C, (c) 1350 °C, and (d) 1350 °C.
Coatings 12 01731 g004
Figure 5. Thickness of HfO2 coatings prepared at different deposition temperatures. (a) 1200 °C, (b) 1250 °C, (c) 1300 °C, and (d) 1350 °C.
Coatings 12 01731 g005
Figure 6. AFM images of HfO2 coatings prepared at different deposition temperatures. (a) 1200 °C; (b) 1200 °C; (c) 1250 °C; (d) 1250 °C; (e) 1300 °C; (f) 1300 °C; (g) 1350 °C; (h) 1350 °C.
Coatings 12 01731 g006
Figure 7. Surface roughness (Rq)/nm of HfO2 coatings prepared at different deposition temperatures.
Coatings 12 01731 g007
Figure 8. The relationship between the deposition temperature and the density and relative density of HfO2 coatings. (a) is density and (b) is relative density.
Coatings 12 01731 g008
Figure 9. The relationship between deposition temperature and hardness of HfO2 coatings. (a) is Vickers hardness and (b) is indentation hardness.
Coatings 12 01731 g009
Figure 10. Load-deformation curves of CVD HfO2 coatings prepared at different temperatures. (a) 1200 °C; (b) 1250 °C; (c) 1300 °C; (d) 1350 °C.
Coatings 12 01731 g010
Table 1. Reactants’ Gibbs free energy function and Gibbs free energy function of the reaction when HfCl4, H2, and CO2 react to generate HfO2.
Temperature (K)ΦT
(HfCl4)
(J·mol−1·K−1)
ΦT
(H2)
(J·mol−1·K−1)
ΦT
(CO2)
(J·mol−1·K−1)
ΦT
(HfO2)
(J·mol−1·K−1)
ΦT
(CO)
(J·mol−1·K−1)
ΦT
(HCl)
(J·mol−1·K−1)
Δ Φ T
(J·mol−1·K−1)
ΔGT
(J·mol·K −1)
300190.793130.584213.63659.33197.528186.775322.253−21,781
400195.609131.718215.17861.811198.682187.918321.446−53,684
500204.821133.859218.2366.693200.877190.073319.74−84,976
600218.339136.263221.77872.338203.355192.492314.595−213,442
700252.252138.683225.4478.135205.861194.927289.067−227,032
800279.591141.03229.05883.84208.299197.29269.831−240,550
900302.341143.272232.56889.352210.635199.551254.805−254,010
1000321.731145.403235.94694.638212.86201.703242.741−267,426
1100338.572147.425239.18799.689214.977203.748232.839−280,808
1200353.42149.344242.292104.512216.99205.692224.568−294,167
1300366.673151.169245.268109.12218.907207.544217.563−307,517
1400378.624152.906248.124113.526220.735209.31211.552−320,858
1500389.495154.564250.867117.745222.483210.998206.346−334,204
1600399.456156.149253.507121.792224.156212.614201.792−347,552
1700408.642157.667256.05125.679225.76214.165197.783−360,916
1800417.16159.123258.504129.419227.302215.657194.237−374,312
1900425.097160.524260.876133.022228.787217.093191.071−387,720
2000432.525161.872263.171136.572230.218218.478188.309−390,843
Table 2. The relationship between the texture coefficient and deposition temperature.
(−111)(111)(002)(020)(200)(022)(220)(013)
1200 °C0.7000.6961.5690.8260.5351.1890.7781.707
1250 °C0.7070.7971.1250.8830.8231.1801.0191.469
1300 °C0.7390.8030.9500.9760.9151.1801.0551.383
1350 °C0.7500.7810.9190.9640.8681.1211.2561.340
Publisher’s Note: MDPI stays neutral with regard to jurisdictional claims in published maps and institutional affiliations.