Abstract
In this paper, TiB2-Chitosan coating was successfully fabricated on the surface of 6Cr13 martensitic stainless steel by electrophoretic deposition. The effects of different deposition voltage and deposition time on the coating morphology were investigated. The adhesion strength of the coating was characterized by Rockwell indentation, and it was proved that the adhesion strength of the coating was within HF1 degree. The corrosion resistance of coatings with different immersion time was studied by electrochemical test. The result shows that the 40 V/60 s sample has optimal comprehensive performance, and the TiB2-Chitosan coating can significantly improve the corrosion resistance of the substrate. The corrosion resistance of the coating decreases with the prolongation of the immersion time.
1. Introduction
Martensitic stainless steel (MSS) has good strength, hardness, appropriate corrosion resistance, and is widely used in the production of engines, steam turbines, valves, cutting tools, and other equipment [1]. 6Cr13 martensitic stainless steel is usually used to manufacture razor blades and scalpels [2]. The corrosion resistance of 6Cr13 is relatively poor, and its service conditions are easy to contact with corrosive media, which greatly limits the use of the 6Cr13. Now, surface modification technologies have been widely studied as an effective way to improve the corrosion resistance of materials. Generally, surface modification technologies include thermal spraying [3], vapor deposition [4], laser cladding [5], electroplating [6], electrophoresis, and other processes. Among them, electrophoretic deposition (EPD), as a green surface treatment technology, has received the attention of scholars.
EPD coating was prepared by depositing charged particles of the suspension on the surface of the workpiece under the action of an external electric field [7]. Because it is not affected by the surface shape of the workpiece, and the thickness of the coating is uniform, it is widely used in industrial and medical fields. According to the previous study [8,9,10,11], the conductivity, concentration of the suspension, the charge density of the particle surface, and relative parameters of the electric field can influence the result of the EPD. The composition of the coating also has a great impact on EPD. The ceramic material can be used as the coating material due to its good mechanical properties and corrosion resistance. The application of ceramic includes high-temperature structural materials, cutting tools, and weapon armor materials [12]. Among them, TiB2 has high thermal stability, high hardness, high modulus of elasticity, and high electrical conductivity [13]. Now, TiB2 coating has been used to improve the abrasion resistance of materials. The wear resistance and mechanical properties of TiB2 coating were investigated by many researchers [14,15]. The results proved that the TiB2 coating can enhance the wear resistance and prolong the service life of tools. Many scholars have also tried to use EPD to prepare TiB2 coatings. However, it is hard to form the stable suspension with TiB2 particles. Then, the researchers [16,17,18] found that Chitosan can be used in the process of EPD, which can promote the deposition of the particles. The research shows that Chitosan can act as a linking agent in the EPD process of particles and achieve the uniform and efficient deposition of particles. Chitosan is one of the cationic polymers, as a natural amino polysaccharide, it dissolves in the acidic environment [19]. Now, Chitosan has widely used in pharmaceutical and industrial fields and widely used in the manufacture of composite coatings [20,21,22]. By using the Chitosan, the researcher [23] has successfully prepared TiB2-Chitosan coating on the titanium surface.
TiB2 has good mechanical properties, while Chitosan has good antimicrobial properties. TiB2-Chitosan coatings have great potential for surgical tool coating. At present, the research on the TiB2 coating of MSS mainly focuses on the wear resistance and mechanical properties, while the research on the corrosion resistance of TiB2-Chitosan coating on 6Cr13 MSS has not been reported yet. Therefore, it is necessary to evaluate the corrosion resistance of TiB2-Chitosan coating. In this work, TiB2-Chitosan coating was deposited on the surface of 6Cr13 martensitic stainless steel via EPD technology. The effect of process parameters (applied voltage; deposition time) on the microstructure; thickness and adhesion behavior of TiB2-Chitosan coatings have been investigated. The effect of TiB2-Chitosan coating on the corrosion resistance of martensitic stainless steel was discussed, and the relationship between the corrosion resistance and different immersion time was also explored.
2. Experimental Methods and Materials
The commercial TiB2 powder (particle size of 3∼5 μm, purity 99.9%, Guangzhou metallurgy, Guangzhou, China) was ball milled by using the SiC milling balls for 4 h in a planetary ball mill (DSP-LGB04, Shenzhen disperse Equipment, Shenzhen, China) with both revolution and rotation speed of 120 rpm. Then, the suspension was prepared with TiB2 powder (5 g/L), Chitosan (1 g/L, Henan Jiayuan Biotechnology, Zhengzhou, Henan, China), and ethanol (purity 99.9%, Sinopharm, Beijing, China). Firstly, the 1% acetic acid solution purity 99.9%, Sinopharm, Beijing China) was used to dissolve the Chitosan. Then, TiB2 powder and ethanol were added to the beaker (the volume ratio of TiB2 suspension to Chitosan solution is 7:3). According to the previous work [23], the maximum value of Zeta potential occurred when the pH of the suspension reached 3. The pH of the suspension was adjusted to 3 with HNO3. Then, the suspension was stirred with a magnetic stirrer for 30 min and ultrasonically dispersed for 30 min to ensure the uniformity of the suspension.
The chemical composition of 6Cr13 MSS (Ningbo Branch of China Academy of Weapon Science, Ningbo, China) used in the experiment was shown in Table 1. 6Cr13 MSS were cut into 15 × 15 × 1 mm3 pieces. The pieces were first ground and polished, and then pickled and alkali (using HCl and NaOH) washed to remove the surface passivation layer. After that, the pieces were ultrasonically cleaned in ethanol for 30 min. The process of the EPD was carried out in a 100 mL glass beaker. The cathode and anode of EPD were 6Cr13 MSS pieces and the distance of the electrical anode was 1 cm. The EPD process was performed at voltages of 20, 40, and 60 V, and the deposition time was set at 30, 60, and 120 s. After deposition, EPD samples were dried at room temperature for a day. The experimental flow was shown in Figure 1.

Table 1.
Chemical composition of 6Cr13 martensitic stainless steel.
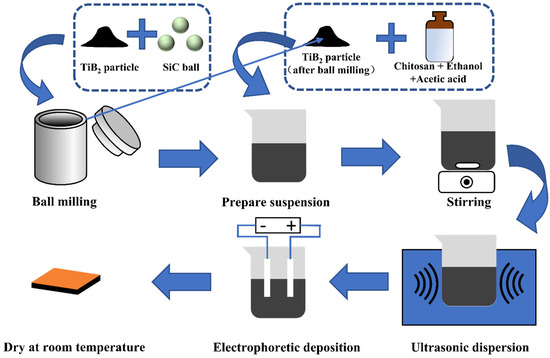
Figure 1.
The experiment flows.
The crystal structure of the TiB2-Chitosan coating was analyzed by X-ray diffraction (XRD) (Rigaku Miniflex 600, Rigaku, Akishima City, Japan), using Cu Kα radiation scanning from 10∼90° with 0.05° step size. The composition of the coating was determined using Raman spectroscopy (RenCam, Renishaw, New Mills, UK), using a 532 nm laser with a test range of 100∼4000 cm−1. The microstructure of the coating was observed by Scanning Electron Microscope (SEM, JEOL JSM-6510, Tokyo, Japan). Besides, Energy Diffraction Spectroscopy (EDS, OXFORD X-200max, Rigaku, Akishima City, Japan) was used to investigate the distribution of the element on the sample surface. In addition, the hardness test through the Rockwell C method according to VDI 3198 guideline [24] was used to evaluate the adhesion strength of the coating. 5 different areas were selected for the indentation test, and the distance between indentations is more than 5 mm.
The optimal coating sample was immersed in 3.5% NaCl solution at different times (1 h, 1 day, and 1 week). The electrochemical measurements were performed in 3.5% NaCl solution by a CHI760E electrochemical workstation (CH Instruments, Bee Cave, TX, USA). The three-electrode system (including a platinum plate as a counter electrode and a saturated Ag/AgCl was used for the electrochemical test. Electrochemical impedance spectroscopy measurements (EIS) were performed at 0.01∼105 Hz. Polarization tests were performed at a scan speed of 0.001 V/s.
3. Results and Discussion
3.1. Characterization of Suspension and TiB2 and Chitosan Powder
From Figure 2a, the powder of TiB2 is agglomerated spherical particles. According to the result, the average diameter of TiB2 powder after ball milling is about 1 μm. The XRD result shows that all the characteristic peaks belong to the TiB2 phase. The Chitosan shows irregular particles, of which the average size is about 5 μm, in Figure 2b. Roman spectroscopy of TiB2 and Chitosan are shown in Figure 2c. The peaks of TiB2 are mainly concentrated in the range of 100∼2000 cm−1, and its main peaks include 152.64, 403.71, 605.59, 1348.71, and 1572.62 cm−1, while the peaks of Chitosan are concentrated in the range of 1000∼1500 cm−1, except for the single peak at 2885.84 cm−1.
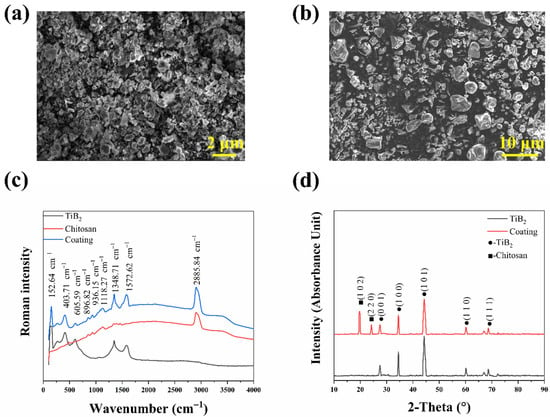
Figure 2.
(a) Microstructure of the TiB2 particles, (b) Microstructure of Chitosan, (c) Raman spectroscopy of powders and coating, (d) The XRD pattern of the TiB2 and coating.
Figure 3 shows the suspension with different concentrations of TiB2 and Chitosan after standing for 12h. The suspension contains 2.5 g/L TiB2 with 0.5 g/L Chitosan precipitated. The suspensions with 5 g/L TiB2 show more stability. When the concentration of TiB2 reached 10 g/L, the suspension was reprecipitated. In addition, the suspension with 1 g/L Chitosan shows better stability than the suspension with 0.5 g/L Chitosan.
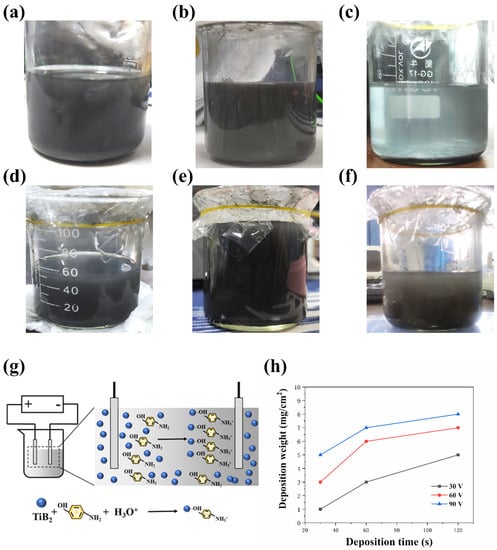
Figure 3.
The suspensions with different concentration of TiB2 and Chitosan: (a) 2.5 g/L TiB2 and 0.5 g/L Chitosan, (b) 5 g/L TiB2 and 0.5 g/L Chitosan, (c) 10 g/L TiB2 and 0.5 g/L Chitosan, (d) 2.5 g/L TiB2 and 1 g/L Chitosan, (e) 5 g/L TiB2 and 1 g/L Chitosan, (f) 10 g/L TiB2 and 1 g/L Chitosan (g) The mechanism of the EPD, (h) The deposition weight of different samples.
The particles in the suspension are deposited on the electrode surface under the electric field during the EPD process. The behavior of particles in suspension has a great influence on the EPD process. The lower concentration of suspension may not have enough available particles to form a uniform and dense coating. However, agglomeration easily occurs between the particles in higher concentration suspension, which is difficult to deposit on the electrode surface [25]. Since the stable suspension cannot be formed by ethanol and TiB2, the formation of the suspension mainly depends on the combination of Chitosan molecules and TiB2. Chitosan is protonated under acidic conditions and combines TiB2 particles via the –OH site [16]. A higher concentration of Chitosan can bind more TiB2 particles. Therefore, in suspension with 0.5 g/L Chitosan, TiB2 particles will precipitate, while in suspension with 1 g/L Chitosan, precipitation will weaken or even disappear. The suspension with high stability ensures a uniform and dense coating can be formed during EPD. After comparison, the suspension with 5 g/L TiB2 and 1 g/L Chitosan was used to deposit the coating.
3.2. Electrophoretic Deposition
3.2.1. Deposition Weight
The molecular structure of Chitosan contains –OH and –NH2 [17]. The –NH2 of Chitosan will be protonated to form –NH3+ in the pH = 3 suspension. While TiB2 particles will combine the –OH site of Chitosan and then deposit on the cathode surface under the electric field [16], the process is shown in Figure 3g. On the cathode surface, the positively charged TiB2–Chitosan groups lose their charge and form an insoluble coating.
The deposition weight was calculated by the following equation:
where Wc is the deposition weight, and W1 and W0 are the weight of the sample before and after the deposition process. The relationship between deposition weight and the deposition parameters can be described as [26]:
where C is the concentration of particles in the suspension, μ is the mobility of the particles, U is the applied voltage, t is the time of the EPD process, and d is the distance between two electrodes. From the equation, it could know that the deposition weight is proportional to deposition voltage and deposition time. This indicates that the deposition weight will increase with the increase of the deposition voltage and deposition time. The result of the deposition weight shows that the deposition weight has a linear relationship with applied voltage and time (Figure 3h). It also could know that the deposition weight deviated from the linear pattern when extending the deposition time to 120 s.
Coating properties in the EPD process are mainly controlled by the deposition parameters. The charged particles of the suspension move under the action of the electric field and deposit on the substrate. The charge amount varies between different groups due to the possibility of agglomeration between particles. The deposition of larger charged particle clusters requires higher voltages [27]. Prolonging the deposition time can make more particles deposited on the surface of the substrate, increasing the deposition weight. The decrease in the deposition weight was related to the increase in the thickness of the coating. In the previous work [28], Majid Kavanlouei found that the decrease of the sticking factor becomes slow when the deposition time reaches 150 s. Fahimeh Saberi [29] also found this phenomenon when depositing ZrO2 coatings with extended deposition time. The reason was attributed to the variation in the concentration of the suspension. Therefore, it can be concluded that the decrease in deposition weight at 120 s may be due to the decrease in the concentration of the suspension and the changes in the electrical field intensity [30]. The two elements will change during the process of EPD, and it may break the relationship between deposition weight and deposition parameters.
3.2.2. Microstructure of the Coating
Figure 4 shows the microstructures of the samples with different deposition parameters. It can be observed that some gray particles have deposited on the substrate and the thickness of the coating is approximately achieved 15 μm. Combined with the result of EDS, the particles can be determined to be TiB2. According to Roman spectroscopy, the spectra of coating both contain the characteristic peaks of TiB2 and Chitosan. The XRD pattern of the coating also shows peaks of Chitosan and TiB2. Therefore, it can be concluded that the TiB2-Chitosan coating was successfully deposited on the surface of 6Cr13 MSS by EPD technology.
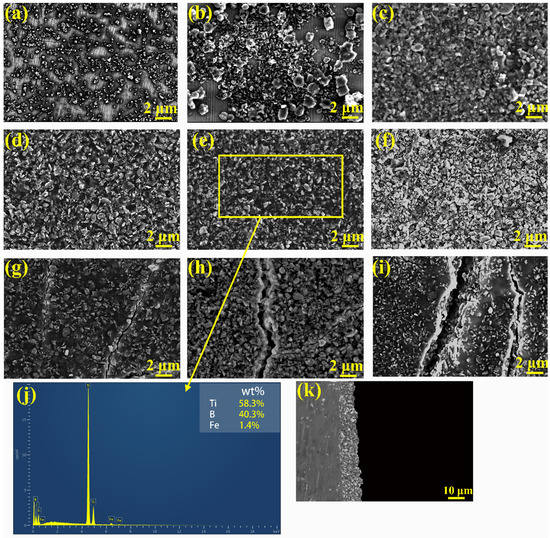
Figure 4.
Microstructures of the coating and the thickness of the coating: (a) 20 V, 30 s, (b) 20 V, 60 s, (c) 20 V, 120 s, (d) 40 V, 30 s, (e) 40 V, 60 s, (f) 40 V, 120 s, (g) 60 V, 30 s, (h) 60 V, 60 s, (i) 60 V, 120 s, (j) EDS results of coating and (k) thickness of the coating.
It can be observed that some areas are not coated when the deposition voltage is set at 20 V (Figure 4a,b). This is because lower deposition voltages do not have enough mobility for the particles to deposition. Then with the prolong of deposition time, the coating begins to cover the substrate, as shown in Figure 4c. When deposition voltage increases to 40 V (shown in Figure 4d–f), a uniform and dense coating can be observed on the substrate. Under measurement, the mass ratio of TiB2 and Chitosan in the layer is approximately about 0.98. When the deposition voltage reaches 60 V (shown in Figure 4g–i), cracks can be observed on the surface of the TiB2-Chitosan coating. The cracks become wider with the increase of the deposition time.
As mentioned above, the morphology of the coating is mainly affected by the deposition voltage and deposition time. Lower voltage will lead to poor mobility of charged particles, making it difficult to form a uniform and dense coating. The uniform coating will form when increasing the voltage to a suitable value. Then, further increasing the voltage will cause the occurrence of cracks. The form of cracks is related to the rise of the deposition voltage and the deposition time. The increasing voltage gives a high speed to the particles in front of the electrode. There is not enough time to form the dense coating at the appropriate location [31]. The area will become the source of the cracks and the cracks will grow with the extension of deposition time.
3.2.3. Evaluation of Adhesion Strength
VDI 3198 standards have been used to evaluate the adhesion strength of many coatings. The adhesion strength was measured by using the Rockwell C indention test. From the guideline of the VDI 3198 [32], the patterns of HF1∼HF4 represent that the coating has the accepted adhesion strength. As is known, the indentation can induce shear stress at the interface between the coating and substrate. The coating with good adhesion strength can withstand this shear stress, prohibit the extension of the microcracks, and avoid the occurrence of delamination. In general, the delamination near the indention indicates poor interfacial adhesion.
Figure 5 shows the indentation of the samples, and the result shows that the adhesion strength of the TiB2-Chitosan coating deposited at 40 V/30 s and 60 s samples can be classified as HF1 grade. It can be observed that the existence of the delamination phenomenon in the 120 s coated sample. From the microstructure of the sample after the test, there exists some microcracks and a little delamination phenomenon. The adhesion strength of TiB2-Chitosan coating is genially in the acceptable range.
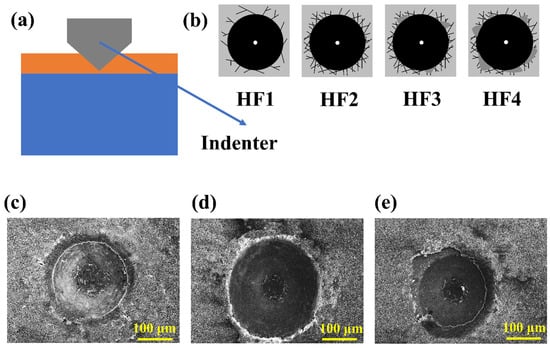
Figure 5.
(a) Schematic diagram of the indentation test, (b) Indentation image for acceptable adhesion strength. The indentation pattern of (c) sample with 40 V 30 s (d) sample with 40 V 60 s, and (e) sample with 40 V 120 s.
3.3. Corrosion Behavior
The corrosion behavior was investigated through the immersion test in 3.5% NaCl solution. Figure 6a shows the Tafel polarization curves with different immersion times. As shown in the polarization curves, it can be obviously seen that the samples with coating show better corrosion resistance. The corrosion potential (Ecorr) and corrosion current density (icorr) of different samples are shown in Table 2. The icorr was calculated by the Tafel extrapolation. The maximum value of Ecorr corresponds to the sample immersed for 1 h, and the values of Ecorr decrease with the prolongation of soaking time. The corrosion resistance of the material decreases gradually with the prolongation of immersion time. The Ecorr of the coated samples is higher than the −0.512 V of the original sample (without coating on it). With the prolongation of immersion time, the icorr of the coated samples decreased from 8.75 × 10⁻⁵A·cm−2 to 1.37 × 10⁻⁵A·cm−2. Generally, the larger the Ecorr and the smaller the icorr, the better the corrosion resistance of the material. From the results, the coating can effectively improve the corrosion resistance of 6Cr13 MSS.
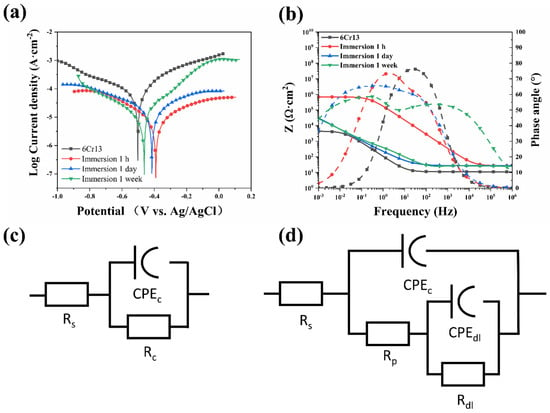
Figure 6.
(a) Polarization curves of the samples, (b) Bode plots of the samples, (c) The equivalent circuit used to fit the original sample, and (d) The equivalent circuit used to fit the coated sample.

Table 2.
The corrosion potential (Ecorr) and corrosion current density (icorr) of TiB2-Chitosan coating.
It can be seen from the polarization curve that the original sample exhibits the passivation phenomenon. The coated samples also showed the passivation phenomenon in the initial stage of immersion. This shows that the existence of the coating can protect the substrate. According to the research [33], the TiB2 coating prepared by thermal diffusion shows the phenomenon of anodic dissolution in the anode under corrosion. The phenomenon indicates that the aggressive ions in the corrosion medium pass through the microscopic pores and react with the steel of the matrix, causing the corrosion of the matrix. Combined with the test results, it shows that the coating at the initial stage of immersion is dense and can effectively prevent the penetration of corrosive media. It indicates that Chitosan fills the pores between TiB2 particles and hinders the penetration of aggressive ions and water molecules. In the research of Molaei [22], it was found that Chitosan effectively prevented the penetration of the corrosive medium by connecting with halloysite nanotube composite, and effectively improved the corrosion resistance. However, in the later stage of immersion, the coating is partially corroded, and microscopic pores appear on the coating. The corrosive medium penetrates the coating through the pores.
The EIS test was used to investigate the corrosion resistance of the coating. The EIS results and the equivalent circuit of the different samples are shown in Figure 6b–d. The EIS of the original sample and the initial stage of immersion were described by using the equivalent circuit shown in Figure 6c. The Rs is the resistance of the solution, and the constant phase element (CPE) was used to describe the capacitance of the coating whose behavior is non-ideal pure capacitance [20], Rc is the resistance of the passivation film or the coating. The equivalent circuit used to fit the impedance system of long-time immersion of coating is shown in Figure 5d. The two-time constant can be seen in the Bode plot. The time constant of the high-frequency band corresponds to the coating capacitance (CPEC) and micropore resistance (Rp). The time constant of the low-frequency band corresponds to the electric double layer capacitance (CPEdl) and the charge transfer resistance of the metal corrosion reaction (Rdl) [34]. The fitting results of each element in the equivalent circuit are shown in Table 3.

Table 3.
Fitting Parameters of the Equivalent Circuit.
From the result, the impedance of the TiB2-Chitosan coating sample shows a higher value than the original sample. The resistance of the original sample is about 1.26 × 10³ Ω and the resistance of coated samples increases to 4.337 × 10⁴ Ω. The value of resistance indicates that the coating has better corrosion resistance. It should be noted that with the increase of the immersion time, the value of resistance exhibits a decreasing trend. During the penetration of the solution, the value of the coating capacitance increases with prolonged immersion time, and at the same time, the resistance of the coating will decrease. The impedance curves in the Bode plot shift towards the low-frequency area and the phase angle begins to decrease. The corrosion micro-battery is formed at the interface, which destroys the integrity of the coating when the corrosive media reaches the interface between the coating and the substrate. With prolonged immersion time, the number of micropores increased and the integrity of the coating was destroyed. The corrosion resistance of the material will decrease.
Combined with the above discussion, it can be concluded that the TiB2-Chitosan coating prepared by the EPD process can achieve good adhesion strength and can improve the corrosion resistance of the 6Cr13 MSS.
4. Conclusions
In this study, TiB2-Chitosan coating was successfully deposited on 6Cr13 MSS substrate by using the EPD technology. It was found that the deposition weight of the coating increases gradually with the increase of deposition time in the initial stage. When the deposition voltage is above 40 V, cracks can be observed on the surface of the coating. The thickness of the coating was about 15 μm when the deposition voltage and deposition time are 40 V and 60 s, respectively. Simultaneously, the adhesion strength test proved that the adhesion strength of the coating was in HF1 grade. When the coating is deposited, the Ecorr of the coating sample increases from −0.512 to −0.386 V, which increased by 24.6% from the original sample. While the icorr decreased by 79.2%, indicating that the TiB2-Chitosan coating can significantly improve the corrosion resistance of 6Cr13 MSS. The corrosion resistance of the sample starts to decline gradually with the extension of immersion time. Because the TiB2-Chitosan coating has both corrosion resistance and antibacterial properties, it has broad application prospects in tool coating. The experimental results show that the coating can effectively improve the corrosion resistance of 6Cr13 MSS, which extends its service life. However, 6Cr13 is the tool material, and the effect of TiB2-Chitosan coating on the wear resistance and machinability still needs to be further studied.
Author Contributions
Conceptualization and Methodology: X.S., Y.H.; Investigation, Data Curation and Writing—Original Draft: X.S.; Writing—Review and Editing: Y.H., H.Q., Z.Y.; Supervision: Y.H., H.Q., Z.Y.; Funding acquisition: Y.H., H.Q., Z.Y. All authors have read and agreed to the published version of the manuscript.
Funding
This work was financially supported by the National Natural Science Foundation of China (Grant No. 52071300). Special Funding Projects for Local Science and Technology Development Guided by the Central Committee (Grant No. YDZX20191400004587), Shanxi Basic Research Program Project (Grant No. 202103021224279), and the Key Research and Development Plan of Zhejiang Province (Grant No. 2020C01131), Shanxi Scholarship Council of China (No.2021-140) and Taiyuan University of Science and Technology Graduate Innovation Project (Grant No: XCX212012).
Institutional Review Board Statement
Not applicable.
Informed Consent Statement
Not applicable.
Data Availability Statement
Data available on request from a corresponding author.
Conflicts of Interest
The authors declare no conflict of interest.
References
- Baddoo, N.R. Stainless steel in construction: A review of research, applications, challenges and opportunities. J. Constr. Steel Res. 2008, 64, 1199–1206. [Google Scholar] [CrossRef]
- Zhang, J.; Wang, Z.; Xiao, L. Effect of quenching and tempering temperature on microstructure of 6Cr13 martensitic stainless steel. Heat Treat. Met. 2013, 38, 107–108. [Google Scholar]
- Lee, J.; Subedi, K.K.; Huang, G.W.; Lee, J.; Kong, S.-C. Numerical Investigation of YSZ Droplet Impact on a Heated Wall for Thermal Spray Application. J. Therm. Spray Technol. 2022, 31, 2039–2049. [Google Scholar] [CrossRef]
- Vernardou, D. Special Issue: Advances in Chemical Vapor Deposition. Materials 2020, 13, 4167. [Google Scholar] [CrossRef] [PubMed]
- Gao, W.; Chang, C.; Li, G.; Xue, Y.; Wang, J.; Zhang, Z.; Lin, X. Study on the laser cladding of FeCrNi coating. Optik 2019, 178, 950–957. [Google Scholar] [CrossRef]
- Americus. Coatings update: Electroplating. Pigment. Resin Technol. 1977, 6, 9–12. [Google Scholar] [CrossRef]
- Shakeri, M.S. Kinerics study and mechanism of electrophoretic deposition: A new insight by sinnal/noise analysis. Surf. Rev. Lett. 2021, 29, 2250016. [Google Scholar] [CrossRef]
- Mendoza, C.; González, Z.; Castro, Y.; Gordo, E.; Ferrari, B. Improvement of TiN nanoparticles EPD inducing steric stabilization in non-aqueous suspensions. J. Eur. Ceram. Soc. 2016, 36, 307–317. [Google Scholar] [CrossRef]
- Ledwig, P.; Kot, M.; Moskalewicz, T.; Dubiel, B. Electrophoretic deposition of nc-TiO2/Chitosan composite coatings on X2CrNiMo17-12-2 stainless steel. Arch. Met. Mater. 2017, 62, 405–410. [Google Scholar] [CrossRef]
- Tiwari, P.; Ferson, N.D.; Andrew, J.S. Elucidating the role of electrophoretic mobility for increasing yield in the electrophoretic deposition of nanomaterials. J. Colloid Interface Sci. 2020, 570, 109–115. [Google Scholar] [CrossRef]
- Das, D.; Bagchi, B.; Basu, R.N. Nanostructured zirconia thin film fabricated by electrophoretic deposition technique. J. Alloys Compd. 2017, 693, 1220–1230. [Google Scholar] [CrossRef]
- Blink, J.; Farmer, J.; Choi, J.; Saw, C. Applications in the Nuclear Industry for Thermal Spray Amorphous Metal and Ceramic Coatings. Met. Mater. Trans. A 2009, 40, 1344–1354. [Google Scholar] [CrossRef]
- Munro, R.G. Material properties of titanium diboride. J. Res. Natl. Inst. Stand. Technol. 2000, 105, 709. [Google Scholar] [CrossRef]
- Guo, C.; Zhou, J.; Zhao, J.; Guo, B.; Yu, Y.; Zhou, H.; Chen, J. Microstructure and friction and wear behavior of laser boronizing composite coatings on titanium substrate. Appl. Surf. Sci. 2011, 257, 4398–4405. [Google Scholar] [CrossRef]
- Teimouri, E.; Darabi, E.; Hantehzadeh, M.; Khajehnezhad, A. The electrophoretic deposition of TiB2 nanoparticles produced by pulsed laser ablation: Case study on microstructural features and micromorphology properties. Microsc. Res. Tech. 2022, 85, 2140–2151. [Google Scholar] [CrossRef]
- Zhitomirsky, I.; Hashambhoy, A. Chitosan-mediated electrosynthesis of organic–inorganic nanocomposites. J. Mater. Process. Technol. 2007, 191, 68–72. [Google Scholar] [CrossRef]
- Li, X.; Min, M.; Du, N.; Gu, Y.; Hode, T.; Naylor, M.; Chen, D.; Nordquist, R.E.; Chen, W.R. Chitin, Chitosan, and Glycated Chitosan Regulate Immune Responses: The Novel Adjuvants for Cancer Vaccine. Clin. Dev. Immunol. 2013, 2013, 387023. [Google Scholar] [CrossRef]
- Nawaz, A.; Rehman, M.A.U. Chitosan/gelatin-based bioactive and antibacterial coatings deposited via electrophoretic deposition. J. Appl. Polym. Sci. 2021, 138, 50220. [Google Scholar] [CrossRef]
- Khor, E.; Lim, L.Y. Implantable applications of chitin and Chitosan. Biomaterials 2003, 24, 2339–2349. [Google Scholar] [CrossRef]
- Martinez-Gomez, M.; Quinto-Hernandez, A.; Flores-Garcia, N.S.; Mayén, J.; Dominguez-Diaz, M.; Martinez, H.; Porcayo-Calderon, J.; Gonzalez-Rodriguez, J.G.; Martinez-Gomez, L. Electrophoretic Deposition of Chitosan Films Doped with Nd2Ti2O7 Nanoparticles as Protective Coatings against Corrosion in Saline Solutions. Int. J. Polym. Sci. 2019, 2019, 3864835. [Google Scholar] [CrossRef]
- Al-Taweel, S.S.; Saud, H.R.; Kadhum, A.A.H.; Takriff, M.S. The influence of titanium dioxide nanofiller ratio on morphology and surface properties of TiO2/Chitosan nanocomposite. Results Phys. 2019, 13, 102296. [Google Scholar] [CrossRef]
- Molaei, A.; Amadeh, A.; Yari, M.; Afshar, M.R. Structure, apatite inducing ability, and corrosion behavior of Chitosan/halloysite nanotube coatings prepared by electrophoretic deposition on titanium substrate. Mater. Sci. Eng. C 2016, 59, 740–747. [Google Scholar] [CrossRef] [PubMed]
- Varlık, Ö.; Göncü, Y.; Ay, N. Electrophoretic deposition of composite titanium diboride-Chitosan coating. Mater. Chem. Phys. 2022, 282, 125927. [Google Scholar] [CrossRef]
- Verein Deutscher Ingenieure Normen. VDI 3198; VDI-Verlag: Dusseldorf, Germany, 1991. [Google Scholar]
- Jafarpour, M.; Aghajani, H. Electrophoretic deposition of bi-layered nano-sized silicon carbide/mullite coating from stabilized suspensions. J. Aust. Ceram. Soc. 2020, 56, 761–770. [Google Scholar] [CrossRef]
- Hamaker, H.C. Formation of a deposit by electrophoresis. Trans. Faraday Soc. 1940, 35, 279. [Google Scholar] [CrossRef]
- Zamharir, M.J.; Aghajani, H.; Tabrizi, A.T. Evaluation of adhesion strength of TiN layer applied on 316L substrate by electrophoretic deposition. J. Aust. Ceram. Soc. 2021, 57, 1219–1230. [Google Scholar] [CrossRef]
- Kavanlouei, M.; Akbari, A. Electrophoretic deposition of titanium nitride coatings. J. Am. Ceram. Soc. 2018, 101, 3288–3298. [Google Scholar] [CrossRef]
- Saberi, F.; Boroujeny, B.S.; Doostmohamdi, A.; Baboukani, A.R.; Asadikiya, M. Electrophoretic deposition kinetics and properties of ZrO 2 nano coatings. Mater. Chem. Phys. 2018, 213, 444–454. [Google Scholar] [CrossRef]
- Sarkar, P.; Nicholson, P.S. Electrophoretic Deposition (EPD): Mechanisms, Kinetics, and Application to Ceramics. J. Am. Ceram. Soc. 1996, 79, 1987–2002. [Google Scholar] [CrossRef]
- Farrokhi-Rad, M.; Ghorbani, M. Electrophoretic Deposition of Titania Nanoparticles in Different Alcohols: Kinetics of Deposition: EPD of Titania Nanoparticles in Different Alcohols. J. Am. Ceram. Soc. 2011, 94, 2354–2361. [Google Scholar] [CrossRef]
- Vidakis, N.; Antoniadis, A.; Bilalis, N. The VDI 3198 indentation test evaluation of a reliable qualitative control for layered compounds. J. Mater. Process. Technol. 2003, 143–144, 481–485. [Google Scholar] [CrossRef]
- Tavakoli, H.; Khoie, S.M.M. An electrochemical study of the corrosion resistance of boride coating obtained by thermo-reactive diffusion. Mater. Chem. Phys. 2010, 124, 1134–1138. [Google Scholar] [CrossRef]
- Hamadou, L.; Aïnouche, L.; Kadri, A.; Yahia, S.A.A.; Benbrahim, N. Electrochemical impedance spectroscopy study of thermally grown oxides exhibiting constant phase element behaviour. Electrochim. Acta 2013, 113, 99–108. [Google Scholar] [CrossRef]
Publisher’s Note: MDPI stays neutral with regard to jurisdictional claims in published maps and institutional affiliations. |
© 2022 by the authors. Licensee MDPI, Basel, Switzerland. This article is an open access article distributed under the terms and conditions of the Creative Commons Attribution (CC BY) license (https://creativecommons.org/licenses/by/4.0/).