Article

Structure-Property Correlation in Sodium Borophosphate Glasses Modified with Niobium Oxide

1
Department of General and Inorganic Chemistry, Faculty of Chemical Technology, University of Pardubice, 53210 Pardubice, Czech Republic
2
Ruđer Bošković Institute, Bijenička Cesta 54, 10000 Zagreb, Croatia
3
University of Lille, CNRS, Centrale Lille, University of Artois, UMR 8181-UCCS-Unité de Catalyse et Chimie du Solide, F-59000 Lille, France
*
Author to whom correspondence should be addressed.
Coatings 2022, 12(11), 1626; https://doi.org/10.3390/coatings12111626
Submission received: 27 September 2022 / Revised: 17 October 2022 / Accepted: 21 October 2022 / Published: 26 October 2022

Abstract

:
Bulk glasses of the series (100−x)[0.4Na2O-0.2Nb2O5-0.4P2O5]-xB2O3 with x = 0–48 mol% B2O3 were prepared by slow cooling in air. Their glass transition temperature increases within the range of 0–16 mol% B2O3, but further additions of B2O3 result in its decrease. Their structure was investigated by Raman, 11B, and 31P MAS NMR spectroscopy. The relative number of BO4 units decreases with increasing B2O3 content, while the number of BO3 units increases up to 59 % at x = 48. The upfield shift of a broad resonance peak in the 31P MAS NMR spectra is ascribed to an increasing connectedness of the structural network with increasing B2O3 content. Strong Raman band at 916–929 cm−1 shows on the presence of NbO6 octahedra in the structural network of these glasses. With the B2O3 addition, a decrease in DC conductivity is observed, which is attributed to the decrease in the concentration of Na+ ions.

Graphical Abstract

1. Introduction

Sodium borophosphate glasses were studied during the last years in several papers. Sodium borophosphate glasses containing phosphorus oxide and boron oxide are termed also as glasses revealing mixed glass former effect (MGFE).
A glass-forming region in the ternary system can be found, e.g., in the paper of Ducel and Videau [1], where the authors studied the compositional series, (1 − x)NaPO3-xNa2B4O7. On the Na2O-P2O5 site, it starts at P2O5 and reaches up to 60 mol% Na2O, while on the Na2O-B2O3 site it starts at B2O3 and reaches only to 40 mol% Na2O. It is interesting that in the binary system of two glass-forming oxides, their mutual combination of B2O3 + P2O5 is not glass but only the crystalline compound, BPO4. Its structure consists of BO4 and PO4 tetrahedra. Sodium borophosphate glass matrices are interesting for many applications, such as hosts for rare-earth dopants for fiber amplifiers [2,3], hosts for metallic dopants in ion-conducting glasses [4,5] and sealing glass applications [6].
Zielniok et al. [7] prepared and studied glasses at the edge of the glass-forming region having the composition (Na2O)0.4[(B2O3)x(P2O5)1−x] and within the whole range of x = 0–1. Compared to binary sodium phosphate and borate glasses, the extent of network polymerization is increased namely within the region of 0–40 mol% B2O3 by the formation of four-coordinate borate units, BO4. Glasses with a higher B2O3 content contain also three-coordinate BO3 units which appear to interact only weakly with phosphorus [7].
Carta et al. [8] studied glasses in the system 40P2O5-xB2O3-(60 − x)Na2O. They reported that increasing additions of B2O3 resulted in the improvement of thermal stability with respect to devitrification, and an increase in hygroscopicity stability. Authors [8] discussed such evolution of properties by considering a global increase in bond strength and cross-linking of the glass network by the formation of P–O–B bonds.
A compositional line of sodium borophosphate glasses (NaPO3)1−x-(B2O3)x was studied in the paper by Raskar et al. [9] by NMR and XPS. The authors prepared glassy samples within the concentration range of 0–30 mol% B2O3 by cooling the melt on the copper plate. Obtained XPS data provided a quantitative distinction between B–O–B, B–O–P and P–O–P linkages as well as nonbridging oxygen atoms. Additions of B2O3 to NaPO3 produce a significant increase in the glass transition temperature from 284 °C at NaPO3 to 421 °C in the glass with 30 mol% B2O3. Up to 20 mol % B2O3, all the boron atoms are in the tetrahedral BO4 coordination. Rincke and Eckert [10] investigated another compositional line of sodium borophosphate glasses Na2O-BPO4. They prepared glasses of the (Na2O)x-(BPO4)1−x compositional line, inside the ternary Na2O-B2O3-P2O5 system, with Na2O content of 25–55 mol%. For structural analysis, they applied XPS, Raman and 11B and 31P NMR spectra as well as rotational-echo, double-resonance (REDOR) NMR techniques for the study of interatomic interactions. At low Na2O content, BO4 units dominate, but their amount decreases as the BPO4 content decreases and simultaneously the amount of trigonal BO3 units increases from 14% to 33% at x = 0.55. The 31P MAS NMR spectra show the successive depolymerization of the phosphate units with increasing alkali oxide content. Heteroatomic P–O–B linkages are preferred in these glasses over homoatomic B–O–B and P–O–P linkages and with increasing Na2O content the concentration of P–O–B linkages decreases, accompanied by the decrease in the number of bridging oxygen. With increasing Na2O content and thus decreasing number of bridging oxygen species, the reticulation of the network decreases, which is reflected in the decreasing glass transition temperature. The authors [10] also reported that the BO3 units are primarily bound via B–O–B bonds to the BO4 units.
Structural studies of the mixed glass former system of sodium borophosphate glasses with 35 mol% Na2O were published in papers [11,12,13]. The authors [11,12,13] investigated glass series 0.35Na2O + 0.65[xB2O3 + (1 − x)P2O5] and compositional dependence of their density, molar volume [11] and the glass transition temperature [12] with the support of data on their structure published in paper [13]. This paper contains 11B and 31P MAS NMR spectra and also Raman spectra of the glass series 0.35Na2O + 0.65[xB2O3 + (1 − x)P2O5]. The authors [13] exclude the formation of BPO4 units in these glasses and confirm the important role of internetwork bonding through B–O–P linkages. The preferential formation of tetrahedral boron groups in the borophosphate glasses is explained by the reaction of BO3 groups with metaphosphate Q2 groups giving rise to BO4 and Q3 phosphate groups.
The structural changes in the glass network induced by the replacement of one glass-forming oxide with another, usually, have positive implications on the transport of alkali ions. For instance, in the mixed glass former system 0.35Na2O + 0.65[xB2O3 + (1 − x)P2O5], 0 ≤ x ≤ 1 [14], the ionic conductivity changes non-monotonic reaching the maximal value of σDC = 2.34 × 10⁻⁹ (Ωcm)−1 at glass composition x = 0.4. Since the concentration of sodium ions is kept constant throughout the entire series, the observed conductivity changes are directly related to the variations in the structural units and their influence on the mobility of sodium ions.
Further, Raguenet et al. [15] studied glasses of composition 45Li2O-55[xB2O3–(1 − x)P2O5], 0 ≤ x ≤ 1 and reported that the non-monotonic change in the ionic conductivity correlates well with the number of BO4 units in the glass network. In particular, at the highest concentration of boron oxide, the ionic conductivity decreases due to the formation of BO3 units which break the conduction pathways formed by BO4 structural units which have a favorable effect on the dynamics of lithium ions. A similar positive correlation between ionic transport and formation of mixed structural units was also reported for the system where third glass forming oxide is added (100 − x)[0.5Li2O-0.1B2O3-0.4P2O5]-xGeO2, x = 0–25 mol% [16].
In our previous study [17], we observed that the chemical durability of the alkali borophosphate glasses increases significantly with the addition of niobium oxide. Therefore, in the present study of sodium borophosphate glasses to improve the chemical durability of the starting sodium phosphate glass, we applied a 20 mol% addition of niobium oxide and thus we started our glass series (100 − x)[0.4Na2O-0.2Nb2O5-0.4P2O5]-xB2O3, with the composition of 40Na2O-20Nb2O5-40P2O5. We have determined the basic physicochemical properties of these glasses and for the structural investigation, we used Raman spectroscopy and 11B and 31P MAS NMR spectroscopy. In addition, the influence of glass composition and structure on electrical conductivity over a wide range of temperatures and frequencies has been studied.

2. Materials and Methods

Glasses of the Na2O-Nb2O5-P2O5-B2O3 system were prepared by melting Na2CO3 (99%; Sigma-Aldrich, Saint Louis, MO, USA), Nb2O5 (99.9%; Sigma-Aldrich, Saint Louis, MO, USA), H3PO4 (85 wt%, p.a.; Penta) and H3BO3 (99.5%; Sigma-Aldrich, Saint Louis, MO, USA) using a total batch weight of 20 g. The homogenized starting mixtures were slowly calcined up to 600 °C with the final calcination at a maximum temperature for 2 h in order to remove the water. The reaction mixtures were then melted at 1100–1250 °C under ambient air in a platinum crucible. The melt was subsequently poured into a preheated graphite mould (T < Tg) and the obtained glasses were then cooled to room temperature. The weight of the glass sample, together with the remaining glass in the crucible, was usually more than 98.5 wt% and thus the weight loss was usually less than 1.5 wt%. We, therefore, considered the batch compositions as reflecting the actual compositions. The amorphous character of the prepared glasses was checked by X-ray diffraction analysis (not shown).
The glass density, ρ, was determined using a helium gas pycnometer AccuPyc II 1340, where the volume of the sample was measured by calculating the volume of the helium gas displaced by the sample. The molar volume, VM, was calculated using the expression V M = M ¯ / ρ , where M ¯ is the average molar weight of the glass composition a∙M(Na2O) + b∙M(Nb2O5) + c∙M(P2O5) + d∙M(B2O3), calculated for a + b + c + d = 1.
The thermal behaviour of glasses was studied on DTA 404 PC (Netzsch) operating in the DSC mode at a heating rate of 10 °C min−1 over the temperature interval 30–1000 °C. The measurements were carried out with 100 mg powder samples, obtained by milling bulk glasses in the laboratory vibrational mill. Glass transition temperature, dilatometric softening temperature and thermal expansion coefficient were determined from the dilatometric curves using thermomechanical analyser Netzsch TMA 402. The coefficient of thermal expansion, α, was determined as a mean value in a temperature range of 150–250 °C. The glass transition temperature, Tg, was determined from a change in the slope of the elongation versus temperature plot and the dilatometric softening temperature, Td was obtained from the maximum of the expansion trace corresponding to the onset of viscous deformation under an applied load.
The linear refractive indices at 453, 532, 637, 829 and 1062 nm were measured by the prism coupling method, using a Metricon Model 2010/Mat. Linear refractive index values, nd (587.6 nm), were obtained from the dispersion curve calculated with Metricon software.
Electrical properties were obtained by measuring complex impedance using an impedance analyzer (Novocontrol Alpha-AN Dielectric Spectrometer) in a frequency range from 0.01 Hz to 1 MHz at temperatures from −60 °C to 240 °C. The temperature was controlled to an accuracy of ±0.2 °C. For the electrical measurements, gold electrodes, 6 mm in diameter, were sputtered onto both sides of disks using Sputter Coater SC7620.
Raman spectra in the range 1400–200 cm−1 were measured on glassy bulk and crystalline powder samples at room temperature using a DXR Raman spectrometer Thermo Scientific with a 532 nm solid state (Nd: YAG) diode pumped laser.
The 31P MAS NMR spectra were measured using a BRUKER Avance 400 spectrometer with a 4 mm probe. The spinning speed was 12.5 kHz. The pulse length was 1.2 μs (π/4), and the recycle delay was 60 s, which was sufficient to enable relaxation at this field strength. The 11B MAS NMR spectra were measured on a BRUKER Avance 800 spectrometer with a 2.5 mm probe. The spinning speed was 20 kHz. A rotor synchronized echo was used with selective pulse lengths of 20 μs and 40 μs for the first and the second pulse, with a 10 s recycling delay. The Larmor frequencies were 162.3 MHz and 128.4 MHz for 31P and 11B, respectively. The chemical shifts of 11B nuclei are given relative to BPO4 at −3.6 ppm, those of 31P are relative to 85% H3PO4 at 0 ppm.
An EMPYREAN PANAnalytical diffractometer with Cu Kα radiation was used for the identification of crystalline phases. A database of inorganic compounds from the International Center of Diffraction Data [18] was used for the phase identification.

3. Results and Discussion

3.1. Glass Properties

Seven glasses of the compositional series (100 − x)[0.4Na2O-0.2Nb2O5-0.4P2O5]-xB2O3 were prepared and studied. Their composition is summarized in Table 1. All glasses were homogeneous and colorless. Their basic properties (density, molar volume, glass transition temperature, the dissolution rate and the coefficient of thermal expansion) were measured and the obtained data are shown in Table 1. Figure 1 shows the densities (ρ) and molar volumes (VM) as a function of the B2O3 content. Both parameters decrease in a monotonous way. The decrease in density results from the difference in the molar mass of the parent glass 40Na2O-20Nb2O5-40P2O5 (M = 134.73) and the boron oxide B2O3 (M = 69.62) replacing the base glass. A decrease in the molar volume results from the replacement of the average number of atoms 5.4 in a fictive molar unit of the base glass by 5 atoms in the molecule of boron oxide with two small boron atoms.
We also measured the linear refractive index of the glasses. Compositional dependence of the obtained values of the refractive index at 587.6 nm are given in Table 1. It is evident that in the studied glass series the refractive index slightly decreases with an increasing B2O3 content. Nevertheless, we know that the main role in the optical properties of the studied glasses is played by the number of Nb-O bonds having large polarizability [19] and thus, the refractive index decreases with the decreasing Nb2O5 content.

3.2. Thermal Behavior

DTA curves of (100 − x)[0.4Na2O-0.2Nb2O5-0.4P2O5]-xB2O3 glasses are shown in Figure 2. As can be seen from this figure, starting glass without B2O3 reveals on its DTA curve both exothermic crystallization peak followed by an endothermic peak of melting the crystalline phase. Glasses with 8 and 16 mol% B2O3 do not reveal any crystallization peaks on their DTA curves and thus B2O3 additions increase their thermal stability. On the DTA curve of glasses with higher B2O3 content (24–48 mol% B2O3), we can see one crystallization peak within the region of 700–800 °C, the intensity of which increases with increasing B2O3 content. It was possible to determine the values of the glass transition temperature, but more accurate data were obtained from thermomechanical measurements.
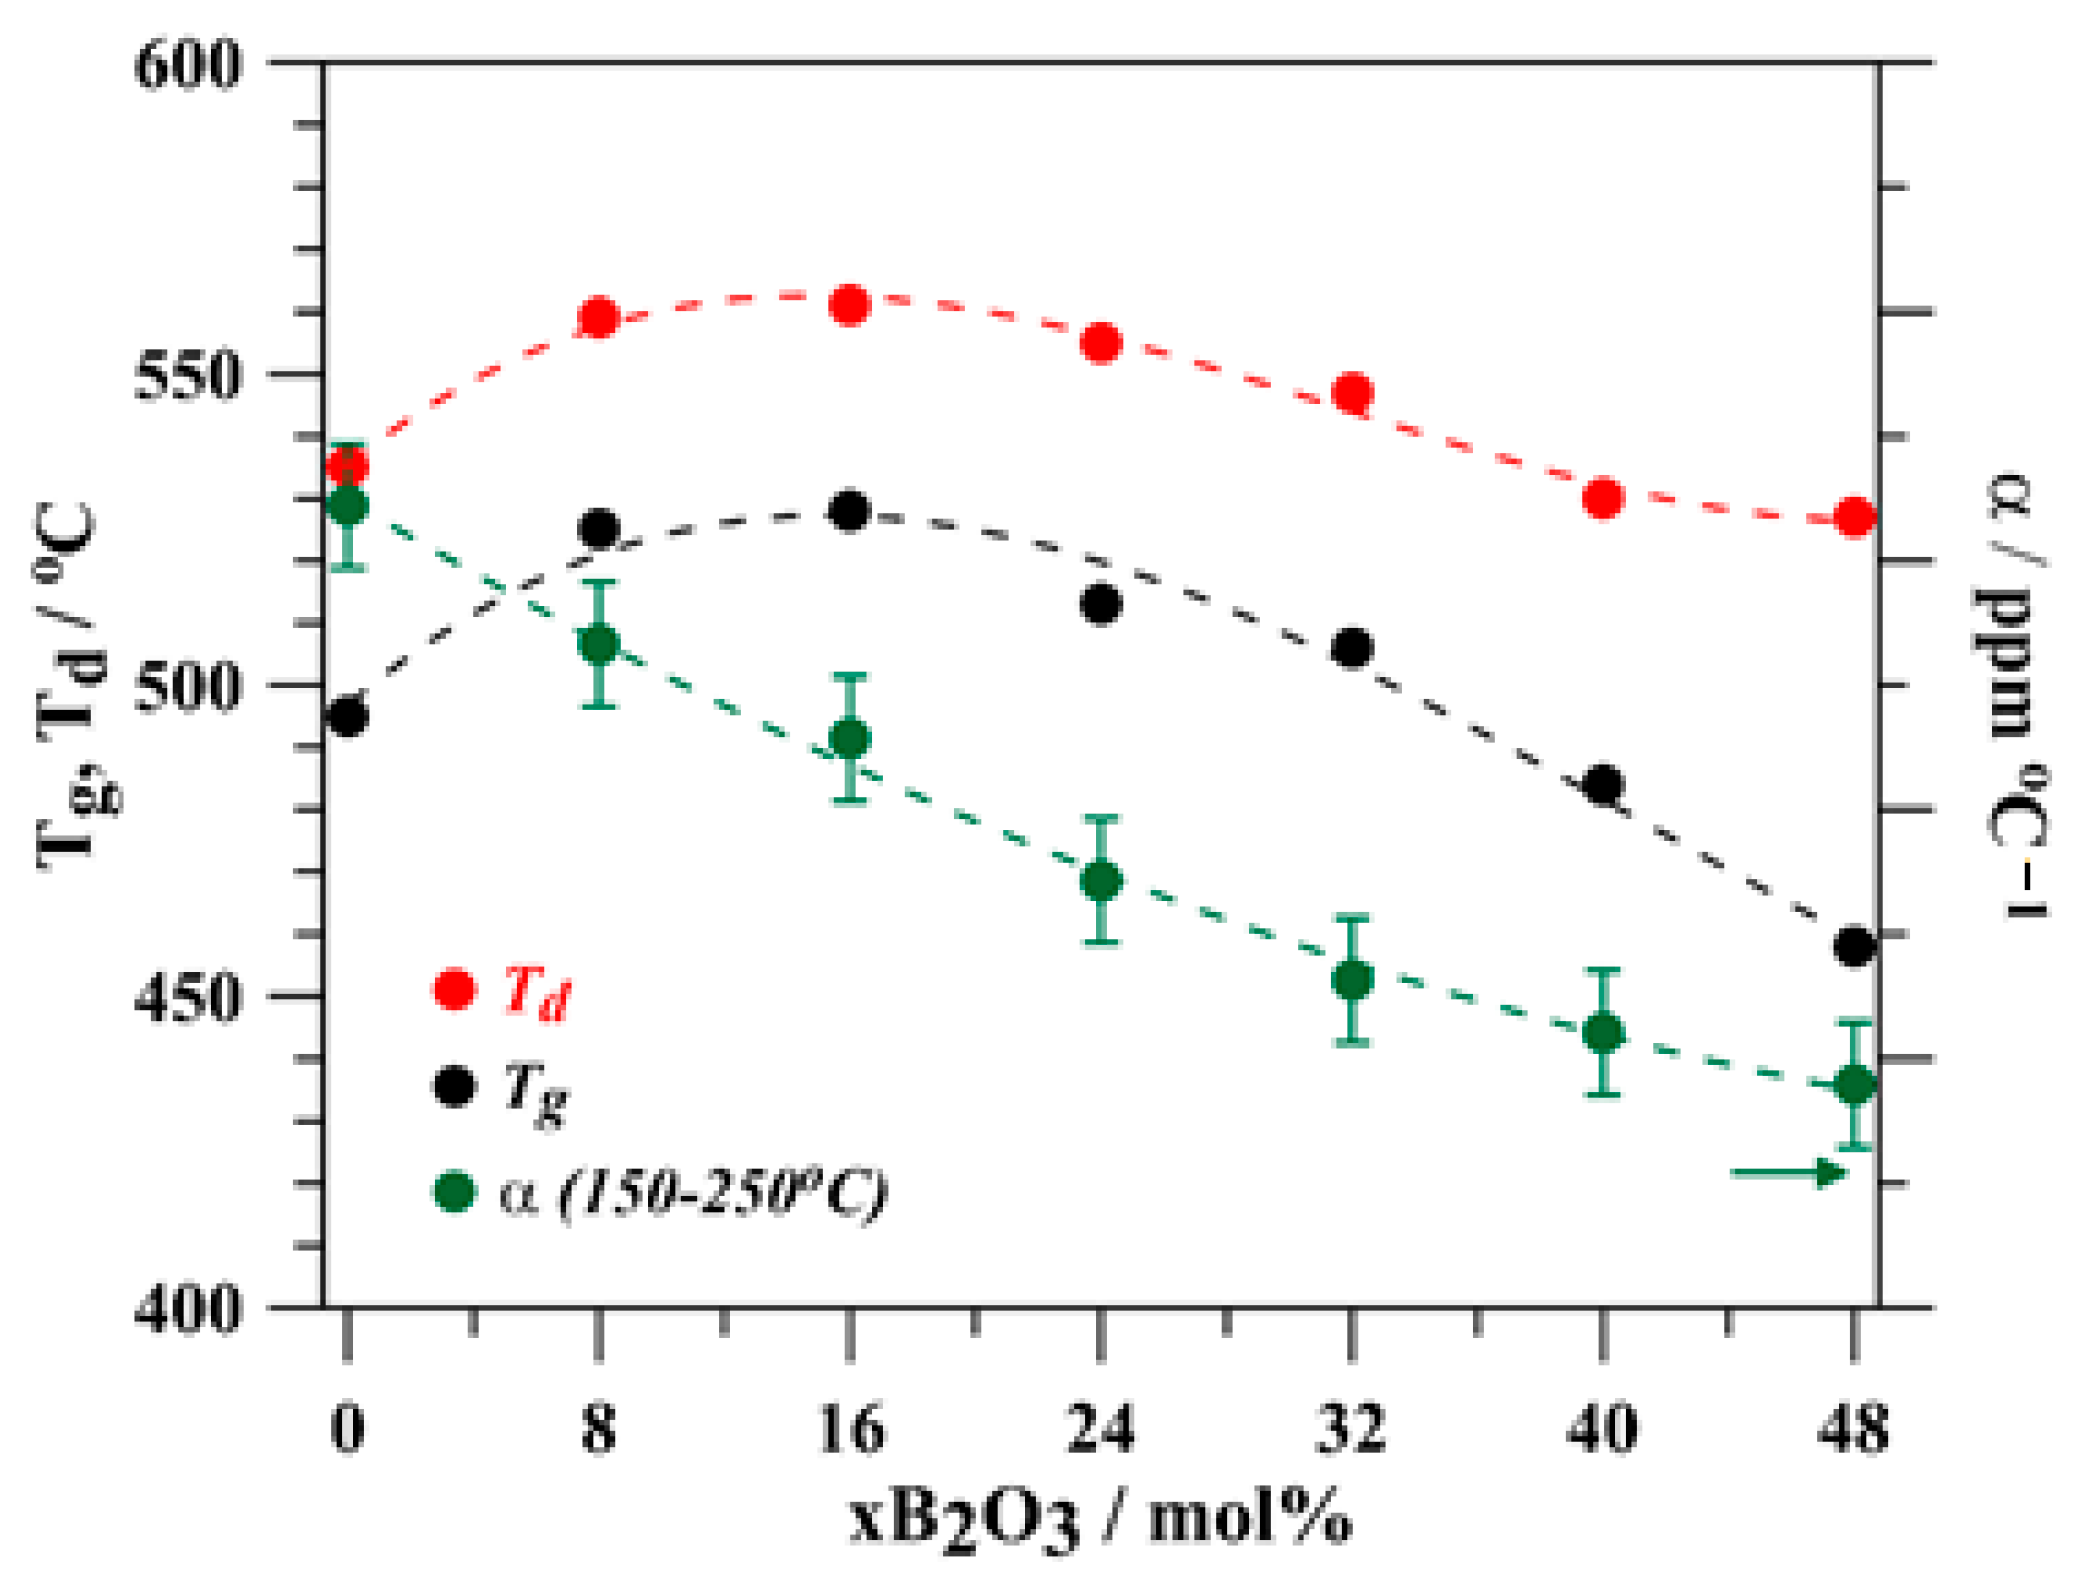
Glass transition temperature, Tg, was obtained from thermomechanical analysis and its values are given in Table 1. Compositional dependence of Tg values on the B2O3 content is shown also in Figure 3. Glass transition temperature increases in the studied glass series (100 − x)[0.4Na2O-0.2Nb2O5-0.4P2O5]-xB2O3 within the range of 0–16 mol% B2O3, but further additions of B2O3 result in a decrease of Tg from its maximum value of 528 °C at x = 16, down to the value of 455 °C at the glass with x = 48 mol% B2O3. We assume that the first additions of B2O3 form B–O–P linkages resulting in the reaching of the optimum connectivity of the glass network. Further additions of B2O3 result in the formation of homopolar B–O–B bonds, which can be the reason for the observed decrease in Tg values. The values of the dilatometric softening temperature, Td, reveal similar compositional dependence with the exception of the glass with 48 mol% B2O3, where the difference Td−Tg is higher. The coefficient of thermal expansion decreases significantly with increasing boron content from 16.4 ppm/°C down to 11.8 ppm/°C.

3.3. Glass Structure

Raman spectra of the glass series (100 − x)[0.4Na2O-0.2Nb2O5-0.4P2O5]-xB2O3 are presented in Figure 4 and assignments of the bands summarized it Table 2. On the spectrum of starting glass without B2O3, there is a dominant vibrational band of 928 cm−1. The intensity of this band decreases with increasing B2O3 content in the glasses, as the niobium content in the glasses decreases from 20 mol% Nb2O5, at the glass with x = 0, down to the 10.4 mol% Nb2O5, at the glass with x = 48 mol% B2O3. This Raman band is ascribed to the vibrations of Nb–O bonds in NbO6 octahedra. Raman scattering on these octahedra is more effective than on the phosphate tetrahedra and therefore vibrations of phosphate units in the Raman spectra are suppressed and we can assign the vibrations of phosphate tetrahedra only the weak bands at 1211 and 771 cm−1. Nevertheless, the strength of the band 928 cm−1 decreases with increasing B2O3 content, when the Nb2O5 content in the glasses also decreases. In the Raman spectra of glasses with 24–48 mol% B2O3, we can observe an increase in the intensity of bands within the region of 773–824 cm−1, which we can ascribe to the formation of complex structural units containing B–O–B units [16]. As the 11B MAS NMR spectra (described hereafter) give evidence for the presence of both tetrahedral BO4 and trigonal BO3 units, we can await some complex borate units like tetraborate units B4O72−, the formation of which is reported also in lithium borophosphate glasses 45Li2O-55[xB2O3-(1 − x)P2O5] [20].
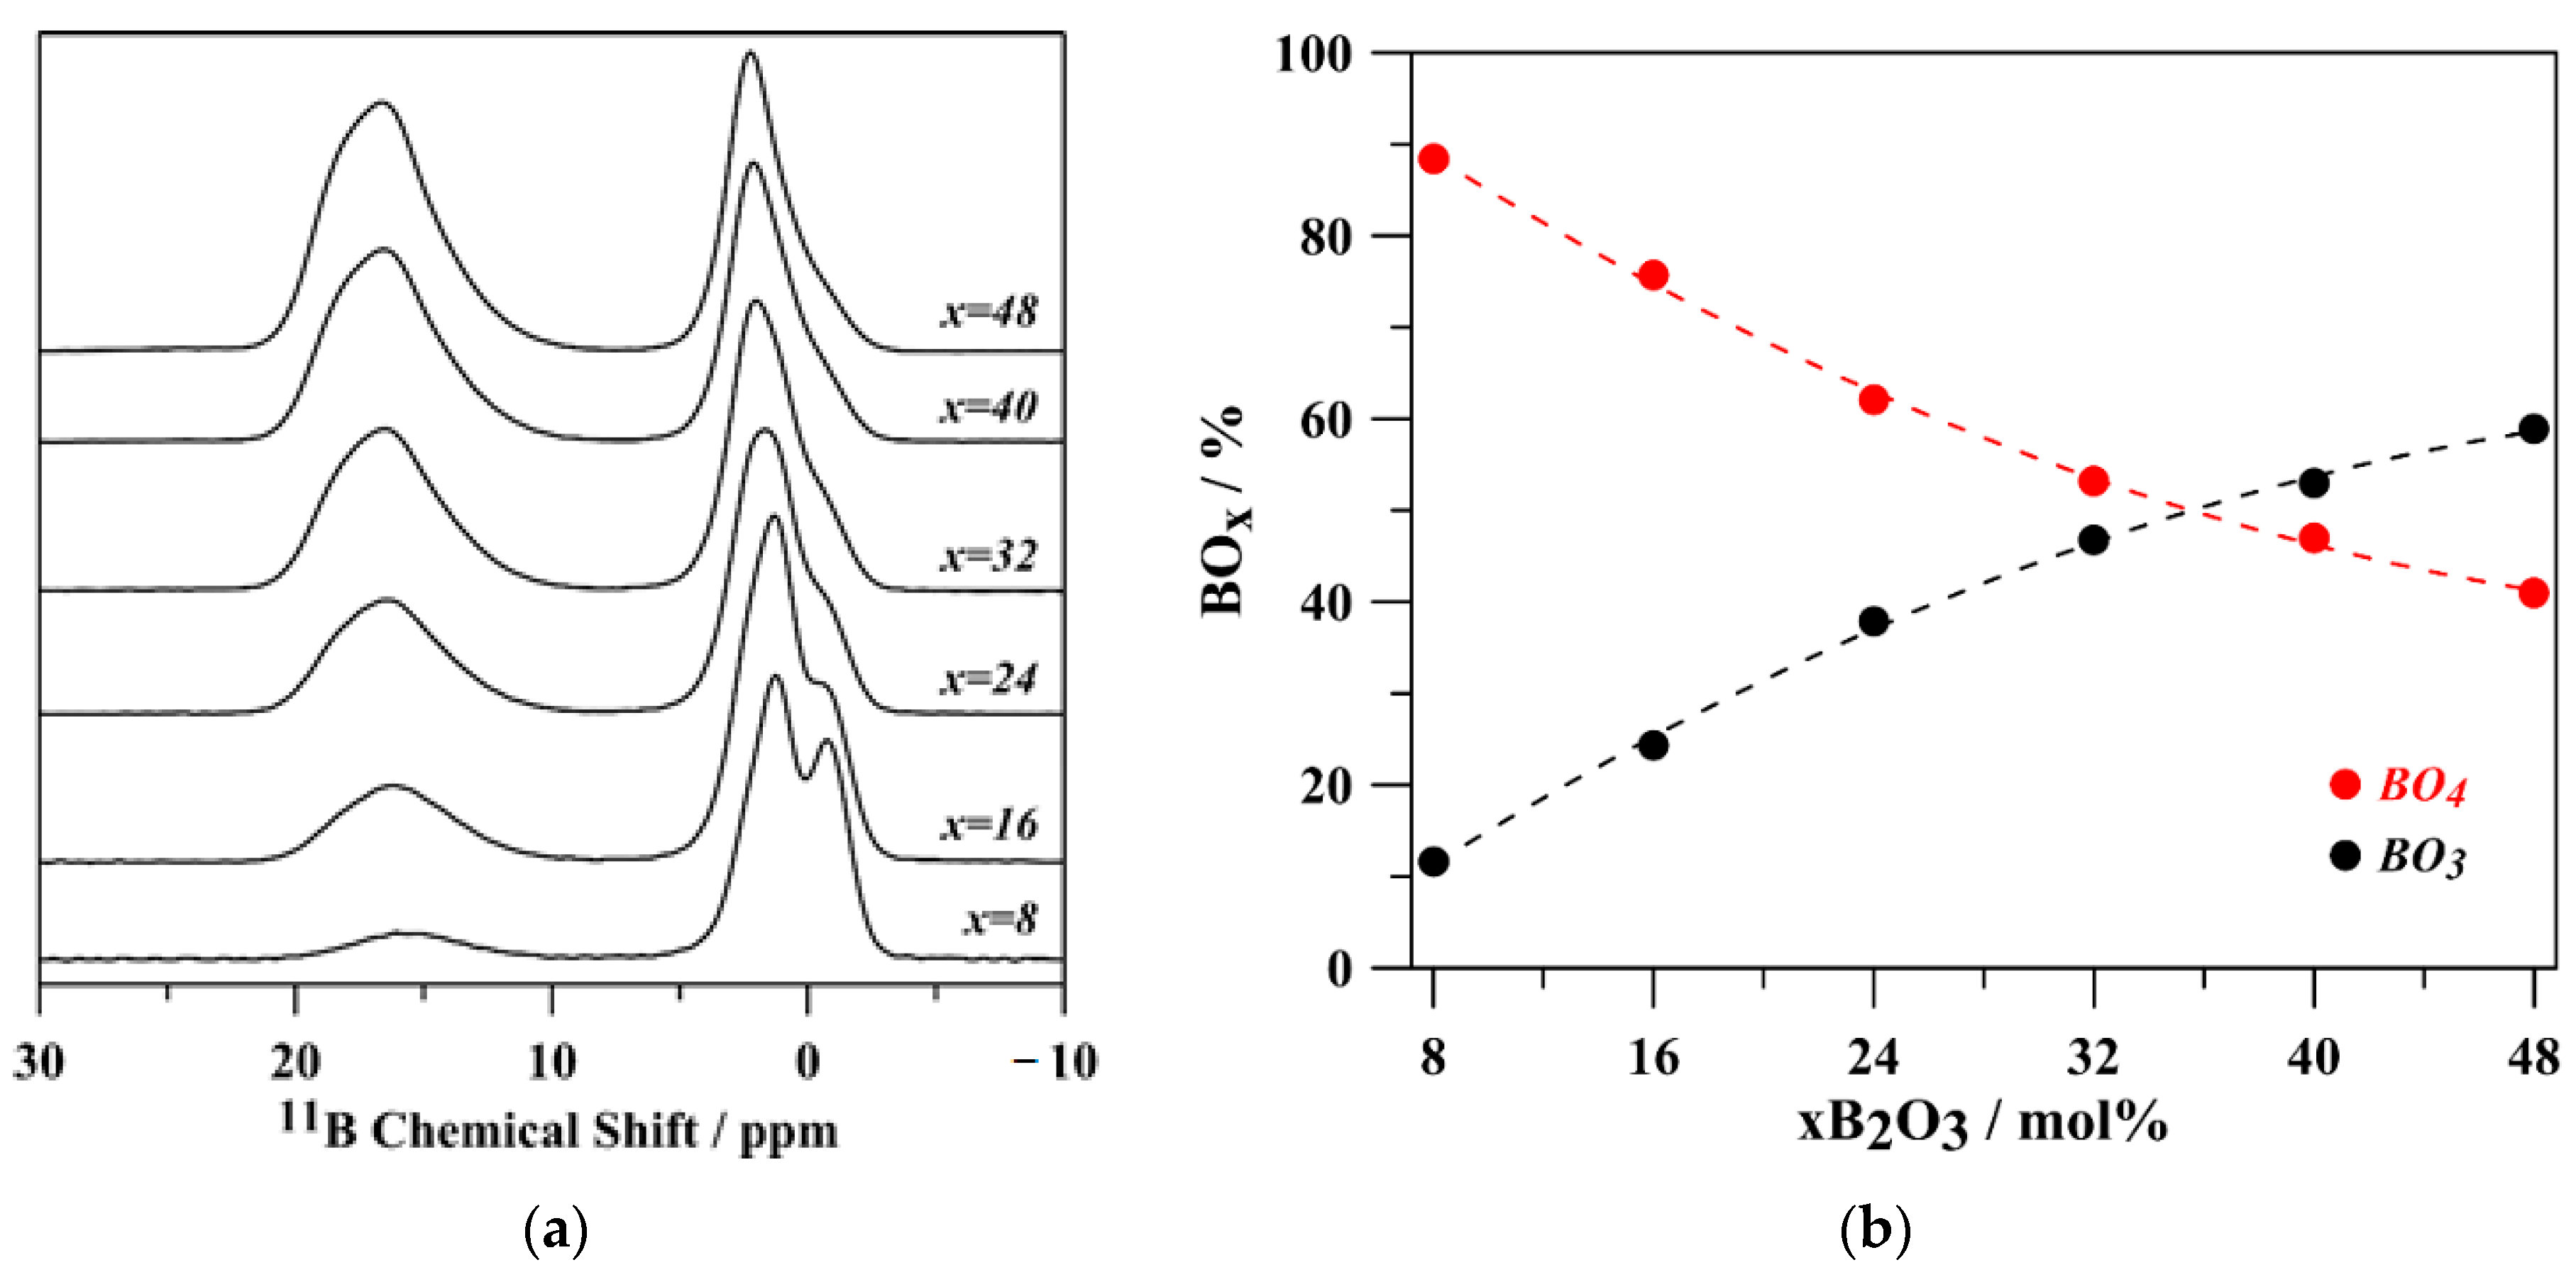
The 11B MAS NMR spectra of glass series (100 − x)[0.4Na2O-0.2Nb2O5-0.4P2O5]-xB2O3 are shown in Figure 5a. In this figure NMR spectrum of the glass with 8 mol% B2O3 reveals 2 close narrow resonance signals with the chemical shift values of −1 ppm and +2 ppm in the region characteristic for BO4 units and a small broad signal at +16 ppm in the region characteristic for BO3 units [8]. The asymmetric shape of BO3 resonances is due to a residual quadrupole broadening. Both BO3 and BO4 signals are well separated, due to the high magnetic field of 18.4T applied for the measurement, and thus it is possible to evaluate the relative number of boron atoms with tetrahedral (BO4) and trigonal coordination (BO3). By the decomposition of the 11B MAS NMR spectra, we have obtained the compositional dependence of the amount of borate structural units in the studied glasses shown in Figure 5b. As can be seen from this figure the relative number of boron units with tetragonal coordination decreases with increasing B2O3 content, while the number of trigonal BO3 units increases from 12 % at x = 8 mol% B2O3 up to 59 % at x = 48. With increasing B2O3 content, the shape of BO4 resonances changes as the glass composition changes. We can observe a decrease in the intensity of the resonance at −1 ppm ascribed by Raguenet et al. [20] to the BO4 resonances with four or three (OP) groups, and an increase in the intensity of the second BO4 resonance at +2 ppm with less (OP) groups [20], but also with (ONb) and OBIII groups. This second resonance increases as the B2O3 content increases, whereas the intensity of the first resonance decreases. These changes associated with an increase in the B2O3 content in the studied glasses can be explained by the replacement of B–O–P bonds by B–O–B bonds and by a decrease in the number of B–O–Nb bonds.
The 31P MAS NMR spectra of the glass series (100 − x)[0.4Na2O-0.2Nb2O5-0.4P2O5]-xB2O3 are shown in Figure 6. In this figure, we can observe a broad complex resonance peak, the maximum of which shifts upfield from −10 ppm at the glass with x = 0 up to the value of −15.4 ppm at the glass with x = 48 mol% B2O3. A decreasing number of sodium cations in the glasses (Na2O content decreases from 40 mol% down to 20.8 mol% at the glass with 48 mol% B2O3–see Table 1) is accompanied by a decreasing number of nonbridging oxygen atoms, the charge of which is compensated by the positive charge of Na+ ions. Therefore, in the glass series (100 − x)(40Na2O-20Nb2O5-40P2O5)-xB2O3 with increasing B2O3 content the connectedness of the structural network has to increase.
From the one-dimensional 31P MAS NMR spectra, we are not able to differentiate P–O–B, P–O–P and P–O–Nb bonds; moreover, there will be also a high number of B–O–B bonds, especially in glasses with high B2O3 content. The higher connectedness of the structural network due to the decrease of the concentration of NBO is thus reflected by the observed shift of the maxima of resonance signal upfield, corresponding to the transformation of phosphate Q1 units to Q2 units. The shift reflects that there are on average fewer Na+ at the proximity of 31P nuclei since they change from NBO to BO4 charge compensation. Moreover, the reality is, of course, more complex as phosphorus atoms in the network form not only P–O–P bonds but also P–O–B and P–O–Nb bonds.
The formation of NbO6 units in the studied glasses is evident not only from the Raman spectra but also from crystallization experiments. We have annealed powder glasses at 640–700 °C (values chosen on the basis of DTA curves) for 4 hrs. The annealing process was held in platinum crucibles with the heating rate of 5 °C/min in air atmosphere. The results of the X-ray diffraction analyses of annealed samples are shown in Figure 7. In the case of annealed sample with 0 mol% B2O3, we were unable to determine the crystalline product (marked with "?" in the image). Glasses with 8 and 16 mol% B2O3 remained amorphous, and in the annealed glasses with 24–48 mol% B2O3 we found diffraction lines of monoclinic and tetragonal modifications of NbOPO4. This compound, according to the previous structural studies [25,26], contains niobium atoms in NbO6 octahedra. In the structure of α−NbOPO4, these octahedra form chains with Nb–O–Nb linkages and also cross-connections with PO4 tetrahedra and Nb–O–P linkages [17,27]. Crystallization processes usually change only medium-range order present in the glasses, but not short-range order structural motifs. Therefore, we are convinced that niobium atoms in the studied glasses form NbO6 octahedra.

3.4. Electrical Properties

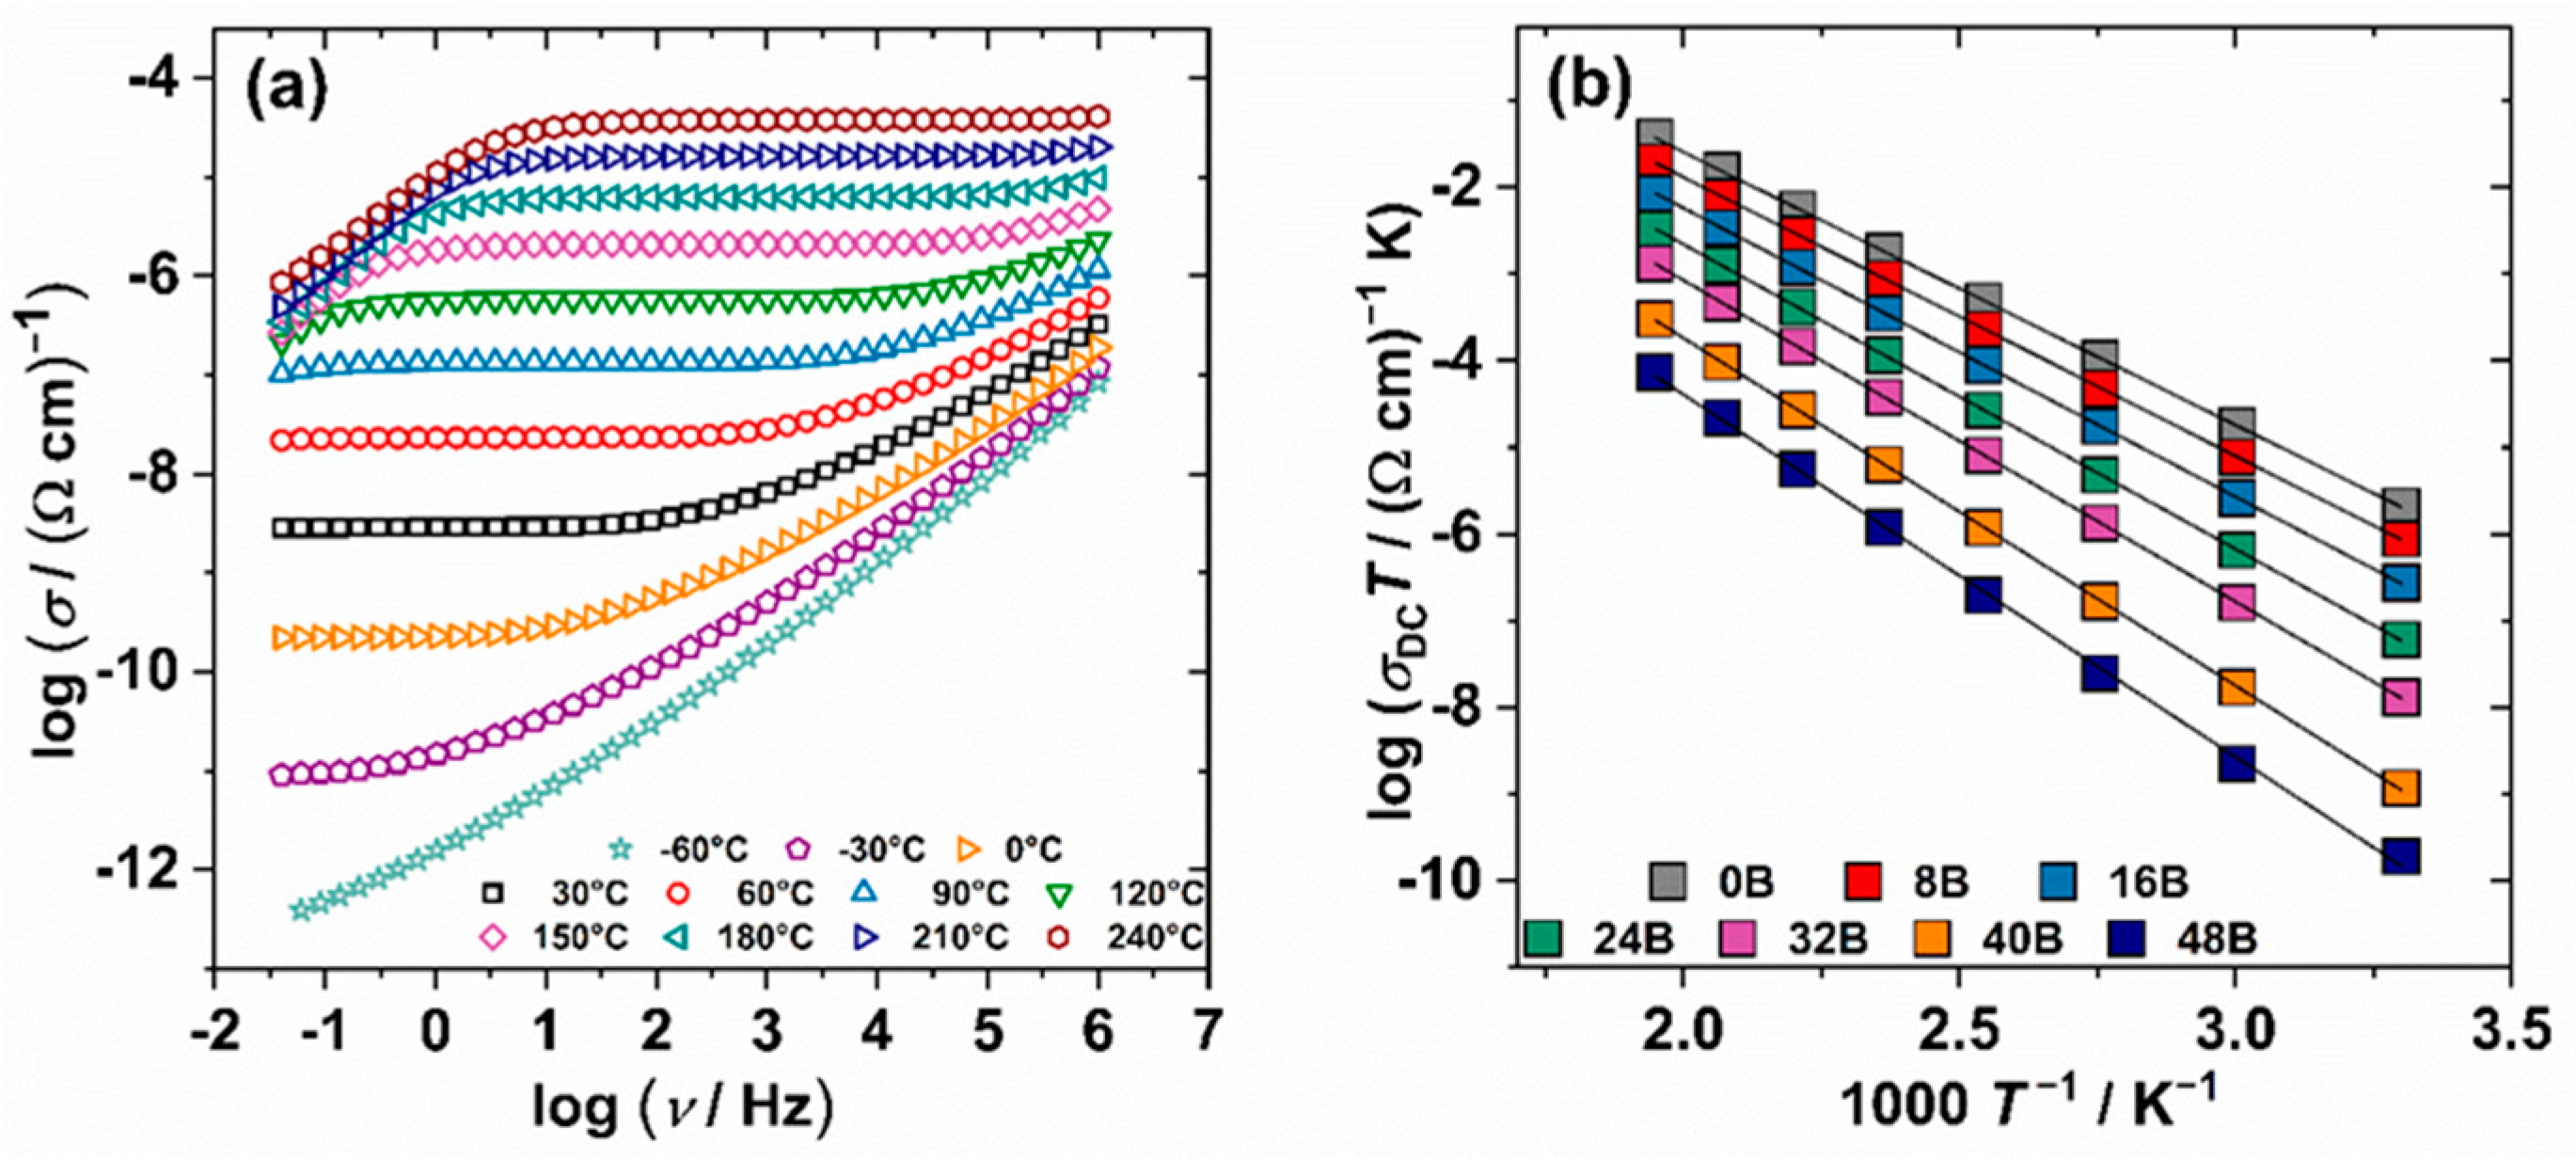
The electrical conductivity of (100 − x)[0.4Na2O-0.2Nb2O5-0.4P2O5]-xB2O3 glasses was measured over a wide range of frequencies and temperatures. Figure 8a shows conductivity spectra at different temperatures for a glass containing 8 mol% of B2O3 as typical spectra for all the glasses studied. Overall, there are three distinct spectral features which can be observed in this figure: (a) frequency-independent conductivity corresponding to DC conductivity which is not attained for the lowest temperature (−60 °C), but becomes more pronounced as temperature increases, (b) frequency-dependent conductivity, so-called conductivity dispersion, at higher frequencies and at temperatures up to ≈120 °C, above which it disappears from the frequency window of the impedance spectroscopy measurement and (c) a decrease of conductivity at low frequencies and high temperatures, above 90 °C in Figure 8a. The latter feature is called the electrode polarization effect and it originates from the accumulation of sodium ions at the blocking gold electrode used in the electrical measurements.
The DC conductivity exhibits Arrhenius temperature dependence for all glasses and has characteristic activation energy, see Figure 8b. The activation energy for the DC conductivity, WDC, was determined for individual glass samples from the slope of log(σDCT) vs. 1000/T using the equation:
σ D C T = σ 0 * exp ( W D C k B T )
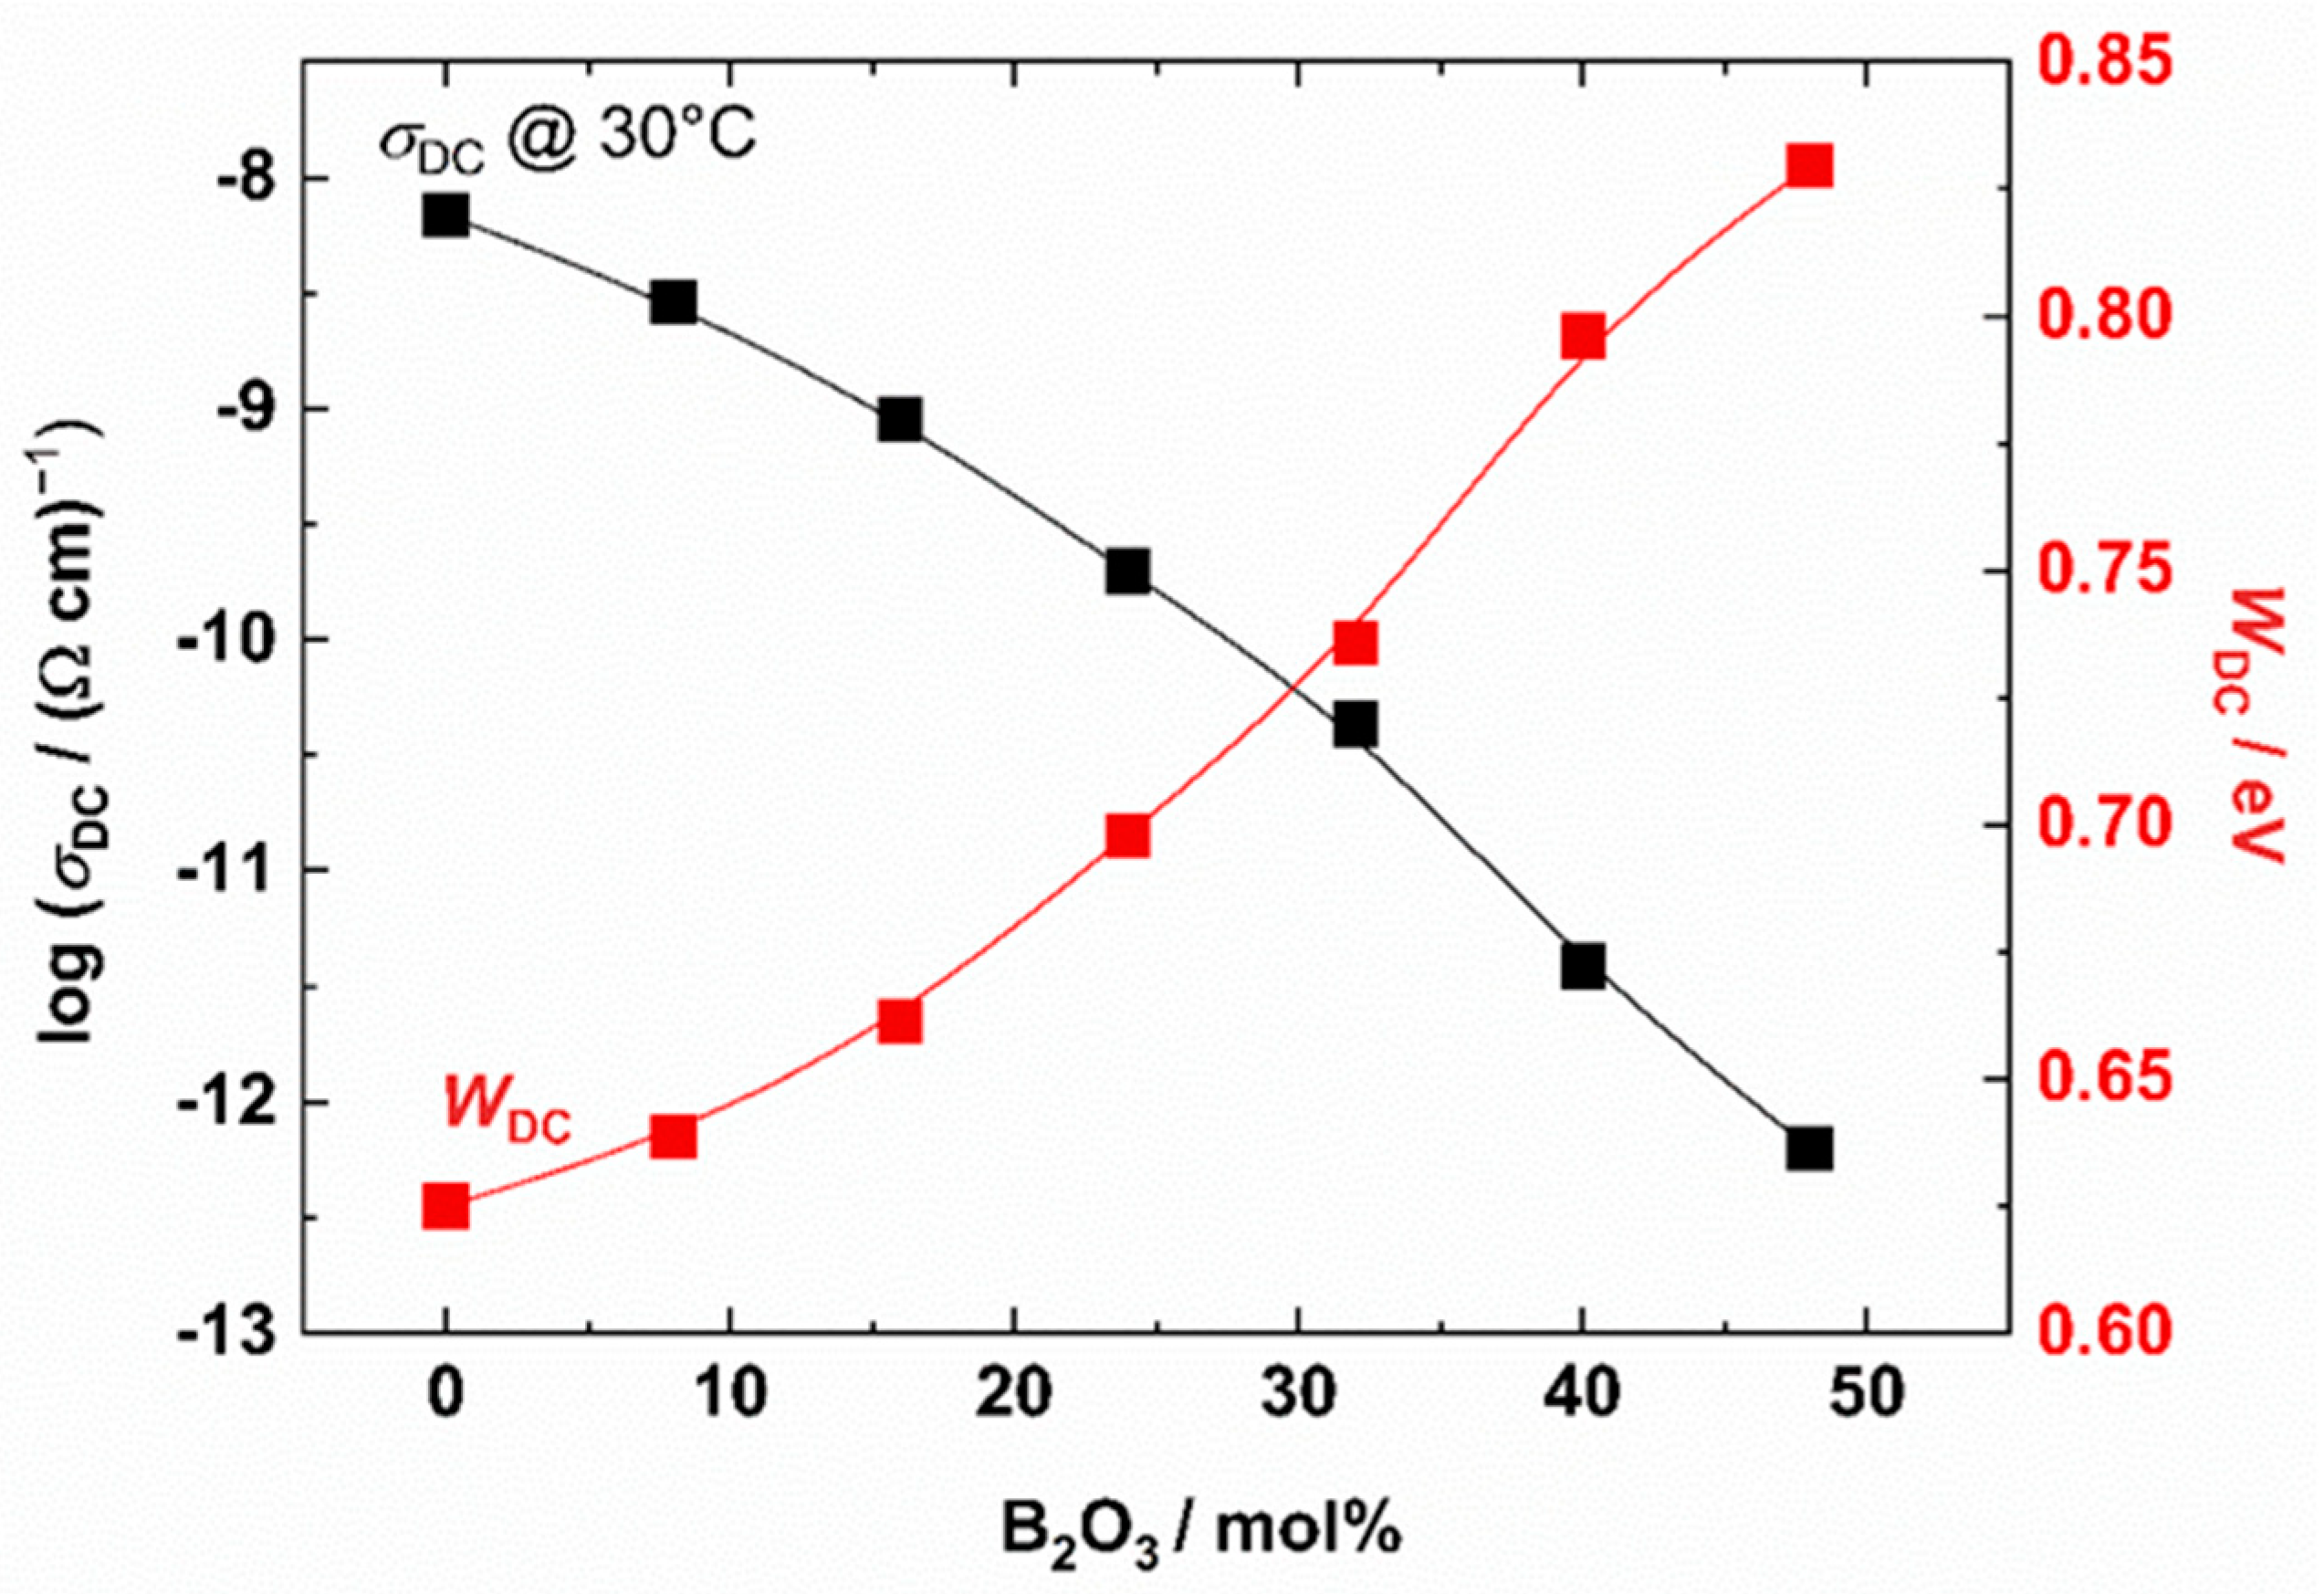
where σ D C is the DC conductivity, σ 0 * is the pre-exponent, kB is the Boltzmann constant and T is the temperature (K). The activation energy, WDC, and DC conductivity, σ D C , at 30 °C for all investigated glasses are shown in Figure 9 and listed in Table 3. With increasing B2O3 content, the DC conductivity continuously decreases over more than four orders of magnitude while the activation energy for DC conductivity, WDC, follows the opposite trend with values increasing from 0.62 to 0.87 eV.
The observed continuous decrease in ionic conductivity with the addition of B2O3 can be mainly related to the decrease in the number density of sodium ions NV, see Table 3, since B2O3 is added at the expense of all oxides Na2O, Nb2O5 and P2O5. This is true for all glasses containing up to 40 mol% of B2O3 since they exhibit a perfect correlation between DC conductivity and NV; note that for glasses containing 0 and 8 mol% of B2O3 NV decreases only slightly, see Table 3, which is reflected in a less steep change of DC conductivity and activation energy for DC conductivity. However, glass containing 48 mol% of B2O3 exhibits a small but evident departure from the steep change if both DC conductivity and activation energy, which suggests that apart from the effect of the number density of sodium ions, the glass network influences the ion dynamic. The 11B MAS NMR spectrum reveals that in this glass, unlike in other glasses from this series, the fraction of BO3 units is higher than that of BO4 units, the ratio being 59%:41%, which suggests that the formation of boron units with trigonal coordination has a facilitating effect on ion dynamics. This is in contrast to the results reported by Raguenet et al. [15] who showed that the dominance of BO3 units causes a decrease in conductivity due to a decrease in the number of the easy conduction pathways provided mainly by BO4 units. However, in their study [15] the glass system contained two glass forming oxides, P2O5 and B2O3 which is not the case here. Therefore, it is likely that the combination of a high fraction of BO3 units, NbO6 octahedra which were reported to have facilitating effect on the ionic transport [28], as well as a smaller number of NBO bonds which can act as traps for ions, causes an ease of the transport of sodium ions in the glass with the highest amount of B2O3.
In the following, we examine the features of the frequency-dependent conductivity of these glasses by applying the scaling procedure introduced by Summerfield [29,30]. The Summerfield scaling procedure is expressed as:
( σ ( v , T ) σ D C ( T ) ) = f ( v T σ D C ( T ) )
where f(x) denotes the scaling function, and other quantities have their usual meaning. The Summerfield scaling can be understood as mobility scaling. Its validity signifies that the only role of temperature is to speed up (as temperature increases) or slow down (as temperature decreases) the charge carrier dynamics without changing the conduction mechanism. For each glass in this study, the application of Summerfield scaling yields a conductivity master curve, see Figure 10a for 8 mol% B2O3 glass, indicating that the time-temperature superposition principle is valid and that the conduction mechanism for all glasses does not change with temperature. In the next step, we applied super-scaling in which individual conductivity master curves are plotted in the same graph, see Figure 10b. As can be seen from the figure, the individual conductivity master curves do not overlap and thus fail to produce a conductivity super-master curve. This is in line with previous studies [31,32] where similar shifts were related to the changes in the number density of mobile ions. However, upon application of an arbitrary shift along the scaled frequency axis all conductivity master-curves perfectly superimpose, see Figure 10c, revealing that the shape of the conductivity dispersion does not change with composition. Similar results were reported for many mixed glass-former systems [33,34].
Another parameter which can be extracted from the frequency-dependent conductivity is the typical length scale for diffusive motions of ions known as Sidebottom length, L, defined as [35]:
L 2 = 6 k B N V q 2 σ D C T f 0
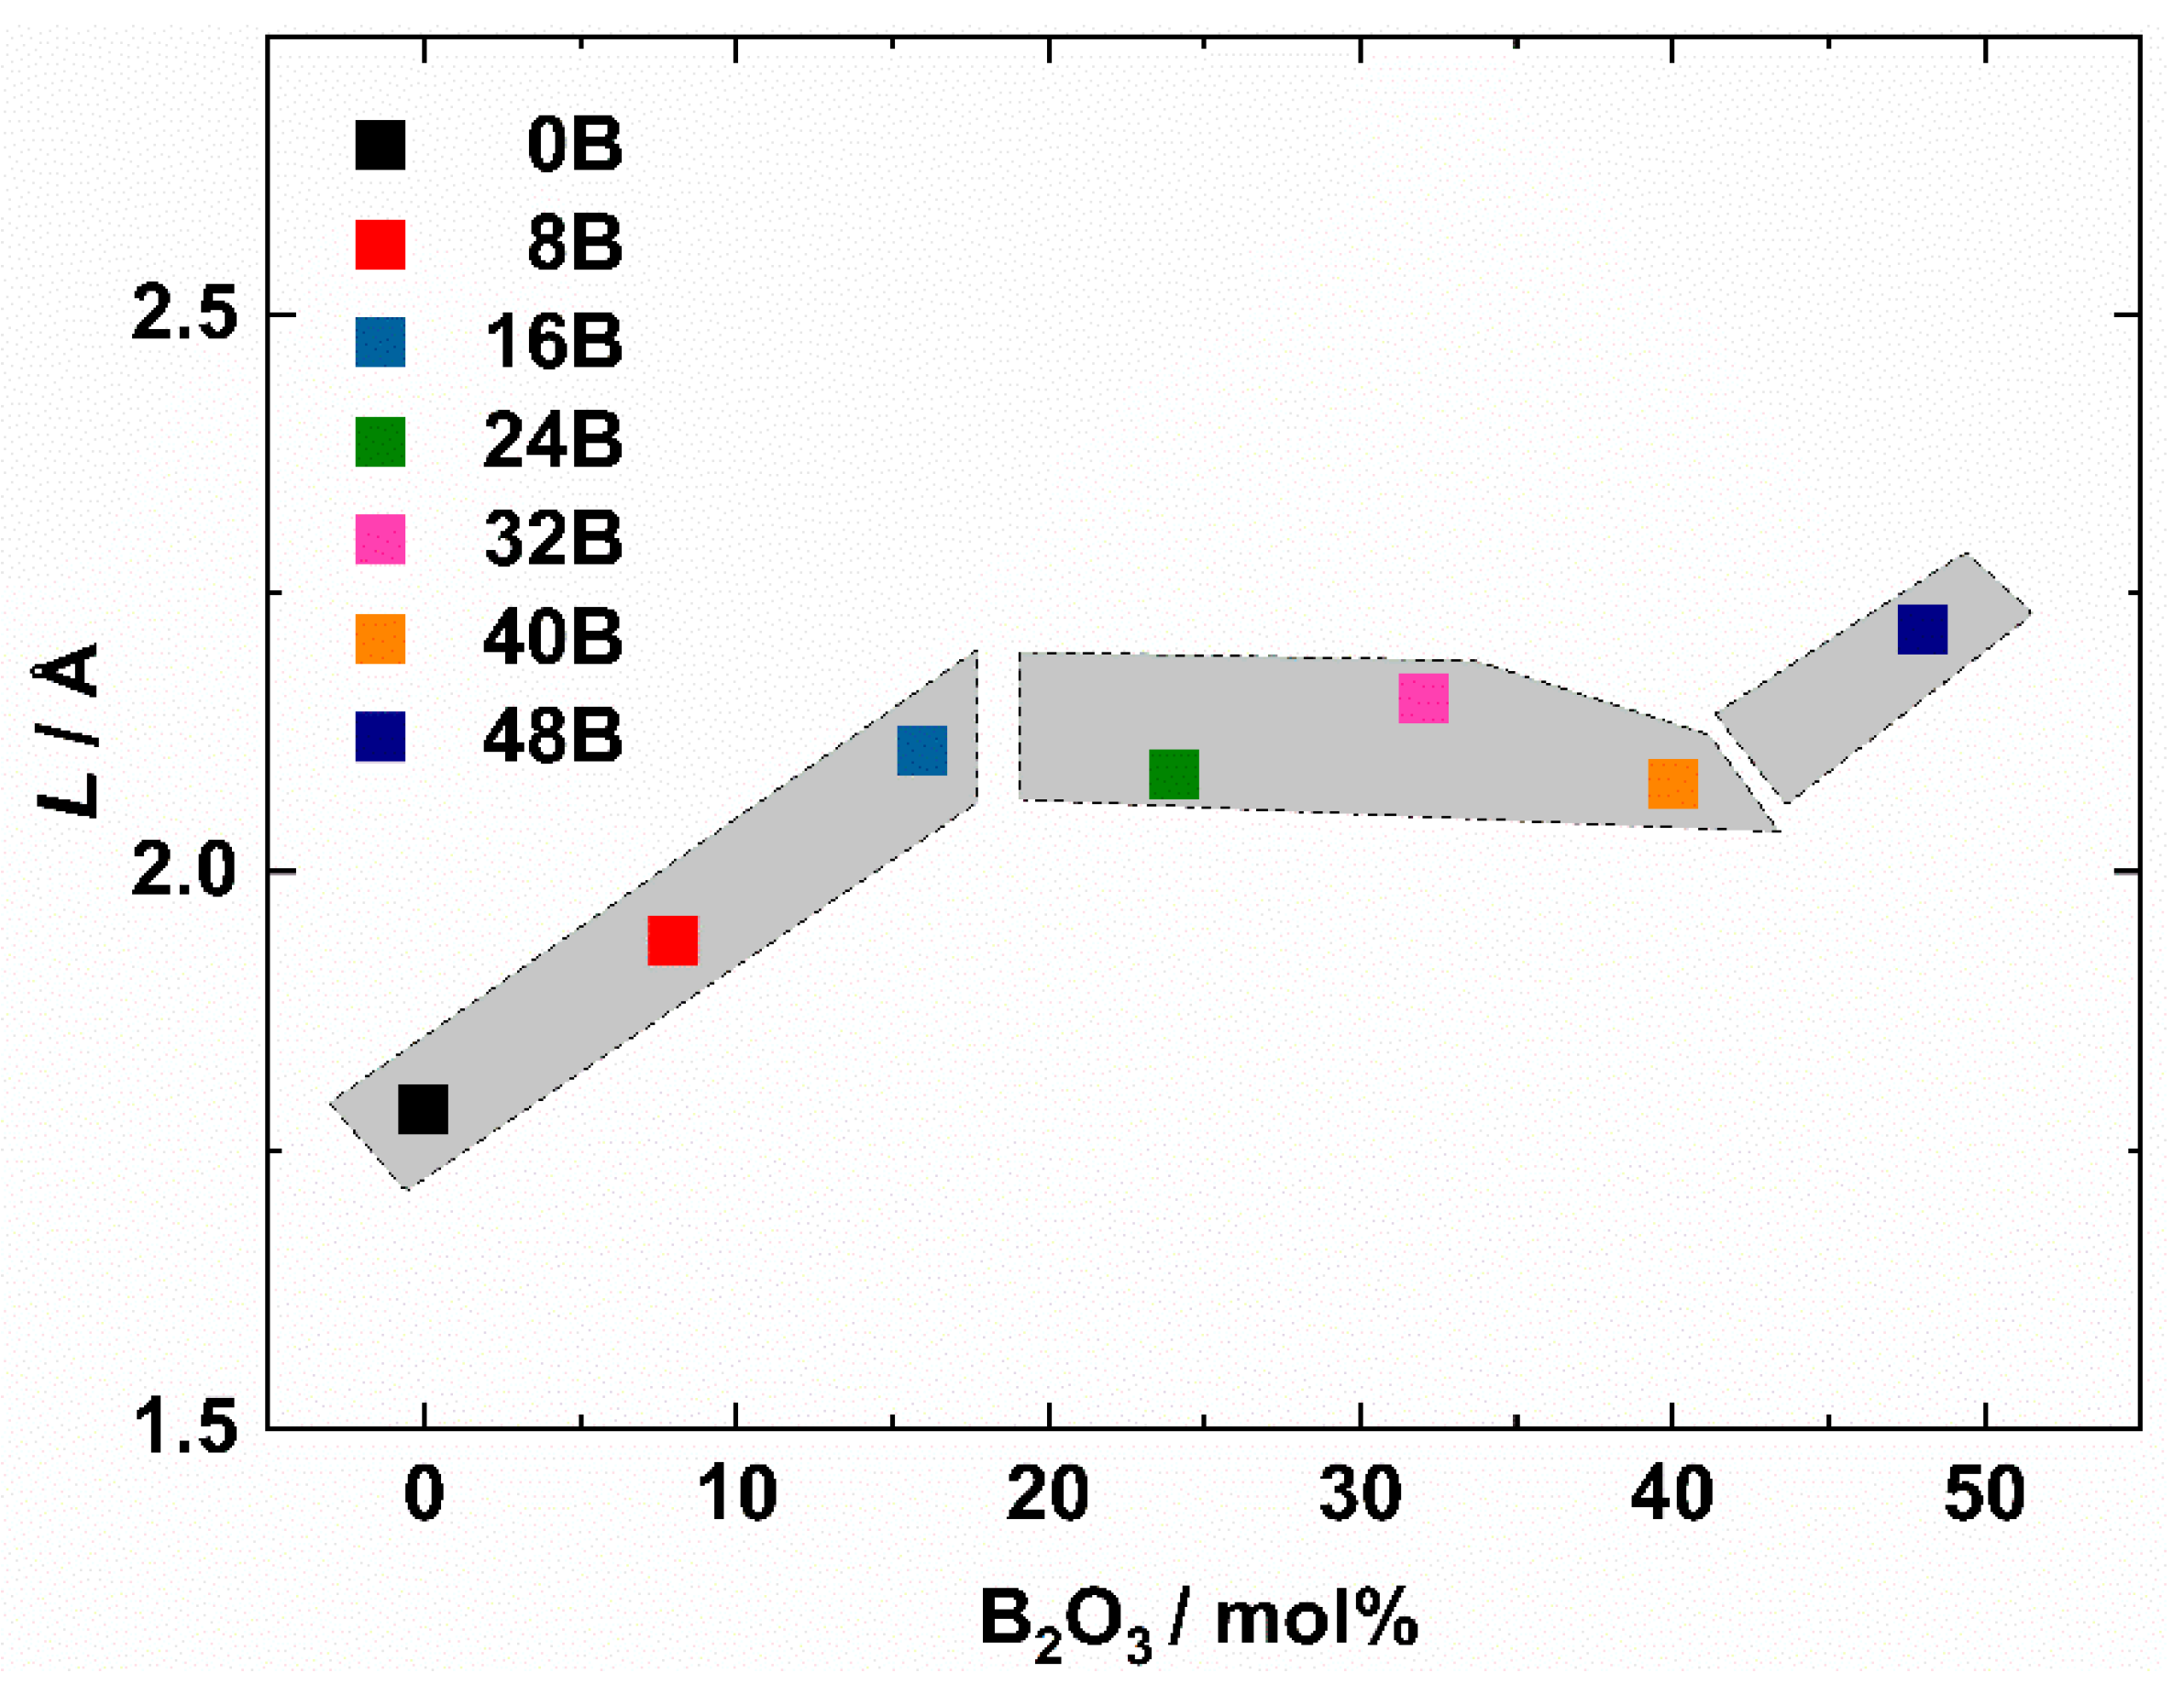
where f0 is a characteristic frequency determined as from 2σDC. Figure 11 shows the dependence of the Sidebottom length on the amount of B2O3. Interestingly, the typical length scale for diffusive motions of ions exhibits three different regions; the initial increase up to 16 mol% of B2O3, a nearly constant value in the intermediate range of compositions and the second increase for a glass containing 48 mol% of B2O3. These trends correlate well with the trends in DC conductivity and indicate that short-range transport and macroscopic (DC) transport are interconnected and that are both controlled by the structural features of the glass network.

4. Conclusions

Homogeneous glasses can be prepared in the series (100 − x)[0.4Na2O-0.2Nb2O5-0.4P2O5]-xB2O3 for x = 0–48 mol% B2O3. We have found that there is an optimum bonding relation in the glass network at about 8–16 mol% B2O3, where glass transition temperature reaches its maximum. We suppose that there is some space for reaching an optimum connectedness of the glass network for BO4 groups prevailing in the glass structure at the low B2O3 content. It is a little paradoxical that a decrease of Tg, with further additions of B2O3, is associated with an increasing connectedness of the network because the number of nonbridging oxygen atoms decreases. Nevertheless, heteropolar bonds are usually preferred in the borophosphate glasses before the homopolar bonds. The Raman spectra indicated that NbO6 coordination prevails in the studied glasses. This type of niobium coordination was supported also by the results of crystallization experiments. Investigation of 11B MAS NMR spectra revealed the coexistence of both BO4 and BO3 units in these glasses. We believe that the observed increase in the relative number of BO3 units can be the reason for the limit of glass formation in this glass series at 48 mol% B2O3. With the increase of B2O3 content through the glass series, the ionic conductivity decreases mainly due to a decrease in the concentration of Na+ ions. However, for the glass with the highest amount of B2O3 the facilitating effect of the glass network composed of BO3 and NbO6 units was observed in both short-range and long-range dynamics of sodium ions.

Author Contributions

P.M.: Investigation, Visualization, Resources. T.H.: Investigation, Visualization, Methodology. L.K.: Conceptualization, Methodology, Writing—review & editing. M.R.: Investigation, Visualization. L.P.: Investigation, Visualization, Writing—review & editing. L.M.: Writing—review & editing, Validation. B.R.: Investigation. All authors have read and agreed to the published version of the manuscript.

Funding

This research received no external funding.

Institutional Review Board Statement

Not applicable.

Informed Consent Statement

Not applicable.

Data Availability Statement

Not applicable.

Acknowledgments

The Czech authors thank Z. Černošek for Raman spectra measurements, the project No. LM2018103 for the possibility of X-ray diffraction experiments and L. Beneš for the X-ray diffraction measurements. LM thanks the Chevreul Institute (FR 2638), which is funded by the Ministère de l’Enseignement Supérieur, de la Recherche et de l’Innovation, the Hauts-de-France Region and FEDER. M.R. and L.P. thank the Croatian Science Foundation and the POLARION-GLASS project IP-2018-01-5425.

Conflicts of Interest

The authors declare no conflict of interest.

References

  1. Ducel, J.F.; Videau, J.J. Physical and chemical characterizations of sodium borophosphate glass. J. Non-Cryst. Solids 1992, 13, 271–274. [Google Scholar] [CrossRef]
  2. Petit, L.; Cardinal, T.; Videau, J.J.; Guyot, Y.; Boulon, G.; Couzi, M.; Buffeteau, T. Erbium luminescence properties of niobium-rich oxide glasses. J. Non-Cryst. Solids 2005, 351, 2076–2084. [Google Scholar] [CrossRef]
  3. Petit, L.; Cardinal, T.; Videau, J.J.; Smektala, F.; Jouan, T.; Richardson, K.; Schulte, A. Fabrication and characterization of new Er3+ doped niobium borophosphate glass fiber. Mater. Sci. Eng. B 2005, 117, 283–286. [Google Scholar] [CrossRef]
  4. Scagliotti, M.; Villa, M.; Chiodelli, G. Short range order in the network of the borophosphate glasses: Raman results. J. Non-Cryst. Solids 1987, 93, 350–360. [Google Scholar] [CrossRef]
  5. Villa, M.; Scagliotti, M.; Chiodelli, G. Short range order in the network of the borophosphate glasses: A 31P NMR-MAS (Magic Angle Spinning) study. J. Non-Cryst. Solids 1987, 94, 101–121. [Google Scholar] [CrossRef]
  6. Brow, R.K.; Tallant, D.R. Structural design of sealing glasses. J. Non-Cryst. Solids 1997, 222, 396–406. [Google Scholar] [CrossRef]
  7. Zielniok, D.; Cramer, C.; Eckert, H. Structure/property correlations in ion-conducting mixed network-former glasses: Solid-state NMR studies of the system Na2O-B2O3-P2O5. Chem. Mater. 2007, 19, 3162–3170. [Google Scholar] [CrossRef]
  8. Carta, D.; Qiu, D.; Guerry, P.; Ahmed, I.; Abou Neal, A.A.; Knowles, J.C.; Smith, M.E.; Newport, R.J. The effect of composition on the structure of sodium borophosphate glasses. J. Non-Cryst. Solids 2008, 354, 3671–3677. [Google Scholar] [CrossRef]
  9. Rascar, D.; Rinke, M.T.; Eckert, H. The mixed-network former effect in phosphate glasses: NMR and XPS studies of the connectivity distribution in the glass system (NaPO3)1-x(B2O3)x. J. Phys. Chem. C 2008, 112, 12530–12539. [Google Scholar] [CrossRef]
  10. Rinke, M.T.; Eckert, H. The mixed network former effect in glasses: Solid state NMR and XPS structural studies of the glass system (Na2O)x(BPO4)1-x. Phys. Chem. Chem. Phys. 2011, 13, 6552–6555. [Google Scholar] [CrossRef]
  11. Christensen, R.; Byer, J.; Olson, G.; Martin, S.W. The densities of mixed glass former 0,35Na2O+0,65[xB2O3+(1-x)P2O5] glasses related to the atomic fractions and volumes of short range structures. J. Non-Cryst. Solids 2012, 358, 583–589. [Google Scholar] [CrossRef]
  12. Christensen, R.; Byer, J.; Olson, G.; Martin, S.W. The glass transition temperature of mixed glass former 0,35Na2O+0,65[xB2O3+(1-x)P2O5] glasses. J. Non-Cryst. Solids 2012, 358, 826–831. [Google Scholar] [CrossRef]
  13. Christensen, R.; Olson, G.; Martin, S.W. Structural studies of mixed glass former 0,35Na2O+0,65[xB2O3+(1-x)P2O5] glasses by Raman and 11B and 31P magic angle spinning nuclear magnetic spectroscopies. J. Phys. Chem. B 2013, 117, 2169–2179. [Google Scholar] [CrossRef] [PubMed] [Green Version]
  14. Christensen, R.; Olson, G.; Martin, S.W. Ionic conductivity of mixed glass former 0,35Na2O+0,65[xB2O3+(1-x)P2O5] glasses. J. Phys. Chem B 2013, 117, 16577–16586. [Google Scholar] [CrossRef] [PubMed] [Green Version]
  15. Raguenet, B.; Tricot, G.; Silly, G.; Ribes, M.; Padel, A. Revisiting the ‘mixed glass former effect’ in ultra-fast quenched borophosphate glasses by advanced 1D/2D solid state NMR. J. Mater. Chem. 2011, 21, 17693–17704. [Google Scholar] [CrossRef]
  16. Moguš-Milanković, A.; Sklepić, K.; Blažanović, H.; Mošner, P.; Vorokhta, M.; Koudelka, L. Influence of germanium oxide addition on the electrical properties of Li2OB2O3-P2O5 glasses. J. Power Sources 2013, 242, 91–98. [Google Scholar] [CrossRef]
  17. Koudelka, L.; Pospíšil, J.; Mošner, P.; Montagne, L.; Delevoye, L. Structure and properties of potassium niobato-borophosphate glasses. J. Non-Cryst. Solids 2008, 354, 129–133. [Google Scholar] [CrossRef]
  18. International Centre of Diffraction Data. Joint Committee on Powder Diffraction Standards; International Centre of Diffraction Data: Swarthmore, PA, USA, 2022. [Google Scholar]
  19. Cardinal, T.; Fargin, E.; le Flem, G.; Couzi, M.; Canioni, L.; Segonds, P.; Sarger, L.; Ducasse, A.; Adamietz, F. Nonlinear optical properties of some niobium (V) oxide glasses. Eur. J. Solid State Inorg. Chem. 1996, 33, 597–605. [Google Scholar]
  20. Raguenet, B.; Tricot, G.; Silly, G.; Ribes, M.; Padel, A. The mixed glass former effect in twin-roller quenched lithium borophosphate glasses. Solid State Ion. 2012, 208, 25–30. [Google Scholar] [CrossRef]
  21. Chenu, S.; Werner-Zwanziger, U.; Calahoo, C.; Zwanziger, J.W. Structure and properties of NaPO3–ZnO–Nb2O5–Al2O3 glasses. J. Non-Cryst. Solids 2012, 358, 1795–1805. [Google Scholar] [CrossRef]
  22. Sene, F.F.; Martinelli, J.R.; Gomes, L. Synthesis and characterization of niobium phosphate glasses containing barium and potassium. J. Non-Cryst. Solids 2004, 348, 30–37. [Google Scholar] [CrossRef]
  23. Hidi, I.J.; Melinte, G.; Stefan, R.; Bindea, M.; Baia, L. The study of the structure and bioactivity of the B2O3 • Na2O•P2O5 system. J. Raman Spectrosc. 2013, 44, 1187–1194. [Google Scholar] [CrossRef]
  24. Flambard, A.; Videau, J.J.; Delevoye, L.; Cardinal, T.; Labrugère, C.; Rivero, C.A.; Couzi, M.; Montagne, L. Structure and nonlinear optical properties of sodium–niobium phosphate glasses. J. Non-Cryst. Solids 2008, 354, 3540–3547. [Google Scholar] [CrossRef]
  25. Longo, J.M.; Kierkegaard, P. The crystal structure of NbOPO4. Acta Chem. Scand. 1966, 20, 72–78. [Google Scholar] [CrossRef]
  26. Leclaire, A.; Chahboun, H.; Groult, D.; Raveau, B. The crystal structure of β-NbPO5. Z. Kristallogr. 1986, 177, 277–286. [Google Scholar] [CrossRef]
  27. Komatsu, T.; Honma, T.; Tasheva, T.; Dimitrov, V. Structural role of Nb2O5 in glass-forming ability, electronic polarizability and nanocrystallization in glasses: A review. J. Non-Cryst. Solids 2022, 581, 121414. [Google Scholar] [CrossRef]
  28. Razum, M.; Pavić, L.; Ghussn, L.; Moguš-Milanković, A.; Šantić, A. Transport of potassium ions in niobium phosphate glasses. J. Am. Ceram. Soc. 2021, 104, 4669–4678. [Google Scholar] [CrossRef]
  29. Summerfield, S. Universal low-frequency behaviour in the a.c. hopping conductivity of disordered systems. Philos. Mag. B 1985, 52, 9–22. [Google Scholar] [CrossRef]
  30. Summerfield, S.; Butcher, P.N. Universal behaviour of AC hopping conductivity in disordered systems. J. Non-Cryst. Solids 1985, 77–78, 135–138. [Google Scholar] [CrossRef]
  31. Roling, B.; Happe, A.; Funke, K.; Ingram, M.D. Carrier concentrations and relaxation spectroscopy: New information from scaling properties of conductivity spectra in ionically conducting glasses. Phys. Rev. Lett. 1997, 78, 2160–2163. [Google Scholar] [CrossRef]
  32. Roling, B. Scaling properties of the conductivity spectra of glasses and supercooled melts. Solid State Ion. 1998, 105, 185–193. [Google Scholar] [CrossRef]
  33. Pavić, L.; Fazinić, S.; Ertap, H.; Karabulut, M.; Moguš-Milanković, A.; Šantić, A. Polaronic conductivity in iron phosphate glasses containing B2O3. Materials 2020, 13, 2505. [Google Scholar] [CrossRef] [PubMed]
  34. Banhatti, R.D.; Cramer, C.; Zielniok, D.; Robertson, A.J.; Ingram, M.D. Insights into ion-network interactions and ion transport in glass. Z. Für Phys. Chem. 2009, 223, 1201–1215. [Google Scholar] [CrossRef]
  35. Sidebottom, D.L.; Green, P.F.; Brow, R.K. Structural correlations in the ac conductivity of ion-containing glasses. J. Non-Cryst. Solids 1997, 222, 354–360. [Google Scholar] [CrossRef]
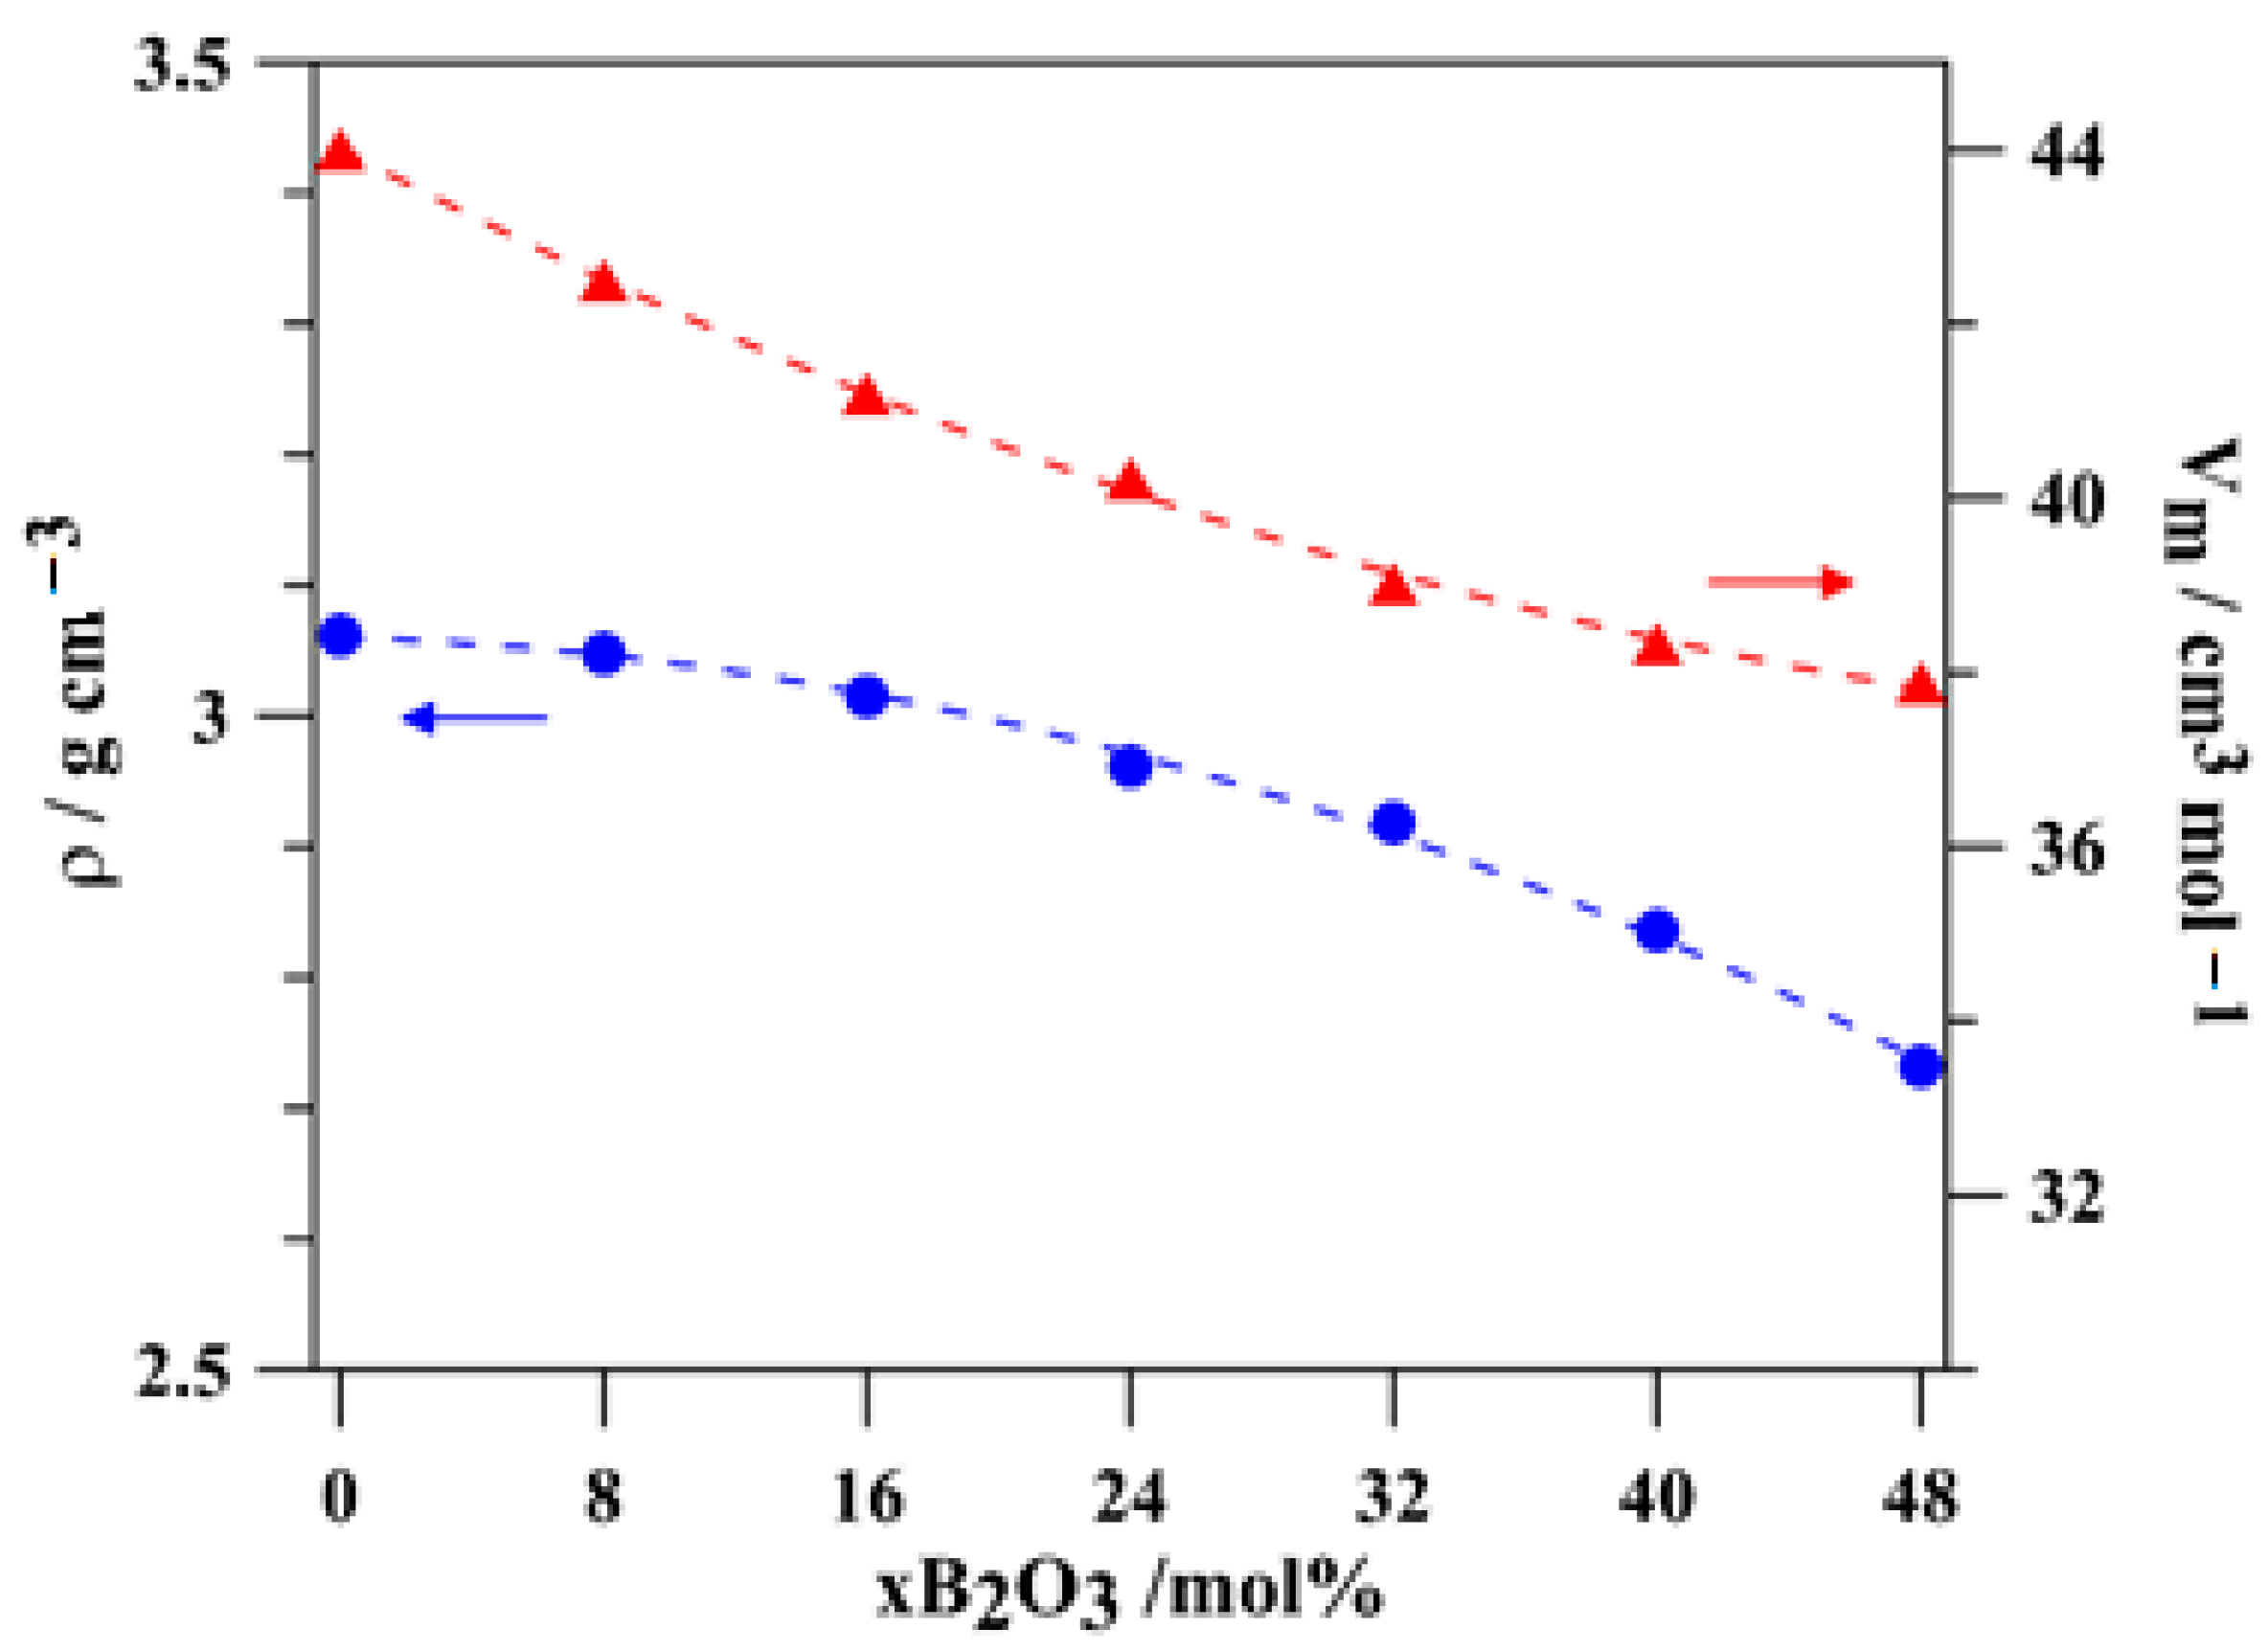
Figure 1. Density (blue line), ρ, and molar volume (red line), VM, in the glass series (100 − x)[40Na2O-20Nb2O5-40P2O5]-xB2O3.
Coatings 12 01626 g001
Figure 2. DTA curves from the glass series(100 − x)[0.4Na2O-0.2Nb2O5-0.4P2O5]-xB2O3.
Coatings 12 01626 g002
Figure 3. Glass transition temperature, Tg, dilatometric softening temperature, Td, and coefficient of thermal expansion, α, in the glass series (100 − x)[0.4Na2O-0.2Nb2O5-0.4P2O5]-xB2O3. (Dashed lines are only a guide to the eye.).
Coatings 12 01626 g003
Figure 4. Raman spectra of the glass series (100 − x)[0.4Na2O-0.2Nb2O5-0.4P2O5]-xB2O3.
Coatings 12 01626 g004
Figure 5. (a) The 11B MAS NMR spectra of the glass series (100 − x)[0.4Na2O-0.2Nb2O5-0.4P2O5]-xB2O3. (b) Relative number of BO4 and BO3 structural units obtained by the decomposition of 11B MAS NMR spectra of (100 − x)(40Na2O-20Nb2O5-40P2O5)-xB2O3 glasses. (Dashed lines are only a guide to the eye.).
Coatings 12 01626 g005
Figure 6. The31P MAS NMR spectra of the glass series (100 − x)[0.4Na2O-0.2Nb2O5-0.4P2O5]-xB2O3.
Coatings 12 01626 g006
Figure 7. XRD patterns of crystallized samples of the (100 − x)[0.4Na2O-0.2Nb2O5-0.4P2O5]-xB2O3 glasses.
Coatings 12 01626 g007
Figure 8. (a) Conductivity spectra of 8 mol% B2O3 glass and (b) Arrhenius plot of DC conductivity of the (100 − x)[0.4Na2O-0.2Nb2O5-0.4P2O5]-xB2O3 glasses. Solid lines represent the least-square linear fits to experimental data.
Coatings 12 01626 g008
Figure 9. DC conductivity at 30 °C (black line) and activation energy for DC conductivity (red line) as a function of B2O3 content for (100 − x)[0.4P2O5–0.2Nb2O5–0.4P2O5]-xB2O3, 0 ≤ x≤ 48 mol%, glasses. The lines are drawn as guides for the eye.
Coatings 12 01626 g009
Figure 10. (a) Summerfield master curve for glass 8 mol% B2O3, (b) Construction of super master-curve of the conductivity isotherms using Summerfield scaling procedure for studied glass series, (c) individual master-curves of all glasses shifted along the x-axis to overlap with the reference master-curve of 0B glass.
Coatings 12 01626 g010
Figure 11. Sidebottom length as a function of B2O3 content in (100 − x)[0.4Na2O-0.2Nb2O5-0.4P2O5]-xB2O3, 0 ≤ x≤ 48 mol%, glasses. The error bars are at most of the order of the symbol size.
Coatings 12 01626 g011
Table 1. Composition, density, ρ, molar volume, VM, glass transition temperature, Tg, dilatometric softening temperature, Td, the coefficient of thermal expansion, α, and the index of refraction, nd, of (100 − x)[0.4Na2O-0.2Nb2O5-0.4P2O5]-xB2O3 glasses.
Na2OP2O5Nb2O5B2O3ρ ± 0.02VM ± 0.5Tg ± 2Td ± 1α ± 0.5nd ± 0.005
Batch/mol%g∙cm−3cm3∙mol−1°Cppm/°C[-]
40402003.0644.0149653916.41.655
36.836.818.483.0542.552555915.31.658
33.633.616.8163.0141.2352856114.61.658
30.430.415.2242.9640.2251355513.41.656
27.227.213.6322.9239.751054712.61.644
242412402.8438.8748453012.21.629
20.820.810.4482.7337.8845853411.81.618
Table 2. Raman bands and corresponding assignment of the (100 − x)[0.4Na2O-0.2Nb2O5-0.4P2O5]-xB2O3 glasses.
Raman Shift
cm−1
AssignmentRef.
248–261O–P–O and O–Nb–O coupled deformation mode[21]
400–470O–P–O and O–Nb–O coupled mode[21,22]
600–700P–O–Bsym stretch and P–O–Psym stretch modes[13,23]
770–824P–O–B stretching modes[19,23]
771P–O–P stretching mode[21,23]
928–934Nb–O bonds in NbO6 octahedra[21,24]
1211P–O–P (Q2) stretching vibration[21,23]
Table 3. The number density of sodium ions, N, DC conductivity, σ D C , determined as a plateau value in the conductivity isotherms, activation energy, WDC, for (100 − x)[0.4Na2O-0.2Nb2O5-0.4P2O5]-xB2O3, 0 ≤ x ≤ 48 mol%, glasses.
SampleN aWσDCb
cm3eV(Ωcm)−1
B01.08 × 10220.626.88 × 10−9
B81.04 × 10220.642.89 × 10−9
B169.77 × 10210.669.04 × 10−10
B249.10 × 10210.691.98 × 10−10
B328.28 × 10210.744.30 × 10−11
B407.50 × 10210.793.86 × 10−12
B486.61 × 10210.836.26 × 10−13
a calculated from the glass composition and density; b values at 30 °C.
Publisher’s Note: MDPI stays neutral with regard to jurisdictional claims in published maps and institutional affiliations.