Abstract
Plasma electrolytic oxidation (PEO) is a preferable process applied to optimize the corrosion and wear properties of metals and their alloys, particularly magnesium (Mg) alloys used in highly demanded medical and aerospace applications. In this project, AZ series alloys (AZ31, AZ61, AZ91), which are the major commercial magnesium alloys, were coated using the PEO process under varying experimental conditions involving electrolyte with Si based ionic chemical networks together with hydroxyl and fluoride functionalities. Surface analysis was carried out using scanning electron microscopy (SEM). Data were further simulated and analyzed using imageJ software. SEM results showed that, increasing the concentration of Al as in AZ91 and AZ61, dendrites-dominated the microstructure at shorter processing times; a cratered-dendritic matrix was obtained at longer processing time. From the composition analysis, fluoride complex peaks were obtained for the higher Al-content alloy (AZ91), due to the localized intensive discharges made regular by the stable β-phases within the Mg matrix. Corrosion analysis was carried out using potentiodynamic polarization. The compact structure, higher growth rate, and stable chemical phases of MgF2 contributed to the highest hardness values ~1271.2 HV and corrosion potential ~−0.18 V for the AZ91 alloy.
1. Introduction
Magnesium and its alloys are in high demand in multiple high-tech industries, such as aerospace, electronics, biomedical, and the automobile industry, due to physical and electronic properties, such as low density, thermal conductivity, electrical conductivity characteristics, vibration damping, and blocking of electromagnetic waves [1,2,3,4,5,6,7]. Among the Mg alloys, AZ series alloys are well-known for their abundance, general purpose use and reasonable material cost. However, corrosion continues to be a great concern and a main issue affecting the implementation of all of these alloys [8,9,10]. Fundamentally, the AZ-series alloys (Mg-Al-Zn) have two main crystallographic phases: the “α” phase, and the “β” phase (Mg17Al12); both are intermetallic compounds [9,11,12,13,14]. The primary “α” and the eutectic “β” phases have different electrochemical behaviors, depending on their different aluminum contents [15,16,17]. Thus, to understand the nature of corrosion of these AZ-series alloys, the role of “α” and “β” phases must be considered and explored, as previously presented and discussed [18,19,20]. For instance, various researchers explored the anti-corrosion role of “β” phase in AZ91 [13,21,22], and whether the β-phase could act as an inert corrosion barrier [23,24]. However, there also exists the opposite opinion which states that Mg17Al12 precipitates, due to their cathodic nature with respect to the α matrix, could be detrimental for the overall corrosion resistance [25]. For instance, Song et al. [26] measured the individual polarization curves for “α” and “β” phases in 1 N NaCl solution, and observed that the corrosion current density obtained from the “β” phase was much lower than that of the “α” phase. This finding led these researchers to the conclusion that the “β” phase was very stable in NaCl solutions and that it was inert to corrosion. However, due to the cathodic nature of the “β” phase, it could be an effective cathode for the “α” matrix. Thus, it was suggested whether “β” phase could serve as a galvanic cathode, causing accelerated corrosion of the “α” matrix, conditioned to small volume fraction. On the contrary, the higher “β” phase volume-fraction could cause a superior anodic barrier regime to inhibit the overall corrosion of the alloy, because in this case corrosion is limited to occurring on the “α” phase surface area [27,28].
“Al” contents in the AZ-series have been observed also having a negative impact on corrosion. This metal could linearly reduce the iron tolerance limit with increasing in its content get increased [29,30]. Thus, an optimized concentration of aluminum under each alloying condition must be required to positively increment the effective anti-corrosion properties of AZ-series alloys. In earlier scripts, it has been reported that increasing aluminum up to 4% could cause a decrease in the corrosion rate. However, upon further addition of aluminum to the Mg-matrix up to 9%, resulted in a modestly improved corrosion resistance [26].
The beneficial role of aluminum was found not only limited to the intrinsic corrosion enhancement, but also responsible for increasing of the passive film stability formed as a result of oxidation. Therefore, the stability of anodic films of the AZ-series magnesium alloys was found to be more significant with increasing of aluminum content in the substrate [31]. A very different and unique observation was reported by Lunder et al. [21] who proposed that aluminum accelerates anodic dissolution below 8%; decreases in corrosion were found above 10%. Mathieu et al. [32] suggested, that the semi-solid process (SSP), leading to an Al enrichment of the “α” phases, would be a way to reduce the AZ91 alloy corrosion.
These different outcomes of the reports published by the research community about the role of Al in the alloying process and alloying structuring lends interest to further understand the role of Al concentration on the coating properties, formed on various AZ-series alloys. Studies of various AZ-series alloys coated using the plasma electrolytic oxidation (PEO) process have been reported. PEO coating is an electrochemical surface treatment process which can produce thick polycrystalline ceramic coatings on light metal alloys (Al, Ti, Mg etc.), by incorporating coating species directly from the electrolyte and substrate material [33,34,35,36,37]. Anodization layers are formed under the influence of short-lived micro-arcs and sparks, produced by the breakdown of the anodization gases and porous oxide layers. This chemistry is all driven by applying an external high voltage source. The anodization amorphous layers convert to polycrystalline and ceramic layers due to the high localized temperature caused by the micro-arcs and immediate quenching of the coating layers in the cold electrolyte. The process from a chemical mechanistic point of view is extraordinarily complex due to the involvement of several physical processes (sintering, quenching, thermal, breakdown etc.) and chemical processes (both oxidation, reduction). A full and exact mechanistic picture of this process therefore may not be immediately forthcoming. However, in short, the PEO process demonstrates the advantage of producing thick, environmentally friendly ceramic coatings on various metallic substrates, conditioned to electrolyte compositions and experimental parameters [38,39,40]. Therefore, our article is devoted to the investigation of the PEO coatings on the various AZ-series alloys under various processing conditions.
2. Experimental Protocol
2.1. Specimen and Coating Process
The as-received commercial AZ31, AZ61, and AZ91 magnesium alloys were sectioned, divided into the form of so-called “coupons.” The diameter and thickness of the coupons were 13 and 5.9 mm, respectively. Sandpaper was used to polish the substrate samples up to grade 2000, followed by cleaning and degreasing in deionized water and ethanol. Surface roughness of the polished sample was found to be in the range of 0.1 ± 0.05 μm. An external power supply was used to produce PEO coatings, under various processing conditions. Maximum power of the power supply was ~20 kW, while the current regime used during the experiment was of hybrid type with ~200 AC and 260 DC. During the whole treatment, the voltage was maintained constant while the current density was decreased with coating thickness in the range (100–1500 mA/cm2). Four samples of each alloy were coated using different treatment times for 5, 15, 30, and 60 min, respectively, and named as AZ (x,y,x)-5, AZ (x,y,x)-15, AZ (x,y,x)-30, AZ (x,y,x)-60; where (x,y,z) represent alloy code i.e., 31, 61, 91. Composition of the electrolyte for each experiment was fixed as: 12 g/L sodium silicate (Na2SiO3), 3 g/L sodium hydroxide (NaOH) and 0.3 g/L (Na2SiF6). During the whole PEO process, the temperature of the electrolyte was maintained below 25 °C using a cool water circulator. The coated samples were rinsed with deionized water and dried in air after each PEO process.
2.2. Phase Composition and Microstructure
X-ray diffraction (XRD, MiniFlex II, Rigaku, Tokyo, Japan) with a Cu Kα source was used to obtain the composition profile of the coated samples in the range of 20–80 °C and was further investigated using High Score Plus software. The surface microstructure and the cross-section of the coated samples were observed under scanning electron microscope (SEM, JSM-6510, Jeol, Tokyo, Japan). The samples used for the cross-section observation were cut and polished-down to 0.1 μm for SEM examination. The average thickness was calculated for each sample, measured at 20 different positions.
2.3. Hardness and Electrochemical Tests
Vickers hardness of the coated samples was measured, with values obtained from the indentations on the cross-section layers of the coatings. Up to 20 indentations were carried out for each coated sample using a VLPAK2000 Mitutoyo hardness test machine (Mitutoyo, Tokyo, Japan). The average micro-hardness was obtained from the individual indentations. The results of the depth-controlled indentation measurements were obtained under the constant loading/unloading rates of 0.025 N/s with a holding time of 5 s at maximum load.
The corrosion test for each sample was performed using conventional three electrodes solartron electrochemical testing system (1280B, Wonatech, Seoul, Korea), with a saturated calomel electrode as the reference electrode and a graphite electrode as the counter electrode. Each sample was immersed as working electrode into 1 L of electrolyte solution containing 3.5 wt.% NaCl. The exposed surface area of the tested samples in solution was 1.0 cm2. The polarization curves were recorded by increasing the voltage against the reference electrode from −4.0 to 2 V, at a scan rate of 1 mV/s. Corrosion potential and current were obtained using the Tafel analysis software by IVman package. All characterizations of the samples were carried out at room temperature.
3. Results and Discussion
3.1. Microstructrue
The surface of the coated samples can be seen in Figure 1a–l. Two major zones (a) crater region and (b) clusters of incomplete craters and nodular structures, as described in detail previously, can be observed on the surface (Figure 1b) [41]. Craters are the circular areas as indicated by “A” with a hole in the middle, created by strong, however uniform microscopic discharges. The nodular structures as indicated by “B” are the patches and regions around the boundaries of craters as marked in Figure 1. In the case of AZ31, which offers a large number of active sites to the anodization process crater-based morphologies are found to form due to the uniform and high number of discharges at the active sites as shown in Figure 2. However, as the Al-contents increase, the number of active sites decrease. Thus, intensive yet impulsive discharges occur due to higher energy outburst at localized sites including Mg-Al phases, which contribute toward dendrite formation. On the contrary, a combination of dendrites and craters formed at longer processing times, as shown in Figure 1l. The morphology and size of the craters, as well as their ratio relative to the nodular structure, vary and depend on processing conditions. The size of the craters increase with processing time as described by the kinetic equation of grain growth [42].
where d is the average, d0 is the initial grain size, t is processing time (annealing time in case of sintering) k is material constant. n is the grain growth exponent (typically, n = 0.5 depends on pores and impurity doping, solute drag effect on the grain boundary migration, temperature change of the grain growth mechanism, initial grain size distribution). k is sensitive to the temperature of annealing, and can be expressed in an Arrhenius type equation
where “Q” is the activation energy for grain growth and “R” is the gas constant. As can be seen in Figure 1, the craters in the case of AZ31 and AZ61 have spherical shapes and have are seen to form so as to emerge outward. However, for AZ91, the craters have a plain shape. With the increase in the processing time, the size of the craters was increased for all of the coatings. However, in the case of AZ91, a number of small bulbs and nodules were also increased on the surface of coatings. Porosity can also be observed from the surface microstructures (SEM images). Qualitatively, it can be seen that the porosity of the coatings decreases with processing time for all types of substrates. Porosity is higher for short time coated AZ91 and AZ61. However, as the processing time is prolonged, the porosity decreases significantly for AZ91, compared to AZ61 and AZ31. The porosity of the coatings obtained at 60 min processing time can be ordered as: AZ91 < AZ61 < AZ31. For samples of AZ31 and AZ61 coated over shorter time, the sparks are intensive due to the presence of maximum quantity of α-phase compared to AZ91 (with higher Mg11Al17 phases). However, as the processing time increases above 10 min, the number and intensity of discharges begin to decrease, particularly for AZ91. This is why the porosity decreases. In the initial stage, the number of discharges is higher, with the average discharge lifetime being ~0.05–4 ms. The total number of discharges for various processing times can then be estimated: ~5 min (0.6 × 10⁴ to 7.5 × 10⁴), 15 min (1.8 × 10⁴ to 22.5 × 10⁴), 30 min (3.6 × 10⁴ to 45.0 × 10⁴), and 60 min (7.2 × 10⁴ to 90.0 × 10⁴).
d1/n − d01/n = kt
k = k0exp (−Q/RT)
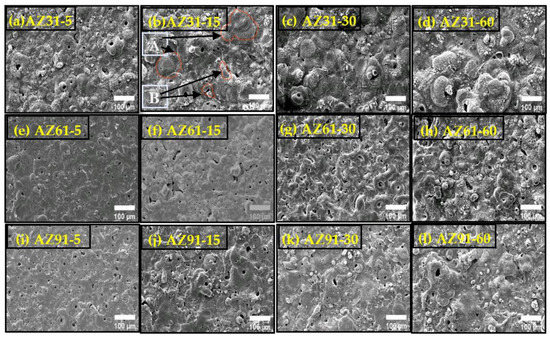
Figure 1.
SEM morphologies of the coated sample (AZ31, AZ61, AZ91) obtained at different processing times. (a) AZ31-5; (b) AZ31-15; (c) AZ31-30; (d) AZ31-60; (e) AZ61-5; (f) AZ61-15; (g) AZ61-30; (h) AZ-61-60; (i) AZ91-5; (j) AZ91-15; (k) AZ91-30 and (l) AZ91-60.
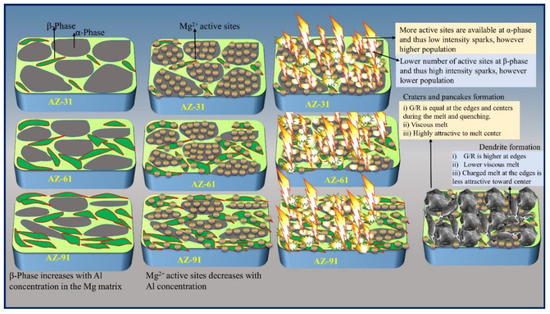
Figure 2.
Schematic diagram of the PEO process and role of α- and β-phase.
Knowledge and implementation of a “dialed in” total number of discharges could provide a way to deposit an estimated quantity of electrolyte species. However, due to the violent nature of the plasma created by a discharge, it highly unlikely that that all the discharges in a given sample and over a time period are constructively utilized in creating the coating layers. The discharge phenomenon has serious impacts on the surface properties, as reported for AZ31 and AZ61. The number of discharges decrease by increasing the processing time of the coatings from 2 to 10 min and then up to a maximum of 15 min. For AZ91, the discharges decreased continuously under the AC regime [43]. The pores are created by the micro discharge channels formed during the PEO process. The surfaces of the coatings are clearly covered by numerous pores whose individual size increase with processing time for all samples. However, their population density decreases with processing time. An increase in the size of individual pore occurs due to an increase in the size of the micro discharge channel occurring through longer processing times [44].
As discussed above, that α- phase due to its higher electropositive character has a higher tendency to form Mg2+ ions during the PEO and co-anodization process, under the effects of both high electric field and high Joule heat [45]. Thus, higher concentrations of Mg2+ around the α-phase offer more active sites for anodization layers and subsequent gaseous species release. Such a proposed mechanism is thought to set the scene to help produce a greater occurrence of plasma sparking. In contrast, the β-phase is relatively more stable and requires higher energy to undergo chemical oxidization. Therefore, a maximum energy drain occurs at singular points causing larger pores, as can be observed for AZ91 (Figure 2). Moreover, the different crater morphologies are more obvious, when the sample is treated for 5 min as shown in Figure 1. In addition to the formation of “pancakes,” dendritic formations can also be observed on coating surfaces. Dendrites form due to the spontaneous blending of the local melts sourced by micro-discharges and the subsequent rapid quenching effect by the cooled electrolytes. Afterward, the compound media (melt and metastable polycrystalline coating material) can form a withered “pancake” shape depending on parameters such as the (a) temperature gradient (G), (b) growth rate (R), (c) viscosity of the melt, and (d) electric charge quantity of the compound media [46,47,48]. A microstructure with a dendritic shape would result if the G/R ratio at the center of the melted zone caused by the plasma discharges would be much lower than that of the edges of the melted zone during the PEO process [49]. In addition, the viscosity and electric charges of the compound media would affect the shape of the dendrite, as articulated in Figure 2.
3.2. Cross Section and Growth Efficiency
3.2.1. Primary Layer
Figure 3 shows the cross section of the coated samples. It can be seen that various Al concentrations caused a variation in the growth speed and thickness. Since the surface of the AZ31, AZ61, and AZ91 has different phase distributions, the amount of energy for transition will be different in each case. The resultant coating layers could have different growth characteristics. Furthermore, the presence of Al causes the nucleation of alumina passivation layer in the initial period of the process together with the MgO and Mg(OH)2 layer. This complex layer composed of MgO-Mg(OH)2 provides localized paths to the discharge channel where the Al2O3 layer helps the layer to stick to the substrate. No damage or cracking layer can be seen in the case of AZ91 coating near the substrate interface. However, due to the lesser quantity of β-phase in AZ61 and AZ31, the initial layer cannot withstand high thermal stress and breakup as observed in Figure 3. In addition, an increased number of crystallographic defects and intermetallic particles present in material AZ91 provides routes for the discharge channels and thus keeps the remaining layer undamaged.
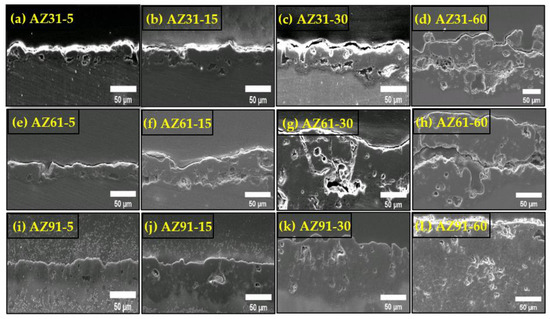
Figure 3.
Cross section morphologies of the coated sample (AZ31, AZ61, AZ91) obtained at different processing times. (a) AZ31-5; (b) AZ31-15; (c) AZ31-30; (d) AZ31-60; (e) AZ61-5; (f) AZ61-15; (g) AZ61-30; (h) AZ-61-60; (i) AZ91-5; (j) AZ91-15; (k) AZ91-30 and (L) AZ91-60.
3.2.2. Intermediates Layer
As the processing time proceeds, an intermediate layer grows, consisting mainly of MgO and Mg2SiO4. From the observation of cross-section images, it can be assumed that such a layer grows at, or near, the alloy/coating interface by the action of receiving inwardly transported oxygen and SiO32− species.
The gaseous species movement and transport can be confirmed from the submicron pores above and around the barrier layer. The current regime, which could support the formation of an intermediate layer, reportedly follows an increased cathodic-to-anodic ratio [50]. According to Slonova and Terleeva, the layer develops at a critical coating thickness, in which there is insufficient time for cooling and loss of conductivity of the coating during the cathodic half-period. Thus, the high temperature during the anodic cycle and the low cooling rate allow for heating and partial melting of the coating in the discharge zone and adjacent areas.
3.2.3. Thickness and Efficiency of the Coatings
Knowledge of the coating thickness as shown in Figure 4, and the total charge passed during the anodic part of the current cycles can be used to help evaluate the efficiency of the formation of these coatings; AZ31 was found to be the lowest. The efficiency of the process was found to increase with the Al contents in the alloy, i.e., ~46%, 49%, and 58% for AZ31, AZ61, and AZ91D, respectively. Major factors, such as porosity, as well as species other than MgO and Mg2SiO4, can lead to erroneous determinations of values of efficiency. However, due to the complexity of the PEO process, and the limited understanding of the exact chemical/physical mechanisms, uncertainty will remain for the time being. As reported, neglecting the contribution of pores to the efficiency could also lead to an over-estimation of the efficiency [51]. Other factors affecting efficiency include (i) oxygen generation, (ii) dissolution of species in the electrolyte, and (iii) loss of coating from the material. Furthermore, the concentration of alloying elements affects the growth of crystal structure and composition locally or generally, depending upon whether or not the alloying elements are in the solid solution state or if they are located within discrete particles. The substrate/coating interface was scalloped for all the alloys due to the local thickening of the coatings, following the breakdown events. The scallops were spaced at intervals in the range of 30–80 microns. This spacing increased with Al concentration. For AZ31, the coating was observed to be uneven, resulting from the unequal distribution of discharges. The dissolution level of the substrate can be obtained from the comparison of the original surface to the depth of the coatings. It seems that there is a variation of the coatings depth as the Al content increases.
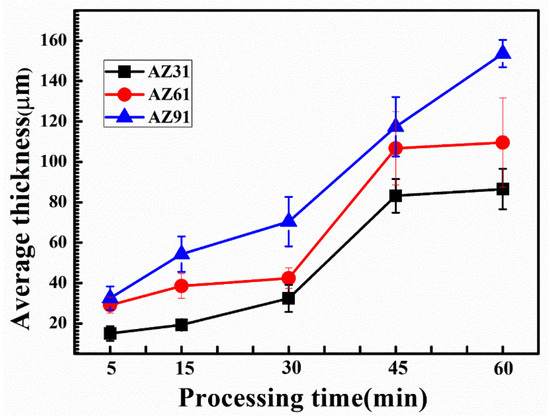
Figure 4.
Average thickness of the coated sample (AZ31, AZ61, AZ91) obtained over different processing times.
3.3. Phase Analysis
XRD profiles of the coated samples were obtained and are provided in Figure 5a–c. From inspection of the peak profiles, MgO, Mg2SiO4, MgF2 and Mg phases are present in the coatings. Intensities of all phases can be seen as varying both with Al-contents and processing times. The MgF2 peaks obtained at 39°–41°, as indicated by arrows; the lowest intensity was for AZ31; the highest value for AZ91. Fluoride-based (MgF2) content in the coatings suggests a PEO process with high current density verified for AZ91. Similarly, the Mg peaks obtained at shorter processing times have higher intensity; however Mg peaks at ~62° are barely present for AZ91 (~max Al). The intensity of the Mg peaks at ~36° can be seen as highest for AZ31, suggesting higher Mg contents and lower thickness values. In the case of Mg peak at ~57° has varying trends with processing times and Al content. For instance, the Mg peaks in AZ31 demonstrate a linear decreasing trend with processing time. However, they remained until the final processing conditions. The intensity of the Mg peaks, however, decreased very sharply for AZ61 and AZ91, and were found to have completely disappeared under final processing conditions for AZ91. Relationships of the intensities of the signals for the Mg versus Mg2SiO4 samples can also be clearly observed in Figure 5d.
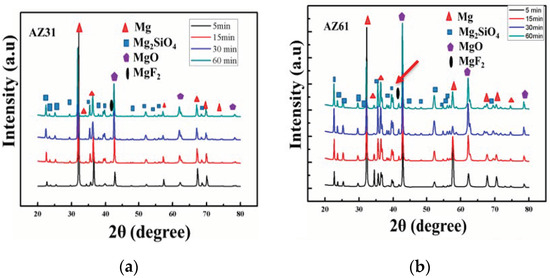
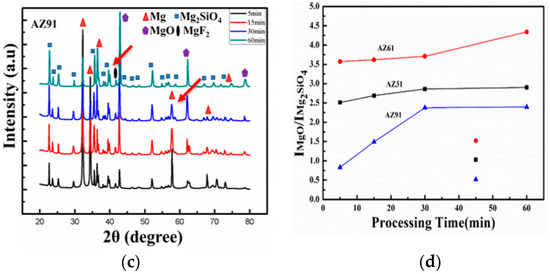
Figure 5.
(a–c) XRD profile of the coated sample (AZ31, AZ61, AZ91) obtained at different processing times. (d) Intensity relationship of the MgO/Mg2SiO4 sample ratio.
3.4. Mechanical and Electrochemical (Corrosion) Properties
The formation of coatings on the substrates clearly influences the mechanical properties of its surfaces, which contributes to the type of the coated components and their crystalline nature. Microstructural and phase composition of the coatings varied according to the changing process parameters and Al-content (vide supra), thus the same could be expected for mechanical properties. The average hardness of the coated samples obtained from the indentation on the cross section can be observed in Figure 6. The measurements of hardness of the coatings can be seen as increasing sharply, following linear trends with increases in processing time for all samples except for AZ31. Maxima of the hardness values can be seen as obtained for AZ91 at a processing time of 60 min. The highest value of hardness obtained was ~1271.2 HV, compared to the 1165.75 HV for AZ61 and 660.72 HV for AZ31. The values obtained are significantly higher than the values obtained by Matykina et al. as ~450 HV0.05 for the AZ-series alloys [52]. The high values of hardness can be attributed to the compact cross section layers, higher thickness, and maximum concentration of MgO in the AZ91 coating matrix. Higher values of hardness further suggest improved wear properties and tensile strength, which has a direct relationship with the hardness of the coatings.
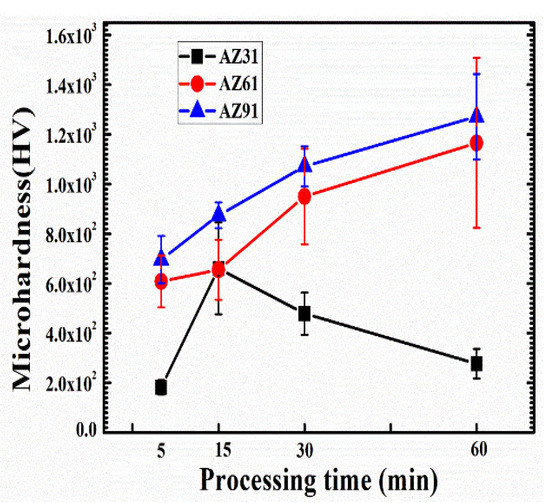
Figure 6.
Average micro-hardness of the coated sample (AZ31, AZ61, AZ91) obtained at different processing times.
Corrosion analysis of the coated samples was carried out using potentiodynamic polarization test in 3.5 wt.% NaCl solution, as presented in Figure 7a–d. Corrosion potential, Ecorr, corrosion current density, icorr, and corrosion resistance, Rcorr, were calculated from the extrapolated Tafel lines. In the absence of any diversion of corrosion reactions from the Mg ions, the corrosion mechanism is solely inhibited by the structural features and integration and of the PEO coatings. Thus, the compactness, thickness and intact polycrystalline structure of the coatings can play a very significant role in retarding the corrosion of the coated samples. Corrosion potential of all the samples increases with increased processing times as shown in Figure 7a–d. However, the corrosion potential varies with Al-contents, following an improving trend with Al-contents. It can be seen that the shorter time corrosion of the AZ31~−0.28 V is higher compared to all other samples due to the uniform discharge and enhanced barrier layer, as discussed. However, as the time proceeds, the role of thickness and intermediate layer increases. Thus, the passivity shifts from that for AZ31 toward that for AZ61 (~−0.42 V), over a time of 30 min. With a further increase in the processing time, the passivity became more evident for AZ91 (~−0.18 V), as can also be observed from micro- images of the post-corrosion samples in Figure 8a. Thus, the corrosion potential increases with time as well as Al-content. In addition, the corrosion current and corrosion rate of the coated can also be seen in Table 1.
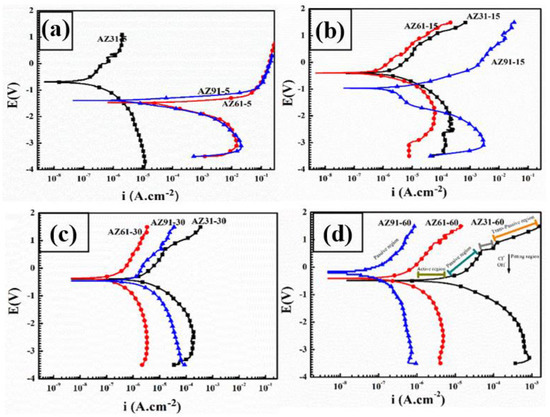
Figure 7.
Tafel curves obtained through potentiodynamic polarization of all the coated samples under various experimental conditions. (a) Tafel curves obtained for 5 min coated samples (b) Tafel curves obtained for 15 min coated samples (c) Tafel curves obtained for 30 min coated samples (d) Tafel curves obtained for 60 min coated samples.
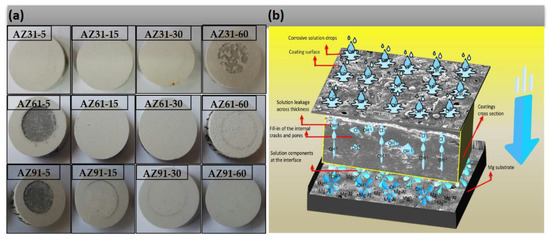
Figure 8.
(a) Micro-image of the images obtained after potentio-dynamic polarization and (b) Schematic diagram of the corrosion phenomena and the role Al-phase and compact layer.

Table 1.
Corrosion parameters of the coated samples.
During the anodic part of the potentiodynamic polarization, ions (Cl− and OH−) commence penetration through the thick coatings, as shown in Figure 8b. However, they are obstructed randomly by the intermediate layer and deposit where the layer has cavities at the same time as Mg2+ migrates toward the surface, which is obstructed by the barrier layer. The initial signals obtained from the ionic transfer correspond to the active region on the Tafel curve as shown in Figure 7d. With a further increase in voltage toward the anodic side, the ions present in the weaker spots, (impurities, pores, cracks, porous spots etc.) and at the interface zone, could arrange to form thin films, e.g., of the nature, MgOH2, Mg-Al(OH)2+x, Al(OH)3, MgCl2, Mg-Al(Cl)2+x, and AlCl3. Depending upon the availability of both type of these ions, as disciplined by the coatings thickness, composition of the coating (i.e., MgO, MgF2, etc.) layers, and microstructures (dendrite-crater structure etc.) of the coating layers, these corrosion inhibiting layers play a vital role in blocking the impending ionic transfer and thus current signaling. The aftermath variation in the corrosion current could lead to either passivation or pseudo-passivation. Alternatively, the active corrosion region can be elaborated as determined from the polarization Tafel plots as shown in Figure 7a–d. Various mechanisms of the corrosion process during the dissolution of the samples, as shown in Figure 8b, were correlated with the part of the Tafel, such as (a) active regions, (b) metastable regions, and (c) trans-passive or pseudo-passive regions. It can be seen that, in the case of AZ91-60, the passive region is extended during the over-potential process. The highest resistance to the corrosion potential of AZ91-60 in the passive region can also be attributed to the existence of β-phase in the barrier layer, with oxidation potential (~1.3 V), ~0.3 V, higher than α-phase (~1.6 V) in NaCl solutions as reported by Song et al. [53,54].
4. Conclusions
This investigation of the PEO coated AZ-series alloys (varying Al-content) under various processing times brings forward these important points in conclusion.
- 1.
- An increase in the concentration of the Al, as in the case of AZ91 and AZ61, contributed to the dendrite structure at shorter processing times. However, a mix of craters-dendritic matrix was obtained at longer processing time.
- 2.
- Higher growth rates were obtained with increasing aluminum content, i.e., 4.7, 5.1, and 6.0 μm·min−1 for AZ31, AZ61, and AZ91, respectively. In addition, Fluoride-complex spectral peaks were obtained for higher contents of Al-Alloys, as in AZ91 and AZ61, which contributed to localized intensive discharges regularized by the stable β-phases in the Mg matrix.
- 3.
- The mix of dendrite–crater structure for high Al content, as in AZ91, contributed to a compact structure, higher growth rates, and stable chemical phases MgF2, which contributed to the highest hardness values ~1271.2 HV and corrosion potential ~−0.18 V of the AZ91 alloy.
- 4.
- Corrosion resistance Rcorr~5.699 × 10⁶ was recorded as highest for AZ91 (higher Al-content), with the lowest corrosion current obtained for AZ91 (9.171 × 10⁻⁹ μA/cm2).
Author Contributions
Conceptualization, methodology, software, validation, formal analysis, investigation, data curation, writing—original draft preparation, writing—review and editing, by Z.U.R., J.S.K. and D.G.C.; Visualization, resources, conceptualization, supervision, project administration, writing—review and editing, funding acquisition, B.H.K. All authors have read and agreed to the published version of the manuscript.
Funding
National Research Foundation of Korea Project# 2018R1A6A1A03024509 and 2021R1I1A1A01055102.
Institutional Review Board Statement
Not applicable.
Informed Consent Statement
Not applicable.
Data Availability Statement
The datasets used and/or analysed during the current study available from the corresponding author on reasonable request.
Acknowledgments
This research was supported by Basic Science Research Program through the National Research Foundation of Korea (NRF) funded by the Ministry of Education (2022-0089), (Korea National Research Foundation, 2018R1A6A1A03024509 and 2021R1I1A1A01055102). The Molecular Logic Gate Laboratory at KAIST is grateful for funding from the Korean National Research Foundation (2021R1F1A1046576), from KAIST, and the International Joint Usage Project with ICR, Kyoto University (2022–129) to help make current efforts possible.
Conflicts of Interest
The authors declare no conflict of interest.
References
- Prasad, S.V.S.; Prasad, S.B.; Verma, K.; Mishra, R.K.; Kumar, V.; Singh, S. The role and significance of magnesium in modern day research—A review. J. Magnes. Alloy. 2022, 10, 1–61. [Google Scholar] [CrossRef]
- Abbott, T.B. Magnesium: Industrial and research developments over the last 15 years. Corrosion 2014, 71, 120–127. [Google Scholar] [CrossRef]
- Wu, G.; Wang, C.; Sun, M.; Ding, W. Recent developments and applications on high-performance cast magnesium rare-earth alloys. J. Magnes. Alloy. 2021, 9, 1–20. [Google Scholar] [CrossRef]
- Zeng, Z.; Stanford, N.; Davies, C.H.J.; Nie, J.-F.; Birbilis, N. Magnesium extrusion alloys: A review of developments and prospects. Int. Mater. Rev. 2019, 64, 27–62. [Google Scholar] [CrossRef]
- Ramalingam, V.V.; Ramasamy, P.; Kovukkal, M.D.; Myilsamy, G. Research and development in magnesium alloys for industrial and biomedical applications: A review. Met. Mater. Int. 2020, 26, 409–430. [Google Scholar] [CrossRef]
- Song, J.; She, J.; Chen, D.; Pan, F. Latest research advances on magnesium and magnesium alloys worldwide. J. Magnes. Alloy. 2020, 8, 1–41. [Google Scholar] [CrossRef]
- Yeganeh, M.; Mohammadi, N. Superhydrophobic surface of Mg alloys: A review. J. Magnes. Alloy. 2018, 6, 59–70. [Google Scholar] [CrossRef]
- Esmaily, M.; Svensson, J.E.; Fajardo, S.; Birbilis, N.; Frankel, G.S.; Virtanen, S.; Arrabal, R.; Thomas, S.; Johansson, L.G. Fundamentals and advances in magnesium alloy corrosion. Prog. Mater. Sci. 2017, 89, 92–193. [Google Scholar] [CrossRef]
- Ma, X.-c.; Jin, S.-y.; Wu, R.-z.; Wang, J.-x.; Wang, G.-x.; Krit, B.; Betsofen, S. Corrosion behavior of Mg−Li alloys: A review. Trans. Nonferrous Met. Soc. China 2021, 31, 3228–3254. [Google Scholar] [CrossRef]
- Xu, T.; Yang, Y.; Peng, X.; Song, J.; Pan, F. Overview of advancement and development trend on magnesium alloy. J. Magnes. Alloy. 2019, 7, 536–544. [Google Scholar] [CrossRef]
- Pawar, S.; Zhou, X.; Thompson, G.E.; Scamans, G.; Fan, Z. The Role of intermetallics on the corrosion initiation of twin roll cast AZ31 Mg alloy. J. Electrochem. Soc. 2015, 162, C442–C448. [Google Scholar] [CrossRef]
- Wei, F.; Zhang, W.; Zhang, T.; Wang, F. Effect of variations of Al content on microstructure and corrosion resistance of PEO coatings on MgAl alloys. J. Alloys Compd. 2017, 690, 195–205. [Google Scholar] [CrossRef]
- Mathieu, S.; Rapin, C.; Steinmetz, J.; Steinmetz, P. A corrosion study of the main constituent phases of AZ91 magnesium alloys. Corros. Sci. 2003, 45, 2741–2755. [Google Scholar] [CrossRef]
- Bahmani, A.; Arthanari, S.; Shin, K.S. Formulation of corrosion rate of magnesium alloys using microstructural parameters. J. Magnes. Alloy. 2020, 8, 134–149. [Google Scholar] [CrossRef]
- Ambat, R.; Aung, N.N.; Zhou, W. Studies on the influence of chloride ion and pH on the corrosion and electrochemical behaviour of AZ91D magnesium alloy. J. Appl. Electrochem. 2000, 30, 865–874. [Google Scholar] [CrossRef]
- Südholz, A.D.; Kirkland, N.T.; Buchheit, R.G.; Birbilis, N. Electrochemical properties of intermetallic phases and common impurity elements in magnesium alloys. Electrochem. Solid-State Lett. 2011, 14, C5. [Google Scholar] [CrossRef]
- Wang, Y.; Wang, X.; Zhang, T.; Wu, K.; Wang, F. Role of β phase during microarc oxidation of Mg alloy AZ91D and corrosion resistance of the oxidation coating. J. Mater. Sci. Technol. 2013, 29, 1129–1133. [Google Scholar] [CrossRef]
- Song, G.-L. Corrosion Prevention of Magnesium Alloys; Elsevier: Amsterdam, The Netherlands, 2013. [Google Scholar]
- Ma, X.; Jin, S.; Wu, R.; Ji, Q.; Hou, L.; Krit, B.; Betsofen, S. Influence alloying elements of Al and Y in MgLi alloy on the corrosion behavior and wear resistance of microarc oxidation coatings. Surf. Coat. Technol. 2022, 432, 128042. [Google Scholar] [CrossRef]
- Zhang, T.; Li, Y.; Wang, F. Roles of β phase in the corrosion process of AZ91D magnesium alloy. Corros. Sci. 2006, 48, 1249–1264. [Google Scholar] [CrossRef]
- Lunder, O.; Lein, J.E.; Aune, T.K.; Nisancioglu, K. The role of Mg17Al12 phase in the corrosion of Mg alloy AZ91. Corrosion 1989, 45, 741–748. [Google Scholar] [CrossRef]
- Krawiec, H.; Stanek, S.; Vignal, V.; Lelito, J.; Suchy, J.S. The use of microcapillary techniques to study the corrosion resistance of AZ91 magnesium alloy at the microscale. Corros. Sci. 2011, 53, 3108–3113. [Google Scholar] [CrossRef]
- Jönsson, M.; Thierry, D.; LeBozec, N. The influence of microstructure on the corrosion behaviour of AZ91D studied by scanning Kelvin probe force microscopy and scanning Kelvin probe. Corros. Sci. 2006, 48, 1193–1208. [Google Scholar] [CrossRef]
- Shi, Z.; Song, G.; Atrens, A. Influence of the β phase on the corrosion performance of anodised coatings on magnesium–aluminium alloys. Corros. Sci. 2005, 47, 2760–2777. [Google Scholar] [CrossRef]
- Song, G.; Atrens, A.; Wu, X.; Zhang, B. Corrosion behaviour of AZ21, AZ501 and AZ91 in sodium chloride. Corros. Sci. 1998, 40, 1769–1791. [Google Scholar] [CrossRef]
- Song, G.; Atrens, A.J. Understanding magnesium corrosion—A framework for improved alloy performance. Adv. Eng. Mater. 2003, 5, 837–858. [Google Scholar] [CrossRef]
- Li, S.; Che, Y.; Li, C.; Shu, Y.; He, J.; Yang, B.; Song, J. Study on the electrochemical behavior of Mg and Al ions in LiCl-KCl melt and preparation of Mg-Al alloy. J. Magnes. Alloy. 2022, 10, 721–729. [Google Scholar] [CrossRef]
- Wang, X.; Jing, C.; Chen, Y.; Wang, X.; Zhao, G.; Zhang, X.; Wu, L.; Liu, X.; Dong, B.; Zhang, Y. Active corrosion protection of super-hydrophobic corrosion inhibitor intercalated Mg–Al layered double hydroxide coating on AZ31 magnesium alloy. J. Magnes. Alloy. 2020, 8, 291–300. [Google Scholar] [CrossRef]
- Reichek, K.; Clark, K.; Hillis, J. Controlling the Salt Water Corrosion Performance of Magnesium AZ91 Alloy; SAE International: Warrendale, PA, USA, 1985; pp. 318–329. [Google Scholar]
- Song, G.L.; Atrens, A.J. Corrosion mechanisms of magnesium alloys. Adv. Eng. Mater. 1999, 1, 11–33. [Google Scholar] [CrossRef]
- Takahashi, H.; Chiba, M. Role of anodic oxide films in the corrosion of aluminum and its alloys. Corros. Rev. 2018, 36, 35–54. [Google Scholar] [CrossRef]
- Mathieu, S.; Rapin, C.; Hazan, J.; Steinmetz, P. Corrosion behaviour of high pressure die-cast and semi-solid cast AZ91D alloys. Corros. Sci. 2002, 44, 2737–2756. [Google Scholar] [CrossRef]
- Ur Rehman, Z.; Choi, D. Investigation of ZrO2 nanoparticles concentration and processing time effect on the localized PEO coatings formed on AZ91 alloy. J. Magnes. Alloy. 2019, 7, 555–565. [Google Scholar] [CrossRef]
- Ur Rehman, Z.; Uzair, M.; Lim, H.T.; Koo, B.H. Structural and electrochemical properties of the catalytic CeO2 nanoparticles-based PEO ceramic coatings on AZ91 Mg alloy. J. Alloys Compd. 2017, 726, 284–294. [Google Scholar] [CrossRef]
- Rehman, Z.U.; Shin, S.H.; Hussain, I.; Koo, B.H. Structure and corrosion properties of the two-step PEO coatings formed on AZ91D Mg alloy in K2ZrF6-based electrolyte solution. Surf. Coat. Technol. 2016, 307, 484–490. [Google Scholar] [CrossRef]
- Kaseem, M.; Hussain, T.; Rehman, Z.U.; Ko, Y.G. Stabilization of AZ31 Mg alloy in sea water via dual incorporation of MgO and WO3 during micro-arc oxidation. J. Alloys Compd. 2021, 853, 157036. [Google Scholar] [CrossRef]
- Rehman, Z.U.; Shin, S.H.; Kaseem, M.; Uzair, M.; Koo, B.H. Towards a compact coating formed on Al6061 alloy in phosphate based electrolyte via two-step PEO process and K2ZrF6 additives. Surf. Coat. Technol. 2017, 328, 355–360. [Google Scholar] [CrossRef]
- Ur Rehman, Z.; Koo, B.H. Effect of Na2SiO3·5H2O concentration on the microstructure and corrosion properties of two-step PEO coatings formed on AZ91 alloy. Surf. Coat. Technol. 2017, 317, 117–124. [Google Scholar] [CrossRef]
- Rehman, Z.U.; Shin, S.H.; Lim, H.-T.; Koo, B.H. Transformation of plasma electrolytic oxidation coatings from crater to cluster–based structure with increase in DC voltage and the role of ZrO2 nanoparticles. Surf. Coat. Technol. 2017, 311, 383–390. [Google Scholar] [CrossRef]
- Rehman, Z.U.; Ahn, B.-H.; Jeong, Y.S.; Song, J.-I.; Koo, B.-H. The influence of various additives on the properties of peo coatings formed on AZ31 Mg alloy. Surf. Rev. Lett. 2016, 23, 1650006. [Google Scholar] [CrossRef]
- Dehnavi, V.; Luan, B.L.; Shoesmith, D.W.; Liu, X.Y.; Rohani, S. Effect of duty cycle and applied current frequency on plasma electrolytic oxidation (PEO) coating growth behavior. Surf. Coat. Technol. 2013, 226, 100–107. [Google Scholar] [CrossRef]
- Tjong, S.; Chen, H. Nanocrystalline materials and coatings. Mater. Sci. Eng. R Rep. 2004, 45, 1–88. [Google Scholar] [CrossRef]
- Hussein, R.O.; Nie, X.; Northwood, D.O.; Yerokhin, A.; Matthews, A. Spectroscopic study of electrolytic plasma and discharging behaviour during the plasma electrolytic oxidation (PEO) process. J. Phys. D Appl. Phys. 2010, 43, 105203. [Google Scholar] [CrossRef]
- Sundararajan, G.; Krishna, L.R. Mechanisms underlying the formation of thick alumina coatings through the MAO coating technology. Surf. Coat. Technol. 2003, 167, 269–277. [Google Scholar] [CrossRef]
- Wang, Y.; Chen, M.; Zhao, Y. Preparation and corrosion resistance of microarc oxidation-coated biomedical Mg–Zn–Ca alloy in the silicon–phosphorus-mixed electrolyte. ACS Omega 2019, 4, 20937–20947. [Google Scholar] [CrossRef]
- Cheng, Y.; Wu, F.; Matykina, E.; Skeldon, P.; Thompson, G. The influences of microdischarge types and silicate on the morphologies and phase compositions of plasma electrolytic oxidation coatings on Zircaloy-2. Corros. Sci. 2012, 59, 307–315. [Google Scholar] [CrossRef]
- Cengiz, S.; Gencer, Y. The characterization of the oxide based coating synthesized on pure zirconium by plasma electrolytic oxidation. Surf. Coat. Technol. 2014, 242, 132–140. [Google Scholar] [CrossRef]
- Chraska, T.; King, A.H. Transmission electron microscopy study of rapid solidification of plasma sprayed zirconia—Part I. First splat solidification. Thin Solid Film 2001, 397, 30–39. [Google Scholar] [CrossRef]
- Cheng, Y.; Matykina, E.; Skeldon, P.; Thompson, G.J. Characterization of plasma electrolytic oxidation coatings on Zircaloy-4 formed in different electrolytes with AC current regime. Electrochim. Acta 2011, 56, 8467–8476. [Google Scholar] [CrossRef]
- Sonova, A.; Terleeva, O.P. Morphology, structure, and phase composition of microplasma coatings formed on Al-Cu-Mg alloy. Prot. Met. 2008, 44, 65–75. [Google Scholar] [CrossRef]
- Bonilla, F.; Berkani, A.; Liu, Y.; Skeldon, P.; Thompson, G.; Habazaki, H.; Shimizu, K.; John, C.; Stevens, K. Formation of anodic films on magnesium alloys in an alkaline phosphate electrolyte. J. Electrochem. Soc. 2001, 149, B4. [Google Scholar] [CrossRef]
- Matykina, E.; Arrabal, R.; Skeldon, P.; Thompson, G.E. Optimisation of the plasma electrolytic oxidation process efficiency on aluminium. Surf. Interface Anal. 2010, 42, 221–226. [Google Scholar] [CrossRef]
- Zhao, M.-C.; Liu, M.; Song, G.; Atrens, A. Influence of the β-phase morphology on the corrosion of the Mg alloy AZ91. Corros. Sci. 2008, 50, 1939–1953. [Google Scholar] [CrossRef]
- Cao, F.; Song, G.-L.; Atrens, A. Corrosion and passivation of magnesium alloys. Corros. Sci. 2016, 111, 835–845. [Google Scholar] [CrossRef]
Publisher’s Note: MDPI stays neutral with regard to jurisdictional claims in published maps and institutional affiliations. |
© 2022 by the authors. Licensee MDPI, Basel, Switzerland. This article is an open access article distributed under the terms and conditions of the Creative Commons Attribution (CC BY) license (https://creativecommons.org/licenses/by/4.0/).