Article

Effect of Binder Coatings on the Fracture Behavior of Polymer–Crystal Composite Particles Using the Discrete Element Method

1
School of Civil and Hydraulic Engineering, Huazhong University of Science and Technology, Wuhan 430000, China
2
Institute of Chemical Materials, China Academy of Engineering Physics, Mianyang 621000, China
*
Author to whom correspondence should be addressed.
Coatings 2021, 11(9), 1075; https://doi.org/10.3390/coatings11091075
Submission received: 17 August 2021 / Revised: 30 August 2021 / Accepted: 3 September 2021 / Published: 6 September 2021

Abstract

:
Polymer–crystal composite particles formed by crystals coated with binders are widely used in the fields of medicine, energy, the chemical industry, and civil engineering. Binder content is an important factor in determining the mechanical behavior of composite particles. Therefore, this study aimed to investigate the underlying effect of binder coatings in the fracture micromechanics of polymer–crystal composite particles using the discrete element method (DEM). To achieve this objective, realistic particle and crystal shapes were first obtained and reconstructed based on X-ray micro-computed tomography (μCT) scanning and scanning electron microscope (SEM) images. A series of single particle crushing tests and DEM simulations were conducted on real and reconstructed polymer–crystal composite particles, respectively. Based on the experimental and DEM results, the effect of binder coatings on the crushing strength and crushing patterns of polymer–crystal composite particles was measured. Moreover, the micromechanics of the development and distribution of microcracks was further investigated to reveal the mechanism by which binder coatings affect polymer–crystal composite particles.

1. Introduction

Polymer–crystal composite particles formed by crystals coated with binders are widely used in the fields of medicine [1], energy [2,3], the chemical industry [4,5], and civil engineering [6,7]. Coatings can effectively improve the physical properties of materials, including their corrosion resistance [8,9,10], thermal conductivity [11], stiffness, and strength [12,13]. However, guaranteeing the stability and high energy density of polymer–crystal composite particles can be problematic. Therefore, to optimize binder content, it is critical to understand the macro-mechanical behavior and micro-fracture mechanisms of these composite particles during the loading process.
The interfacial fracture mechanism of composite materials is a topical issue, and many mechanical test methods have been proposed to evaluate the adhesion of coatings, including the Brazil split test [14], the indentation test [15], the double cantilever beam test [16], and the four-point bend test [17]. For cemented sand particles, the uniaxial compression test [7] and triaxial compression test have been more widely used [12,13,18]. However, as the polymer–crystal composite particles are much smaller than the sample sizes in traditional mechanical tests, the above methods are not suitable. In addition, compared with homogeneous granular materials, the microstructure of polymer–crystal composite particles is more complex, including its particle morphology, crystal distribution, and binder characteristics. Therefore, more effective mechanical tests and numerical simulations should be undertaken to reveal the micro-fracture mechanisms of composite polymer–crystal particles.
Particle crushing is an important factor affecting the engineering performance of granular materials, such as the stress–strain relationship, energy dissipation [19,20], yielding behavior, volumetric deformation [21], and the critical state [22]. The single particle crushing test has been considered an effective and low-cost experimental technique [23] through which fracture theory has been further developed [24,25,26]. Moreover, the relationship has been confirmed between one-dimensional compression yield stress and single particle crushing strength [27]. More recently, high-resolution X-ray micro-computed tomography (μCT) has become a powerful tool to identify and reconstruct the morphologies of granular materials [28,29,30]. Mineral crystals [31] and polymeric composites [32] have also been successfully characterized using X-ray μCT technology. However, continuous scanning during in situ loading remains a great challenge for X-ray μCT technology.
The discrete element method (DEM) [33] can overcome the limitations of experimental observation and provide a more microscopic perspective to reflect the behavior of granular materials. In the geotechnical field, the DEM has successfully reproduced the shear band on sands [34] and has been used to investigate anti-rotation effects [35] and particle crushing [36,37]. In addition, the DEM has been extended to simulate the tablet coating process in the chemical industry [38,39]. Recently, simulations of composite materials have become more extensive in engineering, such as asphalt mixtures [40], fiber-reinforced composites [41,42], and composite particles [43]. However, the morphology of composite particles has rarely been considered, although it has proved important to the mechanical behavior of particles [35,37,44,45]. During the cold molding of composite particles, the propagation of microcracks and distribution of force chain were investigated [46]. To optimize the cold molding process, it is critical to reveal the microscopic failure mechanism by further exploring the propagation of microcracks and the binder content.
This study explored the effect of binder coatings on the fracture behavior of polymer–crystal composite particles. Using a combination of X-ray μCT technology and the DEM, crushable polymer–crystal composite particles with realistic shapes were constructed. To calibrate the DEM parameters, a series of single particle crushing tests and DEM simulations were conducted. Based on the experimental and DEM results, the effect of the binder coating on the crushing strength and crushing pattern of polymer–crystal composite particles was measured. Moreover, the micromechanics of the development and distribution of microcracks were further investigated to reveal the coating mechanism of binders on the polymer–crystal composite particles.

2. Materials and Methods

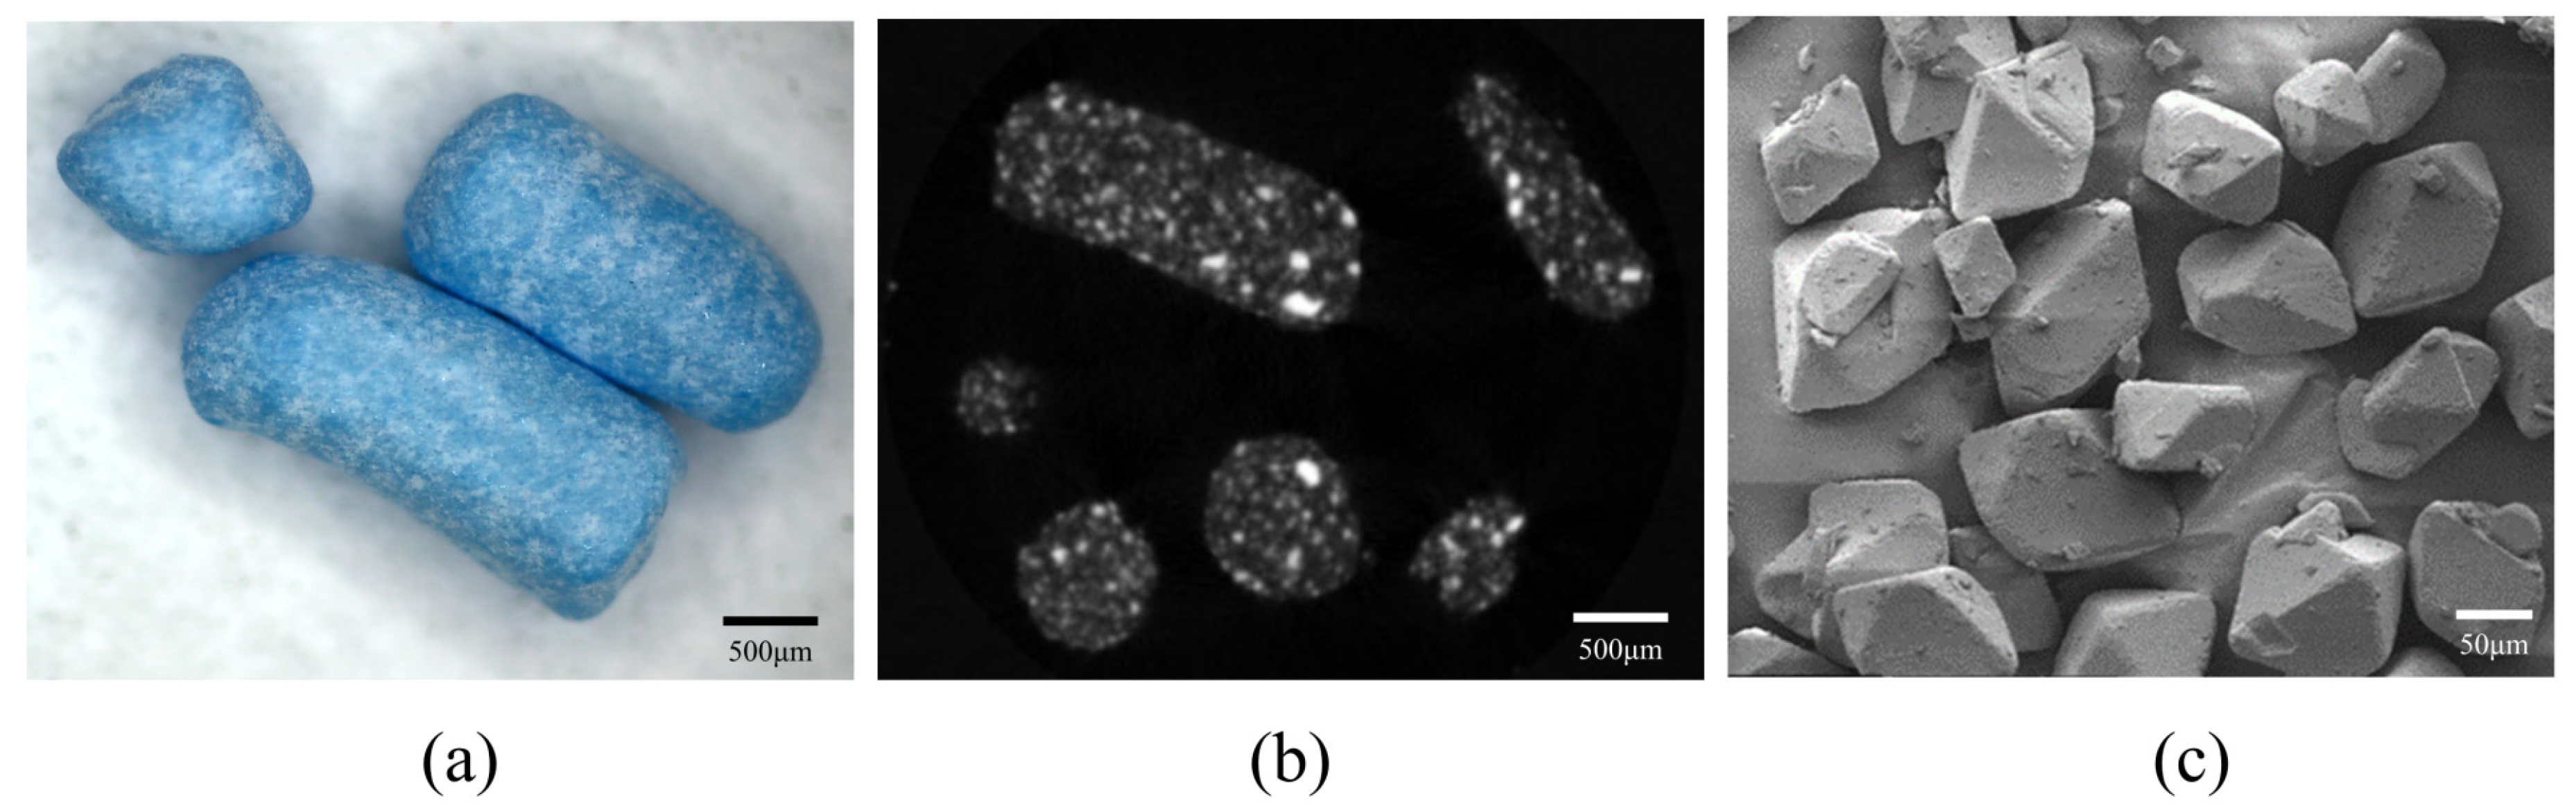
2.1. Tested Materials

The polymer–crystal composite particles were produced by a kneading granulation method (the composite materials were extracted by high-temperature evaporation of the mixed solution and shaped by the kneading machine [46]), in which melamine crystals (C3N6H6) were coated with fluorine rubber (F2311) binders [47]. Under Carl Zeiss Stemi (Carl Zeiss, Oberkochen, Germany) 508 optical microscope, the morphologies of the composite particles were mainly spherical and rod-shaped, with particle sizes of 0.5 to 3 mm, as shown in Figure 1a. The fluorine rubber binders were distributed in the blue regions and the melamine crystals were distributed in the white regions. The internal structure of the composite particles was non-destructively identified by GE μCT system (Phoenix v|tome|x m, the General Electric Company, Fairfield, CT, USA.), in which the volume fraction of the binders was about 20% and the distribution of the crystals was inhomogeneous. Due to their higher density, the crystals were brighter than the binders in the CT scan, as shown in Figure 1b. The morphologies of the crystals were mainly irregular polyhedrons of 20 to 300 μm, captured by FEI Quanta x50 (the FEI Company, Portland, OR, USA) the scanning electron microscope (SEM), as shown in Figure 1c.

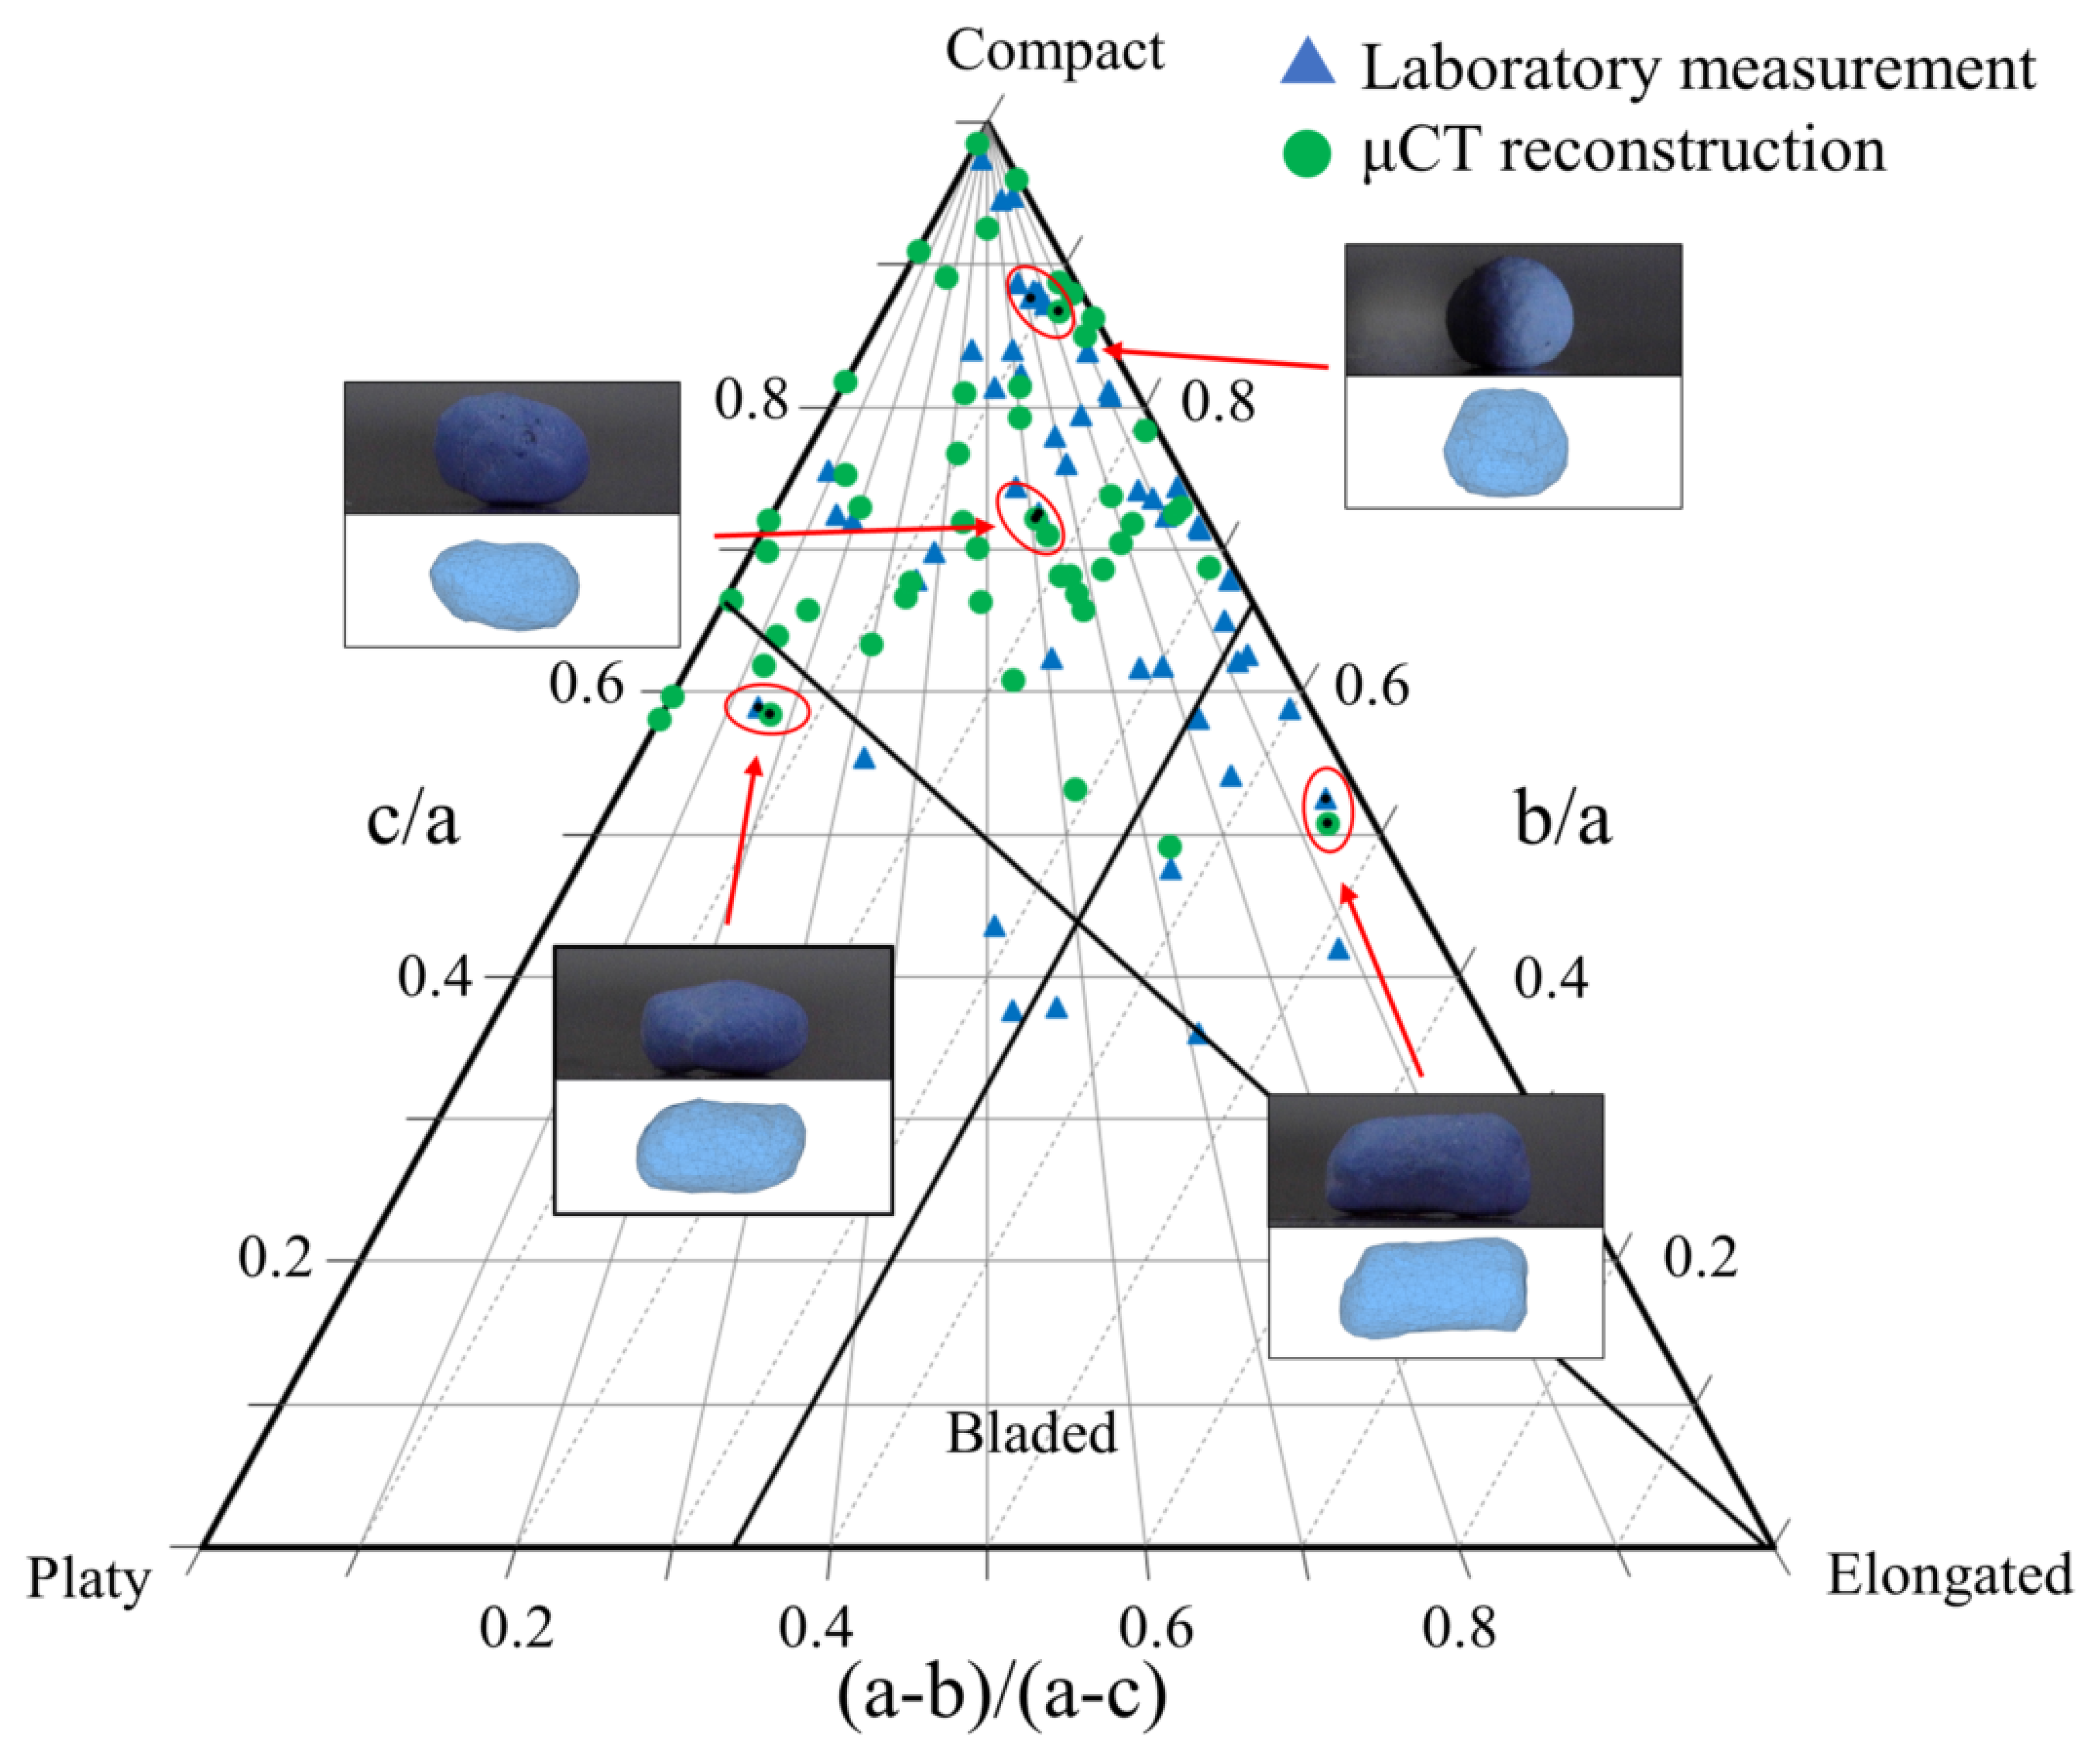
2.2. Characterization of Particle Morphology

Due to the significant influence of shape on the mechanical properties of particles, the morphological information of the composite particles was obtained via a CT scan. The 3D image segmentation was implemented using the open-source software Image J (version 1.46) [48], while the surface mesh was constructed using the commercial platform MATLAB (version 7.0) [49]. More details can be found in our previous study [46]. To quantify the morphological characteristics of the separated composite particle, the principal directions of the particle were first determined by principal component analysis (PCA) [50]. Next, the dimensions of the principal directions were calculated, including the long, intermediate, and short axes, abbreviated as a, b, and c, respectively. An improved triangular Zingg diagram [51] has been shown to be an effective method for classifying the morphologies of irregular particles [52], in which three dimensions of the aspect ratio and four classes of morphological characteristics (compact, platy, elongated, bladed) are considered.
Figure 2 shows the classification of two groups of 50 composite particles in a triangular classification diagram, in which blue triangles and green spots represented results of laboratory measurement and μCT reconstruction, respectively. Although the particles were not all the same, the distribution of the particle morphology had a certain similarity, and the shapes of the composite particles were mainly short spherical rods. Moreover, the figure clearly indicates that most of the particles were concentrated in the compact region, which was attributed to the process of granulation.

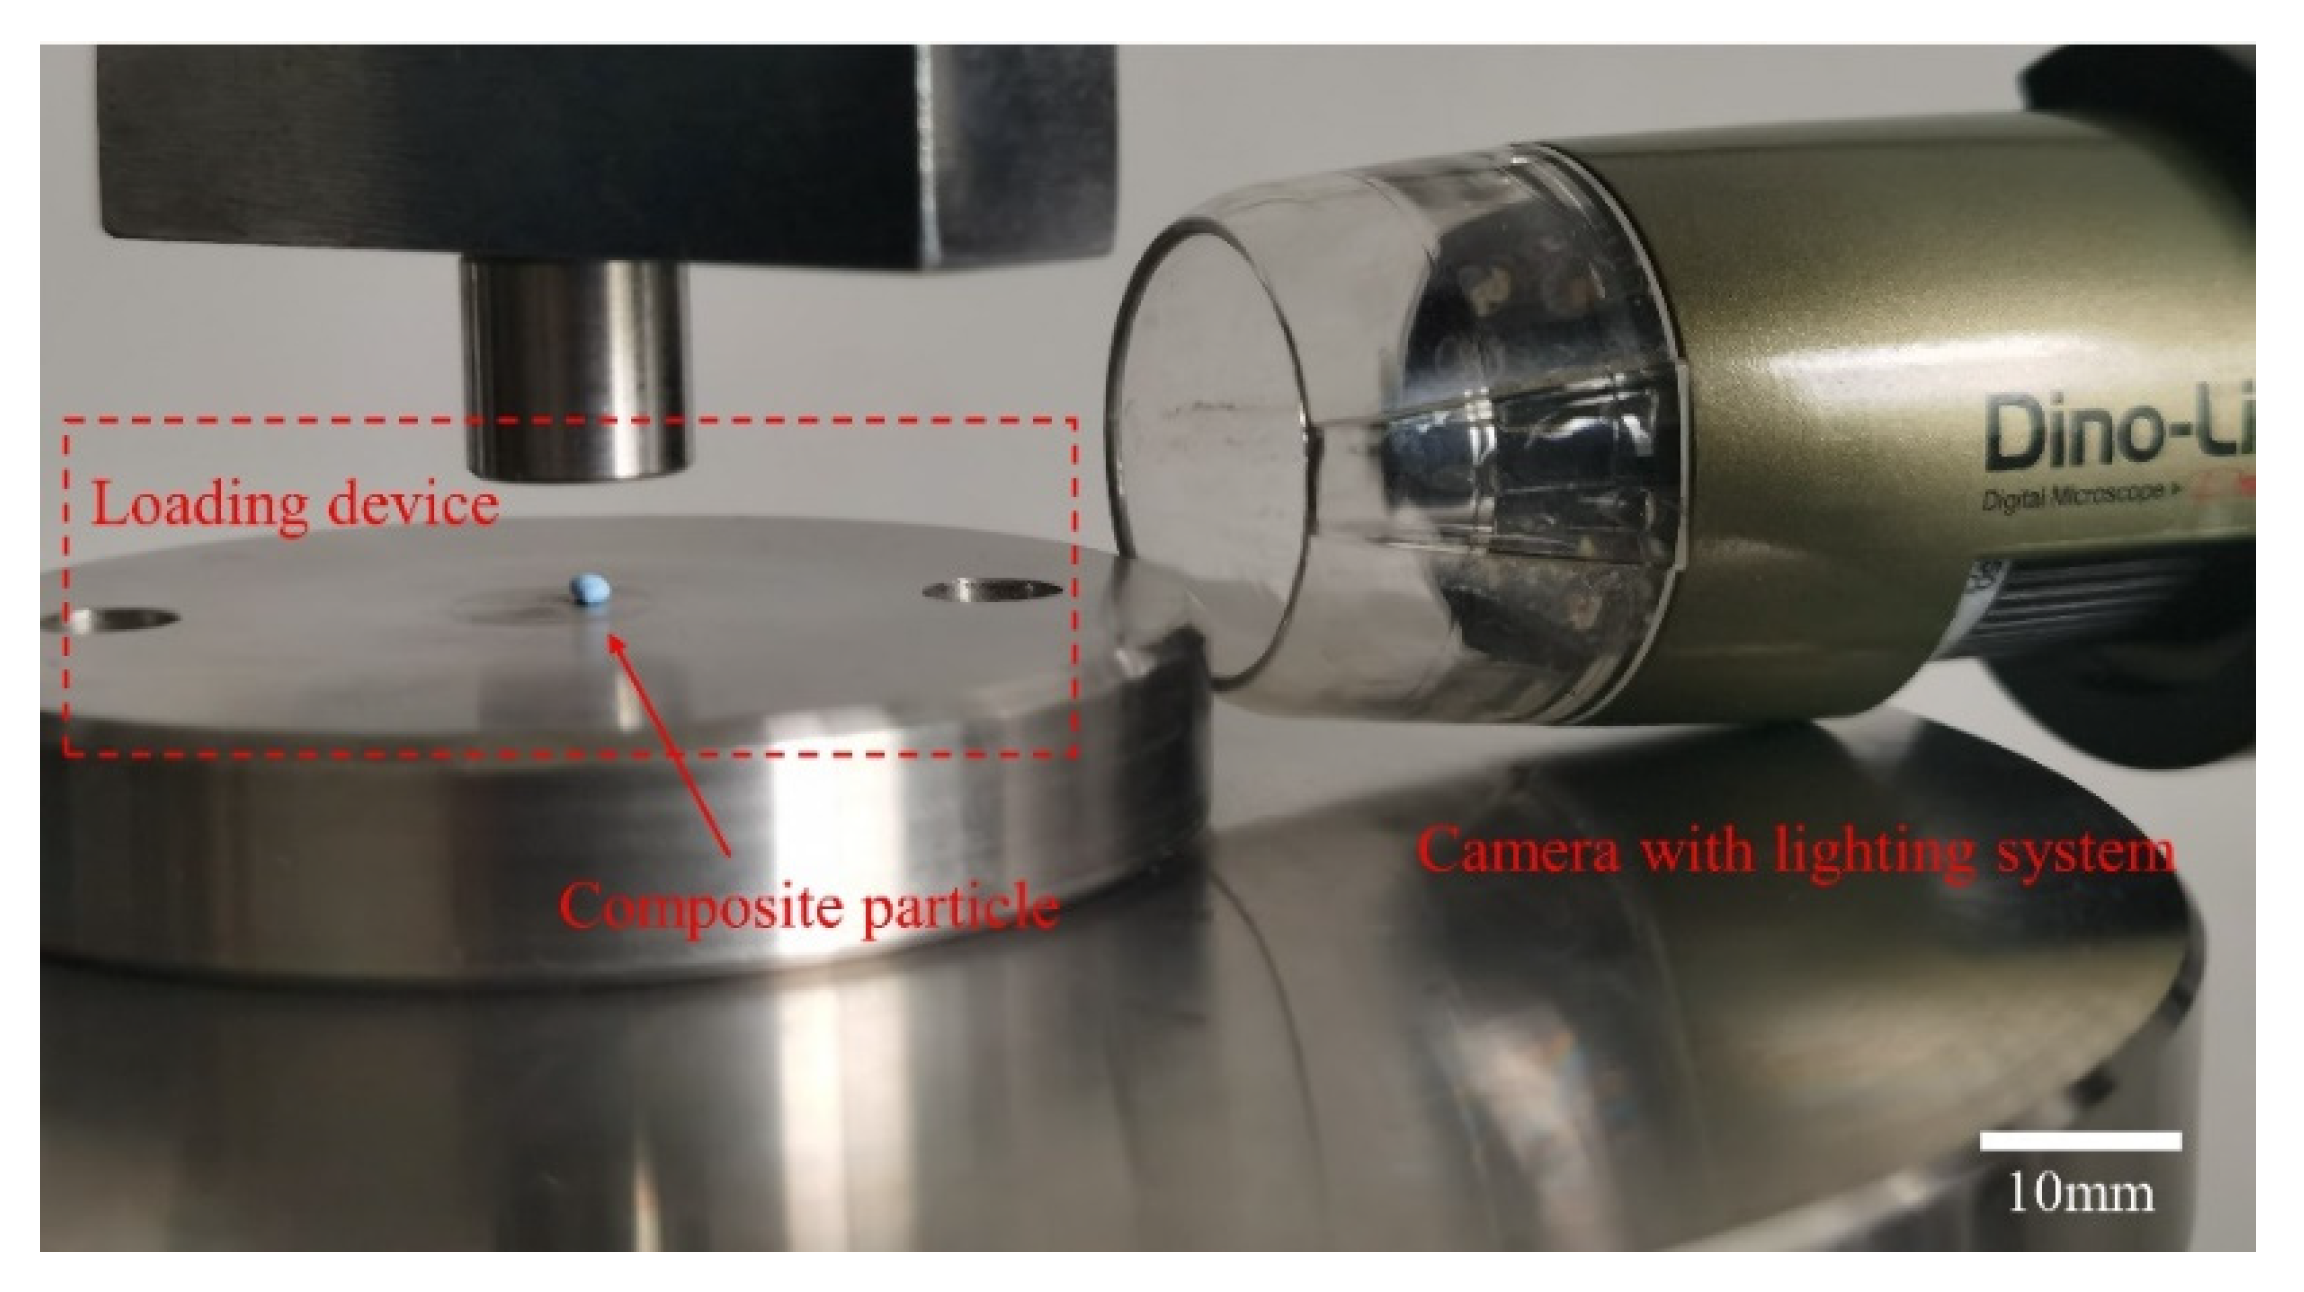
2.3. Single Particle Crushing Test

The single particle crushing tests were implemented using a light uniaxial loading device with a high-definition camera, as shown in Figure 3. The maximum loading force of the device was 500 N, and the loading error was no more than 0.03%. Before the test, the dimensions of the principal directions were determined, as they affect the initial stability and strength of irregular particles [24,37]. Then, according to the principle of minimum potential energy, the composite particle was placed in the center of the bottom plate. During the loading process, to overcome the effect of gravity, the bottom plate was moved upward at a velocity of 0.1 mm/min. The force–displacement data were saved in a .txt file with a storage interval of 1 s, whereas the particle states were recorded by a high definition camera every second. To improve the quality of the photograph, a lighting system was built into the camera. The loading stopped when obvious particle breakage occurred.
Figure 4A shows some typical force–displacement curves of thirty polymer–crystal composite particles, most of which display a double-peak pattern. According to the loading curves, four stages could be identified: elastic deformation, yielding, hardening, and failure. To understand the particle behavior during the loading process, a typical force–displacement curve was selected and four typical states were captured, as shown in Figure 4B. It can be seen that there was no macrocrack at point a, although internal microcracks may have existed. At point b, an unobvious macrocrack was found in the middle of the particle, indicating that many microcracks had begun to connect. A macrocrack through the whole particle was formed at point c, and the macrocrack gap expanded rapidly to point d. Therefore, the elastic deformation may have occurred before the first peak, whereas the plastic damage occurred between the two peaks. In addition, the continuous propagation of further microcracks caused the final particle breakage.

2.4. DEM Modeling of Polymer–Crystal Composite Particles

In this study, the mechanical behavior of composite particles was investigated on a commercial DEM platform (PFC3D) [53]. The basic unit was assumed to be a rigid sphere in PFC3D, but overlap between spheres was allowed. A linear slip model was used to determine the non-adhesive interactions, such as the interaction between different crystals and between the loading plate and the particle. In the linear slip model, linear force is determined by particle stiffness and relative displacement, and the slip model is used to describe the tangential sliding behavior when the linear tangential force exceeds the slip force. The contact-bond model and parallel-bond model were used to simulate the behavior of the binders and crystals, respectively. The contact-bond model can be regarded as a special linear model that can endure tensile force, as shown in Figure 5a. Before the bond is broken, the force and displacement relationships are equal in a process of compression and tension. Compared to the contact-bond model, the parallel-bond model consists of a linear bond and a parallel bond, indicating that the compressive and tensile behaviors are independent, as shown in Figure 5b. In addition, bending moment and twisting moment can be transmitted in the parallel-bond model, but they are prohibited in the contact-bond model.
Figure 6 shows the DEM models of the composite particles with realistic particle shapes, in which the blue balls were binders and the balls of the other color were crystals. The modeling process of the composite particles was amply described in our previous study [46]. To guarantee a better coating effect of the binders, the basic unit size of the binders was smaller than that of the crystals. Compared to brittle crystals, binders have better mobility and flexibility because of their lower stiffness. According to the features of the materials, the contact-bond model was applied to the binders and interfaces between binder and crystal, whereas the parallel-bond model was used for the crystals.
In our previous study [46], a series of basic mechanical tests was used to determine the DEM parameters of the binders and crystals separately, and the calibration method followed the principle proposed by Gao et al. [54]. The determined parameters were then applied to the polymer–crystal composite particles and further validated by single particle crushing tests in experiments and DEM simulations. The DEM parameters are summarized in Table 1.

3. Results and discussion

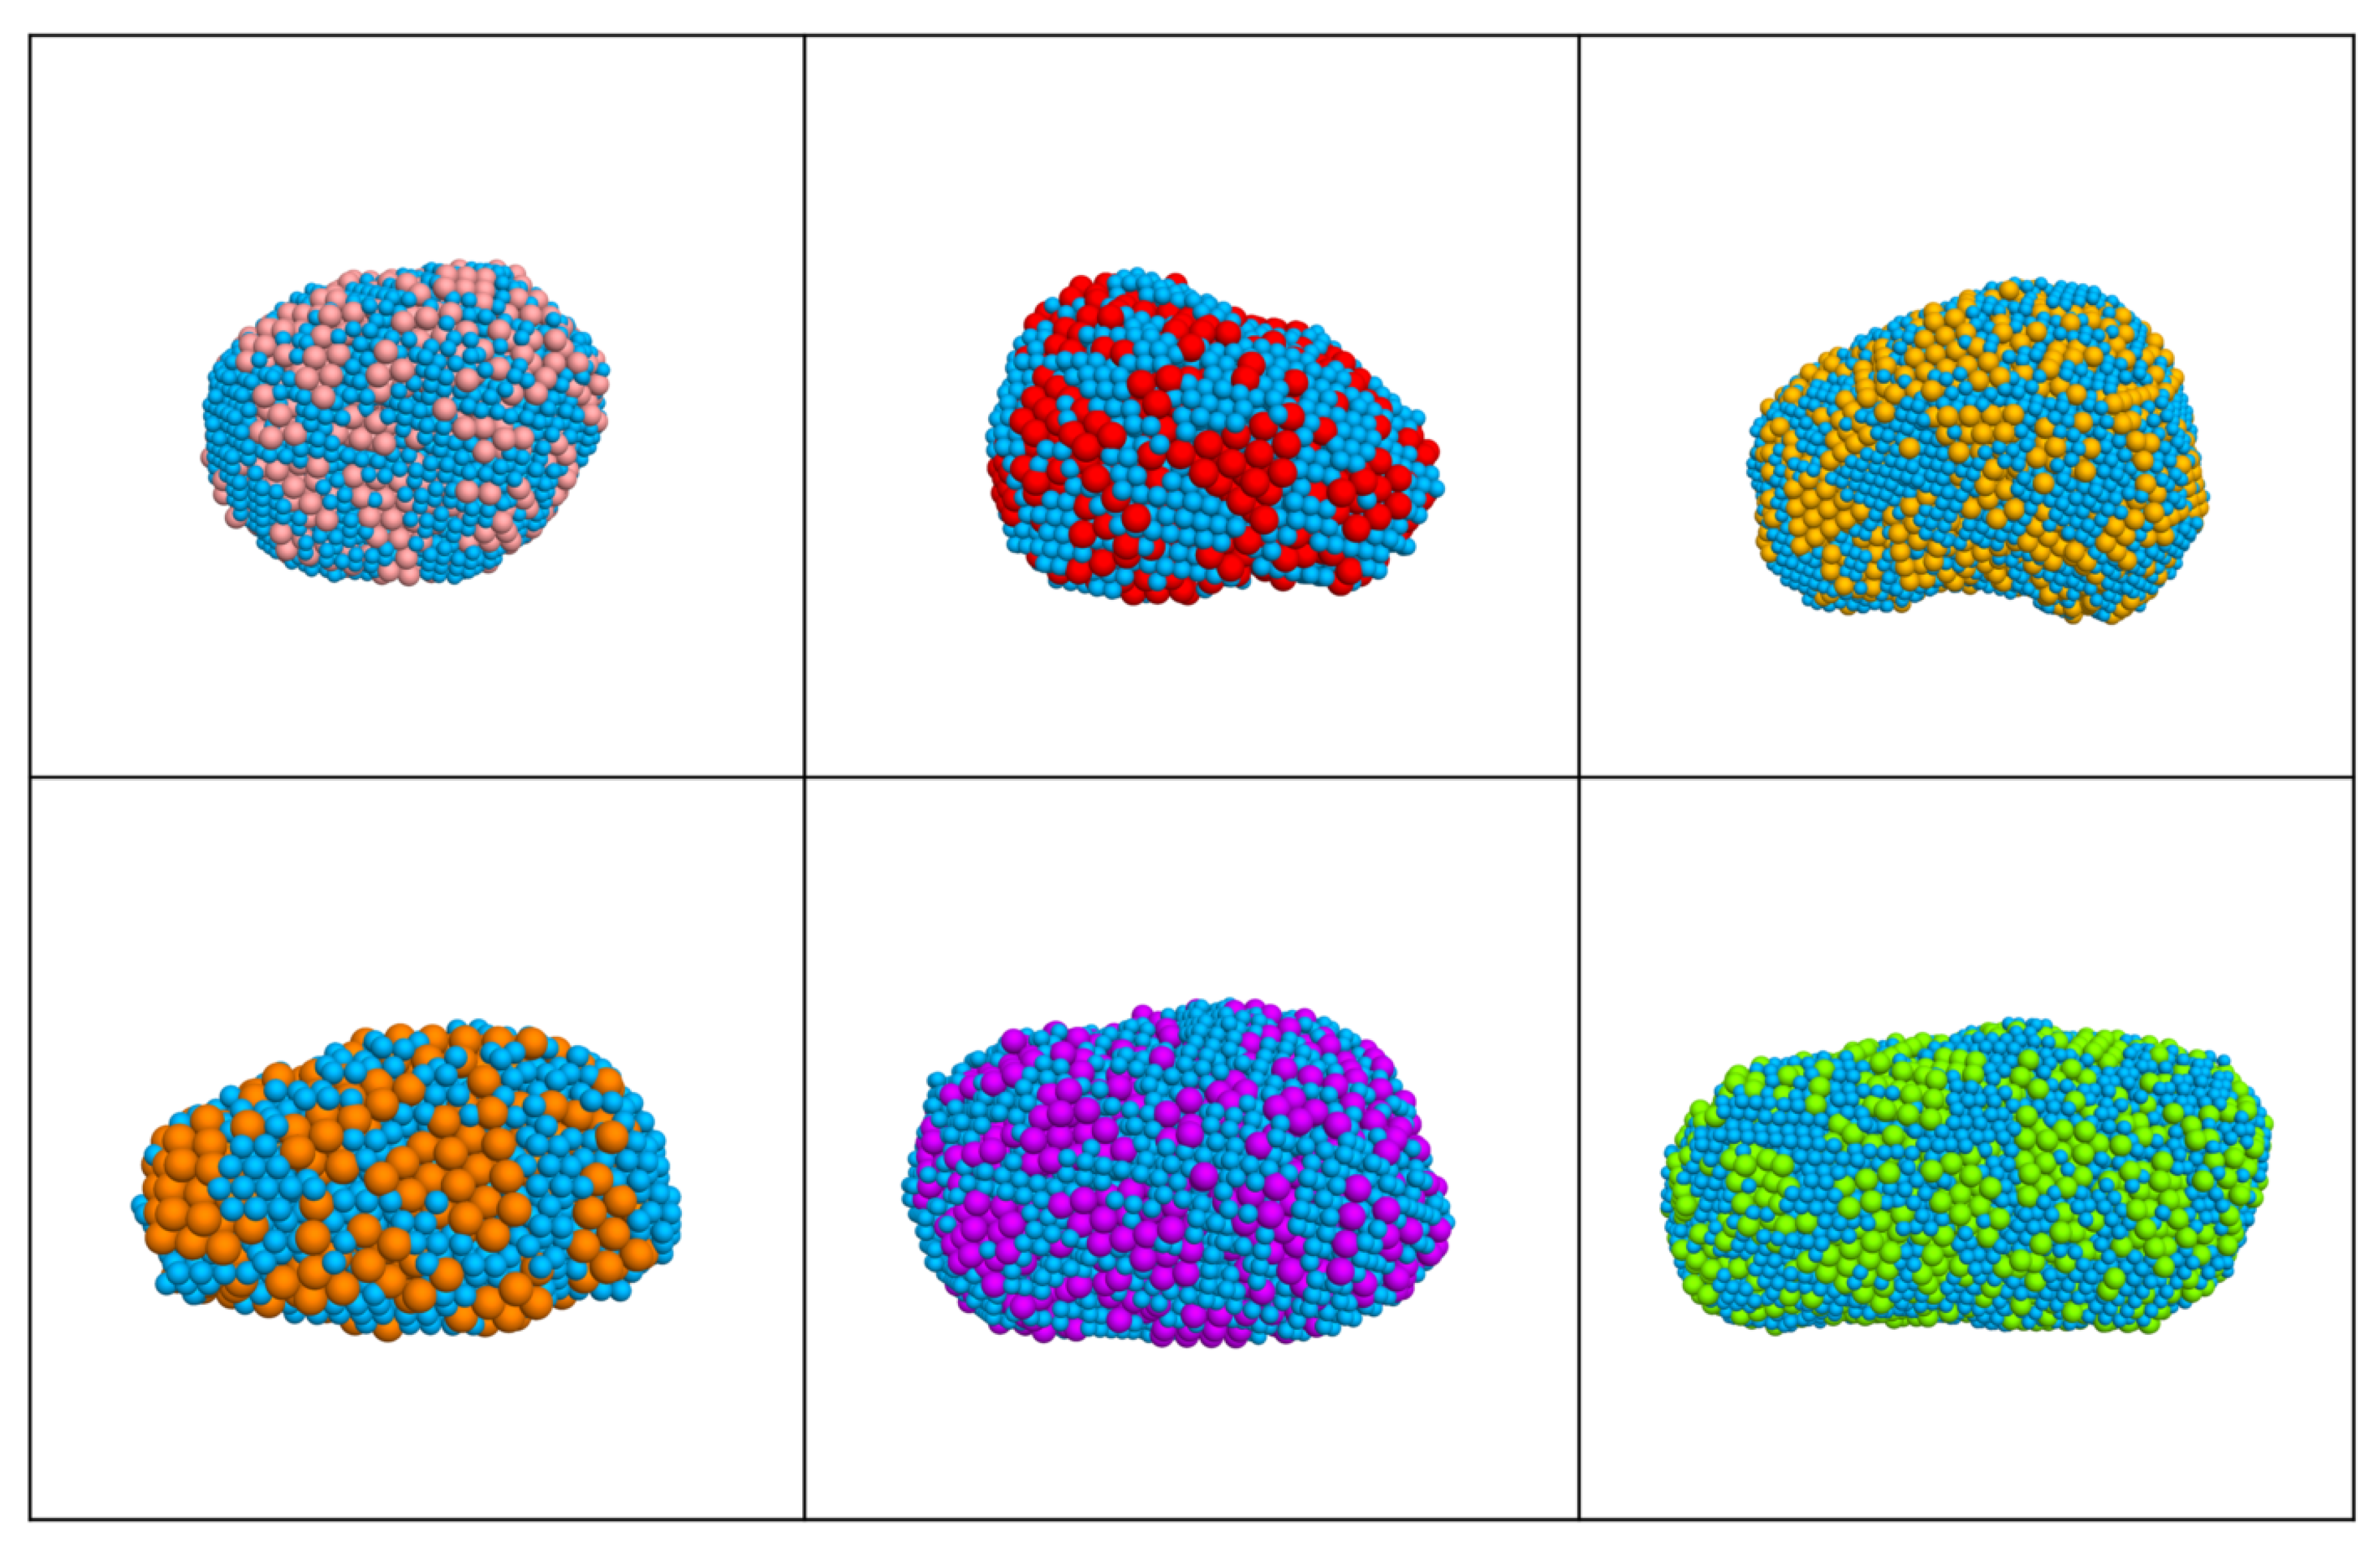
3.1. Morphology Effect on Mechanism Responses of Composite Particles

To further examine the effects of morphology on the mechanism responses of the composite particles, the spherical particle and realistic shape particle with the equivalent particle diameter (0.928 mm) were selected to implement the single particle crushing test in the DEM. For the realistic shape particle, the initial state of the particle should meet the minimum potential energy principle before the loading process. After the PCA, the particle was rotated until the long and short axes were parallel to the XY plane and the Z axis, respectively. Then, rigid walls were generated at the top and bottom of the particle. Finally, the upper wall moved down at a constant speed of 0.1 m/s. To eliminate the effect of the loading rate, a related analysis was implemented in our previous study [46], which was consistent with the results verified by Sheng et al. [41] and Lv et al. [55].
Figure 7A shows the force–displacement curves of the composite particles, in which the black curve represents the result of the spherical particle, and the gray curves are the results of the realistic particles. In addition, the propagation of microcracks inside the spherical particle is recorded in Figure 7a. Six types of microcrack were captured by the DEM: tensile and shear microcracks inside the crystals (i.e., black and red discs), tensile and shear microcracks inside the polymeric binder (i.e., purple and green discs), and tensile and shear microcracks in the interface between the crystals and the binder (i.e., light blue and yellow discs). For most of the particles, the initial contact may have been insufficient, causing fluctuations before the displacement reached 0.025 mm. Similar to the experimental curves, the spherical particle curve displayed a double peak. However, its curve differed from the simulation curves in that the first peak appeared later, and the second peak was much lower than the first. This phenomenon was attributed to the morphology of the composite particle. Due to the lower restraint between the particles and the loading plate, the particle deformation and fragment slippage became much easier, reducing the elastic stiffness and second peak strength. To further understand the fracture behavior of the composite particle, four critical states were captured, as shown in Figure 7A,B. There was no macrocrack on the surface at the first peak, but many microcracks inside the particle. At point b, an unobvious macrocrack was found in the middle of the particle, and the connectivity of the microcracks was increased inside the particle. As the loading progressed, the microcracks spread from the middle of the particle to the edge of the YZ plane. At the same time, a macrocrack through the whole particle was formed at point c, and the gap of the macrocrack expanded rapidly to point d. This indicates that the internal damage in the hardening and failure stages continued to accumulate until the loading stopped.
Figure 8A shows the force–displacement curves of the realistic particles, with the addition of the propagation of microcracks inside the short-rod particle. It is obvious that the results of the realistic particles were more in line with the experimental results, especially the displacement of the first peak and the strength of the second peak. The stiffness of the realistic particle was about twice that of the spherical particle, whereas their first peak strengths were more similar. Compared to the results of Figure 7, the morphology of the composite particles influenced not only the elastic deformation but also the plastic behavior. As for the spherical particle, four critical states were captured by the DEM, as shown in Figure 8A,B. At point a, no macrocrack had yet appeared on the surface, but many microcracks existed inside the particle. In addition, compared to the spherical particle, the realistic particle had a wider distribution of microcracks at point a. This indicated more contact points between the loading plate and particle when morphology was considered, resulting in the higher stiffness. At point b, an unobvious macrocrack was found on the surface of the particle, and more microcracks were created in the center of the particle. As the loading progressed, the microcracks spread from the middle of the particle to the edge of the YZ plane. At the same time, a macrocrack through the whole particle was formed at point c, and the macrocrack gap expanded rapidly to point d. This behavior was the same as that of the spherical particle, but the plastic deformation and second peak strength were higher.
The interface was the weakest path of fracture [56,57], and the DEM results confirmed this theory, as shown in Figure 9A. To quantify the degree of fracture, the ratio of the different types of microcrack to the corresponding type of contact was calculated. The shear microcracks in the interface dominated the fracture of the composite particle, meaning that the sliding failure on the interface preceded the tensile failure. This may explain why the macro-fracture appeared in the second but not the first peak. During the loading process, there were few microcracks in the crystal, indicating that the crystal strength was higher than the fracture stress of the composite particle. Figure 9B shows the normalized polar distribution of the total microcracks that evolved on the XY plane. At point a, the distribution of the microcracks was uneven, which was attributed to the uneven distribution of stress. With the loading process, the distribution of microcracks approached the particle shape, indicating that the distribution of microcracks inside the particle gradually became uniform. This also proved the importance of particle morphology for composite particles.
To explore the relationship between the microcrack growth rate and the loading process, the force–displacement curve and ratio of shear microcracks to the number of bonds on the interface were added in Figure 10A. In addition, the second derivative was used to evaluate the slope change, in which the change in growth rate occurred at the peak of the second derivative. This shows that the microcrack growth rate can be divided into three stages by the two turning points e and f. Due to the lower stress, the rate of the microcracks was slow before point e. With the loading process, the microcracks propagated rapidly and linearly until point f, which was later than point a. After point f, the microcrack growth rate still increased linearly but more slowly than the e–f stage. Thirty composite particles were selected to verify this phenomenon, and the results are shown in Figure 10B. To reflect the regularity, the displacements at point f were sorted according to magnitude, and a statistical method further verified this phenomenon. It was obvious that the second turning point of the microcrack rate curve was not synchronized with the first peak of the force–displacement curve, but occurred later than the first peak, which was attributed to elastic hysteresis.

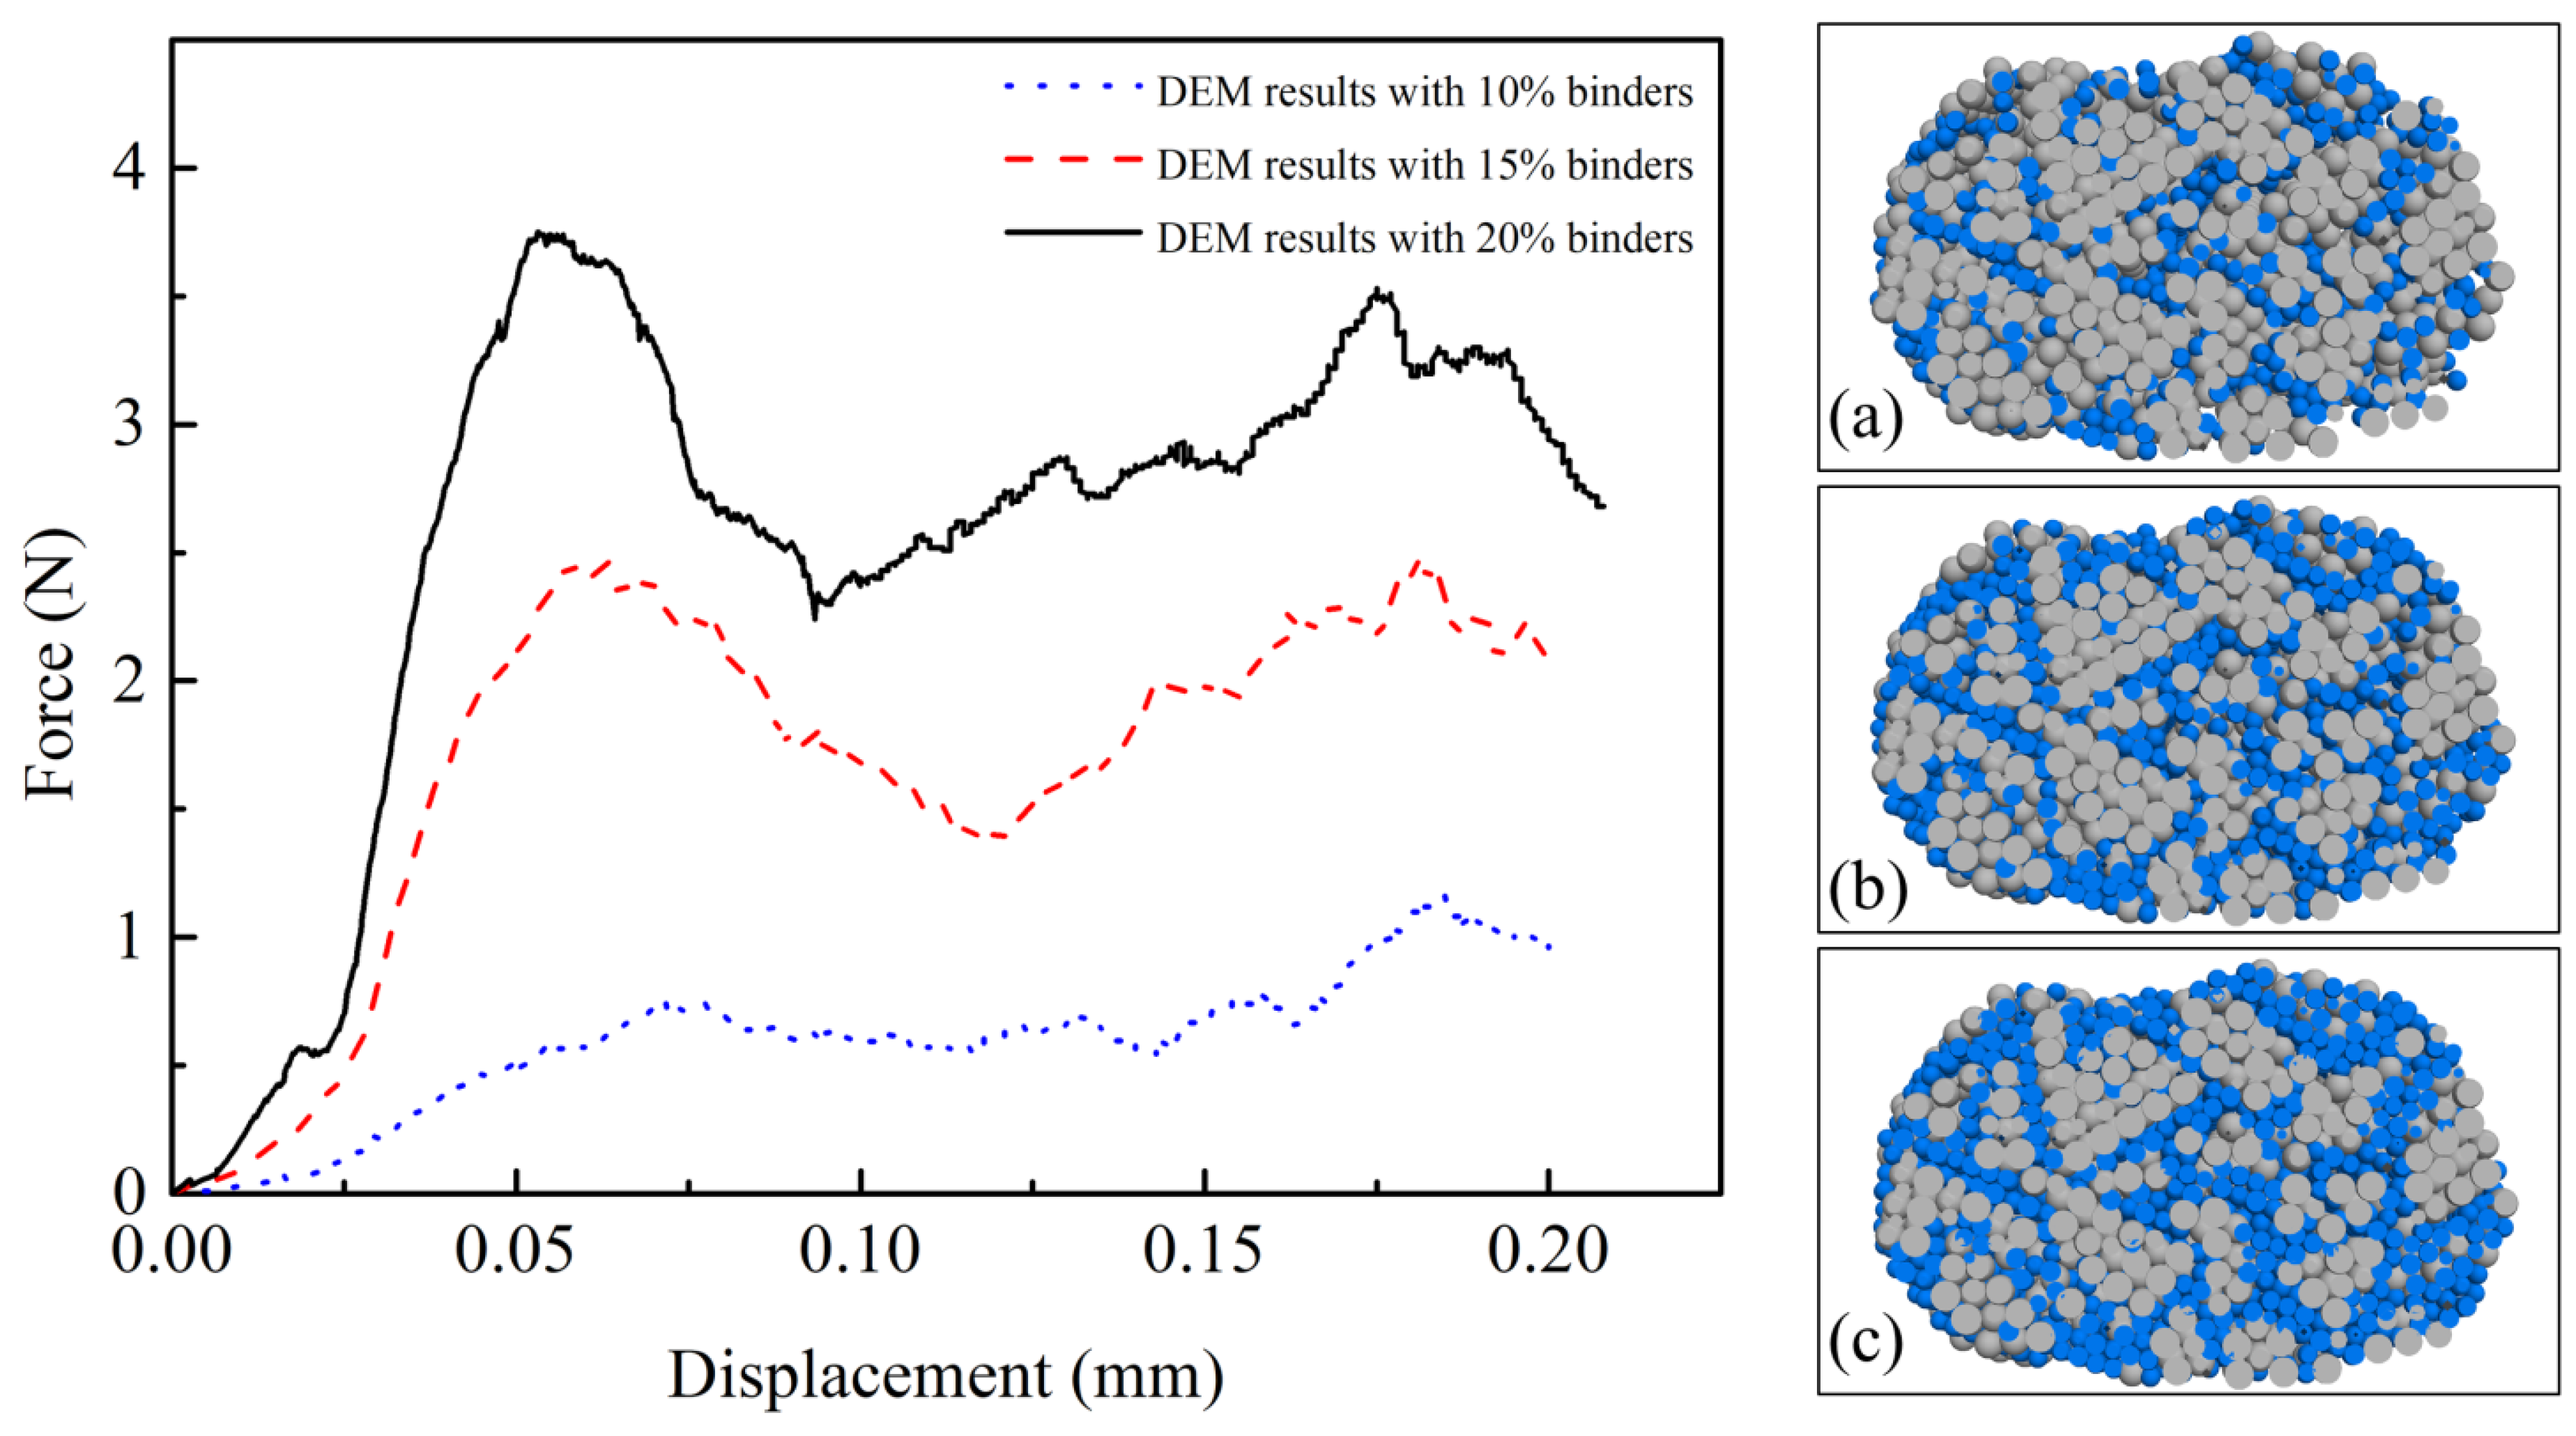
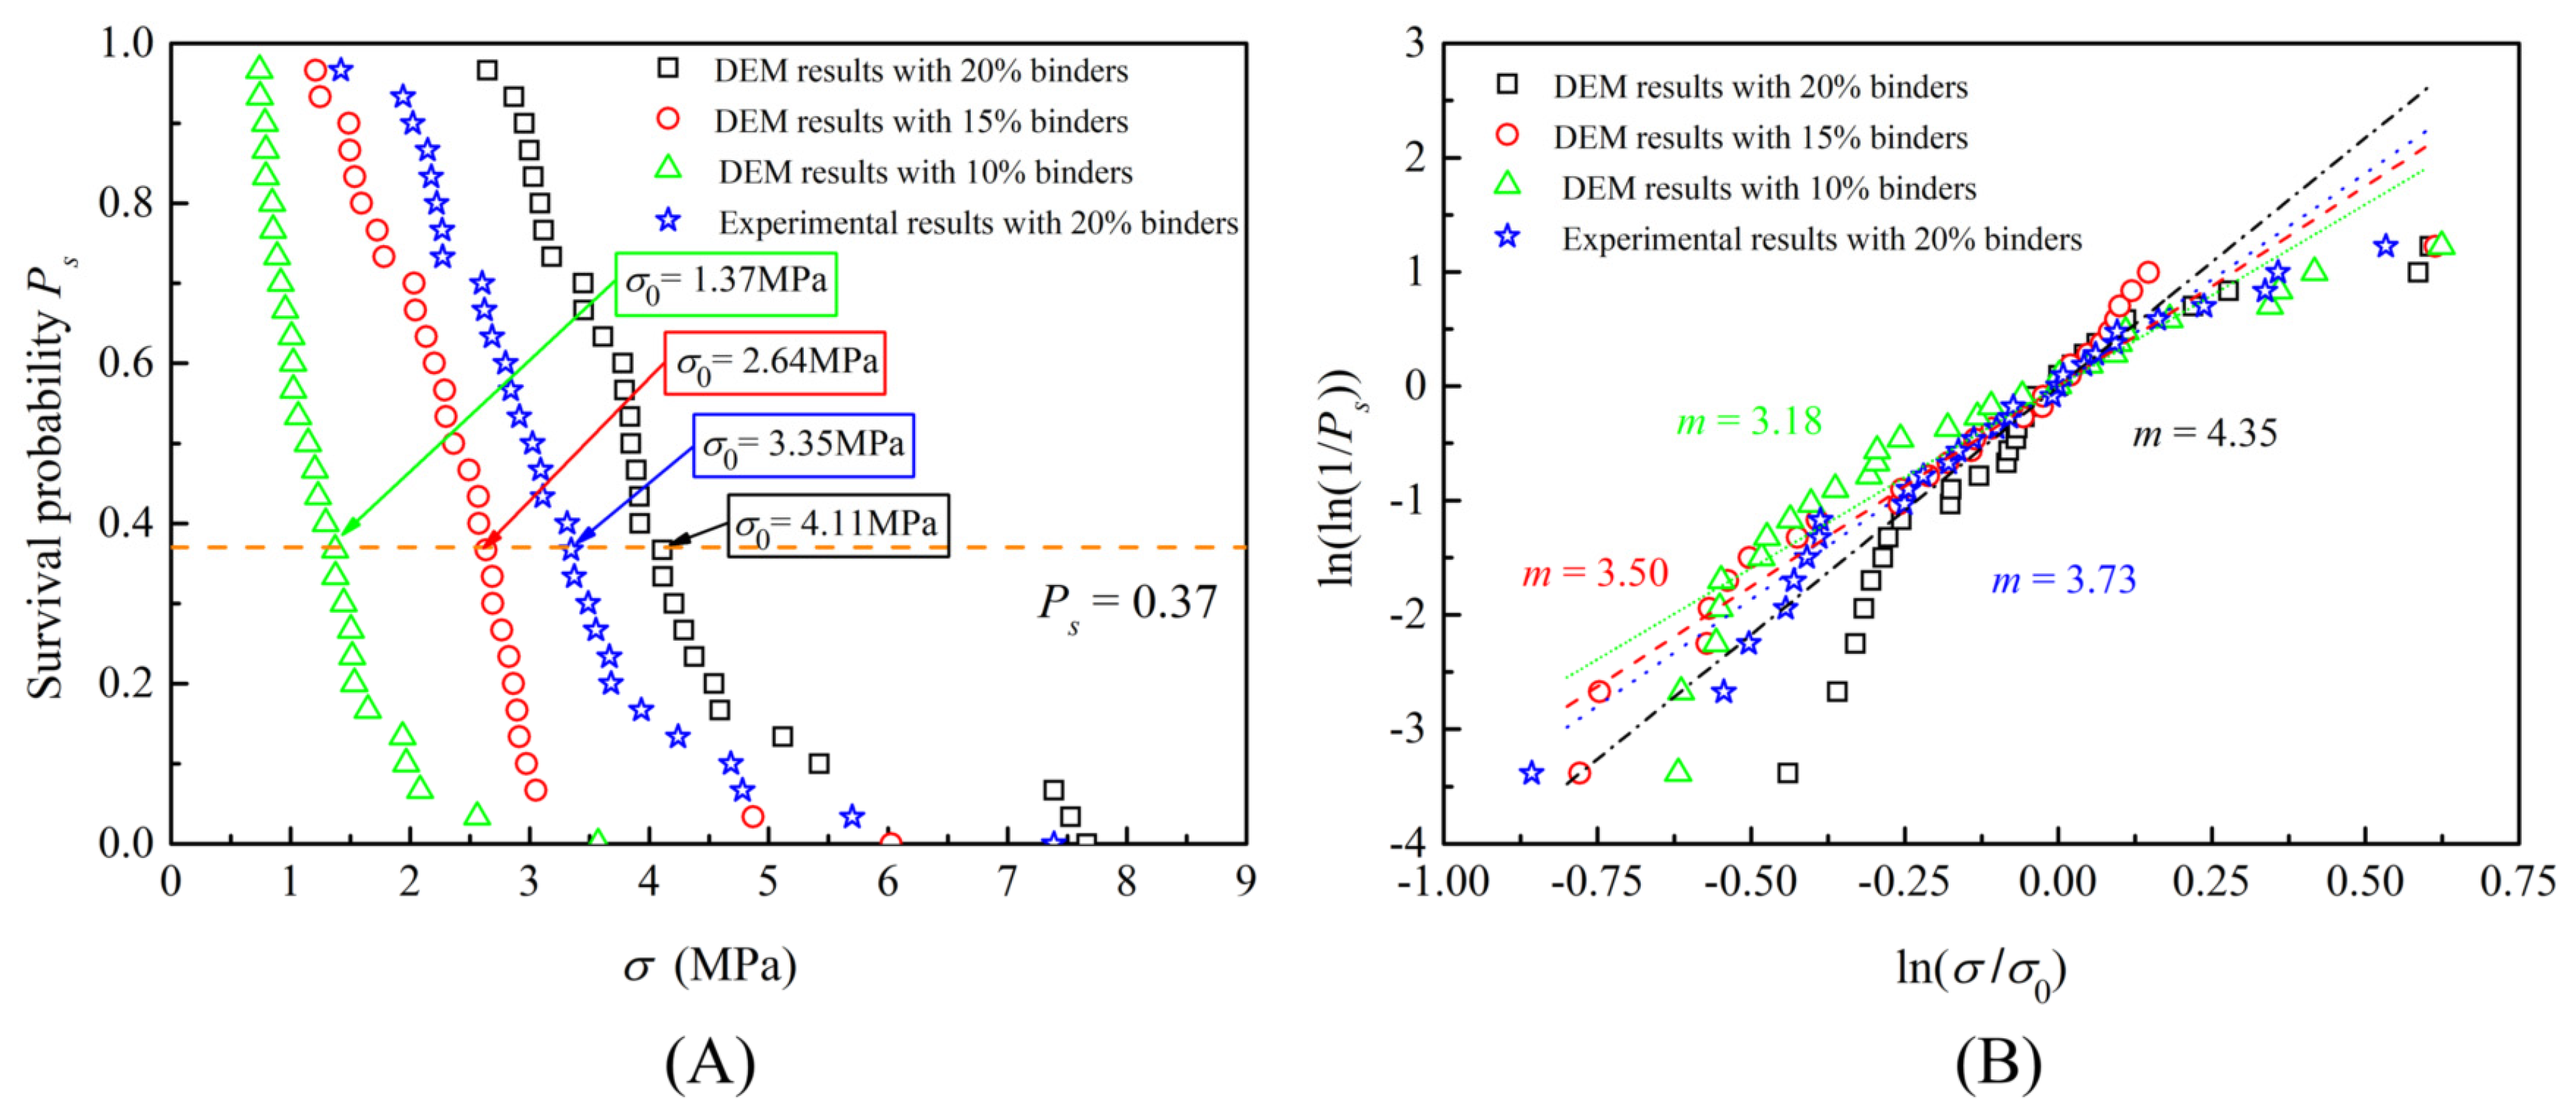
3.2. Binder Content on Mechanism Responses of Composite Particles

The binder content played an important role in the stability of the material and the energy density. The binder content was adjusted (10%, 15%, 20%) under the same distribution of crystals, and the single particle crushing tests were repeated, as shown in Figure 11. Clearly, the stiffness and peak forces were positively correlated to the binder content, which was attributed to the coating effect. Interestingly, the pattern of the force–displacement curve changed when the binder content was 10%, showing more significant hardening behavior. This indicates that the interaction of the crystals may have been more active with the lower binder content.
The propagation of the shear microcracks at the interface could still be divided into three stages by two turning points, as shown in Figure 12A. As the binder content decreased, the ratio of the shear microcracks at the interface also decreased and the turning points appeared later. The lower the binder content was, the larger the deformation was, the lower the microcrack ratio was, and the more easily the composite particle was broken. Figure 12B shows the ratio of the number of different types of microcrack to the number of corresponding bonds when the particle was broken. The crystal microcracks were not included because there were so few. Even when the binder content was different, the shear microcracks at the interface still dominated the fracture of the composite particle. In addition, the shear microcrack ratio was positively correlated with the binder content, whereas the tensile microcrack ratio was not sensitive to the binder content.
To quantify the crushing behavior, the particle-crushing strength of an individual particle subjected to uniaxial compression is represented by the maximum tensile stress within the particle volume [24,27,37], empirically defined as follows:
σ = 0.9 F d 0 2
where σ is the crushing strength, F is the major peak of the force–displacement curve and d0 is the equivalent dimension of the particle, taken as d0 = (d2d3)1/2, in which d2 and d3 are the intermediate and minimum dimensions of the particle, respectively.
A statistical method was used to measure the crushing strengths, for which the survival probability distribution and Weibull distribution from the experimental and DEM results are shown in Figure 13. Thirty realistic composite particles formed a group, and three groups of simulations were performed with different binder content in the DEM. The characteristic strength of a particle is defined by the value corresponding to 1/e (i.e., 37%) of the survival probability in the survival probability distribution curve [24,27], and the Weibull distribution of the particle-crushing strengths is expressed as follows:
ln [ ln ( 1 P s ) ] = m ln ( σ σ 0 )
where σ0 is the characteristic strength and m is the Weibull modulus.
As demonstrated in Figure 13A, the characteristic particle-crushing strength in the DEM results was slightly higher than in the experimental results with the same binder content. This difference may reflect the size effect of the crystals in the DEM or the error in the binder content in the granulation process. Clearly, the characteristic strength showed a linear positive correlation with the binder content. With a reduction in the binder content, the slope of the fitting curve rotated clockwise around the origin, indicating that the Weibull modulus decreased and the dispersion of the particle crushing strength increased, as shown in Figure 13B. In addition, the lower the binder content was, the greater the number of pore structures formed inside the composite particle, causing lower strength and a more complicated mechanical response.

4. Conclusions

This study investigated the mechanics of the polymer–crystal composite particles. First, the particle morphology was classified using the improved triangular Zingg diagram. Based on SEM and X-ray μCT images, composite particles with realistic morphology and a heterogeneous microstructure were constructed using the DEM. The failure mode, effect of morphology, propagation of microcracks, and binder content were statistically analyzed. Based on the experimental and numerical results, some key conclusions are summarized as follows.
(1)
The force–displacement curves of the composite particles presented a double-peak pattern in the single particle crushing test. Unlike in brittle materials, the macro-fracture occurred at the second peak, which was attributed to elastic hysteresis. DEM simulations confirmed this particle behavior and further revealed the micro-fracture mechanism of the composite particle. It showed that the first peak was induced by localized microcracks, causing a decrease in particle strength, whereas the second peak was caused by penetration of the microcracks through to the upper and lower loading plates.
(2)
The morphology of the composite particle had significant effects on particle crushing in the DEM, such as stiffness, plastic deformation, and second peak strength. Compared to the spherical particle, multiple contact points were generated between the realistic particles and the loading plate, resulting in greater vertical plastic deformation and higher second peak strength. The shear microcracks at the interfaces dominated the fracture behavior of the composite particle, indicating that sliding between the binder and crystal caused the initial damage to the particle. During the plastic stage, the normalized polar distribution of the microcracks was correlated with the particle morphology, meaning that plastic damage evolved toward the whole particle. Due to the effect of elastic hysteresis, the second turning point in the shear microcracks at the interfaces occurred later than the first peak of the force–displacement curve.
(3)
With a decrease in binder content, the yield hardening behavior was more pronounced, indicating that the interaction of the crystals may be more active with a lower coating effect. Moreover, the shear microcrack ratio was positively correlated with binder content, whereas the tensile microcrack ratio was insensitive to binder content. A statistical method was used to measure the crushing strength, and a positive linear correlation was found between the binder content and the characteristic strength based on survival probability. The lower the binder content, the more pore structures were formed inside the composite particle, causing lower strength and higher dispersion.
The findings and results of this study provide a potential way to reveal the micro-fracture mechanism of polymer–crystal composite particles, which would be useful in guiding the granulation process. Moreover, this model could be extended to time–effect creep behavior and coupled with the temperature field in future studies.

Author Contributions

Writing—original draft preparation, H.W.; data curation, validation, J.L.; methodology, software, G.H.; conceptualization, visualization, B.Z.; formal analysis, investigation, Y.G. All authors have read and agreed to the published version of the manuscript.

Funding

This research was funded by research Grant Nos. 41877233, 42072298, and 41931286 from the National Natural Science Foundation of China.

Institutional Review Board Statement

Not applicable.

Informed Consent Statement

Not applicable.

Data Availability Statement

Not applicable.

Conflicts of Interest

The authors declare no conflict of interest.

References

  1. Zheng, R.; Wang, S.; Tian, Y.; Jiang, X.; Fu, D.; Shen, S.; Yang, W. Polydopamine-coated magnetic composite particles with an enhanced photothermal effect. ACS Appl. Mater. Interfaces 2015, 7, 15876–15884. [Google Scholar] [CrossRef]
  2. Shen, Y.; Lin, Y.; Nan, C.W. Interfacial effect on dielectric properties of polymer nanocomposites filled with core/shell-structured particles. Adv. Funct. Mater. 2007, 17, 2405–2410. [Google Scholar] [CrossRef]
  3. Wang, X.; Ma, Z.; Chai, L.; Xu, L.; Zhu, Z.; Hu, Y.; Qian, J.; Huang, S. MOF-derived N-doped carbon-coated CoP particle/carbon nanotube composite for efficient oxygen evolution reaction. Carbon N. Y. 2019, 141, 643–651. [Google Scholar] [CrossRef]
  4. An, J.S.; Kwon, S.H.; Choi, H.J.; Jung, J.H.; Kim, Y.G. Modified silane-coated carbonyl iron/natural rubber composite elastomer and its magnetorheological performance. Compos. Struct. 2017, 160, 1020–1026. [Google Scholar] [CrossRef]
  5. Lan, G.; Jin, S.; Chen, M.; Li, J.; Lu, Z.; Wang, N.; Li, L. Preparation and performances characterization of HNIW/NTO-based high-energetic low vulnerable polymer-bonded explosive. J. Therm. Anal. Calorim. 2020, 139, 3589–3602. [Google Scholar] [CrossRef]
  6. Rahimi, M.; Chan, D.; Nouri, A. Bounding surface constitutive model for cemented sand under monotonic loading. Int. J. Geomech. 2016, 16, 04015049. [Google Scholar] [CrossRef]
  7. Mujah, D.; Cheng, L.; Shahin, M.A. Microstructural and geomechanical study on biocemented sand for optimization of MICP process. J. Mater. Civ. Eng. 2019, 31, 04019025. [Google Scholar] [CrossRef] [Green Version]
  8. Fotovvati, B.; Namdari, N.; Dehghanghadikolaei, A. On coating techniques for surface protection: A review. J. Manuf. Mater. Process. 2019, 3, 28. [Google Scholar] [CrossRef] [Green Version]
  9. Wei, J.; Li, B.; Jing, L.; Tian, N.; Zhao, X.; Zhang, J. Efficient protection of Mg alloy enabled by combination of a conventional anti-corrosion coating and a superamphiphobic coating. Chem. Eng. J. 2020, 390, 124562. [Google Scholar] [CrossRef]
  10. Safavi, M.S.; Tanhaei, M.; Ahmadipour, M.F.; Ghaffari Adli, R.; Mahdavi, S.; Walsh, F.C. Electrodeposited Ni-Co alloy-particle composite coatings: A comprehensive review. Surf. Coatings Technol. 2020, 382, 125153. [Google Scholar] [CrossRef]
  11. Feng, H.; Yu, J.K.; Tan, W. Microstructure and thermal properties of diamond/aluminum composites with TiC coating on diamond particles. Mater. Chem. Phys. 2010, 124, 851–855. [Google Scholar] [CrossRef]
  12. Feng, K.; Montoya, B.M. Influence of confinement and cementation level on the behavior of microbial-induced calcite precipitated sands under monotonic drained loading. J. Geotech. Geoenviron. Eng. 2016, 142, 04015057. [Google Scholar] [CrossRef]
  13. Nafisi, A.; Montoya, B.M.; Evans, T.M. Shear strength envelopes of biocemented sands with varying particle size and cementation level. J. Geotech. Geoenviron. Eng. 2020, 146, 04020002. [Google Scholar] [CrossRef]
  14. Wang, J.S.; Suo, Z. Experimental determination of interfacial toughness curves using Brazil-nut-sandwiches. Acta Metall. Mater. 1990, 38, 1279–1290. [Google Scholar] [CrossRef]
  15. Drory, M.D.; Hutchinson, J.W. Measurement of the adhesion of a brittle film on a ductile substrate by indentation. Proc. R. Soc. A Math. Phys. Eng. Sci. 1996, 452, 2319–2341. [Google Scholar] [CrossRef]
  16. Mroz, J.; Dauskardt, R.H.; Schleinkofer, U. New adhesion measurement technique for coated cutting tool materials. Int. J. Refract. Met. Hard Mater. 1998, 16, 395–402. [Google Scholar] [CrossRef]
  17. Hofinger, I.; Oechsner, M.; Bahr, H.A.; Swain, M.V. Modified four-point bending specimen for determining the interface fracture energy for thin, brittle layers. Int. J. Fract. 1998, 92, 213–220. [Google Scholar] [CrossRef]
  18. Cui, M.J.; Zheng, J.J.; Zhang, R.J.; Lai, H.J.; Zhang, J. Influence of cementation level on the strength behaviour of bio-cemented sand. Acta Geotech. 2017, 12, 971–986. [Google Scholar] [CrossRef]
  19. Lade, P.V.; Yamamuro, J.A.; Bopp, P.A. Closure to “Significance of particle crushing in granular materials” by Poul V. Lade, Jerry A. Yamamuro, and Paul A. Bopp. J. Geotech. Geoenviron. Eng. 1997, 123, 889–890. [Google Scholar] [CrossRef]
  20. Ueng, T.S.; Chen, T.J. Energy aspects of particle breakage in drained shear of sands. Geotechnique 2000, 50, 65–72. [Google Scholar] [CrossRef]
  21. Coop, M.R.; Sorensen, K.K.; Freitas, T.B.; Georgoutsos, G. Particle breakage during shearing of a carbonate sand. Geotechnique 2004, 54, 157–163. [Google Scholar] [CrossRef]
  22. Yu, F.W. Particle breakage and the critical state of sands. Geotechnique 2017, 67, 713–719. [Google Scholar] [CrossRef]
  23. Hiramatsu, Y.; Oka, Y. Determination of the tensile strength of rock by a compression test of an irregular test piece. Int. J. Rock Mech. Min. Sci. 1966, 3, 89–90. [Google Scholar] [CrossRef]
  24. Wang, W.; Coop, M.R. An investigation of breakage behaviour of single sand particles using a high-speed microscope camera. Geotechnique 2016, 66, 984–998. [Google Scholar] [CrossRef] [Green Version]
  25. Wei, D.; Zhao, B.; Dias-da-Costa, D.; Gan, Y. An FDEM study of particle breakage under rotational point loading. Eng. Fract. Mech. 2019, 212, 221–237. [Google Scholar] [CrossRef]
  26. Zhou, B.; Wei, D.; Ku, Q.; Wang, J.; Zhang, A. Study on the effect of particle morphology on single particle breakage using a combined finite-discrete element method. Comput. Geotech. 2020, 122, 103532. [Google Scholar] [CrossRef]
  27. Nakata, Y.; Kato, Y.; Hyodo, M.; Hyde, A.F.L.; Murata, H. One-dimensional compression behaviour of uniformly graded sand related to single particle crushing strength. Soils Found. 2001, 41, 39–51. [Google Scholar] [CrossRef] [Green Version]
  28. Zhou, B.; Wang, J.; Zhao, B. Micromorphology characterization and reconstruction of sand particles using micro X-ray tomography and spherical harmonics. Eng. Geol. 2015, 184, 126–137. [Google Scholar] [CrossRef]
  29. Zhao, B.; Wang, J. 3D quantitative shape analysis on form, roundness, and compactness with μCT. Powder Technol. 2016, 291, 262–275. [Google Scholar] [CrossRef] [Green Version]
  30. Zhou, B.; Wang, J.; Wang, H. Three-dimensional sphericity, roundness and fractal dimension of sand particles. Geotechnique 2018, 68, 18–30. [Google Scholar] [CrossRef]
  31. Cordes, N.L.; Seshadri, S.; Havrilla, G.J.; Yuan, X.; Feser, M.; Patterson, B.M. Three dimensional subsurface elemental identification of minerals using confocal micro-X-ray fluorescence and micro-X-ray computed tomography. Spectrochim. Acta Part B At. Spectrosc. 2015, 103, 144–154. [Google Scholar] [CrossRef] [Green Version]
  32. Garcea, S.C.; Wang, Y.; Withers, P.J. X-ray computed tomography of polymer composites. Compos. Sci. Technol. 2018, 156, 305–319. [Google Scholar] [CrossRef]
  33. Cundall, P.A.; Strack, O.D.L. A discrete numerical model for granular assemblies. Geotechnique 1979, 29, 47–65. [Google Scholar] [CrossRef]
  34. Iwashita, K.; Oda, M. Rolling resistance at contacts in simulation of shear band. J. Eng. Mech. 1998, 124, 285–292. [Google Scholar] [CrossRef]
  35. Zhou, B.; Huang, R.; Wang, H.; Wang, J. DEM investigation of particle anti-rotation effects on the micromechanical response of granular materials. Granul. Matter 2013, 15, 315–326. [Google Scholar] [CrossRef]
  36. Liu, Y.; Liu, H.; Mao, H. DEM investigation of the effect of intermediate principle stress on particle breakage of granular materials. Comput. Geotech. 2017, 84, 58–67. [Google Scholar] [CrossRef]
  37. Fu, R.; Hu, X.; Zhou, B. Discrete element modeling of crushable sands considering realistic particle shape effect. Comput. Geotech. 2017, 91, 179–191. [Google Scholar] [CrossRef]
  38. Ketterhagen, W.R. Modeling the motion and orientation of various pharmaceutical tablet shapes in a film coating pan using DEM. Int. J. Pharm. 2011, 409, 137–149. [Google Scholar] [CrossRef]
  39. Li, L.; Kemp, I.; Palmer, M. A DEM-based mechanistic model for scale-up of industrial tablet coating processes. Powder Technol. 2020, 364, 698–707. [Google Scholar] [CrossRef]
  40. Abbas, A.; Masad, E.; Papagiannakis, T.; Shenoy, A. Modelling asphalt mastic stiffness using discrete element analysis and micromechanics-based models. Int. J. Pavement Eng. 2005, 6, 137–146. [Google Scholar] [CrossRef]
  41. Sheng, Y.; Yang, D.; Tan, Y.; Ye, J. Microstructure effects on transverse cracking in composite laminae by DEM. Compos. Sci. Technol. 2010, 70, 2093–2101. [Google Scholar] [CrossRef] [Green Version]
  42. Xu, W.; Xu, B.; Guo, F. Elastic properties of particle-reinforced composites containing nonspherical particles of high packing density and interphase: DEM–FEM simulation and micromechanical theory. Comput. Methods Appl. Mech. Eng. 2017, 326, 122–143. [Google Scholar] [CrossRef]
  43. Sato, A.; Serris, E.; Grosseau, P.; Thomas, G.; Galet, L.; Chamayou, A.; Baron, M. Experiment and simulation of dry particle coating. Chem. Eng. Sci. 2013, 86, 164–172. [Google Scholar] [CrossRef] [Green Version]
  44. Ma, G.; Zhou, W.; Chang, X.L.; Ng, T.T.; Yang, L.F. Formation of shear bands in crushable and irregularly shaped granular materials and the associated microstructural evolution. Powder Technol. 2016, 301, 118–130. [Google Scholar] [CrossRef]
  45. Afshar, T.; Disfani, M.M.; Arulrajah, A.; Narsilio, G.A.; Emam, S. Impact of particle shape on breakage of recycled construction and demolition aggregates. Powder Technol. 2017, 308, 1–12. [Google Scholar] [CrossRef]
  46. Hu, G.; Zhou, B.; Fu, R.; Guo, Y.; Han, C.; Lv, K. Discrete element modeling of the compression molding of polymer–crystal composite particles. Powder Technol. 2021, 390, 112–125. [Google Scholar] [CrossRef]
  47. Guo, Y.; Lan, Q.; Han, C.; Chen, P.; Liu, R. Microstructural characterization of pressure-induced cracking in melamine/F2311 composites and crack-healing behavior via thermal-pressure aging treatment. Mater. Des. 2020, 189, 108538. [Google Scholar] [CrossRef]
  48. Abràmoff, M.; Magelhaes, P.; Ram, S. Image processing with Image J. Biophotonics Int. 2004, 11, 36–42. [Google Scholar]
  49. Mathworks. MATLAB, 2010, Version 7.0; The MathWorks: Natick, MA, USA, 2010. [Google Scholar]
  50. Zhou, B.; Wang, J. Generation of a realistic 3D sand assembly using X-ray micro-computed tomography and spherical harmonic-based principal component analysis. Int. J. Numer. Anal. Methods Geomech. 2017, 30, 1303–1336. [Google Scholar] [CrossRef] [Green Version]
  51. Sneed, E.D.; Folk, R.L. Pebbles in the lower Colorado River, Texas: A study in particle morphogenesis. J. Geol. 1958, 66, 114–150. [Google Scholar] [CrossRef]
  52. Zhou, B.; Ku, Q.; Wang, H.; Wang, J. Particle classification and intra-particle pore structure of carbonate sands. Eng. Geol. 2020, 279, 105889. [Google Scholar] [CrossRef]
  53. Itasca, C. PFC 3D Manual, Version 5.0; Itasca Consulting Group: Minneapolis, MN, USA, 2016. [Google Scholar]
  54. Gao, Y.; De Simone, G.; Koorapaty, M. Calibration and verification of DEM parameters for the quantitative simulation of pharmaceutical powder compression process. Powder Technol. 2020, 378, 160–171. [Google Scholar] [CrossRef]
  55. Lv, Y.; Li, X.; Fan, C.; Su, Y. Effects of internal pores on the mechanical properties of marine calcareous sand particles. Acta Geotech. 2021, 8, 1–20. [Google Scholar] [CrossRef]
  56. Suo, Z.; Hutchinson, J. Sandwich test specimens for measuring interface crack toughness. Mater. Sci. Eng. A 1989, 107, 135–143. [Google Scholar] [CrossRef]
  57. Chen, Z.; Zhou, K.; Lu, X.; Lam, Y.C. A review on the mechanical methods for evaluating coating adhesion. Acta Mech. 2014, 225, 431–452. [Google Scholar] [CrossRef]
Figure 1. Morphology and microstructure of the polymer–crystal composite particles: (a) optical microscope image of the composite particles; (b) X-ray μCT image of the composite particles; (c) scanning electron microscopy image of the crystals.
Coatings 11 01075 g001
Figure 2. Classification of two groups of polymer–crystal composite particles based on triangular classification diagram.
Coatings 11 01075 g002
Figure 3. Light uniaxial loading device with a high-definition camera.
Coatings 11 01075 g003
Figure 4. Experimental results of single particle crushing tests: (A) force–displacement curves; (B) particle state during the loading process. (a) elastic limit; (b) yield minimum; (c) breakage peak; (d) finial failure.
Coatings 11 01075 g004
Figure 5. Two typical bond models in the DEM: (a) contact-bond model; (b) parallel-bond model.
Coatings 11 01075 g005
Figure 6. Morphology of the polymer–crystal composite particles in the DEM: blue balls are binders, and balls of other color are crystals.
Coatings 11 01075 g006
Figure 7. DEM results of single particle crushing tests for a spherical particle: (A) force–displacement curves and spatial distribution of different microcracks; (B) particle states of the loading process. (a) elastic limit; (b) yield minimum; (c) breakage peak; (d) finial failure.
Coatings 11 01075 g007
Figure 8. DEM results of single particle crushing tests for a realistic short rod particle: (A) force–displacement curves and spatial distribution of different microcracks; (B) particle states of the loading process. (a) elastic limit; (b) yield minimum; (c) breakage peak; (d) finial failure.
Coatings 11 01075 g008
Figure 9. Propagation of microcracks in a realistic short rod particle: (A) ratio of the number of different types of microcracks to the number of corresponding bonds; (B) normalized polar distribution of the total microcracks evolved on the XY plane: a, b, c, d correspond to four states in Figure 8, respectively.
Coatings 11 01075 g009
Figure 10. (A) Change in the microcrack growth rate during the loading process; (B) the relationships between points a, b, and f.
Coatings 11 01075 g010
Figure 11. Force–displacement curve of the composite particle with varying binder content: (a) 10% binder; (b) 15% binder; (c) 20% binder.
Coatings 11 01075 g011
Figure 12. (A) Propagation of shear microcracks at the interfaces; (B) ratio of the number of different types of microcrack to the number of corresponding bonds in the final state.
Coatings 11 01075 g012
Figure 13. Statistical results of particle-crushing strengths from the DEM and experimental studies: (A) particle survival probability distribution; (B) Weibull distribution.
Coatings 11 01075 g013
Table 1. DEM parameters of the elementary balls.
DEM ItemsParameterValue
CrystalDensity (kg/m3)1900
Ball element radius (mm)0.029
Normal stiffness (N/m)1.63 × 106
Shear stiffness (N/m)1.3 × 106
Friction coefficient0.124
BinderDensity (kg/m3)1800
Ball element radius (mm)0.02
Normal stiffness (N/m)104
Shear stiffness (N/m)3 × 104
Friction coefficient0.2
WallNormal stiffness (N/m)107
Shear stiffness (N/m)107
Friction coefficient0.5
Parallel-bondParallel-bonding normal stiffness (N/m3)1.43 × 1013
Parallel-bonding shear stiffness (N/m3)1.43 × 1013
Parallel-bonding tensile strength (N/m2)60 × 106
Parallel cohesion (N/m2)60 × 106
Parallel bonding friction angle (°)30
Contact-bondNormal adhesion (N)1.5 × 10⁻²
Shear adhesion (N)1.5 × 10⁻²
SystemDamping coefficient0.7
Publisher’s Note: MDPI stays neutral with regard to jurisdictional claims in published maps and institutional affiliations.

