1. Introduction
In the design and use of automobiles, due to the heating characteristics of some of the power equipment itself, the entire vehicle cannot be maintained in a continuous and stable temperature environment to complete the driving task [
1]. On the one hand, from the perspective of external stress adjustment, driving equipment and devices can be controlled by a certain environmental control system to maintain good working conditions; on the other hand, from the perspective of their own temperature retention capabilities, advanced insulation materials or surface engineering technology can be applied to enhance the insulation capacity of the equipment in the car [
2]. This research is involved in thermal insulation coating technologies proposed in response to the above situation. It can be applied to plasma spraying and frame spraying, which can form a thermal insulation coating on the surface of metal substrate.
The spray technology is one of the surface engineering technologies [
3,
4]. This type of coating has better properties than the substrate material, expands its use range, prolongs the service life of its components, and saves resources [
5,
6]. Surface technology gives the material surface the required functions and improves its practical value. Typical surface properties required include corrosion resistance, wear resistance, lubricity, insulation, heat insulation, and wettability. The use of aluminum and titanium to increase the strength and thinning of steel as a countermeasure against global warming is very effective in improving fuel efficiency [
7,
8]. The surface function is controlled by the elements and structure of the coating film and the reaction product (rust) formed on the surface. How to accurately evaluate and control these is the key to creating a function. Even tiny defects, impurities, and disorder of atomic arrangement have become items that need to be evaluated and controlled. Therefore, the integration of material science, condensed matter physics, chemistry, analytical technology, and equipment/process technology [
9,
10,
11,
12,
13] will become an indispensable part of surface technology progress more than ever.
The paper proposed the fabrication process and thermal behavior of several types of powder coatings, based on magnesia, boron oxide, silicon oxide, and zinc, prepared by thermal spray methods—plasma and frame thermal spraying—which can find applications in the automotive industry. The ceramic film fabricated by spray technology has a network microstructure between the thermal insulation layer and the base material, and covers the thermal insulation layer and the base material with spray technology to improve the efficiency of the gas turbine and suppress heat dissipation of high-temperature components to save energy. The technology can alleviate the difference in thermal expansion, and the insulation layer contains many spherical or layered pores, which reduce the thermal conductivity.
As mentioned above, in various industrial fields, surface technology and products applying it are diversifying and becoming more and more important. The study of surface technology is also the key to solving environmental problems that are being solved on a global scale, which is the mission we must fulfill.
2. Materials and Methods
2.1. Experiment Material
2.1.1. SUS304 Substrate
In this study, SUS304 is used as substrate with a size of 30 mm × 30 mm × 3 mm (obtained from Nippon Steel Corporation in Tokyo, Japan). SUS304 is a typical austenitic stainless steel with excellent corrosion resistance, toughness, ductility, workability, weldability, and a wide range of uses. It is a sort of chromium-nickel-based stainless steel with 18% Cr-8% Ni as the main component and austenite with excellent corrosion resistance as the metal structure.
Table 1 shows the chemical compositions of SUS304. In our research, SUS304 substrates are cut into 10 mm samples and ground with less than 50 μm roughness. In order to remove the impurities on the surface, samples are cleaned by the mixture of acetone and ethanol (1:1) with ultrasonic cleaning machine for 3 min, and then washed and dried.
2.1.2. Thermal Spray Material Design
In this study, the coating is made by the thermal spray method. MgO powder is used as the main ingredient of coating material. Besides that, B2O3, SiO2, and Zn are mixed with MgO in different proportions. Then, the mixed powder is crushed and sintered at 400–450 °C and then crushed again. The powder sizes are listed as follows:
The size of MgO powder is 74 μm;
The size of B2O3 powder is 48 μm;
The size of SiO2 powder is 65 μm;
The size of Zn powder is 48 μm.
Different proportions are discussed and compared in this paper, and the compositions of spraying materials are shown in
Table 2. In this paper, compositions are all expressed by percentage of weight (wt.%). All types of materials are analyzed with 100, 200, 300, and 500 μm, which are respectively expressed by X.1, X.2, X.3, and X.4.
2.2. Fluorescence Spectroscopy Analysis of Spray Materials
In this section, X-ray fluorescence spectroscopy test is utilized to analyze the composition of thermal spay material prepared in
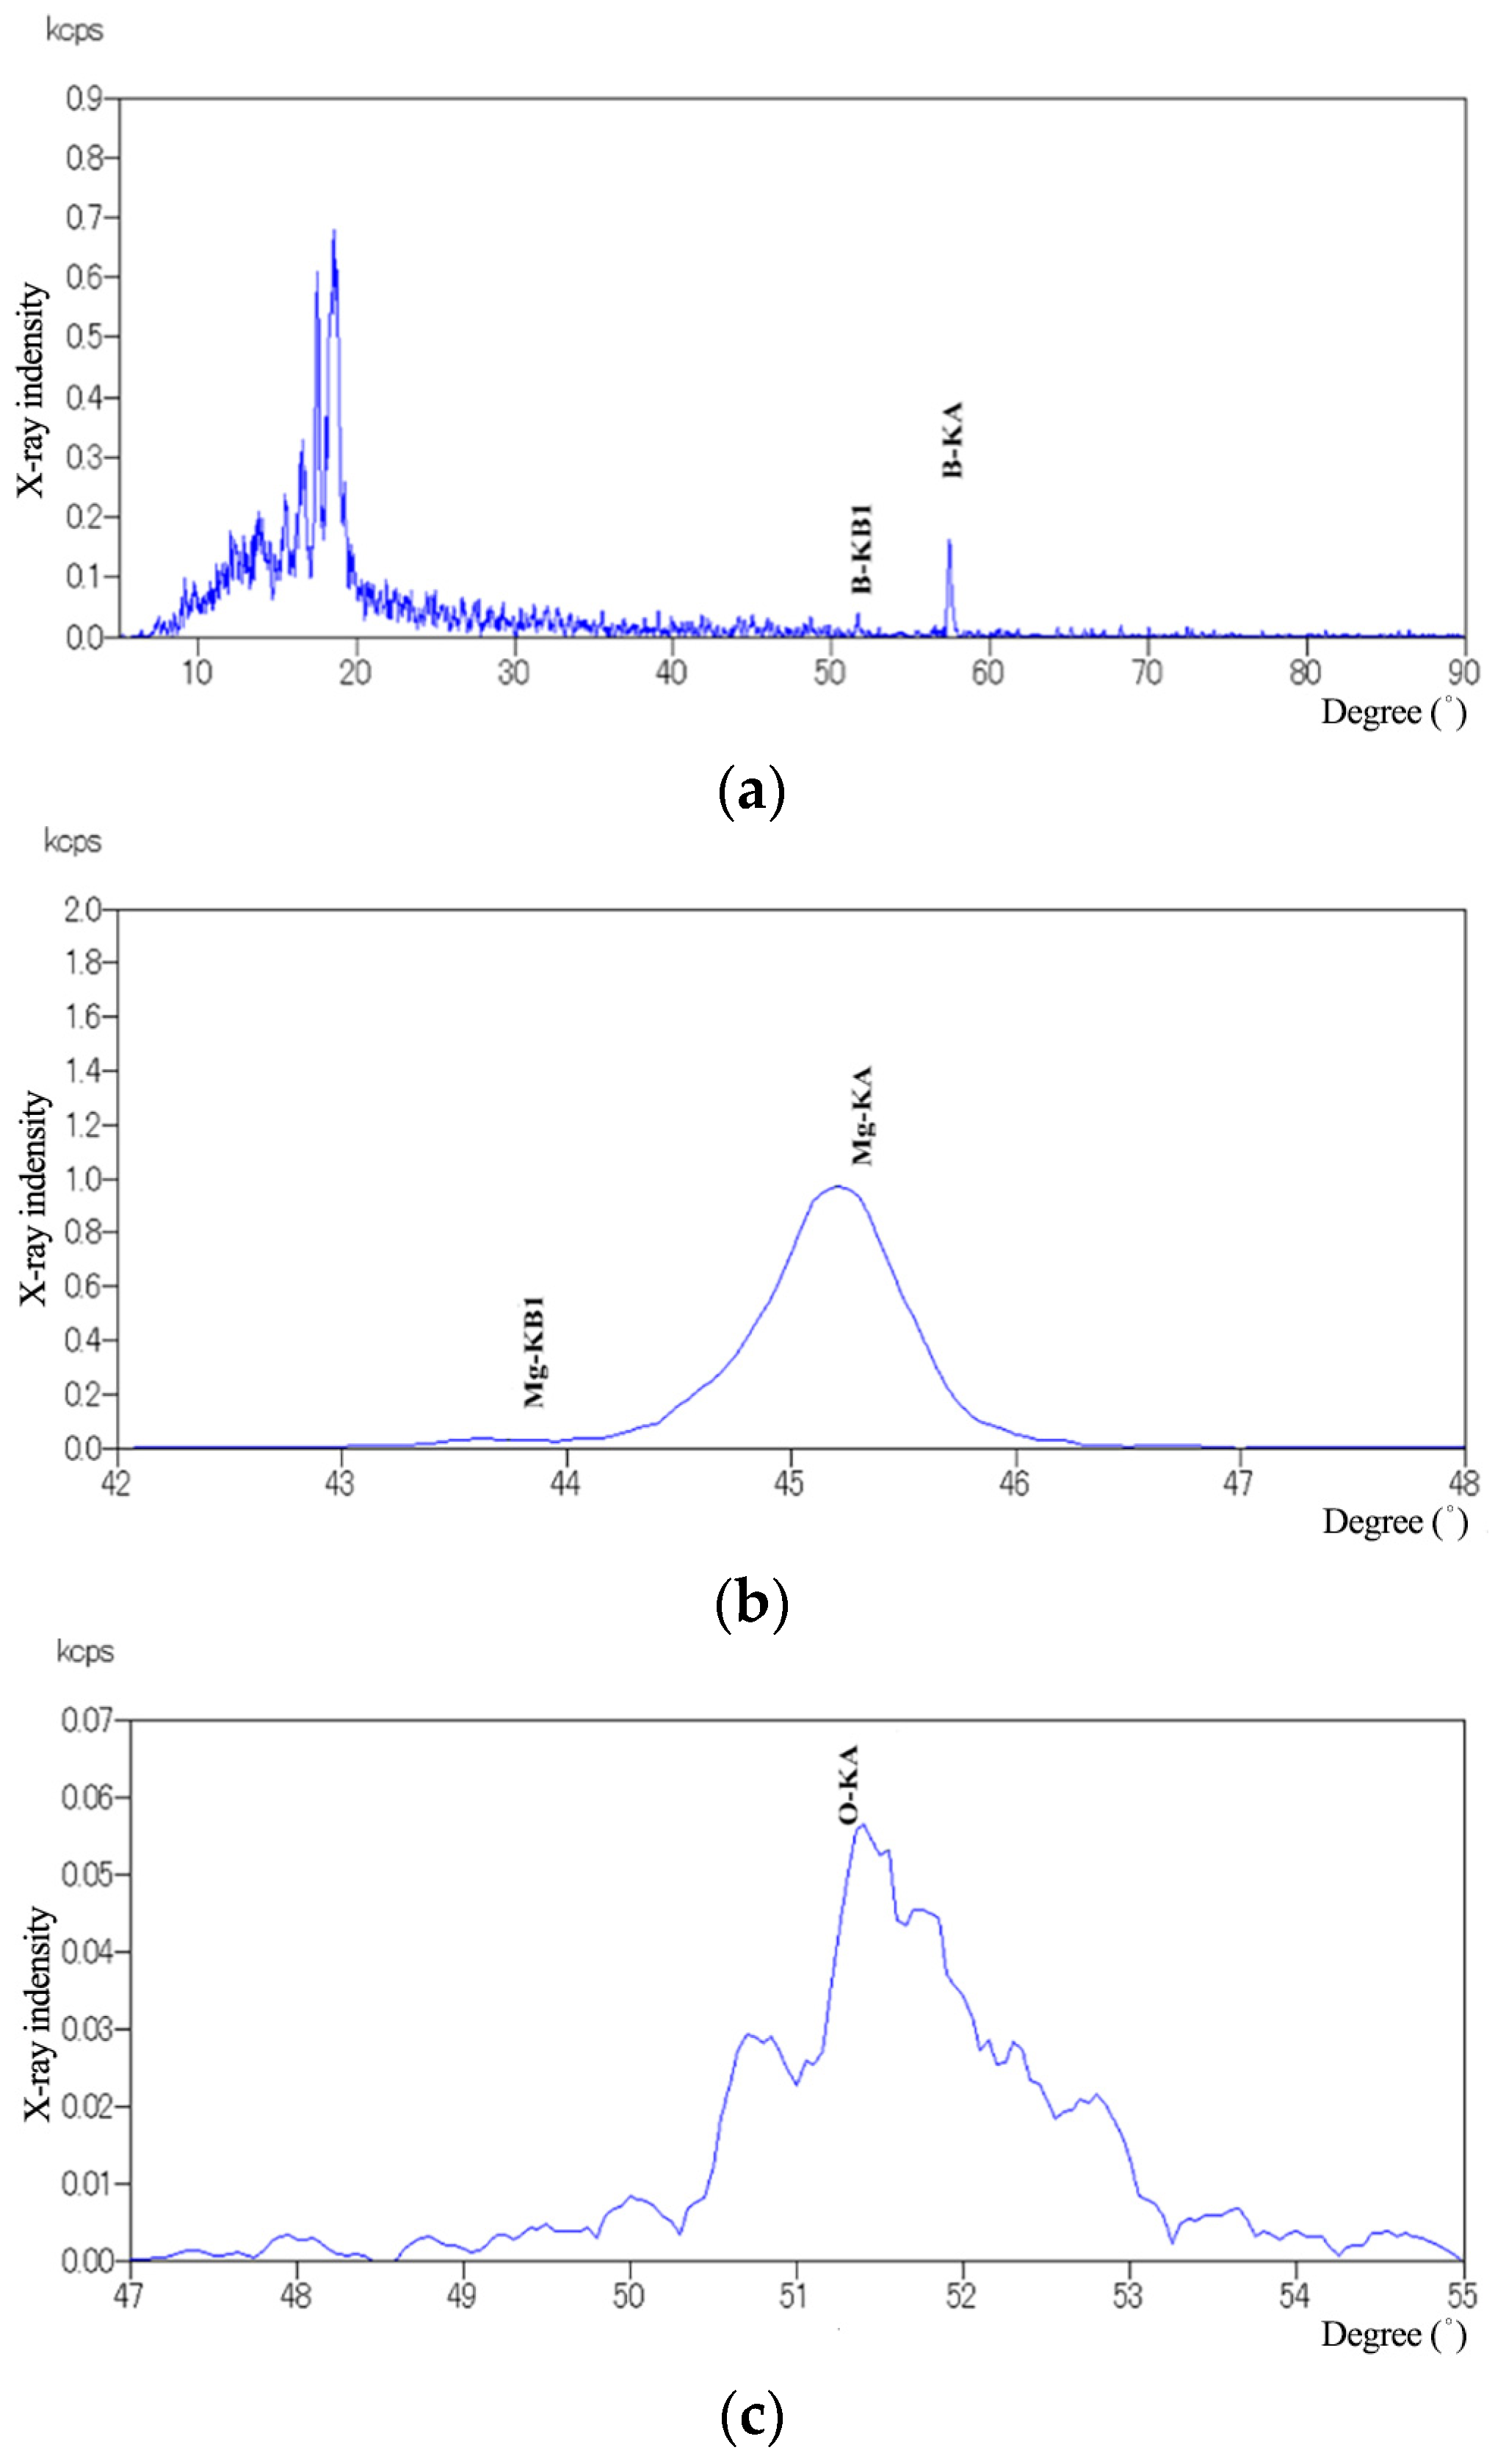
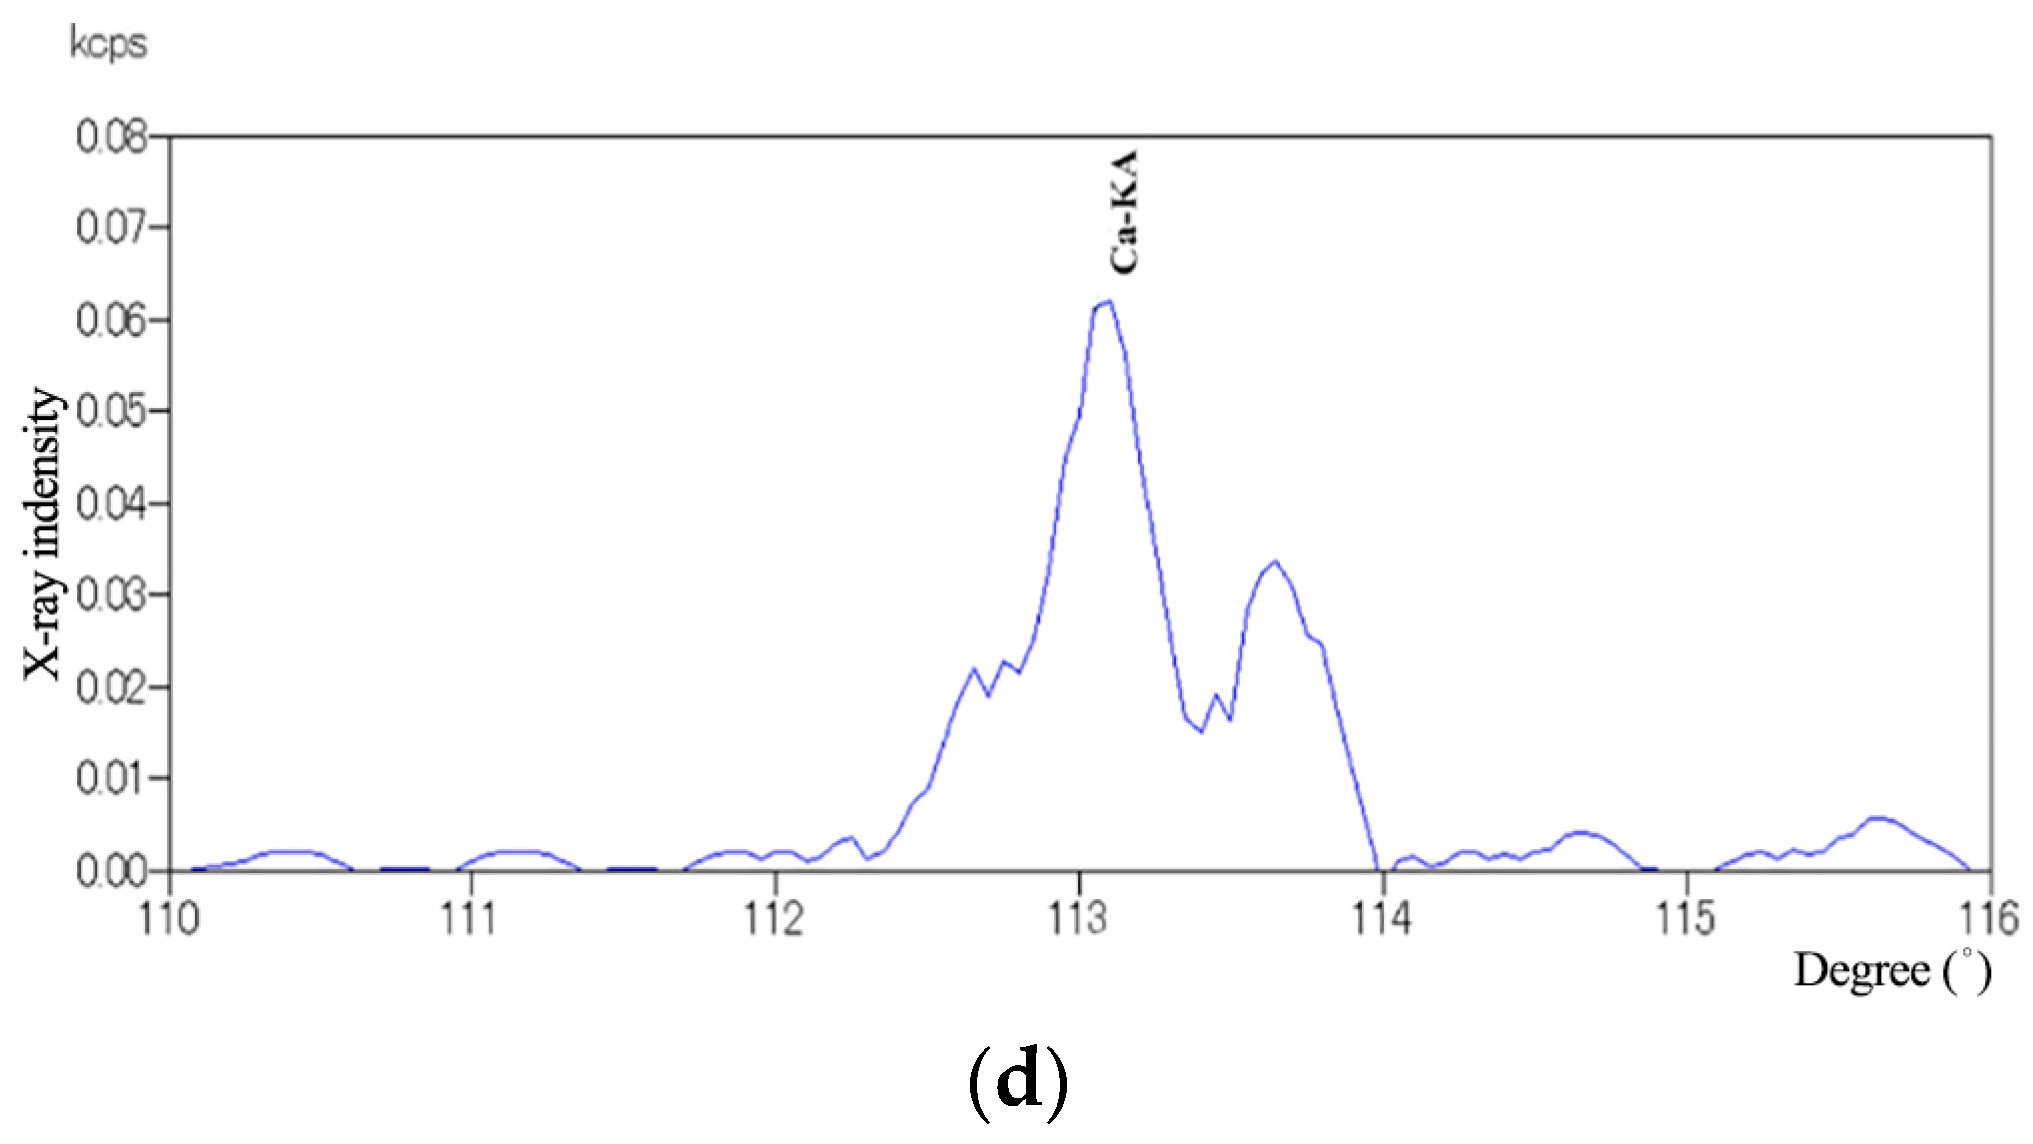
Section 2.1, which is used to confirm the final percentage of each composition (carried on Regaku Corporation ZSX Primus II, Tokyo, Japan). In our research, Kα and Kβ X-ray are both used for analysis, and the identification KA and KB in all figures represent Kα and Kβ X-rays, respectively.
Here, the material A is taken as an example to demonstrate the result of X-ray analysis.
Figure 1 is the power spectrum of the fluorescent X-ray qualitative analysis of composite powder A and shows the X-ray intensity of each element.
As shown in
Figure 1, the peaks of elements such as Mg, B, O, and Ca are clearly displayed, and the amount of added elements is clarified based on the peak intensity of each element.
Table 3 is the analysis results by X-rays for all types of materials.
2.3. Thermal Spray Method and Process
The purpose of this research is to provide a thermal insulation material, with its manufacturing method, that can that be applied to plasma thermal spraying, flame thermal spraying, and form a film with a thermal insulation effect on the surface of the substrate, and to provide a thermal insulation film composed of thermal insulation and the insulation film’s forming method.
In the previous section, the composition and proportion design of the spray powder in this paper are given. The powder can be coated on the substrate by plasma thermal spray (conducted by TAFA model by Praxair Surface Technologies, Indianapolis, IN, USA) and flame thermal spray (carried out on Castolin Eutectic CastoDyn DS8000, Lausanne, Switzerland), forming a layer of heat insulation film on the surface of the substrate, which can achieve excellent heat insulation effect. This section gives the specific operation process of the thermal spraying.
Before thermal spray, treat the surface of the substrate:
Surface cleaning: the surface is cleaned with trichloroethylene solution before prior deposition.
Surface pre-processing: the substrate is polished and cleaned on a grinder, and the corners are rounded.
Surface roughness: The surface of the substrate must have a certain degree of roughness to improve the strength of the coating and the substrate.
Surface preheating: flame is used to preheat the substrate, and the preheating temperature is 100–150 °C.
3. High Temperature Insulation Performance Evaluation
3.1. Experimental Device and Principle
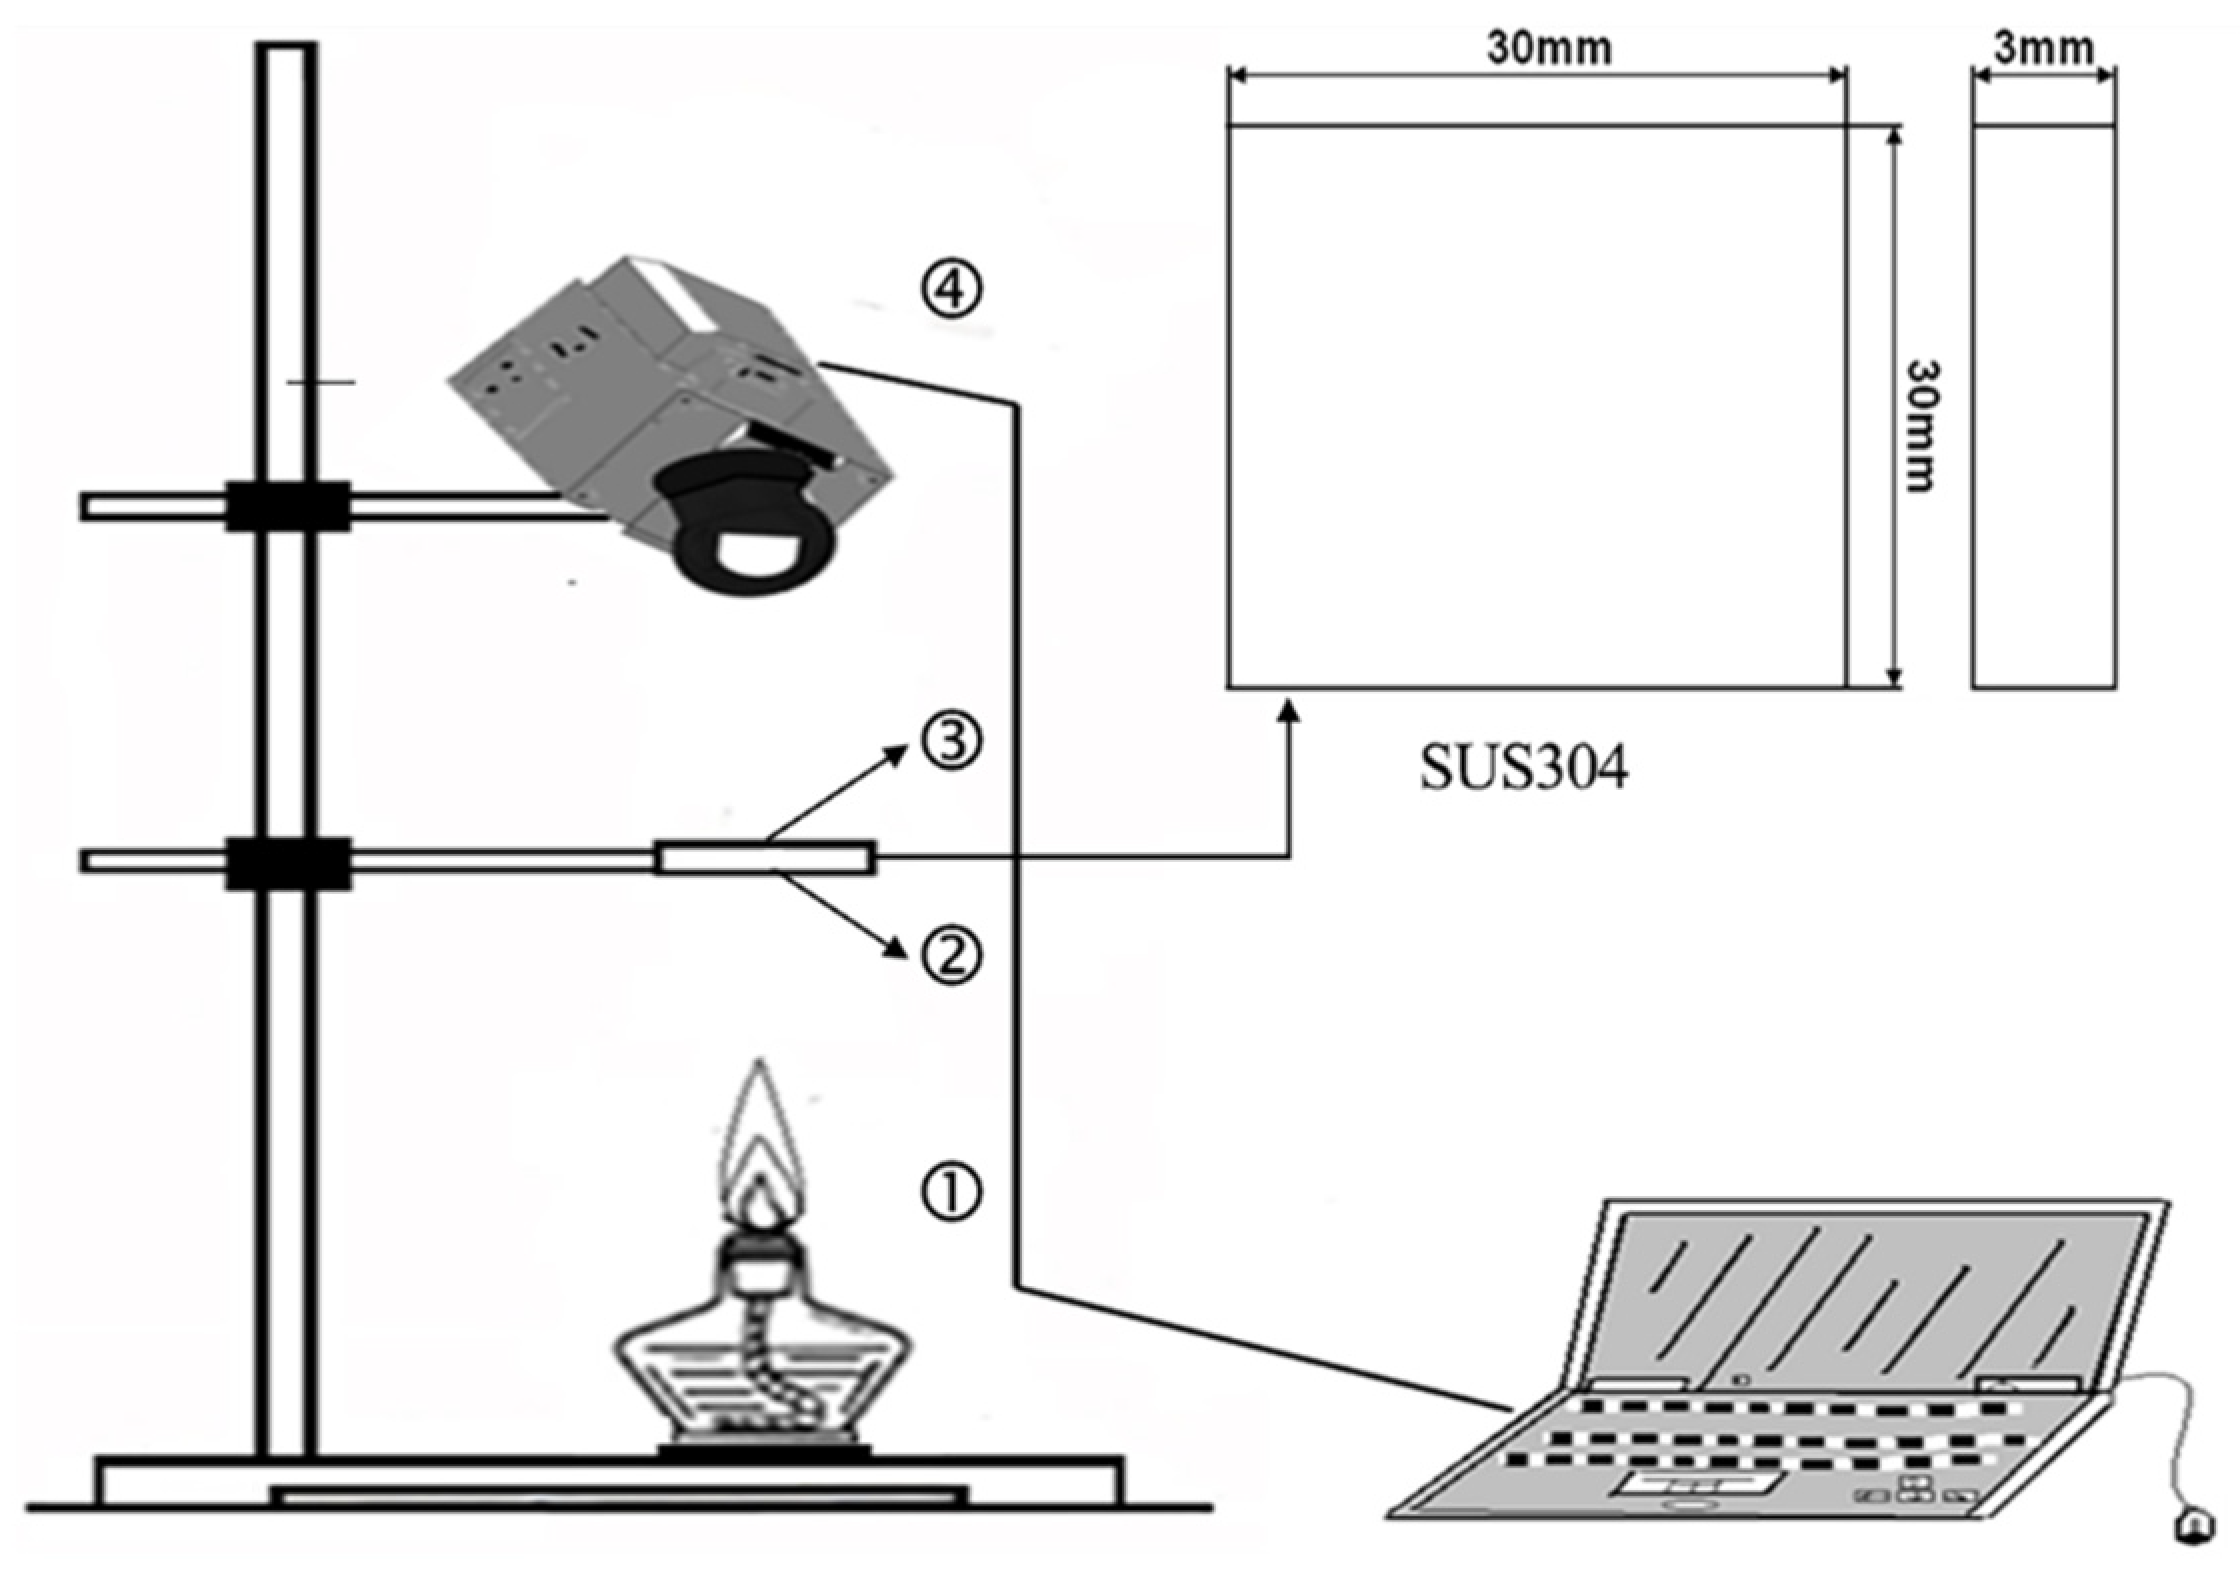
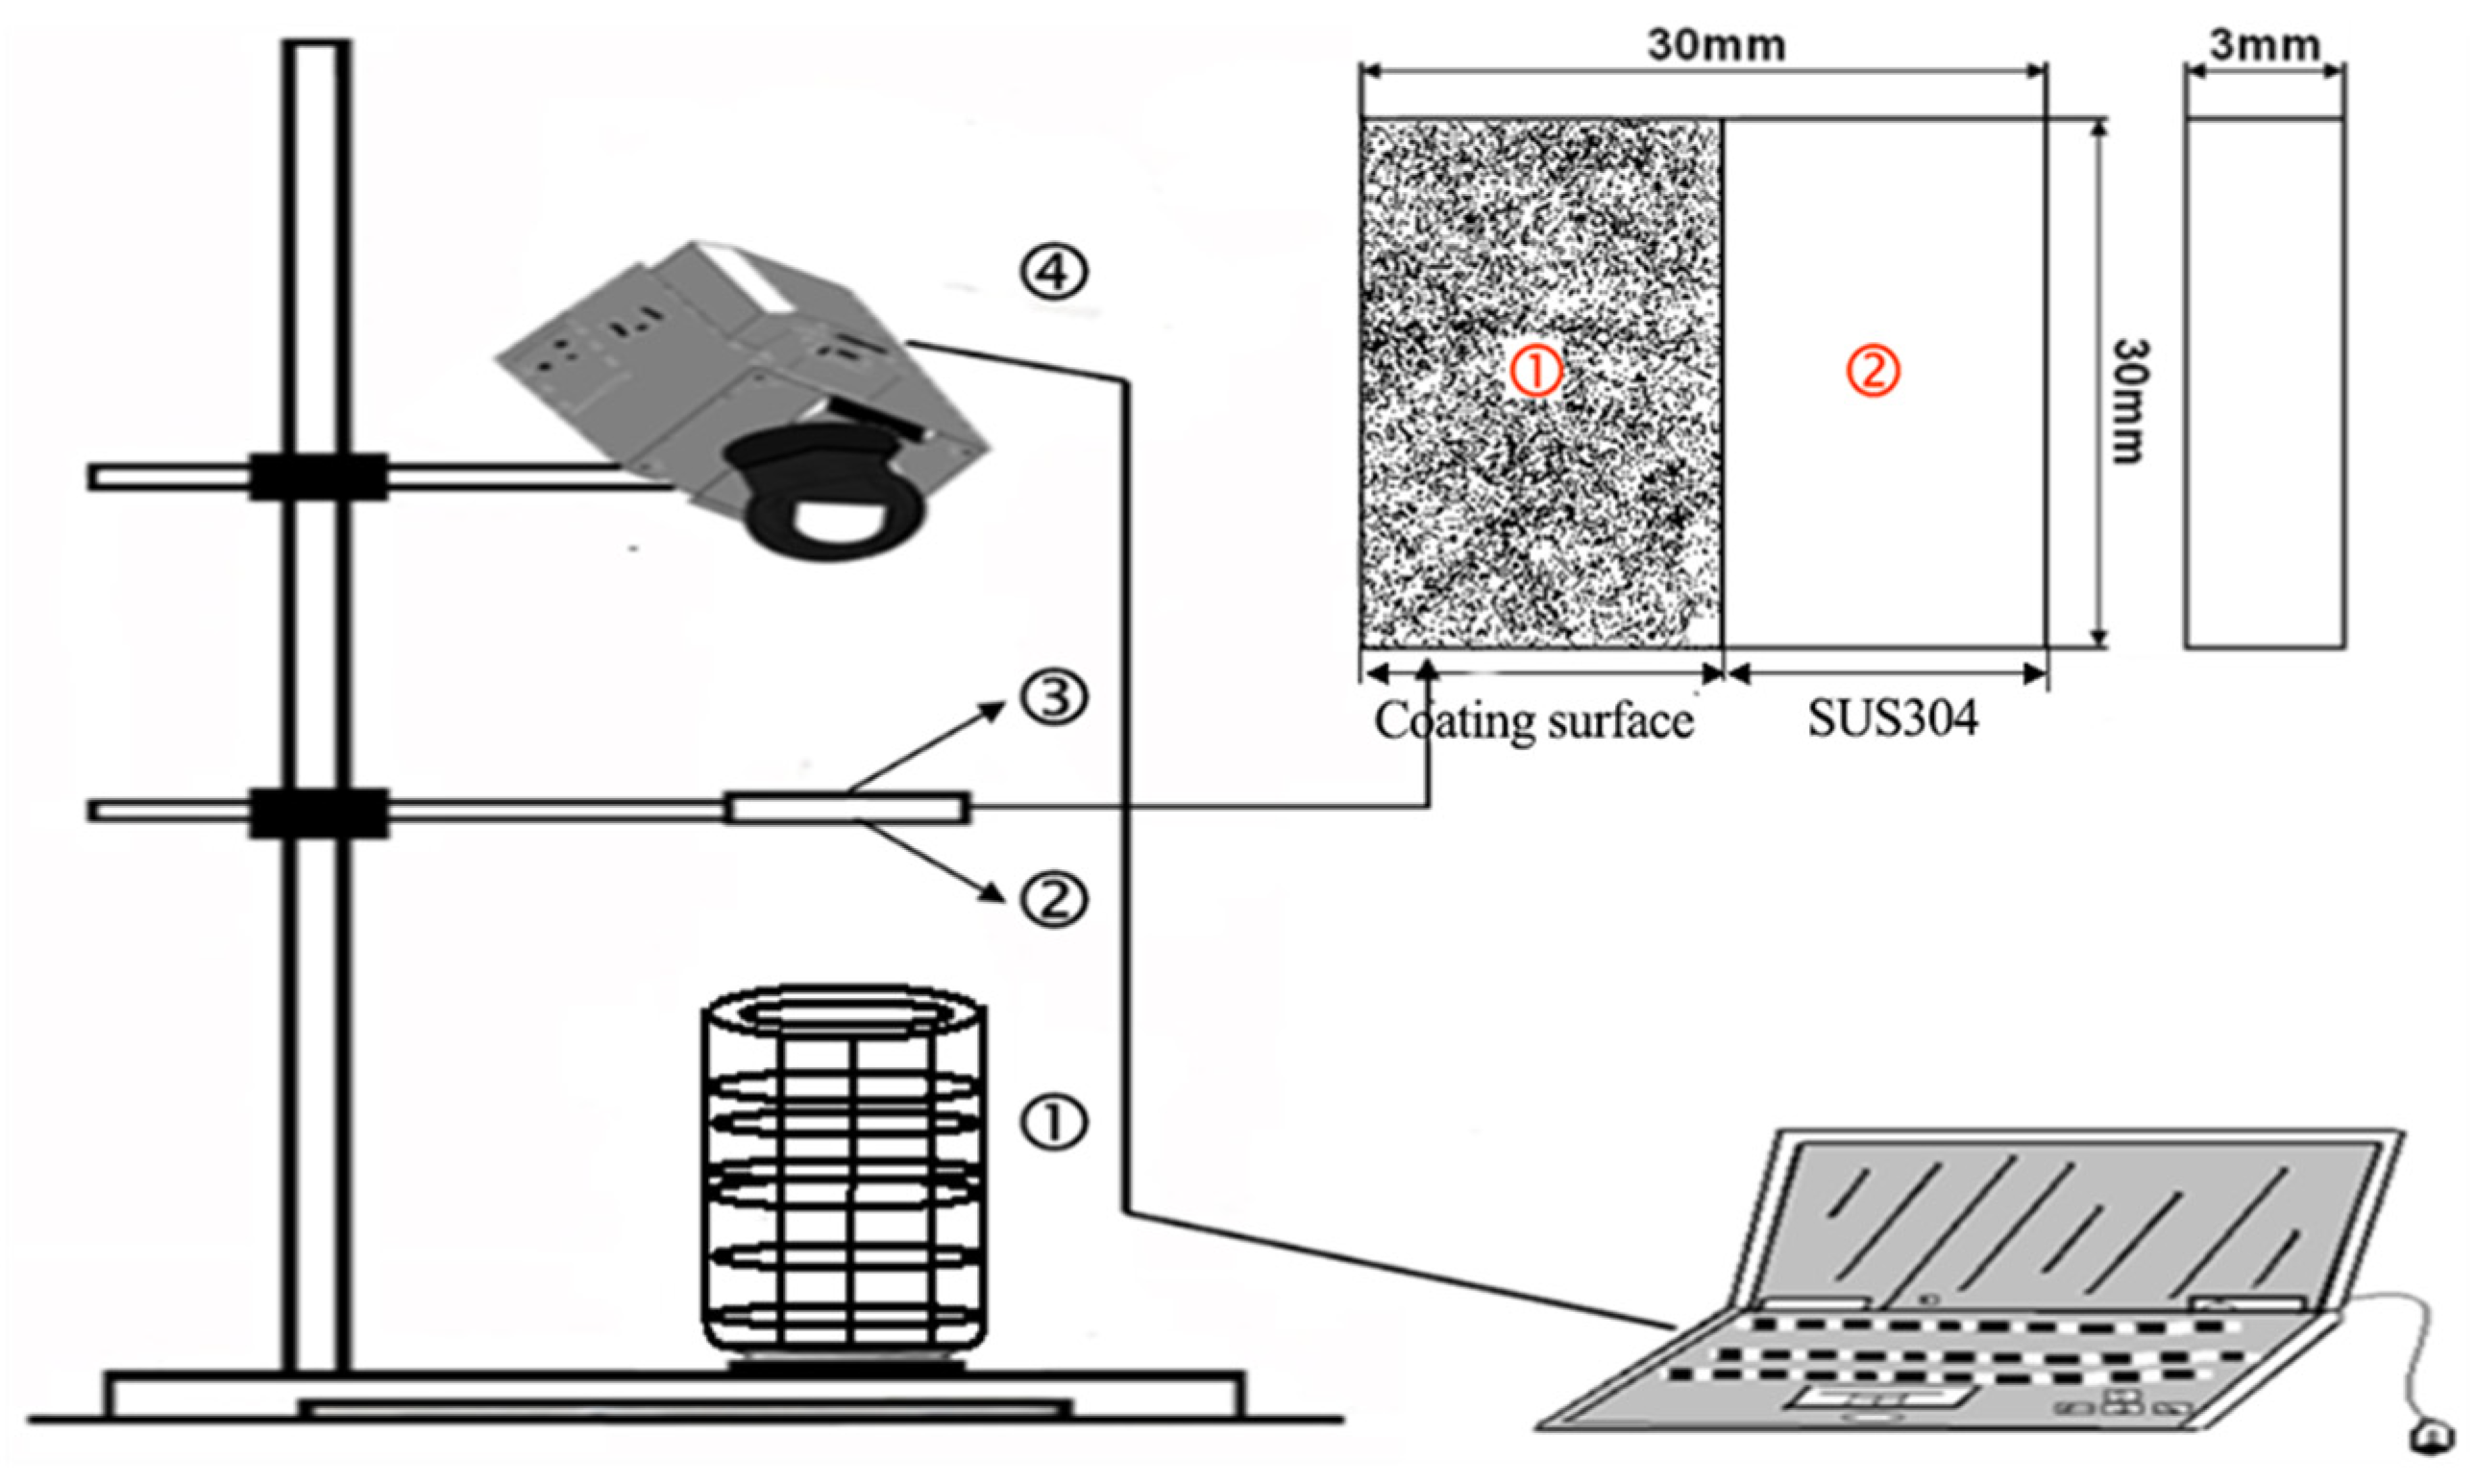
In this study, a heating device is used to heat the center of SUS304 with coating under greenhouse conditions. The heating temperature is about 300 to 400 °C. The flame apex is maintained 5 to 10 cm far from the center of the alloy. Heating continues for 75 min, and vertical photos are taken every 15 min by an infrared thermal instrument (TVS-700, NEC Corporation, Tokyo, Japan) to analyze the temperature changes of the points on the surface and the points on the coated surface based on the heat distribution map.
Figure 2 is the schematic diagram of experiment equipment.
3.2. Experiment Results
3.2.1. Heat Distribution Measurement
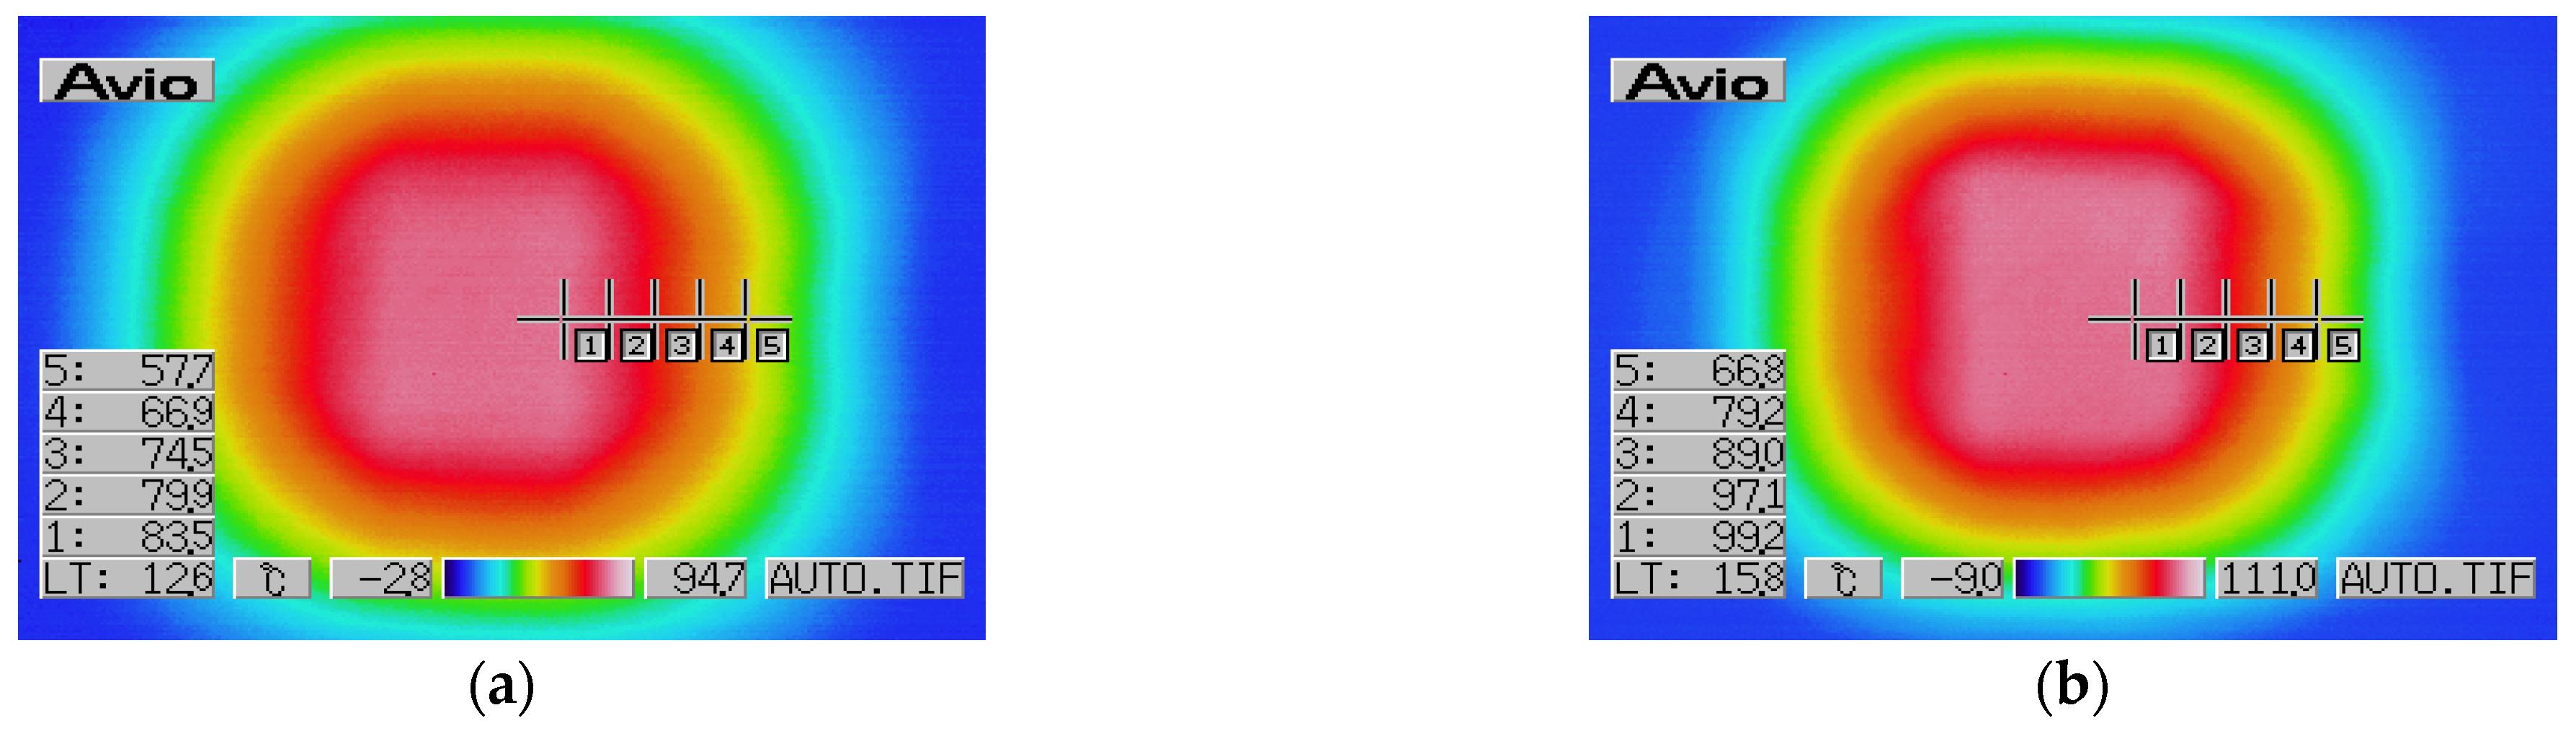
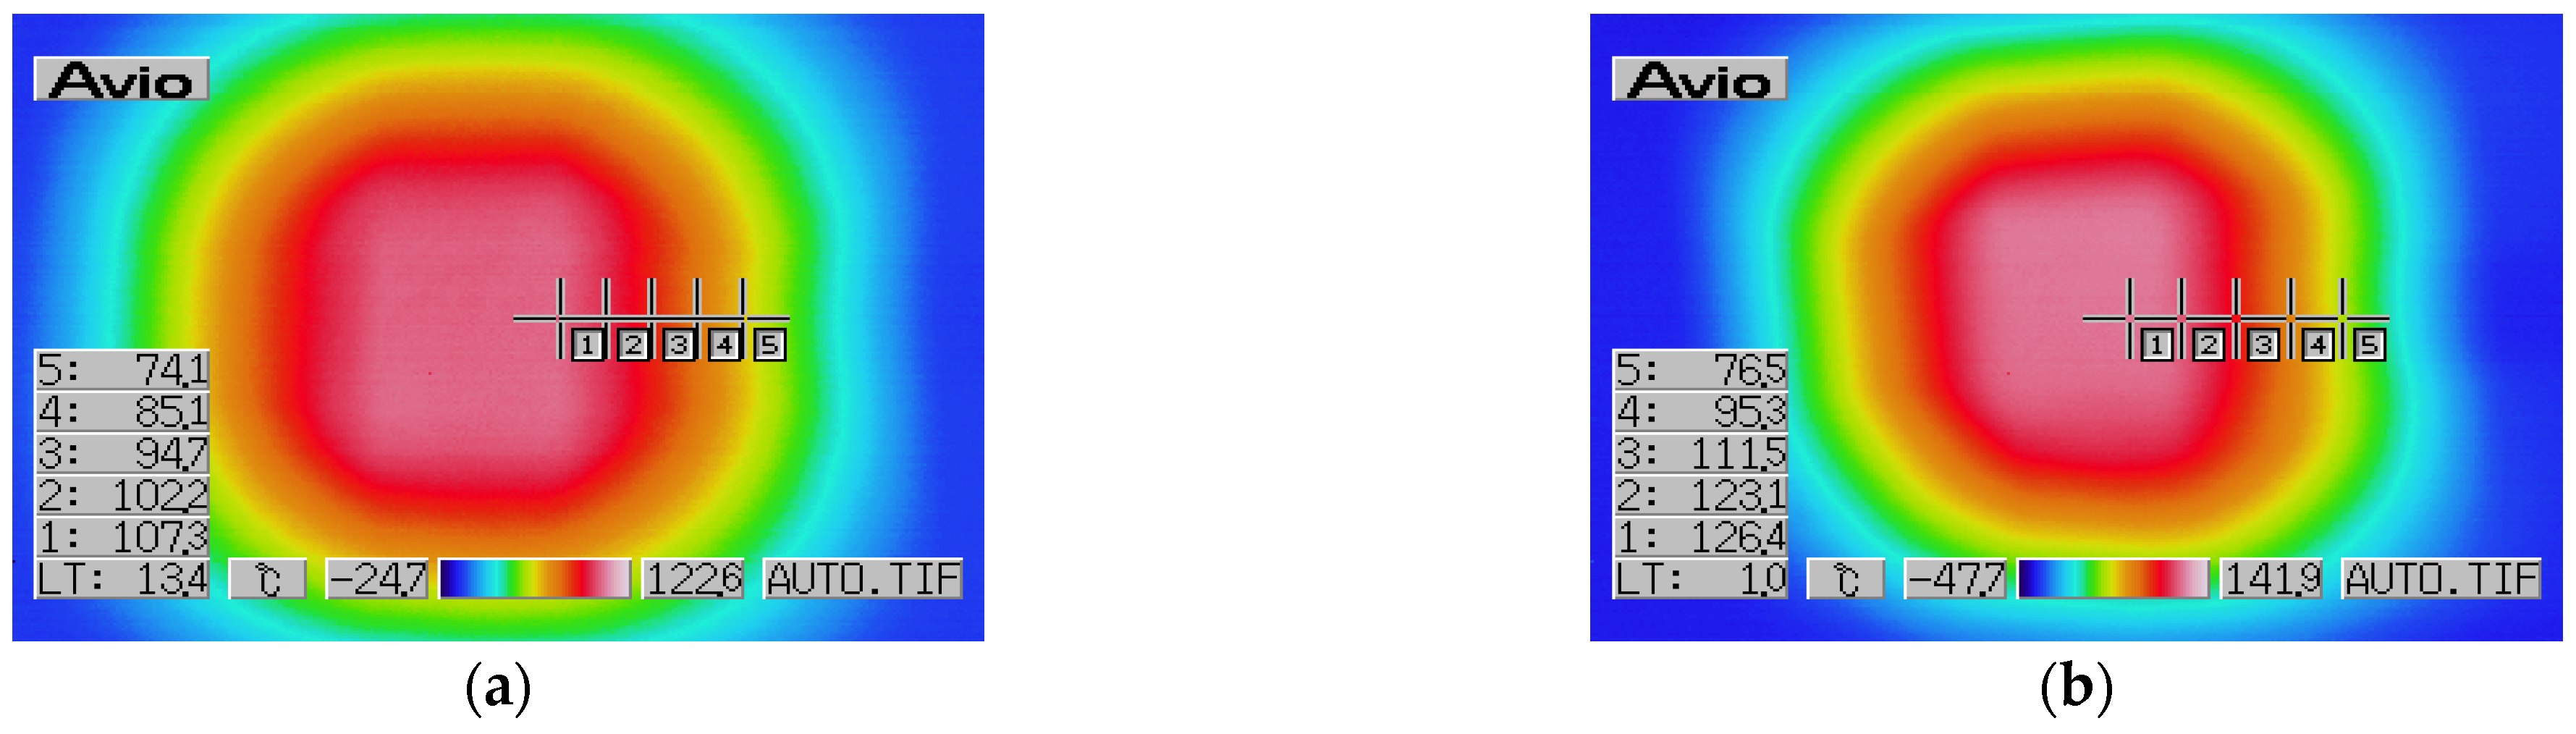
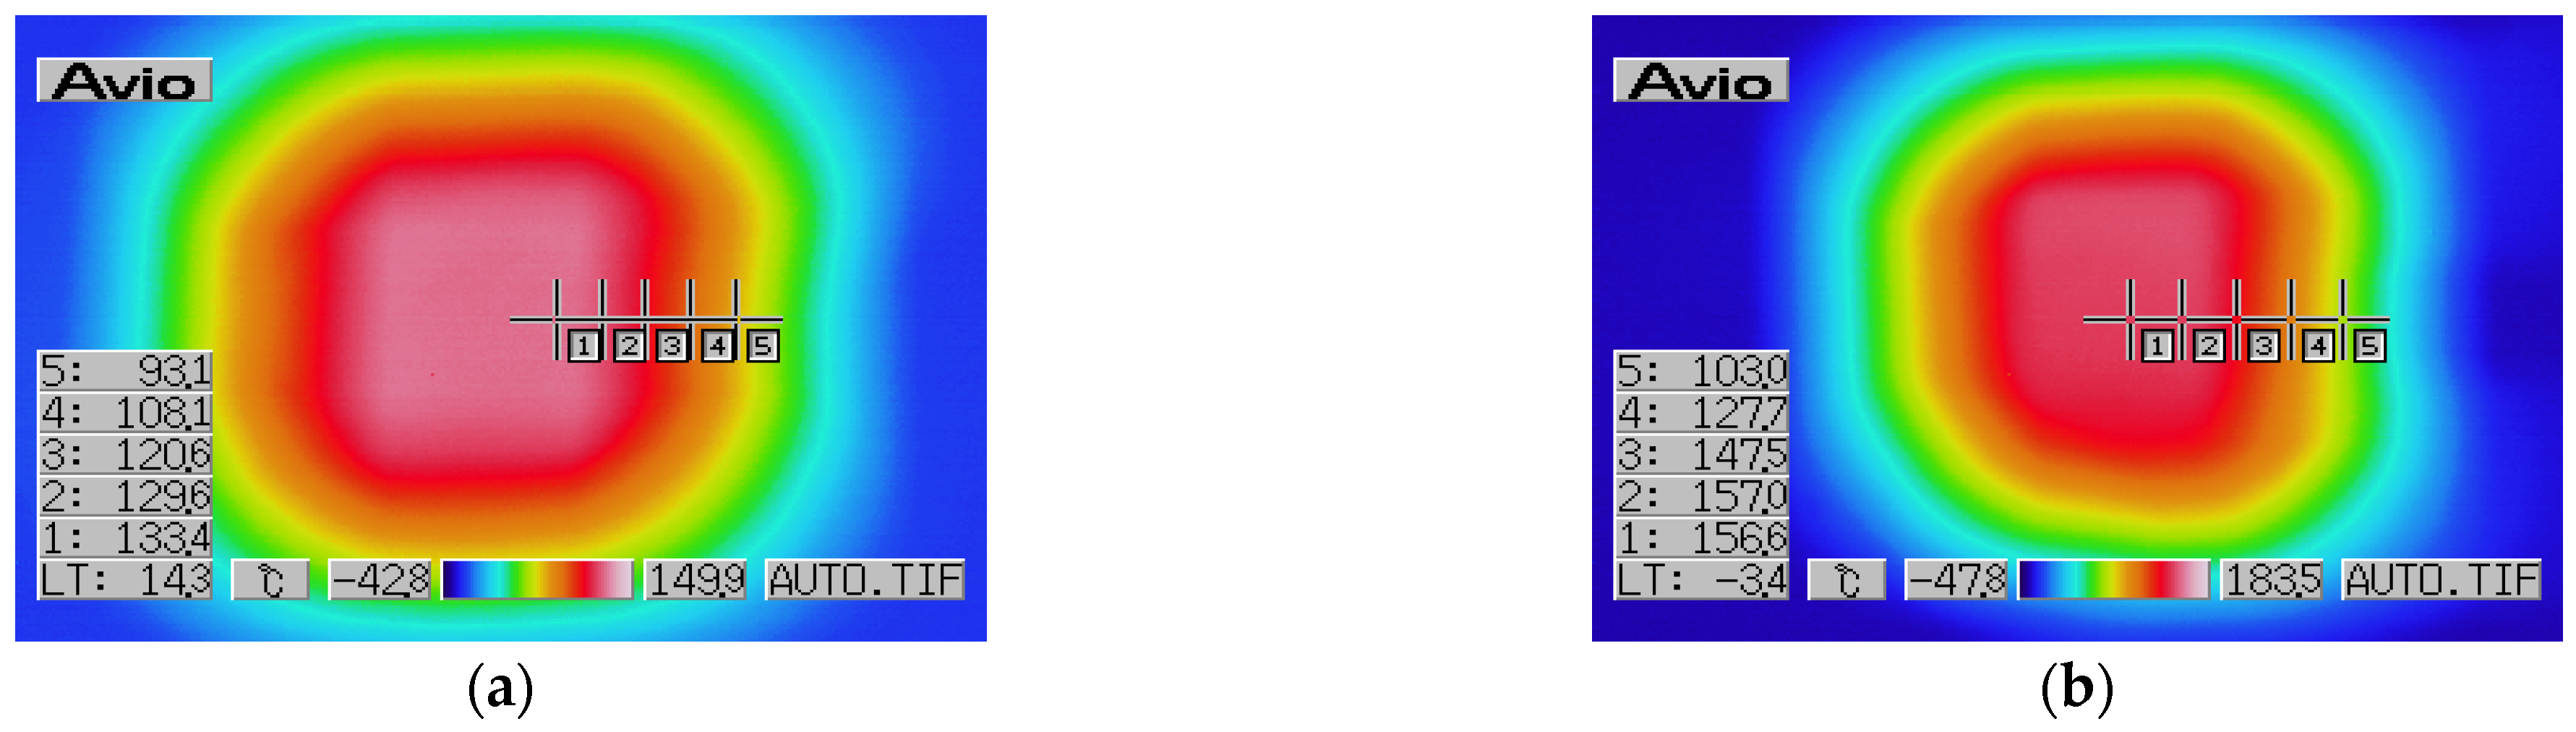
This section takes the A.1 as an example to give the analysis results by the heat distribution diagram for 75 min. Similarly, thermal distribution analysis can be done for all types of materials.
Figure 3,
Figure 4 and
Figure 5 show the heat distribution maps of A.1 at different time.
3.2.2. Analysis of Heat Distribution Results
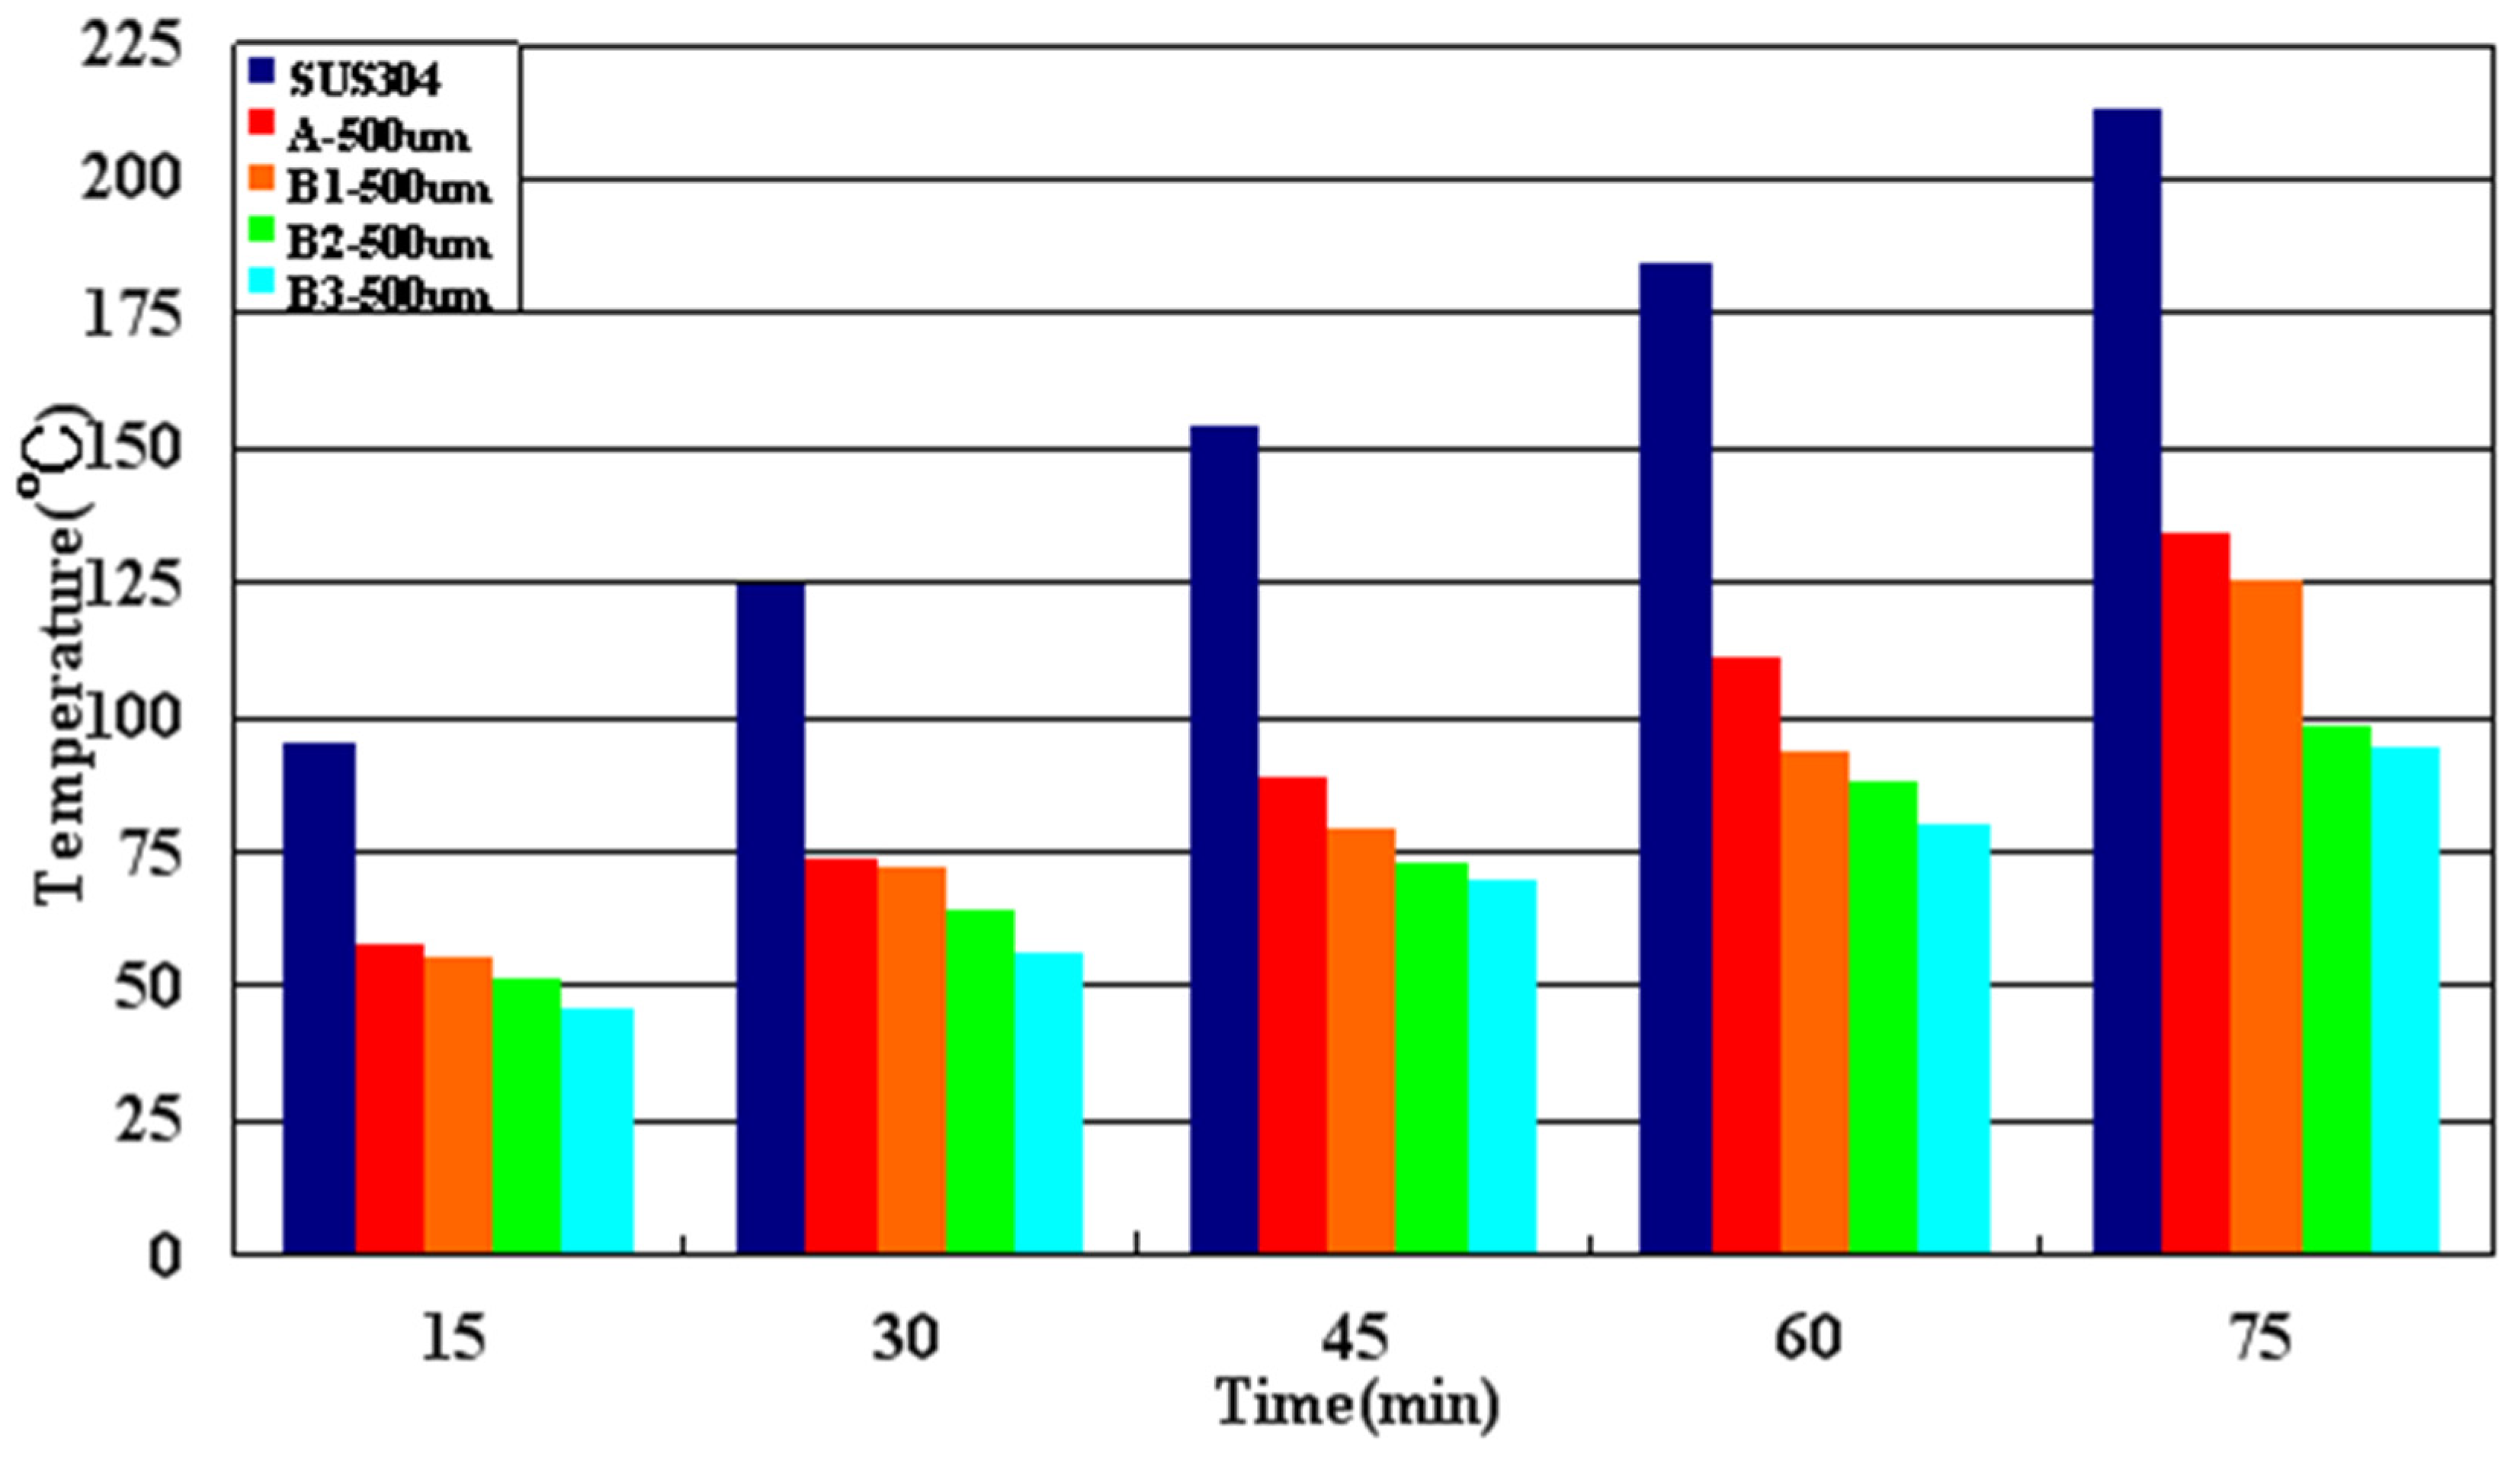
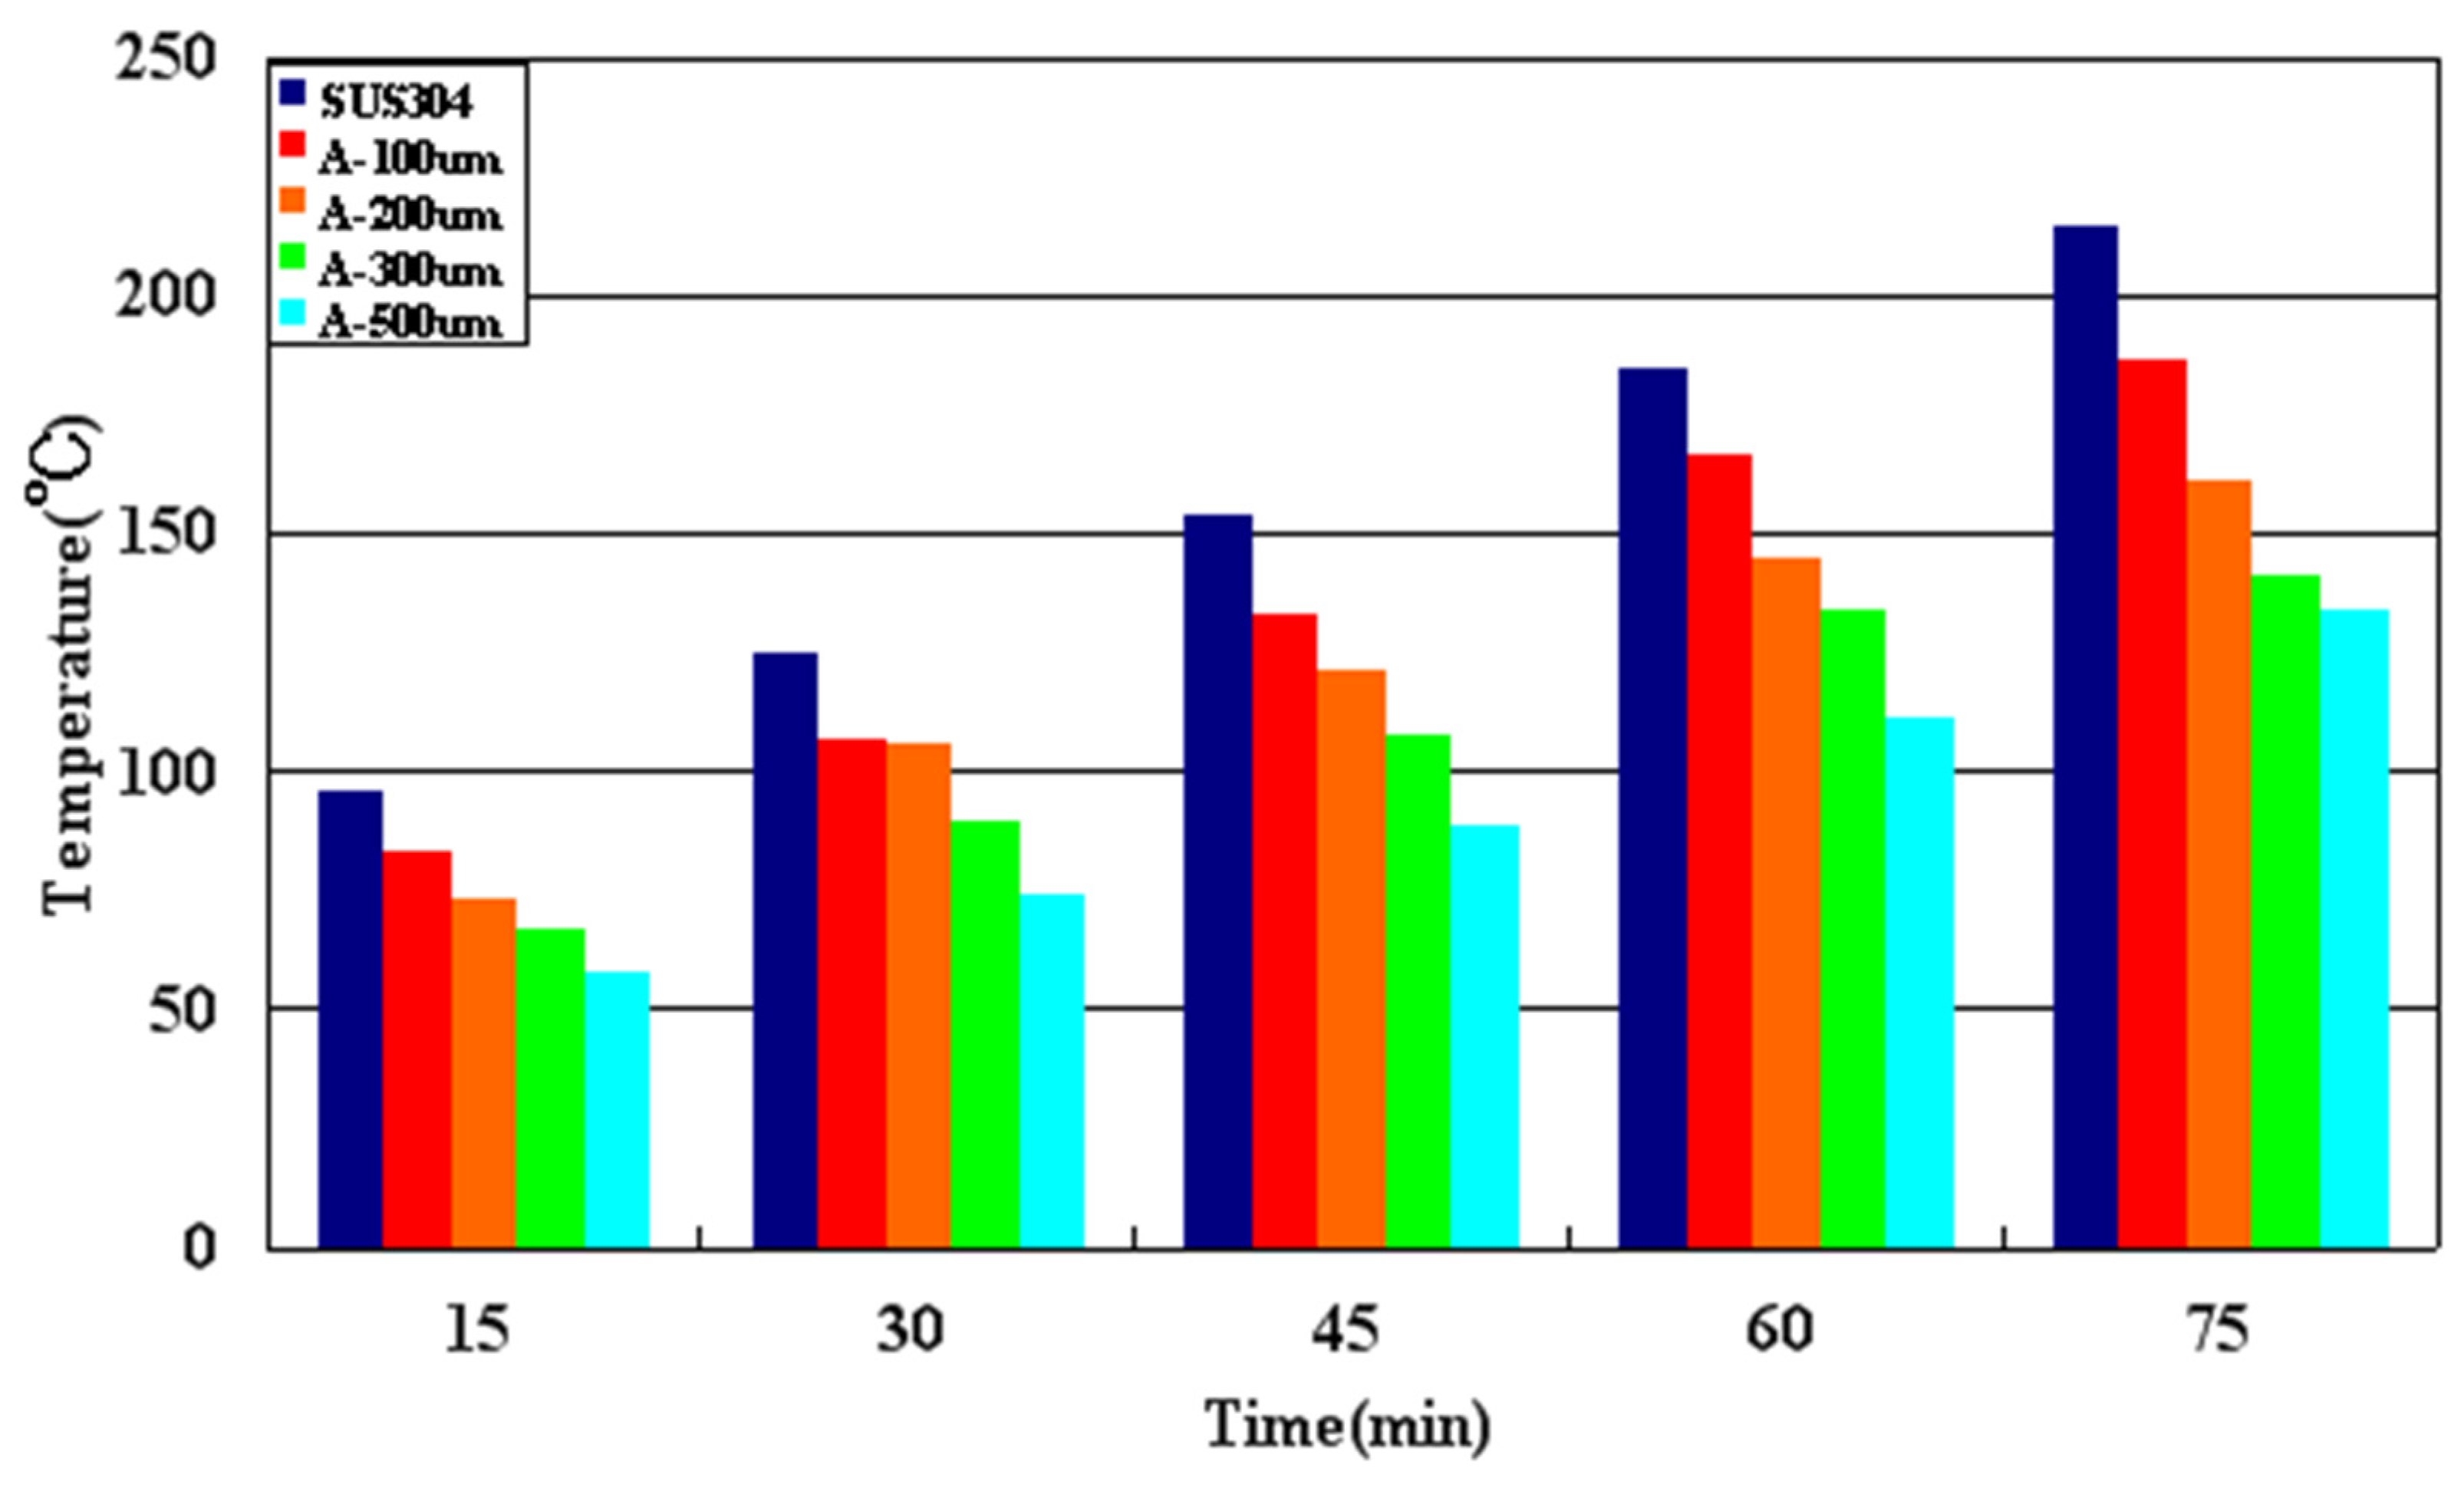
According to the analysis of the heat distribution, the temperature changes in the high temperature environment can be compared for the different thermal spray layer thicknesses of each composition. Firstly, the high-temperature thermal insulation performance analysis of A is given in
Figure 6.
According to
Figure 6 and
Table 4, A.4 has the best high temperature insulation performance when the thickness is 500 μm. The temperature change is 58.1–134 °C, and the temperature difference change is 35.7–75.8 °C.
Similarly, all type B material are also analyzed for 75 min to observe surface temperature. The data are summarized in
Table 5.
Take the best thickness of the above four types of thermal spray powders as 500 μm, and compare their high-temperature thermal insulation performance as shown in
Figure 7.
4. Low Temperature Insulation Performance Evaluation
4.1. Experimental Device and Principle
In this study, a heating device is used to heat the performance of C under greenhouse conditions. The heating temperature is about 100 °C, and the center of SUS304 is heated persistently. The measurement method and principles in low temperature experiments are similar to those in high temperature experiments. The flame apex is maintained 5 to 10 cm far from the center of the alloy. Heating continues for 75 min, and vertical photos are taken every 15 min by an infrared thermal instrument to analyze the temperature changes of the points on the surface and the points on the coated surface based on the heat distribution map.
Figure 8 is the schematic diagram of experiment equipment.
4.2. Experimental Results
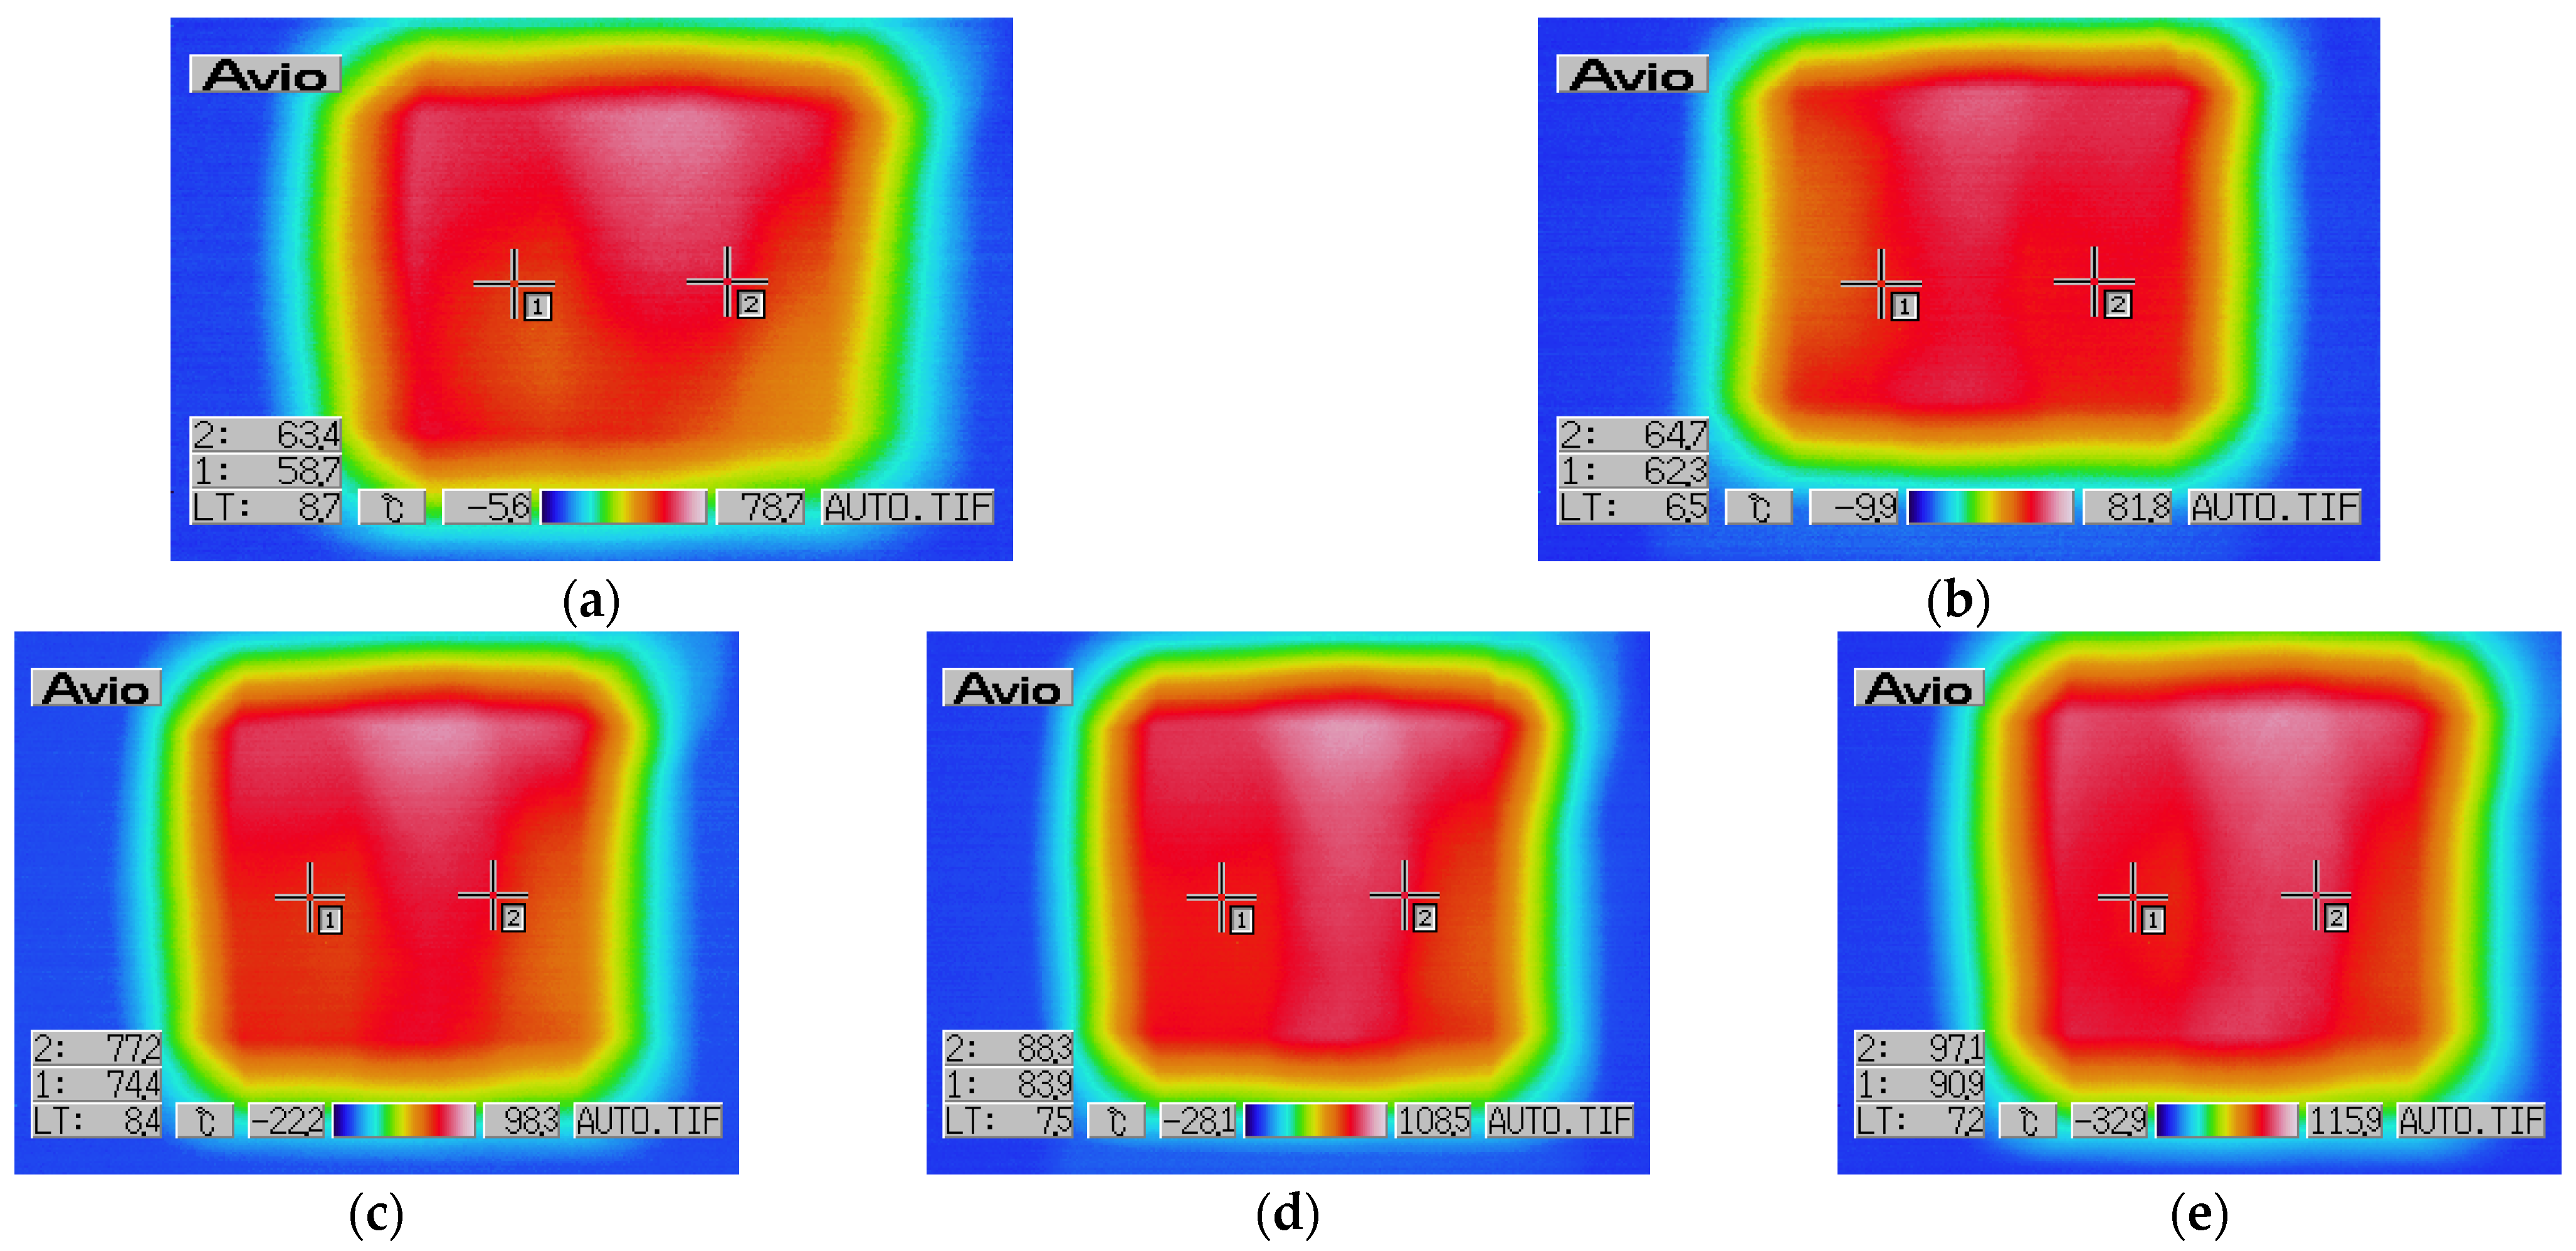
4.2.1. Heat Distribution Measurement
The thermal insulation performance analysis of C1 with 100 μm thickness is given as an example in
Figure 9.
4.2.2. Analysis of Heat Distribution Results
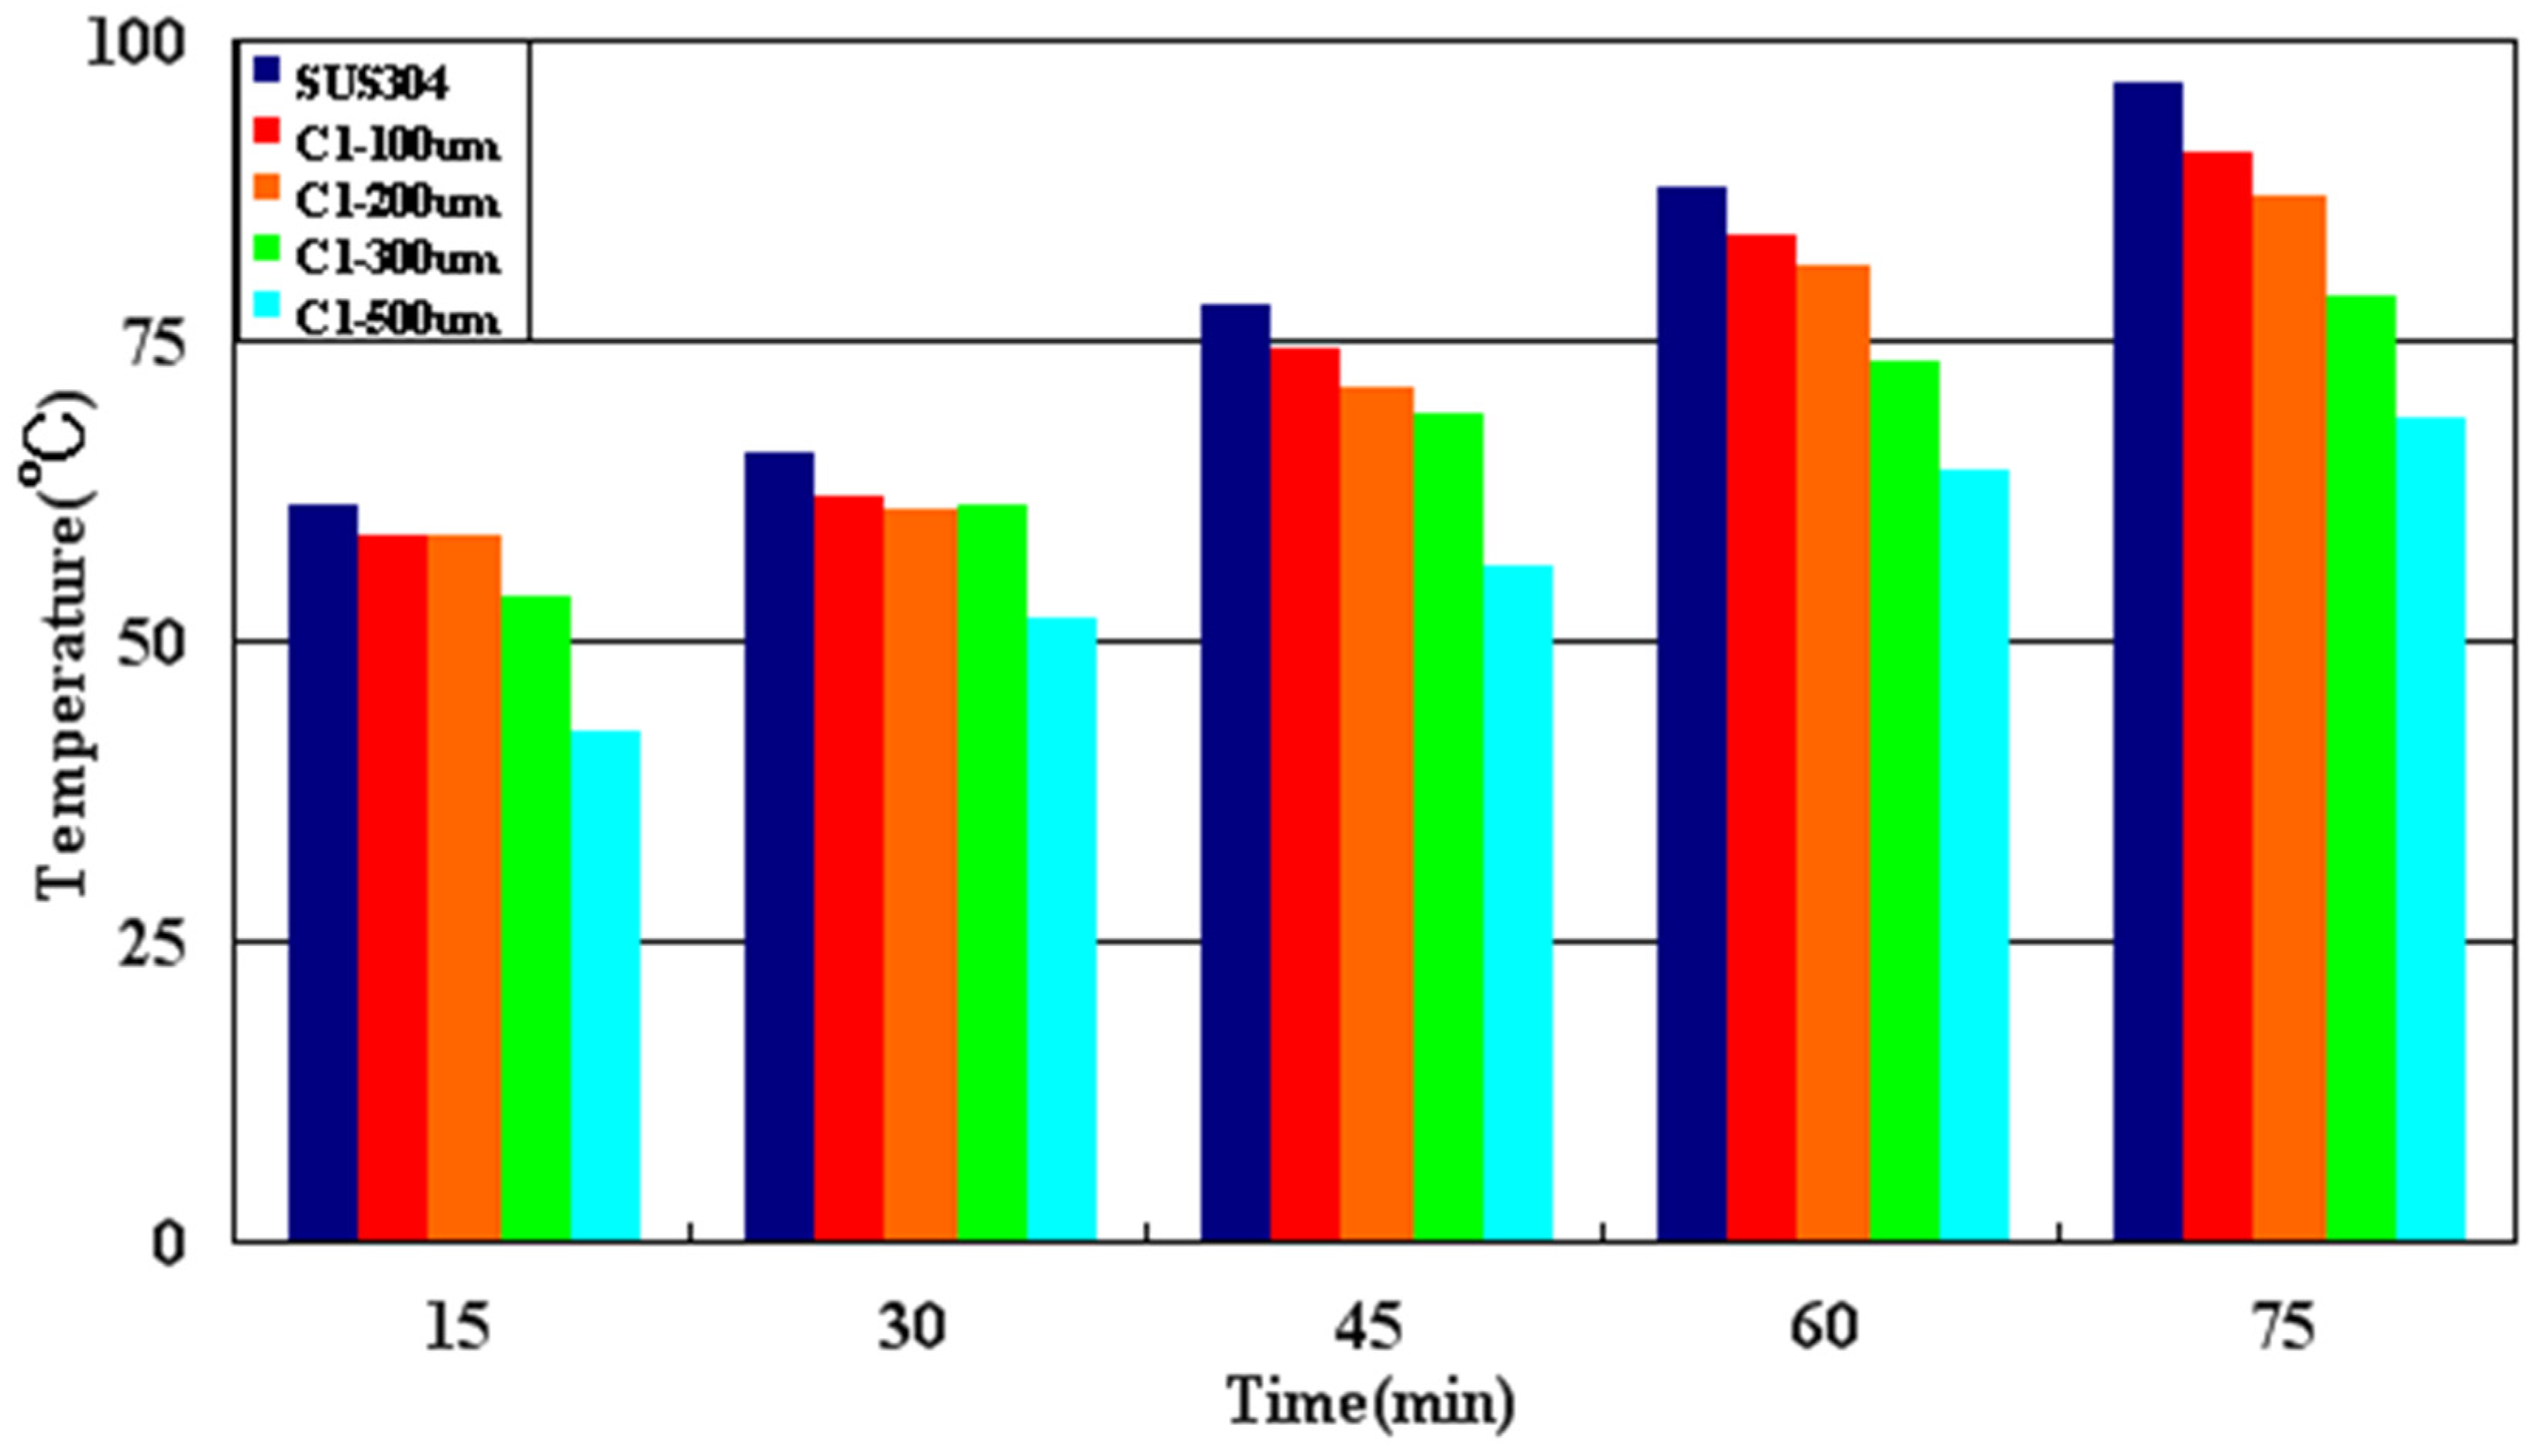
According to the analysis of the heat distribution, the temperature changes in the high temperature environment can be compared for the different thermal spray layer thicknesses of each composition. Firstly, the high-temperature thermal insulation performance analysis of C1 is given in
Figure 6.
According to
Figure 10 and
Table 6, C1.4 has the best low temperature insulation performance when the thickness is 500 μm. The temperature change is 42.6–68.6 °C. The temperature difference is 18.5–26.4 °C.
Similarly, all types of C material are also analyzed for 75 min to observe surface temperature. The data are summarized in
Table 7.
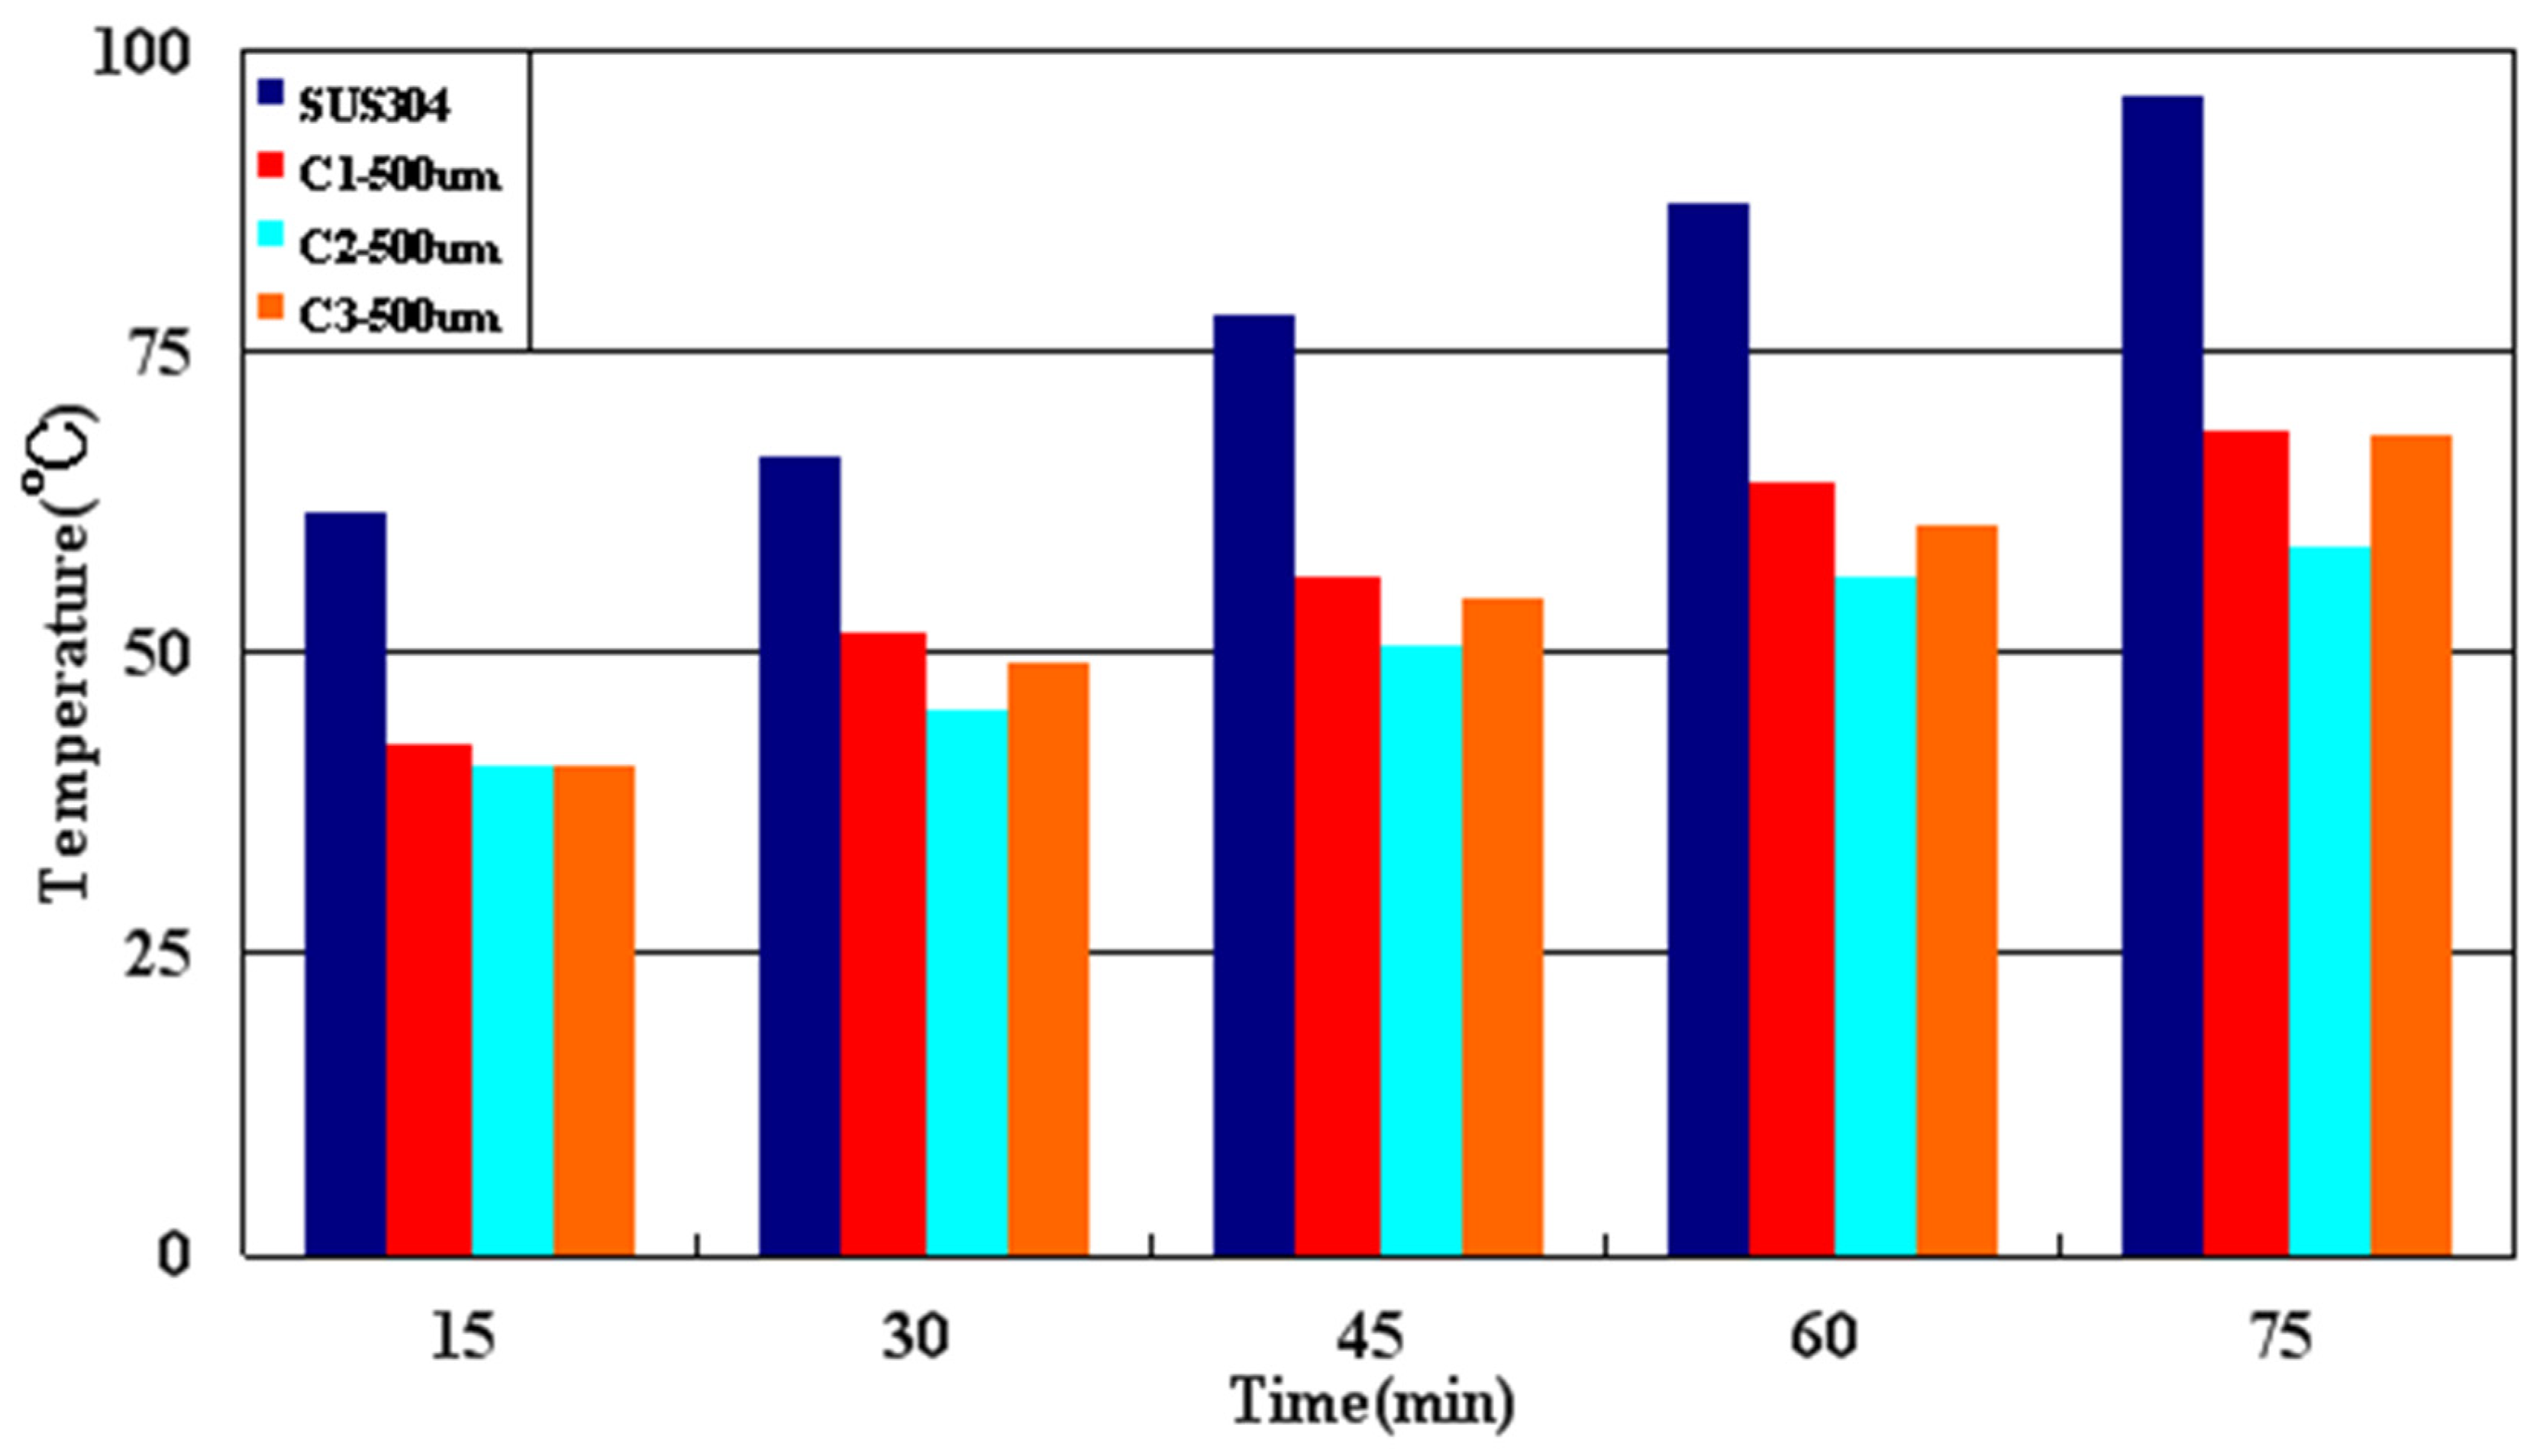
Take the best thickness of the above three types of thermal spray powders as 500 μm, and compare their low-temperature thermal insulation performance as shown in
Figure 11.
5. Conclusions
In this paper, based on substrate material SUS304, MgO-B2O3-Zn, and MgO-B2O3-SiO2-Zn coatings are designed by plasma and flame thermal spray, which are used to suppress heat dissipation of high-temperature parts. It is found in the experements that the best condition for the high temperature insulation performance comes from B3 at 500 μm, and the low temperature insulation performance comes from C2 at 500 μm.
By comparing the thermal images of coatings with different compositions, on the one hand, coating MgO-B2O3-Zn has significant performance under high temperature, and its performance grows along with the increase of Zn. On the other hand, in MgO-B2O3-SiO2-Zn, SiO2 also helps insulate heat conduction significantly, and the best percentage is 30%. However, the effect from SiO2 is limited, and more and less SiO2 both have a negative effect on heat insulation. Besides that, thermal insulation also grows along with the film thickness increases.
Author Contributions
Conceptualization, Z.Y.; Data curation, Y.S.; Formal analysis, P.M.; Methodology, D.J.; Software, Y.D.; Validation, W.F.; Writing—original draft, B.S.; Writing—review and editing, E.G. All authors have read and agreed to the published version of the manuscript.
Funding
This research received no external funding.
Institutional Review Board Statement
Not applicable.
Informed Consent Statement
Not applicable.
Data Availability Statement
Data sharing not applicable.
Conflicts of Interest
The authors declare no conflict of interest.
References
- Barbezat, G. Advanced thermal spray technology and coating for lightweight engine blocks for the automotive industry. Surf. Coat. Technol. 2005, 200, 1990–1993. [Google Scholar] [CrossRef]
- Xu, B.S. The remanufacturing engineering and automatic surface engineering technology. Key Eng. Mater. 2008, 373–374, 1–10. [Google Scholar] [CrossRef]
- Kuroda, S.; Watanabe, M.; Kim, K.H.; Katanoda, H. Current status and future prospects of warm spray technology. J. Therm. Spray Technol. 2011, 20, 653–676. [Google Scholar] [CrossRef] [Green Version]
- Burakowski, T.; Wierzchon, T. Surface Engineering of Metals: Principles, Equipment, and Technologies; CRC Press: Boca Raton, FL, USA, 1998. [Google Scholar]
- Singh, H.; Sidhu, B.S.; Puri, D.; Prakash, S. Use of plasma spray technology for deposition of high temperature oxidation/corrosion resistant coatings—A review. Mater. Corros. 2007, 58, 92–102. [Google Scholar] [CrossRef]
- Aneja, V.P.; Arya, S.P.; Kim, D.S.; Rumsey, I.C.; Arkinson, H.L.; Semunegus, H.; Bajwa, K.S.; Dickey, D.A.; Stefanski, L.A.; Todd, L.; et al. Characterizing ammonia emissions from swine farms in eastern north carolina: Part 1—Conventional lagoon and spray technology for waste treatment. J. Air Waste Manag. Assoc. 2008, 58, 1130–1144. [Google Scholar] [CrossRef] [PubMed] [Green Version]
- Si, Y.; Wang, X.; Dou, L.; Yu, J.; Ding, B. Ultralight and fire-resistant ceramic nanofibrous aerogels with temperature-invariant superelasticity. Sci. Adv. 2018, 4, eaas8925. [Google Scholar] [CrossRef] [PubMed] [Green Version]
- Dou, L.; Zhang, X.; Cheng, X.; Ma, Z.; Ding, B. Hierarchical cellular structured ceramic nanofibrous aerogels with temperature-invariant superelasticity for thermal insulation. ACS Appl. Mater. Interfaces 2019, 11, 29056–29064. [Google Scholar] [CrossRef] [PubMed]
- Wang, H.; Xuan, Z.; Ning, W.; Li, Y.; Wu, H. Ultralight, scalable, and high-temperature-resilient ceramic nanofiber sponges. Sci. Adv. 2017, 3, e1603170. [Google Scholar] [CrossRef] [PubMed] [Green Version]
- Dou, L.; Cheng, X.; Zhang, X.; Si, Y.; Yu, J.; Ding, B. Temperature-invariant superelastic, fatigue resistant, and binary-network structured silica nanofibrous aerogels for thermal superinsulation. J. Mater. Chem. A 2020, 8, 7775–7783. [Google Scholar] [CrossRef]
- Huang, X.J.; Sun, J.H.; Jie, J.I.; Zhang, Y.; Wang, Q.S.; Zhang, Y. Flame spread over the surface of thermal insulation materials in different environments. Chin. Sci. Bull. 2011, 56, 1617–1622. [Google Scholar] [CrossRef] [Green Version]
- Tao, G.; Jelle, B.P.; Sandberg, L.; Gustavsen, A. Monodisperse hollow silica nanospheres for nano insulation materials: Synthesis, characterization, and life cycle assessment. ACS Appl. Mater. Interfaces 2013, 5, 761–767. [Google Scholar] [CrossRef]
- Lin, Y.; He, J. Recent progress in antireflection and self-cleaning technology-from surface engineering to functional surfaces. Prog. Mater. Sci. 2014, 61, 94–143. [Google Scholar]
Figure 1.
Fluorescence X-ray analysis diagram of A: (a) B-Kα-Kβ; (b) Mg-Kα; (c) O-Kα; (d) Ca-Kα.
Figure 1.
Fluorescence X-ray analysis diagram of A: (a) B-Kα-Kβ; (b) Mg-Kα; (c) O-Kα; (d) Ca-Kα.
Figure 2.
Self-made test device for high temperature insulation performance (heating temperature: 300–400 °C). (① Heating equipment; ② SUS304; ③ Coating surface; ④ Infrared thermal instrument (TVS-700)).
Figure 2.
Self-made test device for high temperature insulation performance (heating temperature: 300–400 °C). (① Heating equipment; ② SUS304; ③ Coating surface; ④ Infrared thermal instrument (TVS-700)).
Figure 3.
Heat distribution of the center point of 100 μm thickness at 15 min: (a) Coating plane; (b) SUS304 plane.
Figure 3.
Heat distribution of the center point of 100 μm thickness at 15 min: (a) Coating plane; (b) SUS304 plane.
Figure 4.
Heat distribution of the center point of 100 μm thickness at 30 min: (a) Coating plane; (b) SUS304 plane.
Figure 4.
Heat distribution of the center point of 100 μm thickness at 30 min: (a) Coating plane; (b) SUS304 plane.
Figure 5.
Heat distribution of the center point of 100 μm thickness at 45 min: (a) Coating plane; (b) SUS304 plane.
Figure 5.
Heat distribution of the center point of 100 μm thickness at 45 min: (a) Coating plane; (b) SUS304 plane.
Figure 6.
The temperature change analysis of A.
Figure 6.
The temperature change analysis of A.
Figure 7.
The temperature change analysis diagram of the center point of the SUS304 surface and the coating surface of 500 μm A and B.
Figure 7.
The temperature change analysis diagram of the center point of the SUS304 surface and the coating surface of 500 μm A and B.
Figure 8.
Self-made test device for low temperature insulation performance (heating temperature: 100 °C). (① Heating equipment; ② SUS304; ③ Coating surface; ④ Infrared thermal instrument (TVS-700)).
Figure 8.
Self-made test device for low temperature insulation performance (heating temperature: 100 °C). (① Heating equipment; ② SUS304; ③ Coating surface; ④ Infrared thermal instrument (TVS-700)).
Figure 9.
Heat distribution map of C1.1: (a) 15 min; (b) 30 min; (c) 45 min; (d) 60 min; (e) 75 min.
Figure 9.
Heat distribution map of C1.1: (a) 15 min; (b) 30 min; (c) 45 min; (d) 60 min; (e) 75 min.
Figure 10.
The temperature change analysis of C1.
Figure 10.
The temperature change analysis of C1.
Figure 11.
The temperature change analysis diagram of the center point of the SUS304 surface and coating surface of 500 μm C.
Figure 11.
The temperature change analysis diagram of the center point of the SUS304 surface and coating surface of 500 μm C.
Table 1.
SUS304’s chemical compositions (JIS standard).
Table 1.
SUS304’s chemical compositions (JIS standard).
| Compositions | C | Si | Mn | P | S | Ni | Cr | Fe |
|---|
| Weight (%) | ≤0.08 | ≤1.00 | ≤2.00 | Max0.045 | Max0.045 | 8.00–10.50 | 18.00–20.00 | Balance |
Table 2.
Compositions of spray materials.
Table 2.
Compositions of spray materials.
| Compositions of Spray Material (wt.%) | Spraying Method | Film Thickness (μm) |
|---|
| No. | MgO | B2O3 | SiO2 | Zn |
|---|
| A | 85 | 15 | 0 | 0 | Plasma spraying | 100
200
300
500 |
| B1 | 80 | 15 | 0 | 5 | Flame spraying |
| B2 | 75 | 15 | 0 | 10 |
| B3 | 70 | 15 | 0 | 15 |
| C1 | 50 | 10 | 35 | 5 |
| C2 | 50 | 10 | 30 | 10 |
| C3 | 50 | 10 | 25 | 15 |
Table 3.
Composition analysis of powders by X-ray.
Table 3.
Composition analysis of powders by X-ray.
| Component | Composition |
|---|
| A | B1 | B2 | B3 | C1 | C2 | C3 |
|---|
| Weight (%) |
|---|
| MgO | 82.90 | 76.78 | 76.78 | 72.55 | 48.25 | 47.13 | 47.58 |
| CaO | 2.14 | 2.50 | 2.50 | 2.41 | 2.33 | 2.44 | 2.42 |
| B2O3 | 14.96 | 15.10 | 15.10 | 14.80 | 9.44 | 9.95 | 9.68 |
| SiO2 | 0 | 0 | 0 | 0 | 34.83 | 30.19 | 25.51 |
| Zn | 0 | 5.63 | 5.63 | 10.25 | 5.15 | 10.27 | 14.81 |
Table 4.
The temperature difference between the surface of SUS304 and the coating surface of A.
Table 4.
The temperature difference between the surface of SUS304 and the coating surface of A.
| Time (min) | Temperature Difference (°C) |
|---|
| A.1 | A.2 | A.3 | A.4 |
|---|
| 15 | 15.7 | 22.5 | 28.8 | 35.7 |
| 30 | 19.1 | 19.5 | 36.0 | 46.2 |
| 45 | 23.2 | 33.4 | 44.9 | 60.8 |
| 60 | 24.6 | 42.6 | 50.3 | 63.8 |
| 75 | 32.3 | 51.8 | 68.8 | 75.8 |
Table 5.
The temperature difference between the surface of SUS304 and the coating surface of B.
Table 5.
The temperature difference between the surface of SUS304 and the coating surface of B.
Coating
Surface of B | Temperature Difference (°C) |
|---|
| 15 min | 30 min | 45 min | 60 min | 75 min |
|---|
| B1.1 | 21.8 | 22.2 | 36.2 | 42.9 | 44.7 |
| B1.2 | 26.5 | 19.9 | 42.1 | 56.6 | 55.0 |
| B1.3 | 34.2 | 40.0 | 47.6 | 50.5 | 74.2 |
| B1.4 | 36.9 | 47.2 | 68.3 | 93.4 | 83.2 |
| B2.1 | 25.2 | 28.3 | 44.5 | 49.6 | 42.8 |
| B2.2 | 27.7 | 33.3 | 54.4 | 64.7 | 64.7 |
| B2.3 | 37.3 | 52.7 | 60.6 | 76.4 | 84.6 |
| B2.4 | 41.3 | 58.3 | 81.4 | 93.4 | 103.4 |
| B3.1 | 28.1 | 34.9 | 49.9 | 46.1 | 49.8 |
| B3.2 | 35.0 | 38.2 | 57.1 | 71.4 | 69.4 |
| B3.3 | 45.9 | 59.3 | 70.7 | 87.0 | 95.0 |
| B3.4 | 48.6 | 69.9 | 86.1 | 107.4 | 123.6 |
Table 6.
The temperature difference between the surface of SUS304 and coating surface of C.
Table 6.
The temperature difference between the surface of SUS304 and coating surface of C.
Time
(min) | Temperature Difference (°C) |
|---|
| C1.1 | C1.2 | C1.3 | C1.4 |
|---|
| 15 | 4.7 | 3.9 | 6.5 | 18.5 |
| 30 | 2.4 | 4.4 | 4.3 | 14.7 |
| 45 | 2.8 | 6.7 | 9.9 | 22.1 |
| 60 | 4.4 | 6.0 | 15.4 | 23.1 |
| 75 | 6.2 | 10.0 | 17.9 | 26.4 |
Table 7.
The temperature difference between the surface of SUS304 and coating surface of C.
Table 7.
The temperature difference between the surface of SUS304 and coating surface of C.
Coating
Surface of C | Temperature Difference (°C) |
|---|
| 15 min | 30 min | 45 min | 60 min | 75 min |
|---|
| C1.1 | 4.7 | 2.4 | 2.8 | 4.4 | 6.2 |
| C1.2 | 3.9 | 4.4 | 6.7 | 6.0 | 10.0 |
| C1.3 | 6.5 | 4.3 | 9.9 | 15.4 | 17.9 |
| C1.4 | 18.5 | 14.7 | 22.1 | 23.1 | 26.4 |
| C2.1 | 7.8 | 5.0 | 7.1 | 8.5 | 9.4 |
| C2.2 | 6.7 | 5.8 | 7.7 | 14.2 | 14.7 |
| C2.3 | 12.8 | 11.5 | 16.1 | 22.4 | 24.7 |
| C2.4 | 20.3 | 19.9 | 28.5 | 30.7 | 37.3 |
| C3.1 | 4.4 | 5.0 | 6.5 | 6.8 | 8.0 |
| C3.2 | 5.1 | 5.2 | 9.2 | 10.8 | 13.0 |
| C3.3 | 7.8 | 7.5 | 18.7 | 16.4 | 22.0 |
| C3.4 | 20.3 | 19.4 | 22.5 | 22.1 | 27.1 |
| Publisher’s Note: MDPI stays neutral with regard to jurisdictional claims in published maps and institutional affiliations. |
© 2021 by the authors. Licensee MDPI, Basel, Switzerland. This article is an open access article distributed under the terms and conditions of the Creative Commons Attribution (CC BY) license (https://creativecommons.org/licenses/by/4.0/).


