Article

Synthesis and Characterization of Polyaniline-Based Polymer Nanocomposites as Anti-Corrosion Coatings

by
Francisco R. Rangel-Olivares
1,
Elsa M. Arce-Estrada
2 and
Román Cabrera-Sierra
1,*
1
Instituto Politécnico Nacional, Departamento de Ingeniería Química Industrial, ESIQIE, UPALM Ed. 7, CDMX, C.P., Mexico City 07738, Mexico
2
Instituto Politécnico Nacional, Departamento de Ingeniería en Metalurgia y Materiales, ESIQIE, UPALM Ed. 7, CDMX, C.P., Mexico City 07738, Mexico
*
Author to whom correspondence should be addressed.
Coatings 2021, 11(6), 653; https://doi.org/10.3390/coatings11060653
Submission received: 4 May 2021 / Revised: 17 May 2021 / Accepted: 25 May 2021 / Published: 29 May 2021

Abstract

:
Polymer nanocomposites of polyaniline (PANI)-based metal oxides (SiO2, CeO2, and TiO2A) were synthesized by in situ chemical oxidative polymerization by rapid mixing in a hydrochloric acid medium to evaluate and compare their performance as anti-corrosion coatings on commercial 1018 steel in a 3.5% NaCl medium. The anti-corrosion coatings were developed by dispersing synthesized nanocomposites on an alkydalic resin (AR) for their subsequent electrochemical characterization. X-ray diffraction (XRD) analyses show that PANI has a certain degree of crystallinity in its structure. The incorporation of metal oxide (MO) nanoparticles (NPs) into the polymer matrix was confirmed by scanning electron microscopy and energy-dispersive X-ray spectroscopy (SEM-EDS) analyses, while the interaction of nanoparticles with PANI was proven by Fourier transform infrared (FT-IR) and ultraviolet-visible (UV-vis). Thermogravimetric analysis (TGA) reveals that nanoparticles infer greater resistance to the thermal decomposition of PANI. Finally, the use of open circuit potential (OCP) study, Tafel curves, and electrochemical impedance spectroscopy (EIS) showed that coatings made with TiO2A NPs exhibit the best anti-corrosion properties as compared to those synthesized with SiO2 and CeO2 NPs.

1. Introduction

Metals and alloys, like steel, are the primary support of the industrial infrastructure due to their mechanical properties, such as high hardness, toughness, and ductility. However, metals in adverse conditions like aggressive media are thermodynamically unstable and subject to corrosion. Economic losses from metal corrosion reach billions of dollars per year worldwide [1,2].
The corrosion process is inevitable; however, the useful life of materials can be extended using corrosion inhibitors, cathodic protection, anodic protection, or by the application of organic coatings. Protective coatings can be made of inert metals or polymers such as polyanilines, polyvinylamides, polycarboxylates, polysaccharides, and polysulfides, among others [3]. At present, conducting polymers (CPs) are arousing great interest regarding metal protection against corrosion since they are capable of passivating the metal substrate surface through protective oxide film formation. On the other hand, the use of organic–inorganic composites as anti-corrosion coatings has also been suggested since the organic component, such as a polymer, provides a barrier effect, self-healing, and oxidation–reduction (redox) properties to the coating, while the protection against corrosion is afforded by inorganic pigments acting as inhibitors [4]. Thus, the development of polymer nanocomposites as anti-corrosion coatings, based on CPs and metal oxides, provides an improvement in the mechanical and physicochemical properties, such as barrier effect, adhesion, lower porosity, and hydrophobicity in some cases, because organic and inorganic characteristics of the materials are more efficiently combined at the micrometer and nanometer scale [5].
The most extensively studied CPs are polyacetylene (PA), polyaniline (PANI), polypyrrole (PPy), polythiophene (PTh), poly(ethylene dioxythiophene) (PEDOT), and their derivatives [6,7,8]. Besides, CPs have been evaluated as protective anti-corrosion coatings in mild steel [9,10,11], stainless steel [12,13,14,15,16], iron [17,18,19,20], copper [21], zinc [22,23], aluminum [24], and other metals [25], probably PANI and its derivatives being the most studied ones [26,27]. The use of dopants in the PANI has also been suggested to improve their conductivity and efficiency against corrosion. For example, Kalendova et al. [28] investigated anti-corrosion protection in different metals by adding inorganic pigments such as zinc, zinc phosphate, and calcium borate to PANI. They showed that the prepared composites achieved better efficiency in metal protection than the individually used materials due to a synergistic effect between the components.
On the other hand, Shi et al. [29] showed that SiO2 and TiO2 enhance organic coatings as anti-corrosion protection of mild steels. Caldas et al. [30] prepared PANI-SiO2 hybrid materials by oxidative polymerization in situ, showing that they improve the anti-corrosion resistance of PANI as a coating deposited on carbon steel immersed in a 3.5% NaCl solution. Similarly, Radhakrishnan et al. [31] demonstrated that anti-corrosion coatings based on PANI and TiO2 nanoparticles are more efficient in steel protection than PANI alone due to the increase in barrier properties and the interference in the charge transport between the substrate and the corrosive medium provided by NPs. The above findings are associated with the fact that SiO2 can improve the resistance to oxidation and acid corrosion of metals under different temperatures due to high resistance to heat and chemical resistance [32,33]. TiO2, in both anatase and rutile phases, is commonly used as an additive in paints since the nanoparticles of this metal oxide infer improvements in the coating’s barrier properties. Nazeri et al. [34] prepared ceria and titania coatings deposited on 304 stainless steel and evaluated their performance as an inhibitor of pitting corrosion. Electrochemical measurements in NaCl and SEM and EDX analyses revealed that the composite is suitable for preventing cracking and increasing the resistance to pitting corrosion.
As was already mentioned, various methods of synthesis and oxide content have been used and dispersed in epoxy resin, so it is of interest to determine if these have a better effect on the anti-corrosive capacity of coatings. Therefore, in this study, we have synthesized anti-corrosion systems composed of PANI-based polymer nanocomposites by in situ chemical oxidative polymerization by rapid mixing, which is an effective synthesis method barely studied. Nanocomposites were prepared by mixing different NPs of MO (silica, ceria, and titania in anatase phase), each one separately, in a PANI matrix. So, three PANI-based nanocomposites (SiO2-PANI, CeO2-PANI, and TiO2A-PANI) were synthesized and characterized, together with PANI used alone, by techniques such as XRD, FTIR, UV-vis, SEM-EDS, and TGA to learn about the aspects related to their structure, composition, and morphology. Afterward, these systems were evaluated and compared as coatings on 1018 carbon steel to establish that MO confer better anti-corrosion properties and performance a la PANI by electrochemical techniques, such as EIS and Tafel curves, and in this way, propose a new strategy in the development of anti-corrosion coatings based on MO-reinforced polymer nanocomposite. The anti-corrosion coatings were developed by dispersing nanocomposites synthesized in a commercial alkydalic resin (AR) and mechanically deposited onto the metal substrate using a commercial micrometer film applicator.

2. Experimental Procedure

2.1. Reagents and Materials

Analytical grade (ACS) or high purity reagents were purchased from Sigma Aldrich (St. Louis, MO, USA). Aniline (ACS ≥ 99.5%, CASRN: 62-53-3). Amorphous silica (SiO2, CASRN: 7631-86-9) with an average nanoparticle size of 7.42 nm, titania anatase phase (TiO2A, CASRN: 1317—70-0) with an average nanoparticle size of 12.97 nm, and cerium oxide (CeO2, CASRN: 1306-38-3) with an average nanoparticle size of 22.23 nm. Ammonium persulfate (APS, CASRN: 7727-54-0) and solvents were purchased from FERMONT_MÉXICO (Monterrey, NL, México).

2.2. Synthesis of PANI and Polymer Nanocomposites

PANI can be synthesized by chemical or electrochemical polymerization reactions [35]. Depending on the degree of oxidation or protonation, PANI exhibits different forms subject to other redox states, which regulate its various properties. The most important form is the protonated emeraldine (ES) and its corresponding non-protonated base (LB), which is electronically conductive, and this feature is responsible for the active control of corrosion in metal substrates [36,37].

2.2.1. PANI Synthesis by Rapid Mixing Oxidative Polymerization of Aniline

Aniline was polymerized using HCl as a catalyst and ammonium persulfate (APS) as an oxidizing agent. Two equimolar solutions of aniline (4.56 mL) and APS (11.409 g) were prepared in 50 mL HCl 1M under magnetic stirring for several minutes. Then, the APS solution was suddenly added to the aniline solution at low temperature (≈0 °C), under constant stirring (for approximately 4 to 6 h, see Figure 1). Finally, a green precipitate was obtained, filtered through a Buchner funnel (Sigma Aldrich, St. Louis, MO, USA) connected to the vacuum source, and washed several times with deionized water and HCl 1M until the filtrate was almost colorless. Subsequently, the product was dried in an oven for 12 h at an approximate temperature of 60 °C [38].

2.2.2. SiO2, TiO2, and CeO2/PANI Nanocomposites Synthesis by In Situ Chemical Oxidative Polymerization by Rapid Mixing

An equimolar solution of aniline with HCl 1M was prepared under magnetic stirring. Before the in situ polymerizations of aniline, quantities of metal oxides to be used (SiO2, CeO2, or TiO2A) were added in a ratio of 0.25% in volume. Then, the solutions were sonicated by ultrasound for 45 min to prevent the agglomeration of nanoparticles and allow the HCl-doped aniline to deposit on the surface of NPs via electrostatic interactions. Finally, the in situ polymerization was carried out by sudden addition of the APS solution to HCl 1M and further continuing the procedure through stirring (Figure 2), filtering, washing, and drying described in the PANI synthesis by rapid mixing [38,39].

2.2.3. Coating Development

The metal substrate was 1018 low carbon steel with the following chemical composition in weight percent: C = 0.18%, Mn = 0.6–0.9%, P = 0.04%, S = 0.05%, and Fe = balance. Metal samples of 2 × 2 cm2 and 1/8′′ thickness were cut. The samples’ surface was mechanically polished using silicon carbide paper with different grits (320, 400, and 600) until obtaining a homogeneous surface. Afterward, the samples were degreased with isopropanol and left to dry for 24 h at room temperature. The anti-corrosion systems (Figure 3) were developed by mixing PANI and the formulated nanocomposites in an alkydalic resin (AR), using magnetic stirring until a homogeneous mixture was obtained. All the formulated coatings were made with the nanocomposite ratio of 0.5 wt.% concerning to the resin employed. The coatings were deposited on metal samples using a commercial Elcometer 3570/1 micrometer film applicator, allowing depositing coatings in a uniform and reproducible manner and fixing the thickness of the wet film at 3 μm.

2.3. Characterization of PANI and Polymer Nanocomposites

The diffraction patterns (XRD) of different materials were measured in a range of 2θ = 20° to 100° with 0.02° increments, using a Bruker D8 Focus X-ray diffractometer with Cu K α radiation. Infrared spectra were run in a spectral range of 4000–600 cm−1, in a PERKIN ELMER FTIR 2000 Spectrometer (Waltham, MA, USA), from powder samples to determine the chemical structure of synthesized materials. The UV-vis spectra were recorded in a PERKIN-ELMER Lambda-35 Spectrophotometer (Waltham, MA, USA), dispersing 0.001 g of sample in deionized water (10 mL) by sonication. Thermogravimetric analyses were performed in a METTLER TOLEDO Thermobalance (Columbus, OH, USA) with the temperature ramp 25–900 °C, at a heating rate of 10 °C min−1 under air atmosphere (75 mL min−1). The morphology and elementary analysis of coatings were characterized by a JEOL JSM 7800F Ultrahigh Resolution Scanning Electron Microscope (Akishima, TYO, Japan), equipped with an EDAX EDS detector.

2.4. Electrochemical Characterization

A three-electrode cell made of acrylic was used for the characterization of materials. The steel samples coated with PANI, nanocomposites, and the bare steel samples were used as working electrodes (3.142 cm2); a graphite rod was employed as a counter-electrode, and a saturated calomel electrode (SCE, Hg/Hg2Cl2) was the reference electrode. The corrosive medium was a brine composed of 3.5% NaCl solution, and before the electrochemical evaluation, open circuit potentials (OCP) were measured. Electrochemical tests were performed using an Autolab/PGSTAT302N potentiostat/galvanostat (Herisau, AR, Swiss) coupled to a PC with NOVA 2.0. software.

2.4.1. Tafel Polarization Curves

The polarization curves were recorded in a potential range of ±250 mV with respect to OCP at a scan rate of 0.00166 V s−1. Subsequently, electrochemical parameters like corrosion current ( i c o r r ) and potential ( E c o r r ), anodic slope ( β A ) , and cathodic slope ( β C ) were obtained by the Tafel extrapolation method to calculate the corrosion rate ( C R ) and protection efficiency, η P R O T ( % ) , as shown in Equations (1) and (2).
C R = i c o r r · K · E W ρ
where i c o r r represents the corrosion current of the evaluated sample, K is a constant that defines the corrosion rate units, 0.1288 mils μA−1 cm−1 year−1 (=)   m p y , E W is the average steel equivalent weight, 27.92 g eq−1, and ρ represents its density, 7.86 g cm−3.
η P R O T ( % ) = i c o r r 0 i c o r r c o a t i c o r r 0 × 100
where i c o r r 0 represents the corrosion current of uncoated steel sample, and i c o r r c o a t represents the corrosion current of coated steel sample.

2.4.2. Electrochemical Impedance Spectroscopy (EIS)

Impedance measurements were carried out with an amplitude perturbation of ±10 mV, a frequency range from 100 kHz to 10 mHz, and 10 points per decade. The FRA (Frequency Response Analyzer System)-NOVA 2.0 software was used for the analysis of the results. The simulation of impedance diagrams was performed using equivalent circuits and the ZSimpWin 3.22 software.
The protection efficiency, η P R O T ( % ) was calculated as shown in Equation (3), using the R c t values obtained from the fitting process.
η P R O T ( % ) = R c t R c t 0 R c t × 100
where R c t and R c t 0 represent the charge transfer resistance of the coated and uncoated samples, respectively.

3. Results and Discussion

3.1. X-ray Diffraction (XRD) Study

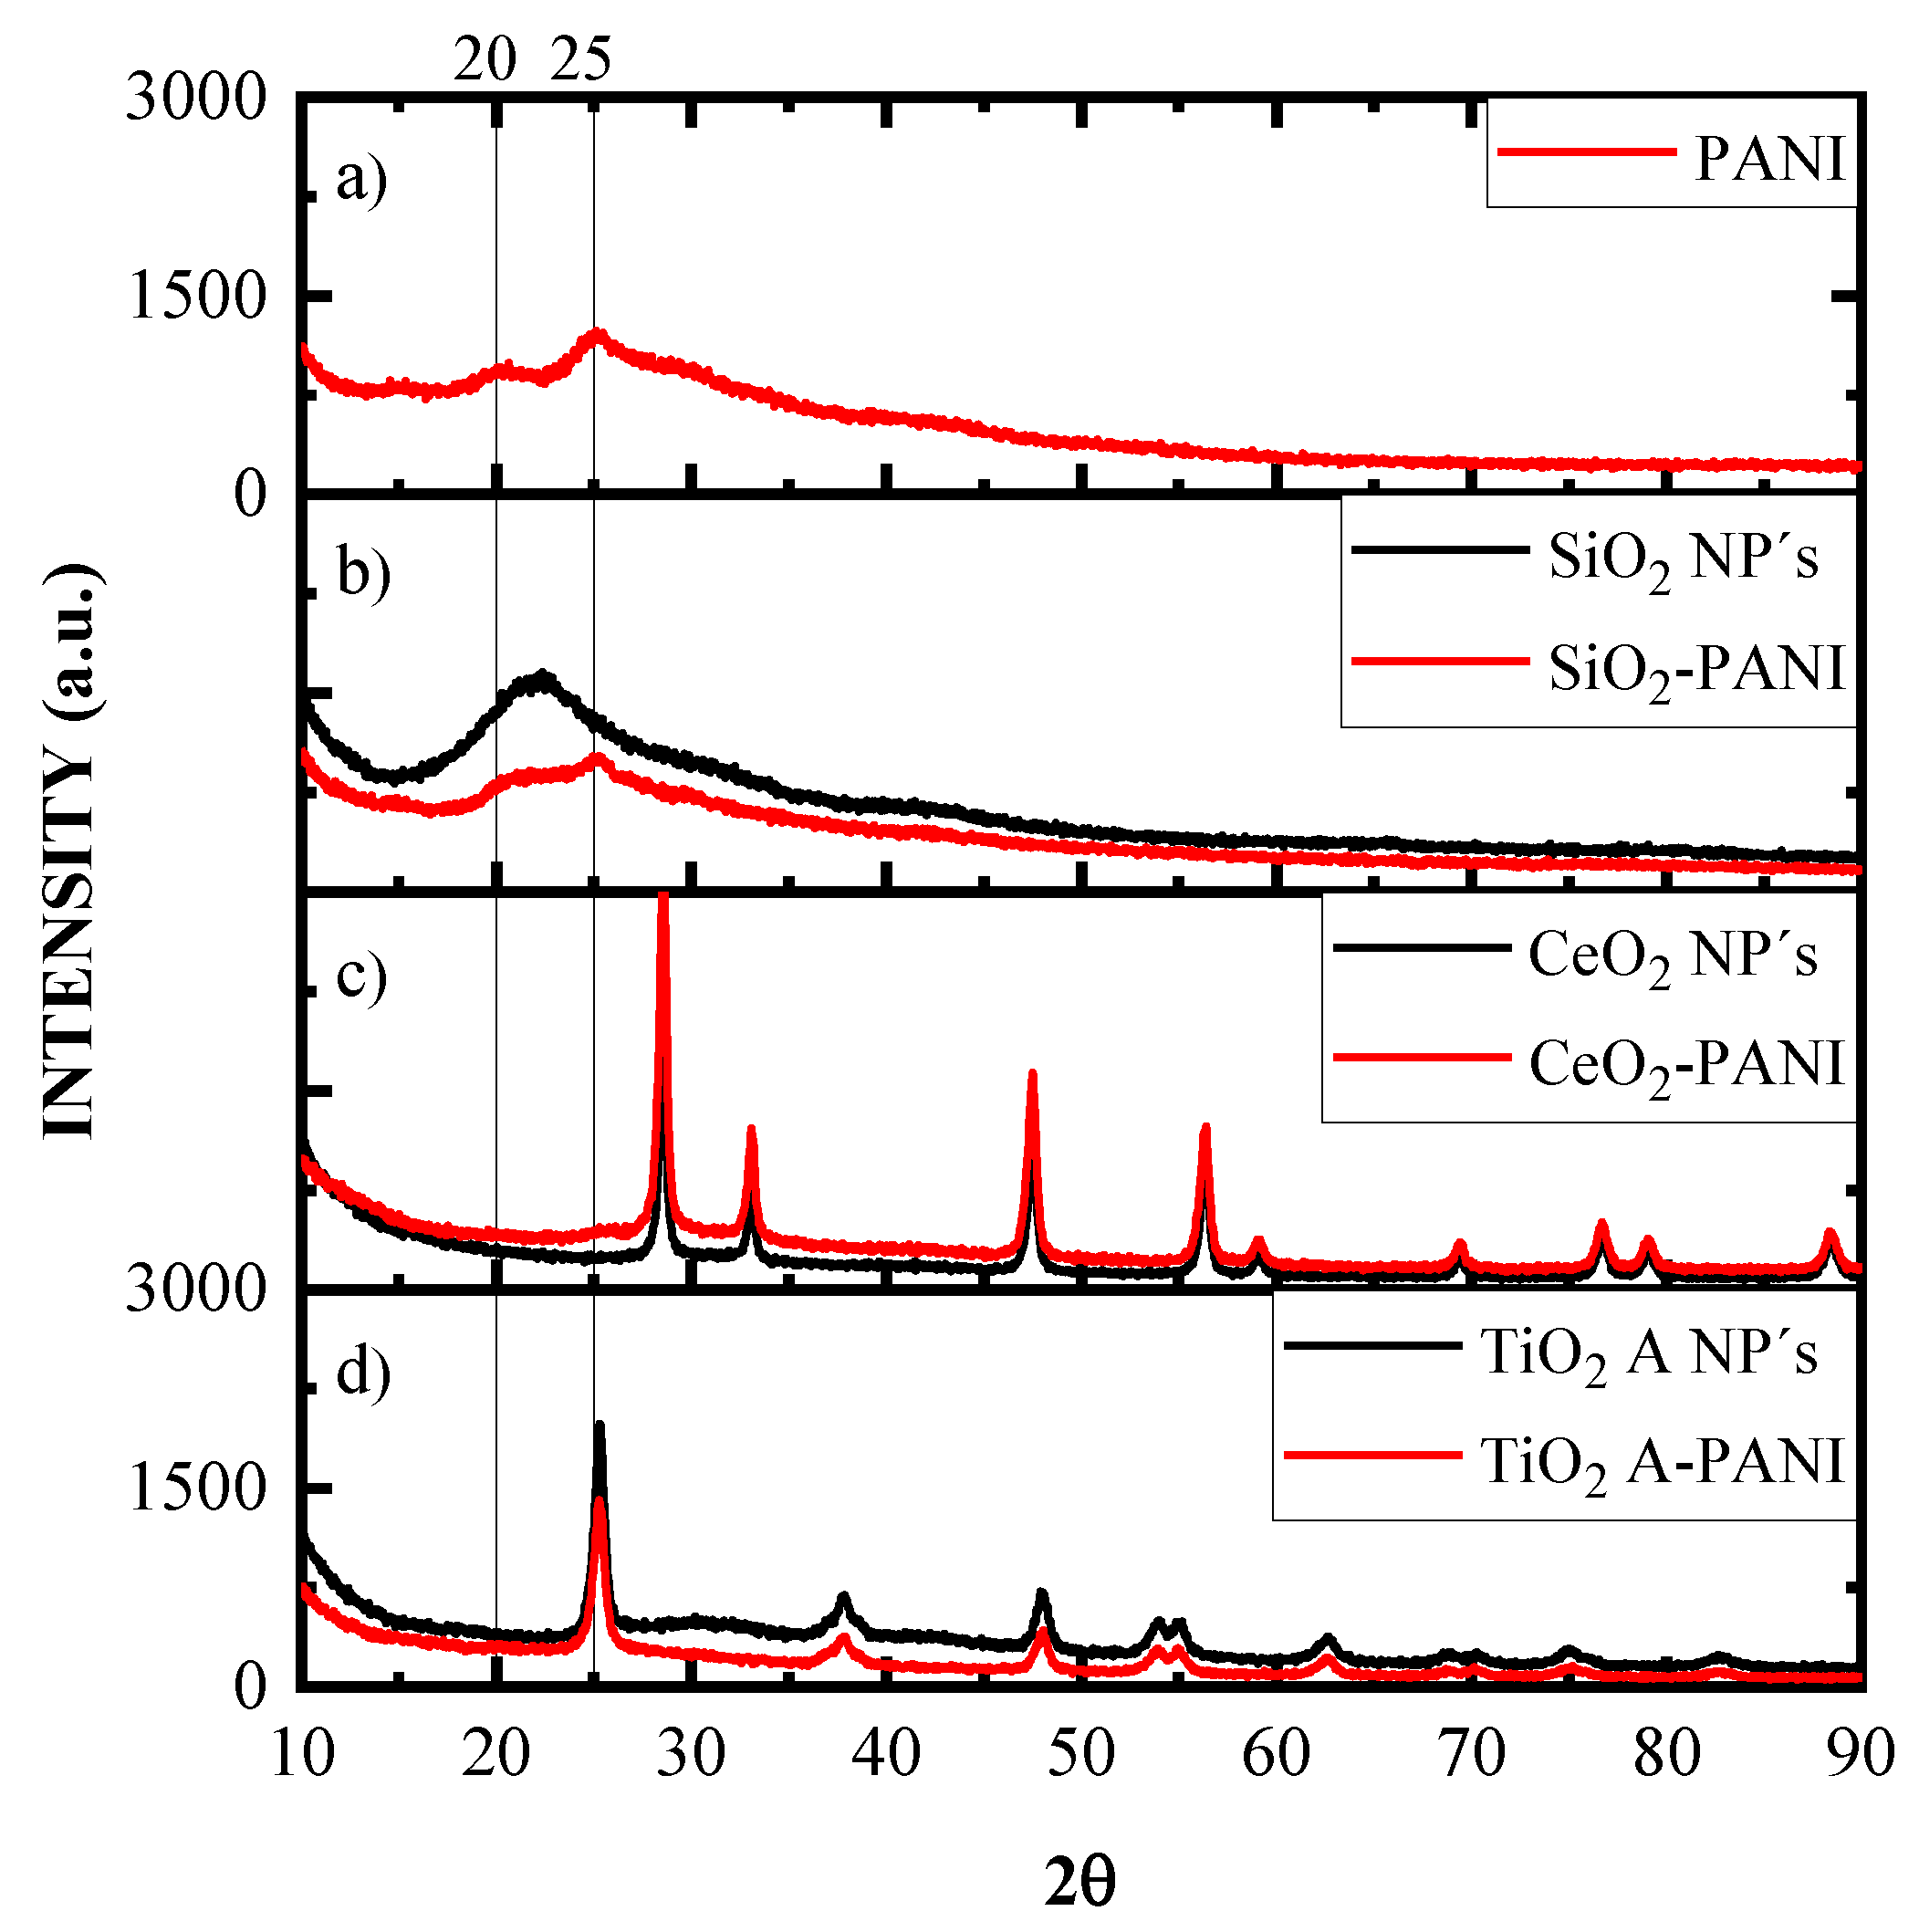
Figure 4a shows the typical XRD pattern of PANI. This pattern exhibits two visible peaks at 2θ = 20° and 25°, which belong to the planes (100) and (110), respectively [40,41]. These peaks can be attributed to the parallel and perpendicular periodicity of the polymer chain and are characteristic of the protonated form of PANI [42,43,44]. PANI is highly rigid due to its linear structure and not very flexible chains, which induces its crystallinity. The percentage of PANI crystallinity was determined (33.27%) from the diffraction pattern in Figure 4a, which support that PANI is in its protonated form, consistent with the peaks at low angle values 2θ [44].
Figure 4b shows the diffraction patterns of the SiO2/PANI nanocomposite and amorphous silica NPs. The comparison of the patterns indicates that the incorporation of silica NPs induces no new order into the polymer due to their low concentration.
Figure 4c exhibits a comparison of XRD patterns of the CeO2/PANI nanocomposite and CeO2 NPs. The nanocomposite patterns show a preferential orientation in the planes corresponding to CeO2 (111, 200, 220, 311, 222, etc.). However, an increase in the intensity of oxide diffraction peaks is related to the deposit of PANI on the surface of CeO2 NPs, which does not influence in their crystalline behavior [45]. Nevertheless, there are two small, almost imperceptible bands in an angular position between 20° and 25°, attributed to the typical PANI diffraction pattern mentioned before, thus confirming the polymer interaction with cerium NPs.
XRD patterns of titania anatase phase (TiO2A) NPs and the TiO2A/PANI nanocomposite are shown in Figure 4d. Similarly, those of CeO2 nanocomposite and the TiO2A patterns are not significantly influenced by the presence of PANI since the crystallinity of this compound is dominated by the original pattern of titanium oxide, planes (101), (004), (112), (105), (211), (204), (116), etc., which is corroborated by the absence of the polymer’s characteristic peaks located at 2θ = 20° and 25° [46].

3.2. FTIR Spectroscopic Study

Figure 5 shows FTIR spectra for PANI and formulated nanocomposites. The modes of vibrational bands are explained as follows: the bands characteristic of PANI (Figure 5a) appear at 3310–3265 cm−1, corresponding to the stretching of N–H aromatic amines in the benzenoid ring [41,47,48]; those at 2153 and 2016–1973 cm−1 are due to the stretching of C=N and C=C bonds in quinoid and benzenoid rings [41,47,48], respectively. The bands at 2550–2420 cm−1 belong to symmetric stretching of C–H bonds of the aromatic group [41,47]. The band at 1629 cm−1 represents specifically the stretching of C=N bonds in the quinoid ring. The bands related to the stretching of C–N bonds in the benzenoid ring appear between 1300 and 1200 cm−1. In this region, a band characteristic of the conducting protonated PANI (1240) appears as well [41,47,48], whereas between 860–830 cm−1, bands correspond to vibrational flexions out of the plane of C–H bonds [41]. Finally, vibrations of C–C and C–H bonds in the aromatic ring are found in the region of 750–650 cm−1 [47].
The FTIR spectrum of SiO2/PANI nanocomposite is shown in Figure 5b. In addition to the vibrational bands described in Figure 5a, the band characteristic of silica is observed at the wavenumber of 988 cm−1, attributed to the anti-symmetric stretching of Si–O–Si bonds [48]. On the other hand, some bands of the nanocomposite spectrum (Figure 5b) present slight displacements compared to those of PANI (Figure 5a), attributed to the interaction existing between the SiO2 nanoparticles and the polymer, which is likely to occur due to N–H bonds of PANI and O–Si on the electronegative surface of SiO2 nanoparticles [49].
Figure 5c,d exhibit the FTIR spectra for CeO2/PANI and TiO2A/PANI nanocomposites, respectively. As in Figure 5b, the spectra are dominated by the presence of bands characteristic of PANI. However, in the case of the CeO2 nanocomposite (Figure 5c), the typical bands of Ce–O vibrational stretching at 848 and 521 cm−1 are seen [50], thus confirming the incorporation of CeO2 into the PANI matrix. Likewise, for the TiO2A/PANI nanocomposite (Figure 5d), vibrational bands characteristic of anti-symmetric stretching for Ti–O–Ti bonds appear at 740 cm−1 [40].

3.3. UV-vis Study

Figure 6 shows UV-vis spectra for PANI and synthesized nanocomposites. In the case of PANI (Figure 6a), the absorption spectrum displays the three bands characteristic of the polymer, observed at the wavelengths of 364, 457, and about 900 nm [40,47,50]. The first band (364 nm) corresponds to π–π* electron transition within the segments of benzenoid rings; the second (457 nm) is due to polaron-π* transition, probably attributed to the protonation of PANI chains, whereas the third (900 nm) is associated with a π-polaron transition, attributed to the polymer doping process [40,47]. Figure 6b exhibits the UV-vis spectrum for the SiO2/PANI nanocomposite, displaying the bands characteristic of PANI (Figure 6a). A slight displacement is observed in bands, wavelengths, and intensity due to SiO2 NPs incorporated into the polymer mesh, which induce an effect on doping of the conducting PANI.
For the CeO2/PANI nanocomposite spectrum (Figure 6c), similarly to that in Figure 6b, the displacement in bands characteristic of PANI results from polaron-based electronic transitions induced by CeO2 NPs. They produce an effect of electron distribution in segments of benzenoid rings, creating a large conjugated system due to the incorporation of the nanoparticles into the polymer [51]. Likewise, in the above UV-vis spectra, the use of TiO2A (Figure 6d) as a doping agent in the polymer matrix generates displacements in the bands of PANI spectra due to the interaction of NPs with polyaniline. They diminish the degree of orbital overlapping of π electrons and phenyl rings with a single nitrogen atom and generate a reduction in the extended conjugated system of PANI. It confirms that the presence of NPs influences the level of PANI doping independently of the crystalline structure they exhibit [48].

3.4. Morphological Study of PANI and Nanocomposites by SEM

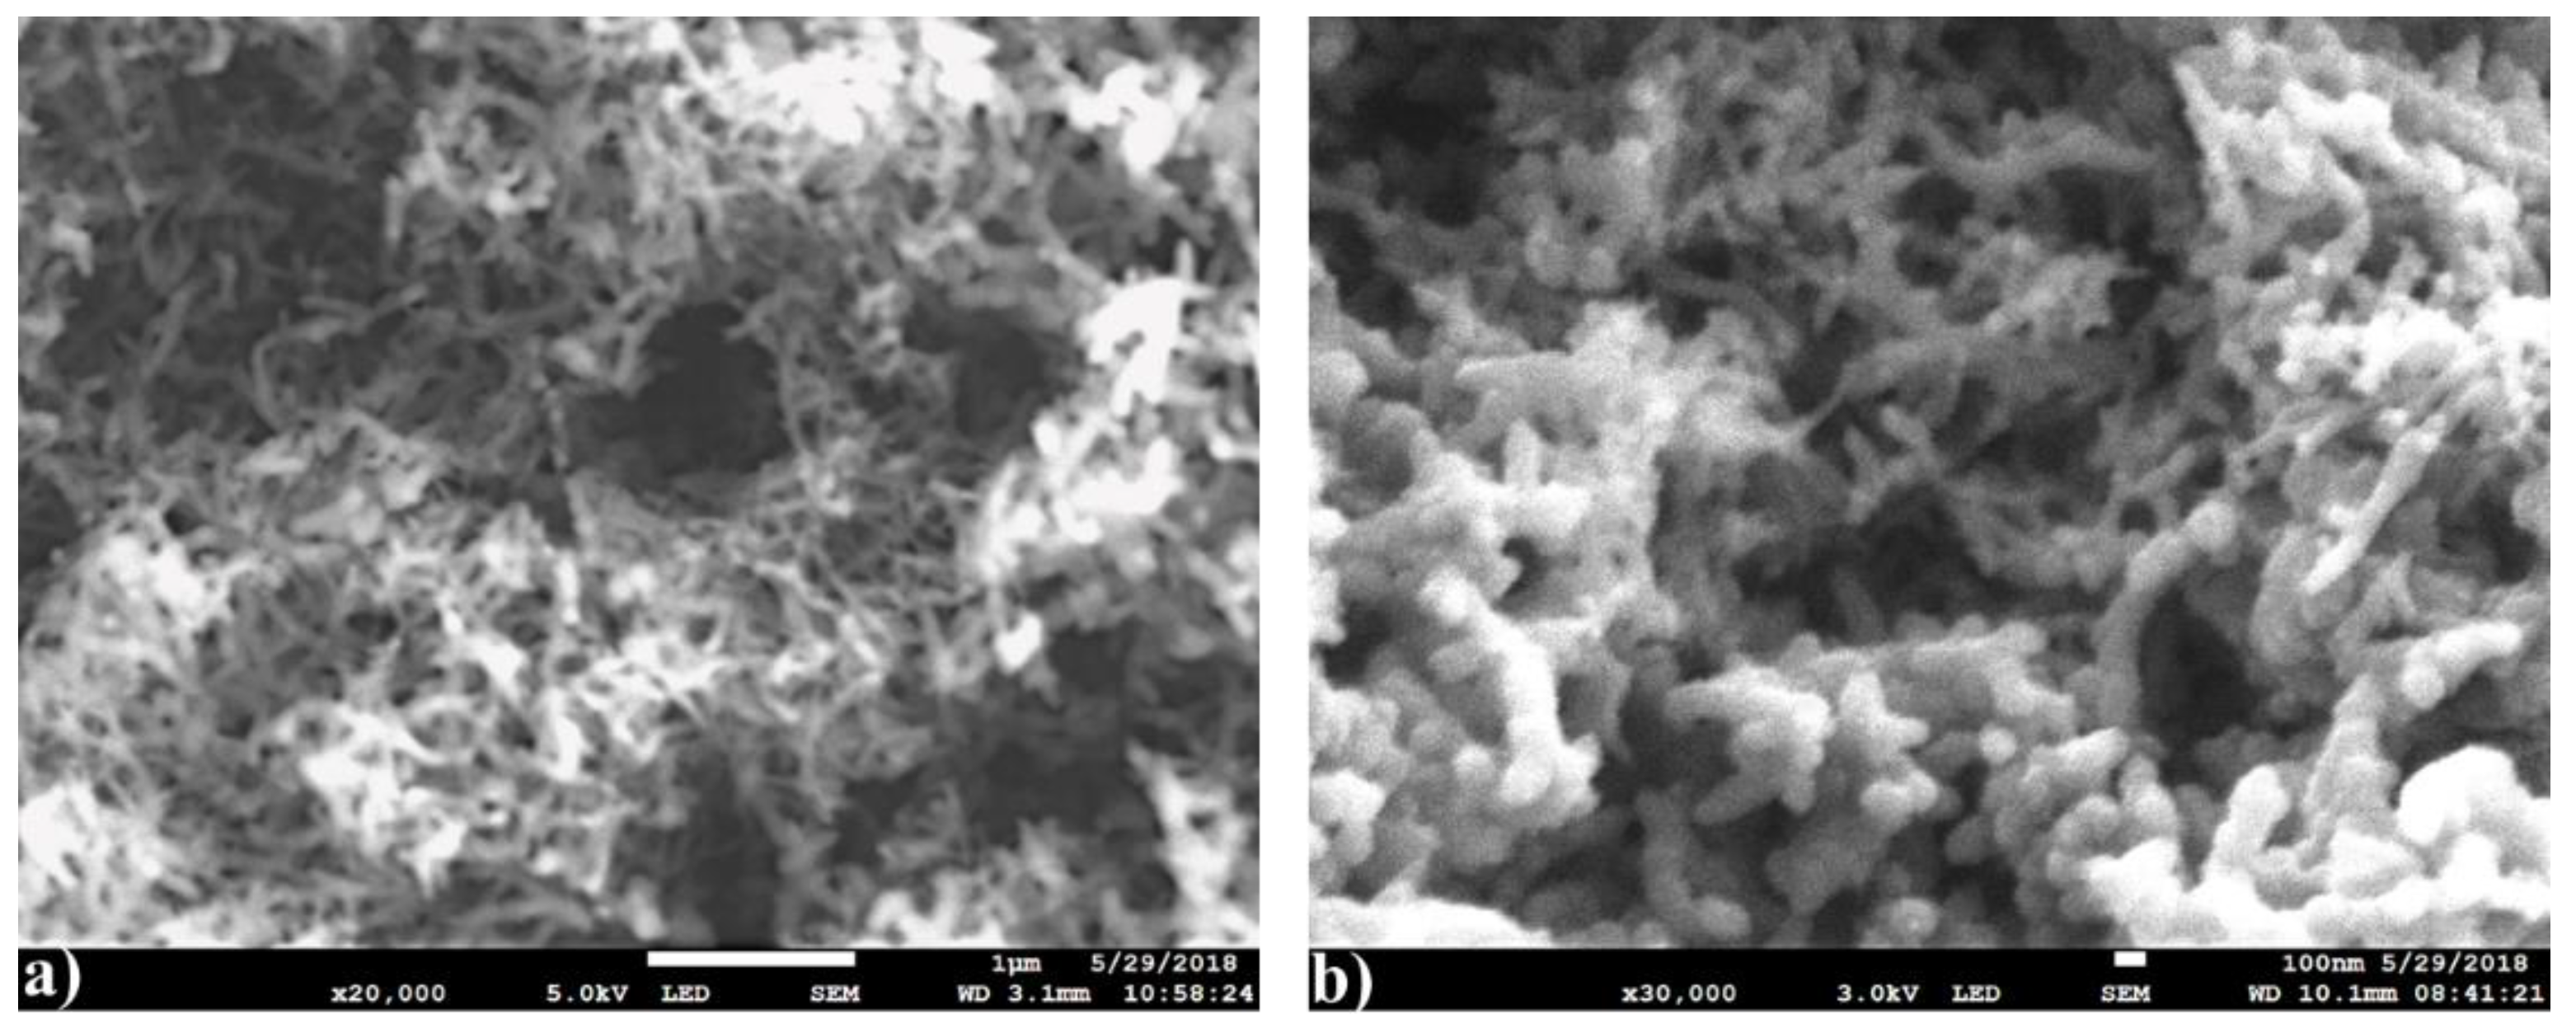
The morphology of PANI and nanocomposites was studied by analyzing the samples by SEM. Figure 7a,b show PANI micrographs obtained at 20,000 and 30,000 magnifications, respectively. As can be observed, the products obtained exhibit a compact structure with different types of morphology, mostly nanofibers and irregularly shaped nanoparticles, as well as agglomerated nanofibrous structures. It is consistent with the findings described in the literature [42] for products obtained via rapid mixing synthesis.
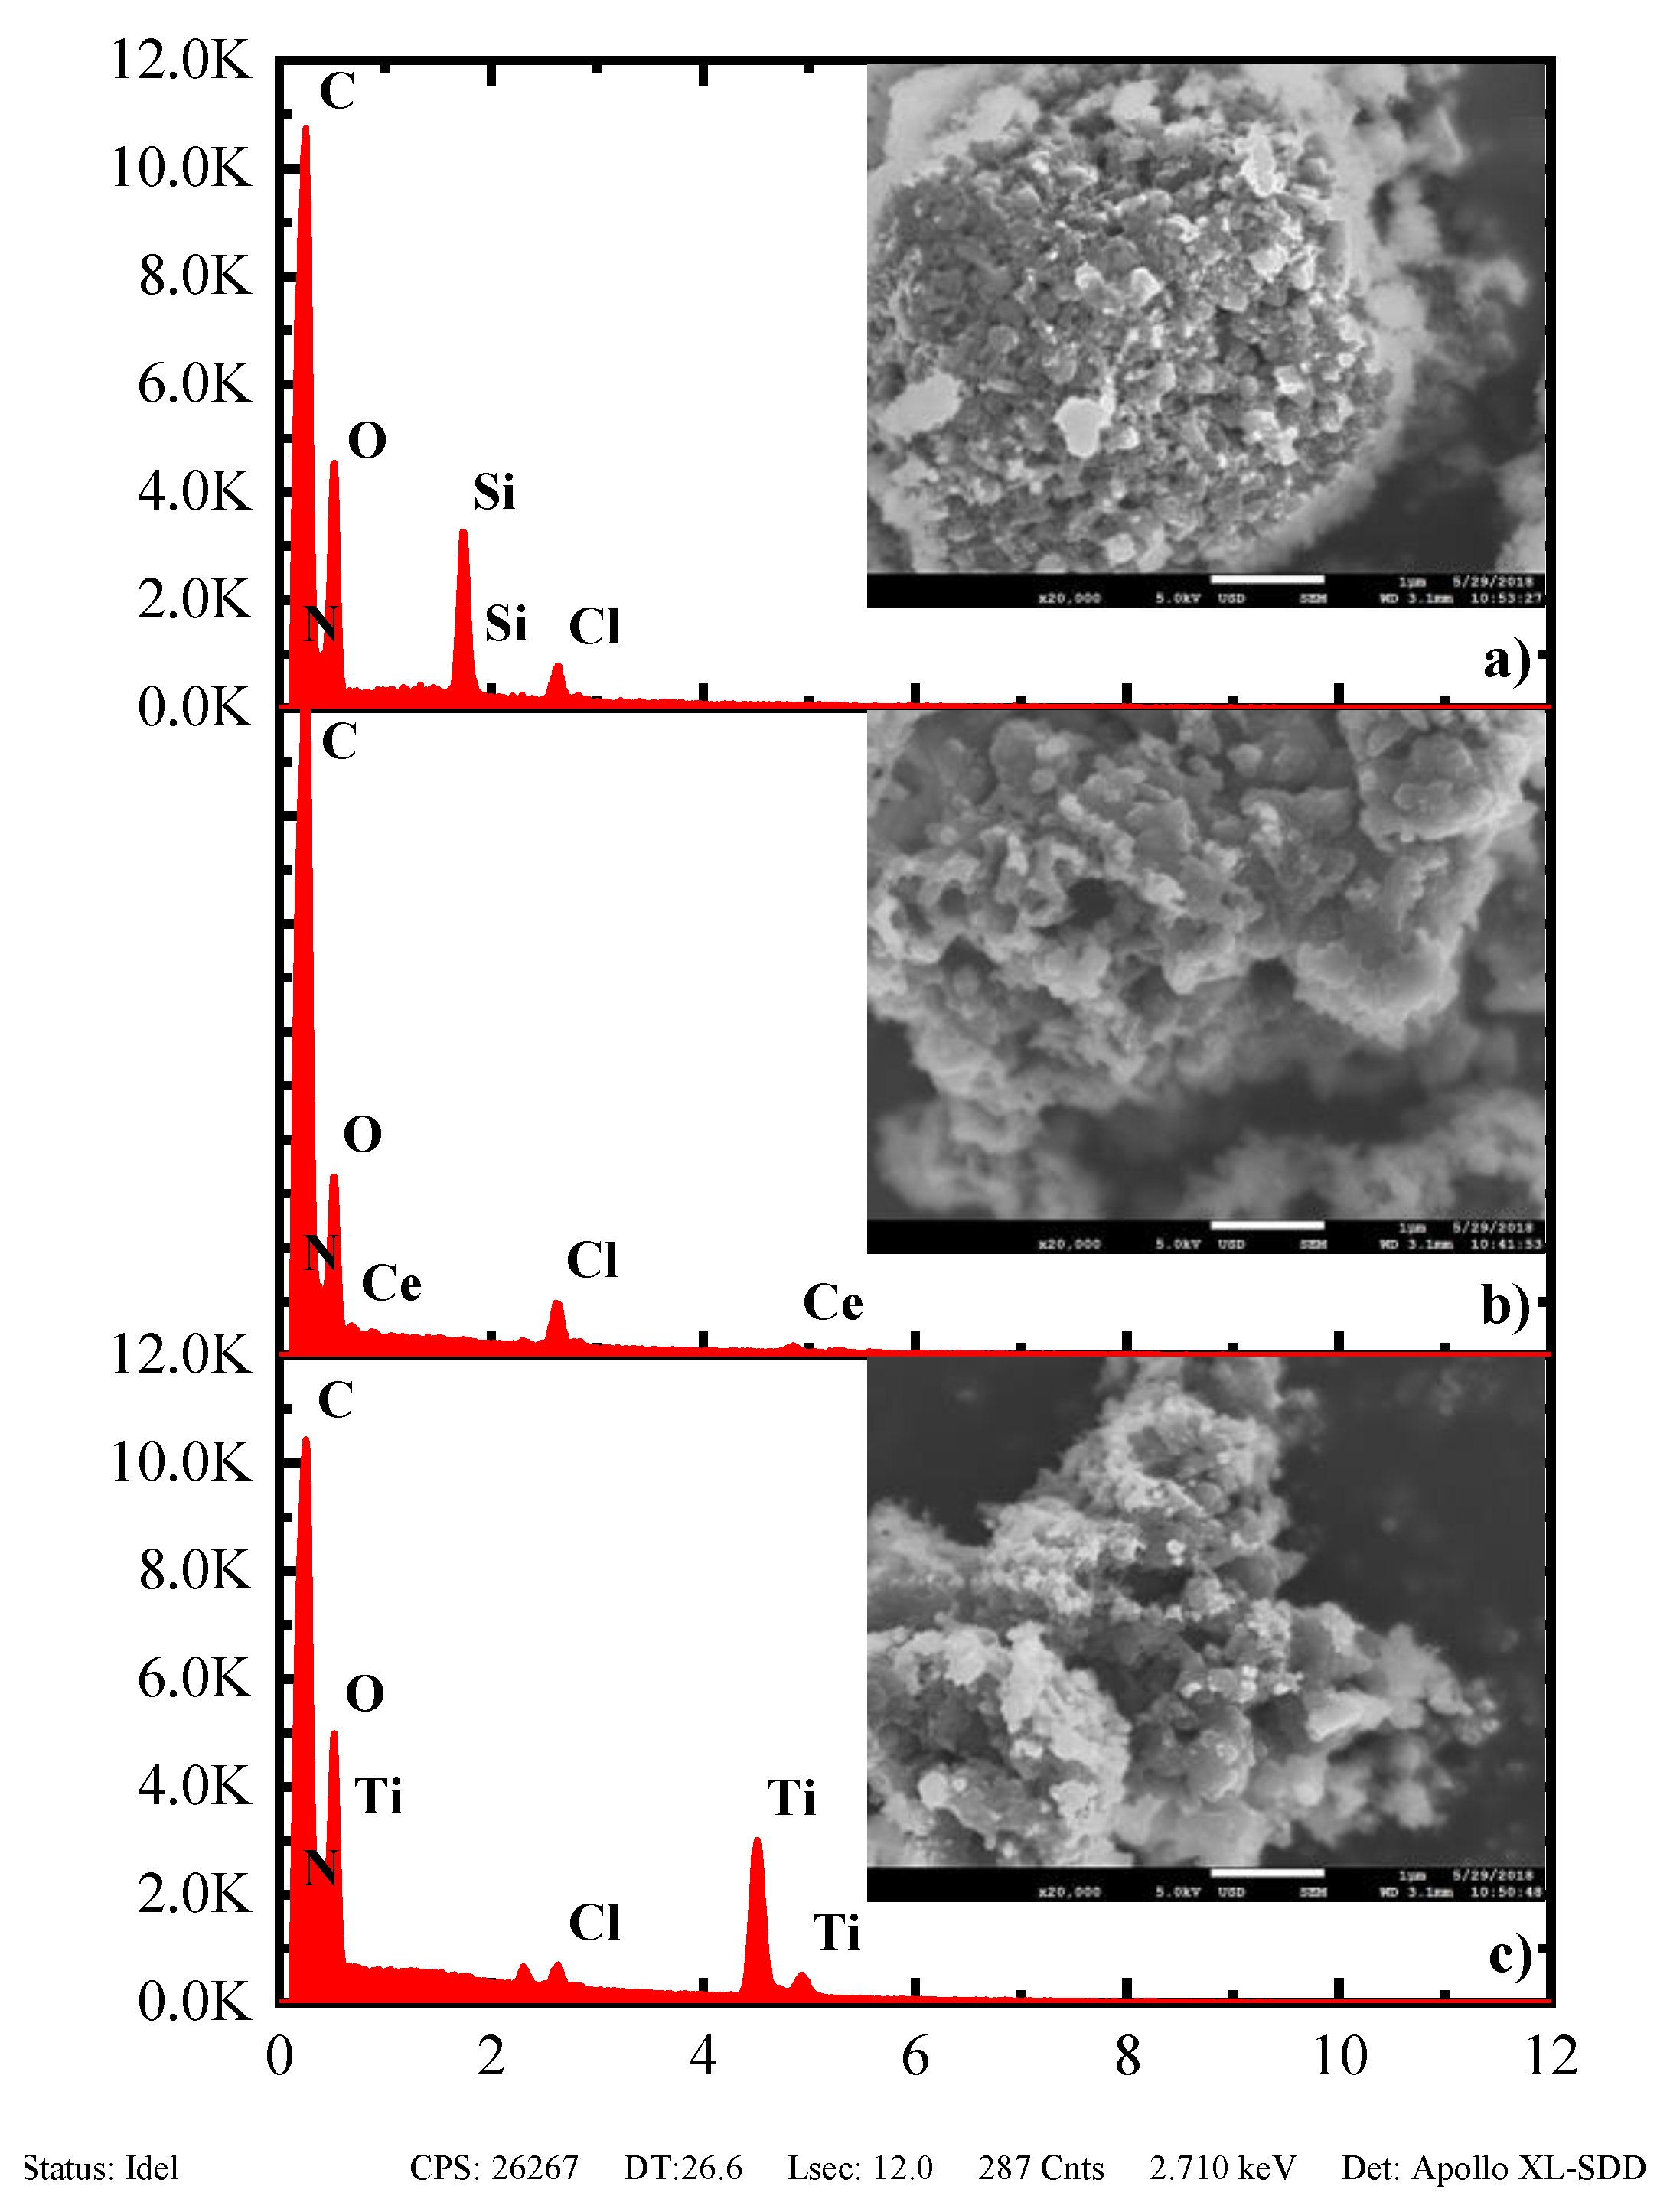
Figure 8 shows micrographs of nanocomposites studied at 20,000 magnification and EDS analyses globally performed for each sample.
Based on the micrographs in Figure 8a–c, a substantial modification of the original structure of PANI can be seen because the polymeric mesh induces a particular ordering of nanoparticles (SiO2, CeO2, and TiO2A) incorporated in its microstructure due to electrostatic interactions existing between both substances. The presence of NPs in the polymer can be distinguished because of the contrast of tones in the image, where brighter areas represent metal oxides. In general, it can be corroborated by EDS spectra obtained for each case (see Figure 8a–c), which evidence the presence of each element in the analyzed samples. The NPs of SiO2 and TiO2A exhibit sizes below 20 nm, whereas those of CeO2 can reach 50 nm.

3.5. Thermogravimetric Analysis of Nanocomposites

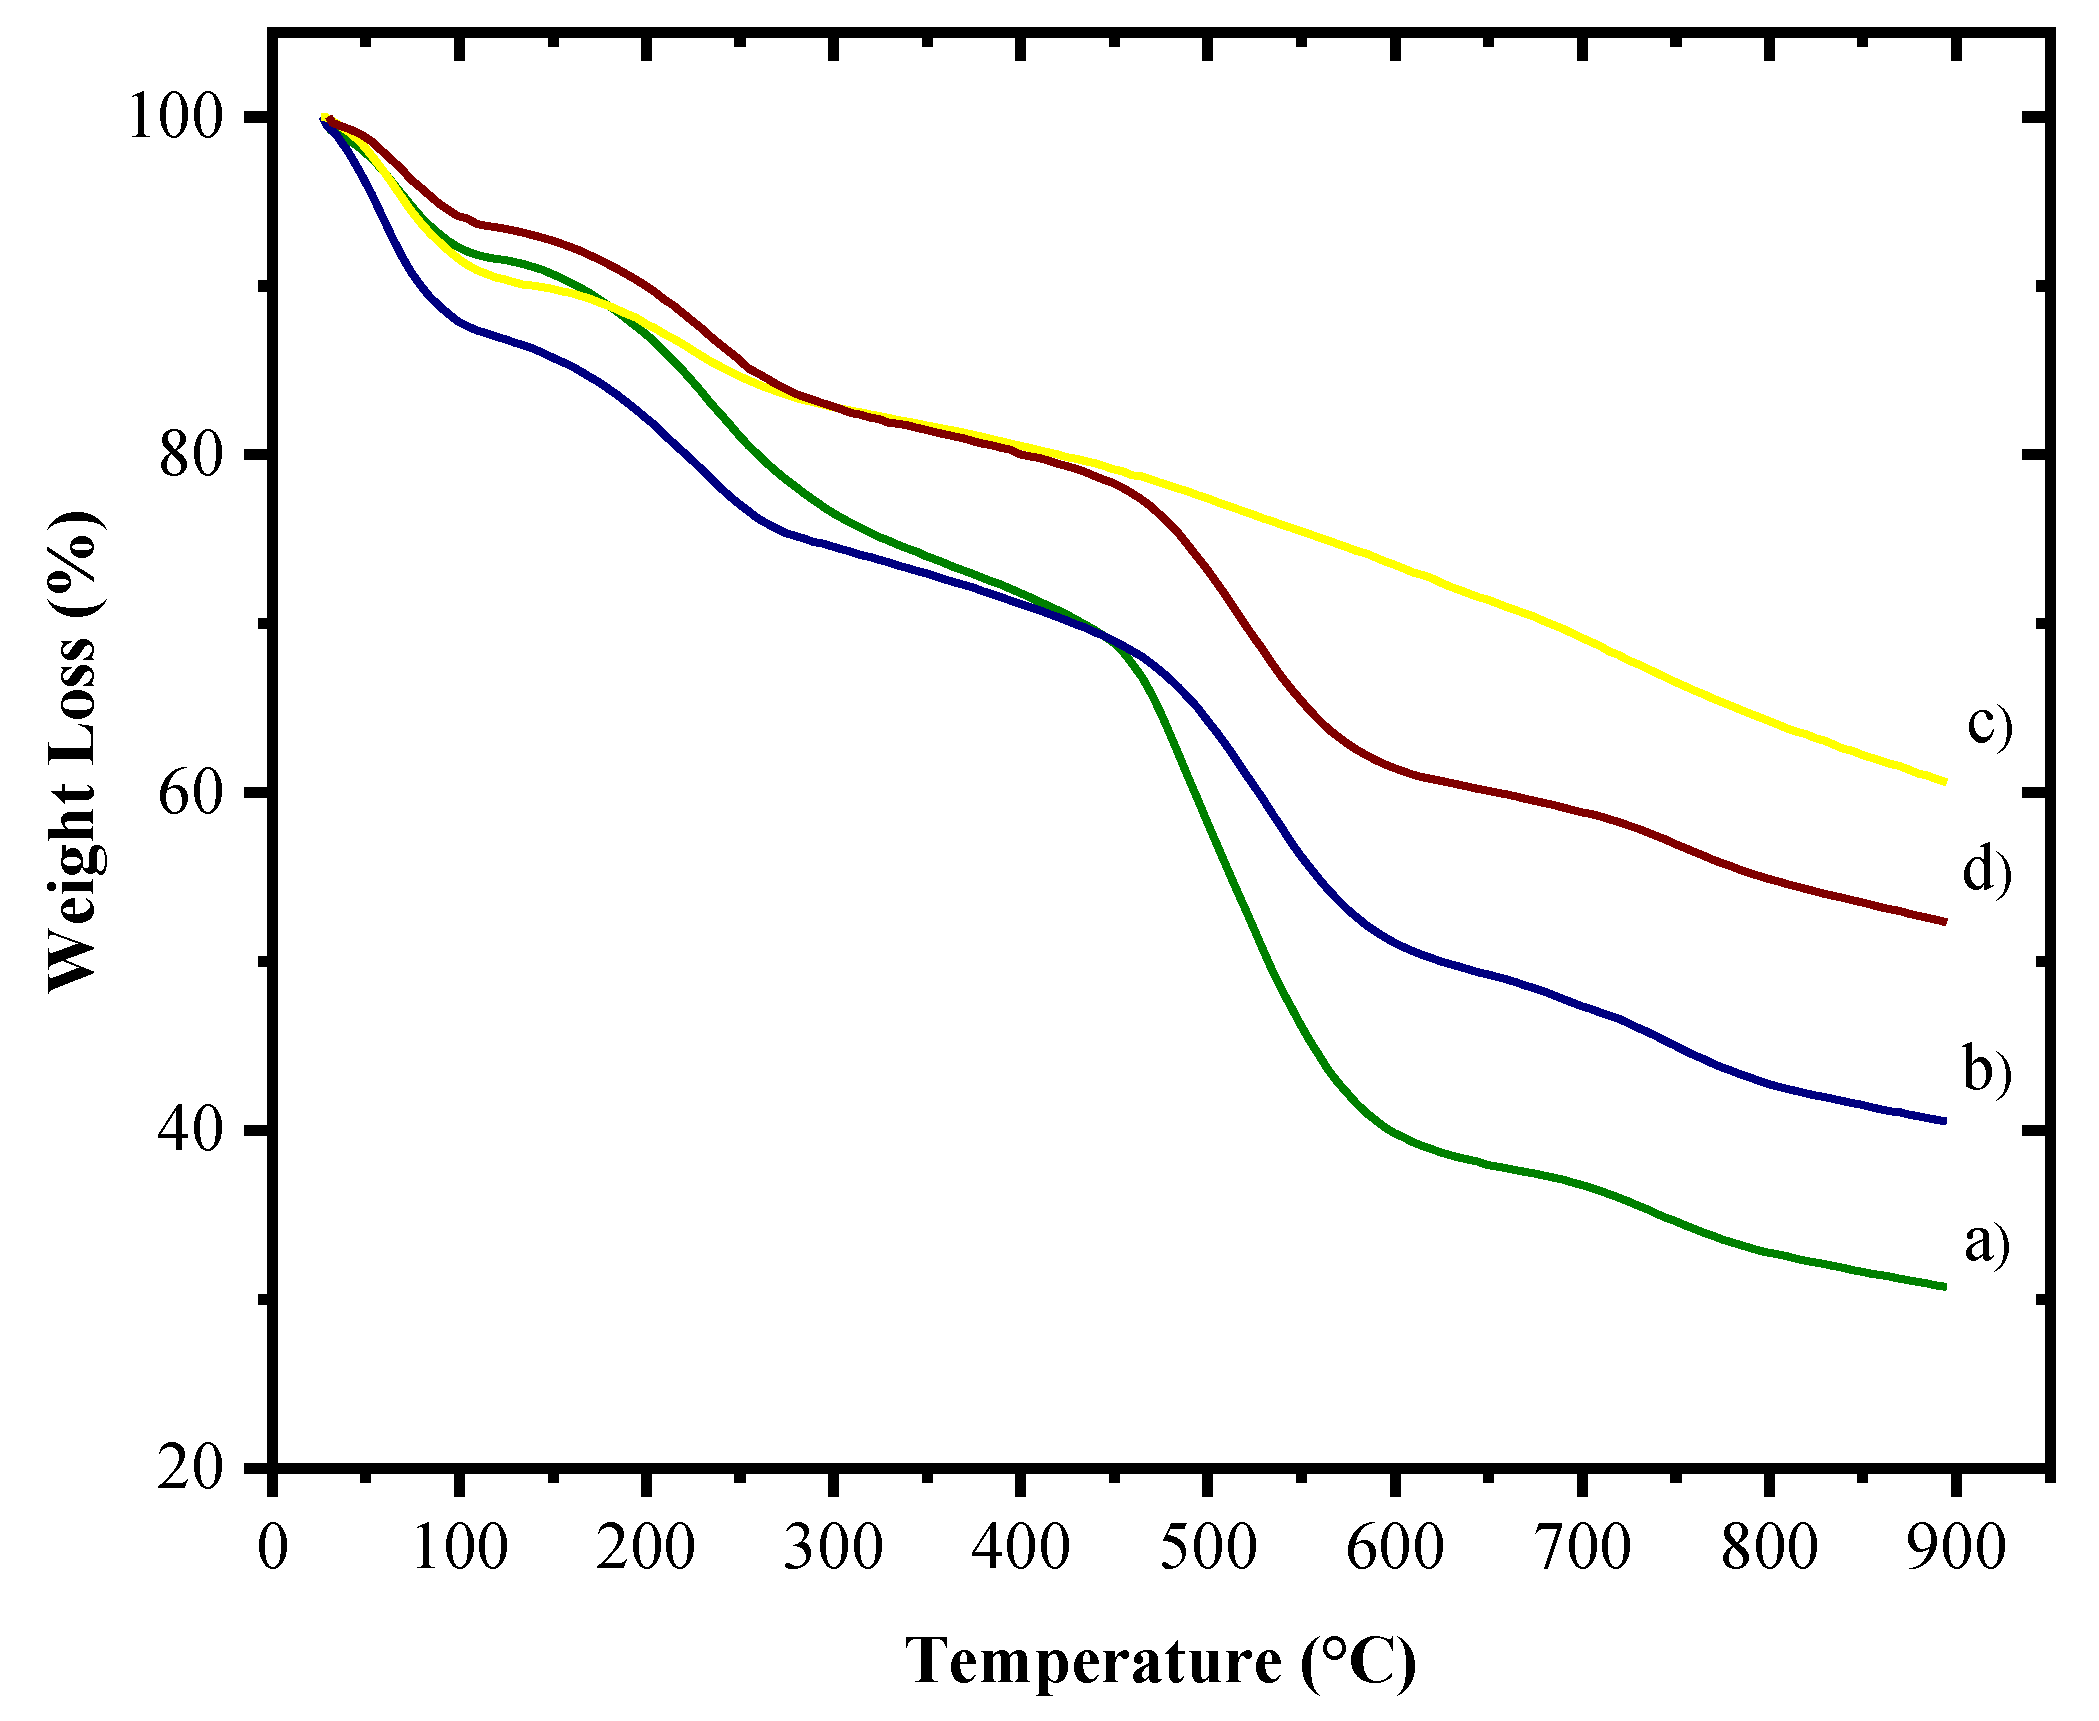
Figure 9 shows thermogravimetric curves of PANI and nanocomposites of SiO2-PANI, CeO2-PANI, and TiO2A-PANI.
The nanocomposites show three stages of weight loss in the studied temperature range by TGA. According to the thermograms, in the first stage of approximately 25 to 100 °C, there is a 10% weight loss of PANI and 6–13% of nanocomposites, attributed to the ejection of water molecules from the structure of the materials. In the second stage, weight losses of 12% for PANI and 9–12% for nanocomposites can be observed, occurring up to 280 °C and related to the loss of dopant (HCl), and low molecular weight remnants. In the third stage, taking place from 280 to 700 °C, the thermal stability is different, the weight loss varies from 14 and 28% for nanocomposites, whereas for PANI, it is 41%.
These results indicate that the nanocomposites of CeO2-PANI and TiO2A-PANI exhibit higher resistance to thermal degradation because they exhibit a total mass loss of 31 and 41%, respectively, at 700 °C. On the contrary, the SiO2-PANI nanocomposite shows a greater mass loss (53%) at the same temperature, just below PANI’s, which exhibits the greatest value (63%) of all studied samples. The improvement in nanocomposites’ thermal stability can be attributed to the strong interaction between the nanoparticles and free chains of PANI. It has been demonstrated that nanoparticles of SiO2, CeO2, and TiO2 exhibit strong thermal stability in the range of studied temperatures [52,53,54].

3.6. Open Circuit Potential (OCP) Study

Figure 10A shows the OCP variation of the studied samples (uncoated 1018 steel and coatings of PANI/AR, SiO2-PANI/AR, CeO2-PANI/AR, and TiO2A-PANI/AR) at different times of immersion in 3.5% NaCl. The bare steel displays a gradual change in the potential toward more negative values, reaching −0.74 V vs. SCE at the end of immersion (72 h). This change of OCP could be due to the oxidation of the metal directly exposed to NaCl solution. On the other hand, the OCP values of all coated samples exhibit more noble potentials than the bare steel, indicating the presence of a barrier (coating) acting as a water-resistant barrier between the metal surface and the electrolyte. The coatings of CeO2-PANI/AR and SiO2-PANI/AR show decay of OCP in the first hours of immersion (8 h), recording −0.651 and −0.65 V, respectively; after that time, the OCP values reach a steady-state (−0.658 and −0.647 V vs. SCE) at the end of the test. Likewise, the coatings of PANI/AR and TiO2A-PANI/AR exhibit negative displacements of OCP in the first 24 h but later shift toward more positive values, reaching −0.571 V and −0.412 V, respectively; this latter one is exhibiting the most positive potential. The OCP variation toward more positive potentials is attributed to the metal surface protection and anti-corrosion properties of the coatings [55].

3.7. Tafel Curves

The potentiodynamic polarization (Tafel) curves for the uncoated 1018 steel sample and PANI/AR, SiO2-PANI/AR, CeO2-PANI/AR, and TiO2A-PANI/AR coatings are given in Figure 10B. The electrochemical parameters, such as i c o r r , E c o r r , β A ,   and   β C , were obtained by the Tafel extrapolation method and shown in in Table 1, including the parameters of C R   and   η P R O T ( % ) , according to Equations (1) and (2).
From these, it can be seen that the value of i c o r r for the PANI/AR coating (0.079 μA cm−2) is much lower compared to that of uncoated steel (2.418 μA cm−2), which proves that this coating has good properties as a barrier for ion diffusion [56]. The coatings made of SiO2 and TiO2A nanoparticles show a decrease of i c o r r values compared to the PANI/AR coating, which is indicative of a better anti-corrosion protection provided by these nanocomposites, unlike the CeO2-PANI/AR coating that exhibits the highest i c o r r value (0.147 μA cm−2). These results show that the TiO2A-PANI coating has the best anti-corrosion properties with i c o r r of 0.018 μA cm−2, followed by SiO2-PANI/AR with the value of 0.073 μA/cm2.
As was mentioned above, E c o r r of the formulated coatings shift toward more positive values with respect to the bare sample, which can be interpreted as better control of the anodic and cathodic reactions in the corrosion process due to the barrier properties of the coatings [57]. This can be confirmed by the values of anodic slopes β A , and to a smaller extent, those of cathodic slopes β C , which decrease: that is, the anti-corrosion systems studied exhibit a mixed control in the obtained Tafel curves. On other hand, it can be observed that the system with the highest corrosion rate is due to bare steel (1.106 mpy) exposed to the corrosive medium, where the probable formation of different iron compounds (i.e., oxides) would be expected. On the contrary, the corrosion rate decreases by up to two or three orders of magnitude in the presence of the different nanocomposites.
Finally, the calculations of anti-corrosion protection efficiency η P R O T ( % ) shown in Table 1 demonstrate that the TiO2A-PANI/AR system has the best corrosion resistance properties (98.63%), followed by the SiO2-PANI/AR (97.35%) and PANI/AR systems (97.10%), with CeO2-PANI/AR being the least efficient (94.28%), which is consistent with the values of C R described previously.

3.8. Electrochemical Impedance Spectroscopy

Figure 11 shows Nyquist and Bode diagrams (phase angle vs. frequency) for the uncoated 1018 steel sample and the PANI/AR, SiO2-PANI/AR, CeO2-PANI/AR, and TiO2A-PANI/AR coatings.
Nyquist plots (Figure 11) exhibit significant variations in impedance diagrams of different coatings containing PANI mainly. In the case of uncoated steel, the apparent formation of a semicircle is evident across the entire frequency range with lower impedance values (Figure 11a), which indicates an active behavior in the oxidation of steel. On the contrary, the samples coated with PANI and nanoparticles of metal oxides display higher impedance values, where different semicircles are formed across the entire frequency range. The capacitive behavior at high frequencies is related to the anti-corrosion properties of each material, while in the region of low frequencies, this contribution could be due to a diffusion process at the metal/coating interface [58], mainly diffusion of oxygen and/or corrosive (i.e., chloride) ions. In both cases, the larger the impedance magnitudes, the greater the steel protection. Taking into consideration that the TiO2A-PANI/AR system exhibits the highest impedance values, this coating might be deemed to offer the highest protection of steel immersed in 3.5% NaCl solution.
Bode diagrams obtained for steel, PANI/AR, SiO2-PANI/AR, CeO2-PANI/AR, and TiO2A-PANI/AR are showed in Figure 11. In these plots, at least two angle maximums are detected in the entire range of frequencies. Additionally, in the presence of different coatings, an increase in angle values is seen from the beginning of the scan (high frequencies), related to the semiconducting properties of the coating, that is, the higher the angle value, the greater is its contribution and/or the lower the electron conductivity. Moreover, other maximums appear due to phenomena occurring through the metal/coating/solution interface, as will be discussed further below.
To analyze impedance diagrams, equivalent circuits shown in Figure 12 were used, where R s is the solution resistance, Q c o a t   and   R p o r e represent the capacitance and resistance of coating pore, except for steel, in where the likely formation of iron oxides can be considered. The Q d l element is the double-layer capacitance of the metal surface, and R c t is the metal charge transfer resistance. Figure 12b also exhibits a third arrangement of the constant phase element Q d i f and a resistance R d i f , associated with the diffusion process through the metal/coating interface.
The constant phase element ( C P E ) is generally used to describe a phase change independent of the frequency between an applied potential and its response in the current, which can be represented as a function of impedance:
Z ( C P E ) = Y 0 1 ( j ω ) n
where Y 0 is a constant value of C P E , ω is the angular frequency (in rad s−1), j is the imaginary number j 2 = −1, and   n is the C P E exponent. According to the n values, C P E can represent resistance ( Z ( C P E ) = R , n = 0), capacitance ( Z ( C P E ) = R , n = 1), inductance ( Z ( C P E ) = R , n = −1), or Warburg impedance for n = 0.5 [59].
The Y 0 value can be related to the coating capacitance C c o a t through the Equation:
C c = Y 0 ( ω n · m ) n 1
where ω n · m is the angular frequency at which the maximum imaginary impedance Z occurs.
The fittings performed to Nyquist and Bode plots for bare steel, and PANI-based anti-corrosion systems, are represented by a continuous line in Figure 11, showing a good fit for all experimental impedance diagrams. The parameters obtained from the simulation are given in Table 2.
From the values shown in Table 2, it is worth mentioning that the measurement of R p o r e   and   Q c o a t parameters are of utmost importance for each system since both are related to the semiconducting properties of the coatings. As can be seen, the resistive parameter R p o r e increases for PANI-based coatings in relation to the uncoated steel because the coatings applied on metal samples act as a barrier that prevents free substrate corrosion. In this case, the TiO2A-PANI/AR coating is the one exhibiting the highest pore resistance (6140 Ω cm2), followed by SiO2-PANI/AR (5028 Ω cm2) and CeO2-PANI/AR (3700 Ω cm2), whereas the PANI/AR system shows the lowest R p o r e of all evaluated coatings (3400 Ω cm2). However, the bare steel exhibits far lower resistance than the others (70.54 Ω cm2) due to the formation of iron compounds on the steel surface because of the lack of any barrier between its surface and the corrosive medium.
In another instance, the values of Q c o a t reflect that the uncoated material shows the greatest tendency toward electrolyte absorption (1.34 × 10⁻³ F cm−2) compared to the anti-corrosion systems, which diminish several orders of magnitude, the PANI/AR system having the lowest capacitance value (6.71 × 10⁻⁹ F cm−2). However, the systems based on nanoparticles and PANI (TiO2A-PANI, SiO2-PANI/AR, and CeO2-PANI/AR) also exhibit low capacitance values (1.061 × 10⁻⁸, 9.67 × 10⁻⁷, and 4.75 × 10⁻⁷ F cm−2), indicating that these materials have low electrolyte absorption tendency.
The charge transfer resistance ( R c t ) is associated with the kinetics of electrochemical reactions at metal-coating-electrolyte interfaces. According to the results shown in Table 2, all anti-corrosion systems increase by several orders their values of R c t compared to the bare steel (1143 Ω cm2), which reflects the protective properties of the coatings. Thus, the TiO2A-PANI/AR system exhibits the highest charge transfer resistance (6.88 × 10⁴ Ω cm2), followed by the SiO2-PANI/AR (4.56 × 10⁴ Ω cm2), CeO2-PANI/AR (3.80 × 10⁴ Ω cm2), and PANI/AR (1.78 × 10⁴ Ω cm2) systems. This is supported by the low double-layer capacitance values ( Q d l ) for all the anti-corrosion systems, suggesting a low transfer of species at the interface.
On the other hand, the diffusion parameter R d i f is related to the capacity of a coating to prevent the free diffusion of ions between the metal surface and the electrolyte; this means that greater protection of the coating is related to lower mobility of ions through it, which, like other resistances ( R p o r e   and   R c t ), is related to the barrier properties of the material. Thus, the TiO2A-PANI/AR system is the one exhibiting the highest diffusion resistance (3.84 × 10⁵ Ω cm2), followed by PANI/AR (1.54 × 10⁵ Ω cm2), SiO2-PANI/AR (1.11 × 10⁵ Ω cm2), and CeO2-PANI/AR (5.68 × 10⁴ Ω cm2). According to these values, the diffusion process through the coating is lower for the TiO2A-PANI/AR system, offering greater protection of the steel compared to other nanocomposites.
Additionally, the coatings protection efficiency η P R O T ( % ) was determined using Equation (3). The higher efficiencies are determined for the coatings based on nanoparticles and PANI (TiO2A-PANI/AR, SiO2-PANI/AR, and CeO2A-PANI/AR), reaching values of (98.34, 97.49, and 96.99%, respectively); whereas the lowest efficiency (93.58%) is obtained for PANI/AR coating, which is consistent with impedance parameters reported previously.

Anti-Corrosion Mechanism of Coatings

The barrier properties of anti-corrosion systems studied are due to the synergistic effect existing between their components (PANI/AR and NPs/PANI/AR). The formation of a uniform barrier film of the alkydalic resin strongly bound to the steel surface and PANI is expected, thus enhancing a uniform protective film [60]. On the other hand, there is a sense that the incorporation of metal oxide nanoparticles into the polymer matrix inhibits the electrolyte permeation through the metal-coating interface, improving not only the efficiency of corrosion protection of the material but also its adhesion to the substrate. The use of additives at the nanometer scale is known to improve the barrier properties of polymers by diminishing their porosity [61].

3.9. Immersion Tests

In addition, Table 3 shows the variation of Tafel parameters obtained at different immersion times (3, 8, 24, and 72 h) of the anti-corrosion systems studied.
According to the parameters, the i c o r r values for all cases exhibit a slight decrease in their magnitudes, and the TiO2A-PANI/AR system still has the best anti-corrosion properties, given the lowest value of i c o r r (0.059 μA cm−2). The displacement of E c o r r toward more negative values as well as the decrease in anodic slopes β A and increase in the cathodic ones β C suggest a mixed control of anodic and cathodic reactions of the system due to the dense thin film formed by the coating, adhered to the metal surface. Furthermore, a slight decrease in the protection efficiency ( η P R O T ) through the immersion time is observed. Thus, the TiO2A-PANI/AR system exhibits the highest efficiency (97.93%) and the CeO2-PANI/AR, the lowest (90.96%), at the end of immersion (72 h). Despite these results, it can be interpreted that all the systems have good anti-corrosion properties due to the barrier effect they provide and the tendency to passivate the metal surface [62,63].
According to the diffusion process through the coatings is lower for the TiO2A-PANI/AR system, offering greater protection of the steel compared to other nanocomposites. Based on the Tafel parameters, the coatings made with NPs of TiO2A and SiO2 present the highest protection efficiencies, even for the initial and final immersion times (98.63 and 97.93% for TiO2A/AR and 97.35 and 97.52% for SiO2/AR), followed PANI/AR (97.10 and 97.27%), showing variations of less than 1% in their efficiencies. It is also important to note that these efficiencies are obtained using only a percentage of 0.5 wt.% of MO NPs compared to the works mentioned above. The lowest efficiencies are those exhibited by CeO2-PANI/AR (94.28 and 90.96%) with a variation of no more than 5%, but they are higher than the corresponding referenced above.
Similarly, the results obtained by EIS reflect admissible protective properties of the studied systems, despite the smaller magnitudes of the R c t values shown in Table 2 compared to those cited in the literature, since, as mentioned in the work of Sasikumar et al. [64], the R c t values increase as the concentration of nanocomposite or NPs in the coating increases, and it should be remembered that in this study, low concentrations were used (0.5% in wt), trying not to significantly influence the anti-corrosion contribution of the studied materials. This is confirmed by the high protection efficiency ( η P R O T ) shown for all the systems evaluated.
To sum up, the TiO2A-PANI/AR coating has the best anti-corrosion properties of all the systems studied since it exhibits a constant behavior in different electrochemical evaluations and the most efficient results for all corrosion tests. The anti-corrosion properties exhibited by the coatings made in this work are attributed to the composition and the synthesis method used.

4. Conclusions

Nanocomposites of PANI-based MO (SiO2, CeO2, and TiO2A) were synthesized by in situ chemical oxidative polymerization by rapid mixing. The XRD, FTIR, and UV-vis analyses show that the protonated form of PANI (ES) was obtained. They also confirm the incorporation of MO in the polymeric mesh due to the observed displacements of peaks and bands of the spectra involved, resulting from the interaction of NPs with polymer macromolecules. The micrographs obtained by SEM and EDS results corroborate the incorporation of NPs into PANI. The electrochemical evaluation by Tafel curves and EIS demonstrated that all the coatings studied exhibit good anti-corrosion properties, having those produced with NPs (SiO2, CeO2, and TiO2A) the highest protection efficiencies. However, according to the results of immersion tests, the TiO2A-PANI/AR coating proved to have the best anti-corrosion properties of all the systems studied. Based on the results obtained with the synthesized anti-corrosion coatings, we propose as a strategy to evaluate other formulations using alkyd resins as dispersing medium and as an alternative synthesis route, and in situ chemical oxidative polymerization by rapid mixing for preparation of PANI and MO-based polymeric nanocomposites, in order to obtain successful syntheses in less time and also evaluate their performance at longer immersion times.

Author Contributions

F.R.R.-O., E.M.A.-E. and R.C.-S. conceived and designed the experiments; F.R.R.-O. performed the experiments; F.R.R.-O., E.M.A.-E. and R.C.-S. analyzed the data; E.M.A.-E. and R.C.-S. contributed reagents/materials/analysis tools; F.R.R.-O., E.M.A.-E. and R.C.-S. wrote the paper. All authors have read and agreed to the published version of the manuscript.

Funding

This research received no external funding.

Institutional Review Board Statement

Not Applicable.

Informed Consent Statement

Not Applicable.

Data Availability Statement

Data is available on request from the corresponding author.

Acknowledgments

E.M. Arce-Estrada and R. Cabrera-Sierra thank the SNI for the distinction of their membership and the stipend received. F.R. Rangel-Olivares acknowledge the CONACyT (Mexico) for the scholarship granted to conduct postgrads studies and the IPN for the academic support provided constantly. Instituto Politécnico Nacional (COFAA-IPN) assisted in meeting the publication costs of this article.

Conflicts of Interest

The authors declare no conflict of interest.

Nomenclature

ACSAnalytical grade
APSAmmonium persulfate
ARAlkydalic resin
CPEConstant phase element
CPsConducting polymers
EDSEnergy-dispersive X-ray spectroscopy
EISElectrochemical impedance spectroscopy
ESProtonated emeraldine
FRAFrequency Response Analyzer System
FT-IRFourier transform infrared
LBNon-protonated base
MOMetal oxide
NPNanoparticle
NPsNanoparticles
OCPOpen circuit potential
PAPolyacetylene
PANIPolyaniline
PEDOTPoly(ethylene dioxythiophene)
PPyPolypyrrole
PThPolythiophene
SCESaturated calomel electrode
SEMScanning electron microscopy
TGAThermogravimetric analysis
UV-visUltraviolet-visible
XRDX-ray diffraction
Symbols
C c o a t Coating capacitance
C R Corrosion rate
E c o r r Corrosion potential
E W Average steel equivalent weight
i c o r r Corrosion current
i c o r r 0 Corrosion current of uncoated steel sample
i c o r r c o a t Corrosion current of coated steel sample
K Constant that defines the corrosion rate units
j Imaginary number
n CPE exponent
Q c o a t Capacitance of coating pore
Q d l Double-layer capacitance of the metal surface
Q d i f Diffusional capacitance
R c t Charge transfer resistance of a coated sample
R c t 0 Charge transfer resistance of an uncoated sample
R d i f Diffusional resistance
R p o r e Resistance of coating pore
Y 0 Constant value of CPE
Z Real impedance
Z Imaginary impedance
Greek Symbols
β A Anodic slope
β C Cathodic slope
η P R O T ( % ) Protection efficiency
ρ Steel density
ω Angular frequency

References

  1. Riaz, U.; Nwaoha, C.; Ashraf, S.M. Recent advances in corrosion protective composite coatings based on conducting polymers and natural resource derived polymers. Prog. Org. Coat. 2014, 77, 743–756. [Google Scholar] [CrossRef]
  2. Wicks, Z.W., Jr. Corrosion Protection by Coatings, Federation of Societies for Coatings Technology; Wiley: Philadelphia, PA, USA, 1987; p. 7. [Google Scholar]
  3. Tiu, B.D.B.; Advincula, R.C. Polymeric corrosion inhibitors for the oil and gas industry: Design principles and mechanism. Reac. Funct. Polym. 2015, 95, 25–45. [Google Scholar] [CrossRef]
  4. Deshpande, P.P.; Jadhav, N.G.; Gelling, V.J.; Sazou, D. Conducting polymers for corrosion protection: A review. J. Coat. Technol. Res. 2014, 11, 473–494. [Google Scholar] [CrossRef]
  5. Eftekhari, A. Nanostructured Conductive Polymers; Wiley: Chichester, UK, 2010. [Google Scholar]
  6. Muhammad, E.; Mullane, O.; Anthony, P.; Graeme, A. Storing energy in plastics: A review on conducting polymers & their role in electrochemical energy storage. RSC Adv. 2015, 5, 11611–11626. [Google Scholar]
  7. Snook, G.A.; Bhatt, A.I.; Abdelhamid, M.E.; Best, A.S. Role of H+ in Polypyrrole and Poly(3,4-ethylenedioxythiophene) Formation Using FeCl3∙6H2O in the Room Temperature Ionic Liquid, C4mpyrTFSI. Aust. J. Chem. 2012, 65, 1513–1522. [Google Scholar] [CrossRef]
  8. Otero, T.F. Biomimetic Conducting Polymers: Synthesis, Materials, Properties, Functions, and Devices. Polym. Rev. 2013, 53, 311–351. [Google Scholar] [CrossRef]
  9. Camalet, J.L.; Lacroix, J.C.; Aeiyach, S.; Lacaze, P.C. Characterization of polyaniline films electrodeposited on mild steel in aqueous p-toluenesulfonic acid solution. J. Electroanal. Chem. 1998, 445, 117–124. [Google Scholar] [CrossRef]
  10. De Paoli, M.-A.; Waltman, R.J.; Diaz, A.F.; Bargon, J. Conductive composties form poly(vinyl chloride) and polypyrrole. J. Chem. Soc. Chem. Commun. 1984, 15, 1015–1016. [Google Scholar] [CrossRef]
  11. Pei, Q.; Bi, X. Electrochemical preparation of electrically conducting polyurethane/polyaniline composite. J. Appl. Polym. Sci. 1989, 38, 1819–1820. [Google Scholar] [CrossRef]
  12. Park, Y.H.; Park, C.R. Preparation of conducting polyacrylonitrile/polyaniline composite films by electrochemical synthesis and their electroactivity. Synth. Met. 2001, 118, 187–192. [Google Scholar] [CrossRef]
  13. Gazzoti, W.A., Jr.; Casalbore-Miceli, G.; Mitzakoff, S.; Geri, A.; Gallazi, M.C.; De Paoli, M.-A. Conductive polymer blends as electrochromic materials. Eletrochim. Acta. 1999, 44, 1965–1971. [Google Scholar] [CrossRef]
  14. Karakisla, M.; Sac, M.; Akbulut ak, U. Conductive polyaniline/poly(methylmethacrylate) films obtained by electropolymerization. J. Appl. Polym. Sci. 1996, 59, 1347–1354. [Google Scholar] [CrossRef]
  15. Talo, A.; Passiniemi, P.; Forsen, O.; Ylasaari, S. Polyaniline/epoxy coatings with good anti-corrosion properties. Synth. Met. 1997, 85, 1333–1334. [Google Scholar] [CrossRef]
  16. Talo, A.; Passiniemi, P.; Forsen, O.; Ylasaari, S. Corrosion protective polyaniline epoxy blend coatings on mild steel. Synth. Met. 1999, 102, 1394–1395. [Google Scholar] [CrossRef]
  17. Wessling, B.; Posdorfer, J. Nanostructures of the dispersed organic metal polyaniline responsible for macroscopic effects in corrosion protection. Synth. Met. 1999, 102, 1400–1401. [Google Scholar] [CrossRef]
  18. Wang, J. Polyaniline coatings: Anionic membrane nature and bipolar structures for anticorrosion. Synth. Met. 2002, 132, 53–56. [Google Scholar] [CrossRef]
  19. Sun, L.; Liu, H.; Clark, R.; Yang, S.C. Double-strand polyaniline. Synth. Met. 1997, 84, 67–68. [Google Scholar] [CrossRef]
  20. Yang, J.P.; Rannou, P.; Planes, J.; Pron, A.; Nechtschein, M. Preparation of low density polyethylene based polyaniline conducting polymer composites with low percolation threshold via extrusion. Synth. Met. 1998, 93, 169–173. [Google Scholar] [CrossRef]
  21. Ikkala, O.T.; Laakkso, J.; Väkipartab, K.; Ruohonen, H.; Järvinen, H.; Taka, T.; Passiniemi, P.; Osterholm, J.-E.; Cao, Y.; Andreatta, A.; et al. Counter-ion induced processibility of polyaniline: Conducting melt processible polymer blends. Synth. Met. 1995, 69, 97–100. [Google Scholar] [CrossRef]
  22. Jousseaume, V.; Morsli, M.; Bonnet, A.; Tesson, O.; Lefrant, S. Electrical properties of polyaniline–polystyrene blends above the percolation threshold. J. Appl. Polym. Sci. 1998, 67, 1205–1208. [Google Scholar] [CrossRef]
  23. Roichman, Y.; Titelman, G.I.; Silverstein, M.S.; Siegman, A.; Markis, M. Polyaniline synthesis: Influence of powder morphology on conductivity of solution cast blends with polystyrene. Synth. Met. 1999, 98, 201–209. [Google Scholar] [CrossRef]
  24. Pron, A.; Nicolau, Y.; Genoud, F.; Nechtschein, M. Flexible highly transparent, and conductive polyaniline-cellulose acetate composite films. J. Appl. Polym. Sci. 1997, 63, 971–977. [Google Scholar] [CrossRef]
  25. Lenz, D.M.; Delamar, M.; Ferreira, C.A. Methodology for zinc phosphate pigment incorporation into polypyrrole matrix. J. Appl. Electrochem. 2005, 35, 1051–1057. [Google Scholar] [CrossRef]
  26. Brusic, V.; Angelopoulos, M.; Graham, T. Use of polyaniline and its derivatives in corrosion protection of copper and silver. J. Electrochem. Soc. 1997, 144, 436–442. [Google Scholar] [CrossRef]
  27. Tallman, D.E.; Spinks, G.; Dominis, A.; Wallace, G.G.; Tallman, D.E. Electroactive conducting polymers for corrosion control. J. Solid State Electrochem. 2002, 6, 73–84. [Google Scholar] [CrossRef]
  28. Kalendová, A.; Veselý, D.; Stejskal, J. Organic coatings containing polyaniline and inorganic pigments as corrosion inhibitors. Prog. Org. Coat. 2008, 62, 105–116. [Google Scholar] [CrossRef]
  29. Shi, H.; Liu, F.; Yang, L.; Han, E. Characterization of protective performance of epoxy reinforced with nanometer-sized TiO2 and SiO2. Prog Org Coat. 2008, 62, 359. [Google Scholar] [CrossRef]
  30. Caldas, C.M.; Calheiros, L.F.; Soares, B.G. Silica-polyaniline hybrid materials prepared by inverse emulsion polymerization for epoxy-based anticorrosive coating. J. Appl. Polym. Sci. 2017, 134, 45505–45514. [Google Scholar] [CrossRef]
  31. Radhakrishnan, S.; Siju, C.R.; Debajyoti Mahanta Satish, P.; Giridhar, M. Conducting polyaniline-nano-TiO2 composites for smart corrosion resistant coatings. Electrochim. Acta 2009, 54, 1249–1254. [Google Scholar] [CrossRef]
  32. Galliano, P.; Damborenea, J.J.D.; Pascual, M.J.; Duran, A. Sol-Gel Coatings on 316L Steel for Clinical Applications. J. Sol Gel Sci. Technol. 1998, 13, 723–727. [Google Scholar] [CrossRef]
  33. Vasconcelos, D.C.L.; Carvalho, J.A.N.; Mantel, M.; Vasconcelos, W.L. Corrosion resistance of stainless steel coated with sol-gel silica. J. Non-Cryst. Solids 2000, 273, 135–139. [Google Scholar] [CrossRef]
  34. Nazeri, A.; Trzaskoma-Paulette, P.P.; Bauer, D. Synthesis and Properties of Cerium and Titanium Oxide Thin Coatings for Corrosion Protection of 304 Stainless Steel. J. Sol Gel Sci. Technol. 1997, 10, 317–331. [Google Scholar] [CrossRef]
  35. Lukachova, L.V.; Shkerin, E.A.; Puganova, E.A.; Karyakina, E.E.; Kiseleva, S.G.; Orlov, A.V.; Karpacheva, G.P.; Karyakin, A.A. Electroactivity of chemically synthesized polyaniline in neutral and alkaline aqueous solutions: Role of self-doping and external doping. J. Electroanal. Chem. 2003, 544, 59–63. [Google Scholar] [CrossRef]
  36. Kang, E.T.; Neoh, K.G.; Tan, K.L. Polyaniline: A Polymer with Many Interesting Intrinsic Redox States. Prog. Polym. Sci. 1998, 23, 277–324. [Google Scholar] [CrossRef]
  37. Ciric-Marjanovic, G. Recent Advances in Polyaniline Research: Polymerization Mechanisms, Structural Aspects, Properties and Applications. Synth. Met. 2013, 177, 1–47. [Google Scholar] [CrossRef]
  38. Huang, J.; Kaner, B. Nanofiber Formation in the Chemical Polymerization of Aniline: A Mechanistic Study. Angew. Chem. Int. Ed. 2004, 43, 5817–5821. [Google Scholar] [CrossRef]
  39. Khatoon, H.; Ahmed, S. A review on conducting polymer reinforced polyurethane composites. Ind. Eng. Chem. Res. 2017, 53, 1–22. [Google Scholar] [CrossRef]
  40. Pawar, S.G.; Patil, S.L.; Chougule, M.A.; Mane, A.T.; Jundale, D.M.; Patil, V.B. Synthesis and Characterization of Polyaniline: TiO2 Nanocomposites. Int. J. Polymer. Mater. 2010, 59, 777–785. [Google Scholar] [CrossRef]
  41. Mostaferi, A.; Zolriasatein, A. Synthesis and characterization of conducting polyaniline nanocomposites containing ZnO nanorods. Prog. Nat. Sci. 2012, 22, 273–280. [Google Scholar] [CrossRef] [Green Version]
  42. Wang, Y.; Jing, X. Formation of Polyaniline Nanofibers: A Morphological Study. J. Phys. Chem. B 2008, 112, 1157–1162. [Google Scholar] [CrossRef]
  43. Sathiyanarayanan, S.; Azim, S.S.; Venkatachari, G. Preparation of polyaniline–TiO2 composite and its comparative corrosion protection performance with polyaniline. Synth. Met. 2007, 157, 205–213. [Google Scholar] [CrossRef]
  44. Anilkumar, P.; Jayakannan, M. New Renewable Resource Amphiphilic Molecular Design for Size-Controlled and Highly Ordered Polyaniline Nanofibers. Langmuir 2006, 22, 5952–5957. [Google Scholar] [CrossRef]
  45. Kumar, E.; Selvarajan, P.; Muthuraj, D. Preparation and characterization of polyaniline/cerium dioxide (CeO2) nanocomposite via in situ polymerization. J. Mater. Sci. 2012, 47, 7148–7156. [Google Scholar] [CrossRef]
  46. Najafi, V.; Ahmadi, E.; Ziaee, F.; Omidian, H.; Sedaghat, H. Polyaniline-Modified TiO2, a Highly Effective Photo-catalyst for Solid-Phase Photocatalytic Degradation of PVC. J. Polym. Environ. 2019, 27, 784–793. [Google Scholar] [CrossRef]
  47. Babazadeh, M.; Zalloi, F.; Olad, A. Fabrication of Conductive Polyaniline Nanocomposites Based on Silica Nanoparticles via In-Situ Chemical Oxidative Polymerization Technique. Synth. React. Inorg. Met. Org. Nano Metal Chem. 2015, 45, 86–91. [Google Scholar] [CrossRef]
  48. Bian, C.; Yu, Y.; Xue, G. Synthesis of Conducting Polyaniline/TiO2 Composite Nanofibres by One-step In Situ Polymerization Method. Appl. Polym. Sci. 2006, 104, 21–26. [Google Scholar] [CrossRef]
  49. Luvita, N.R.D.; Kusumawati, D.H.; Putri, N.P.; Supardi, Z.A. Synthesis of PANi-SiO2 Nanocomposite with In-Situ Polymerization Method: Nanoparticle Silica (NPS) Amorphous and Crystalline Phase. J. Phys. Conf. Ser. 2018, 997, 012052. [Google Scholar]
  50. Babitha, K.K.; Sreedevi, A.; Priyanka, K.P.; Sabu, B.; Varghese, T. Structural characterization and optical studies of CeO2 nanoparticles synthesized by chemical precipitation. IJPAP 2015, 53, 596–603. [Google Scholar]
  51. Liu, F.; He, Y.; Huh, J. Study on the synthesis and characterization of PANi/nano-CeO2 composites. In Solid State Phenomena; Trans Tech Publications Ltd: Stafa-Zurich, Switzerland, 2007; pp. 287–290. [Google Scholar]
  52. Li, X.; Dai, N.; Wang, G.; Song, X. Water-Dispersible Conducting Polyaniline/Nano-SiO2 Composites without Any Stabilizer. J. Appl. Polym. Sci. 2008, 107, 403–408. [Google Scholar] [CrossRef]
  53. Wang, S.; Huang, Z.; Wang, J. Thermal stability of several polyaniline/rare earth oxide composites: Polyaniline/CeO2 composites. J. Therm. Anal. Calorim. 2011, 107, 1199–1203. [Google Scholar] [CrossRef]
  54. Li, X.; Chen, W.; Bian, C.; He, J.; Xu, N.; Xue, G. Surface modification of TiO2 nanoparticles by polyaniline. Appl. Surf. Sci. 2003, 217, 16–22. [Google Scholar] [CrossRef]
  55. Mareci, D.; Cailean, A.; Ciurescu, G.; Sutiman, D. Electrochemical Determination of the Corrosion Resistance of NiCr Dental Casting Alloys. Open Corros. J. 2010, 3, 45–53. [Google Scholar] [CrossRef]
  56. Alam, A.; Sherif, S.M.; Al-Zahrani, S.M. Fabrication of various epoxy coatings for offshore applications and evaluating their mechanical properties and corrosion behavior. Int. J. Electrochem. Sci. 2013, 8, 3121–3131. [Google Scholar]
  57. Balaji, J.; Sethuraman, M.G. Chitosan-doped-hybrid/TiO2 nanocomposite based sol-gel coating forthe corrosion resistance of aluminum metal in 3.5% NaCl medium. Int. J. Biol. Macromol. 2017, 104, 1730–1739. [Google Scholar]
  58. Grgur, B.N.; Gvozdenović, M.M.; Mišković-Stanković, V.B.; Kačarević-Popović, Z. Corrosion behavior and thermal stability of electrodeposited PANI/epoxy coating system on mild steel in sodium chloride solution. Prog. Org. Coat. 2016, 56, 214–219. [Google Scholar] [CrossRef]
  59. Mansfeld, F. Recording and Analysis of AC Impedance Data for Corrosion Studies. J. Appl. Sci. Eng. 1981, 37, 301–307. [Google Scholar] [CrossRef]
  60. Sathiyanarayanan, S.; Muthukrishnan, S.; Venkatachari, G.; Trivedi, D.C. Corrosion protection of steel by polyaniline (PANI) pigmented paint coating. Prog. Org. Coat. 2005, 53, 297–301. [Google Scholar] [CrossRef]
  61. Sun, Q.; Schork, F.J.; Deng, Y. Water-based polymer/clay nanocomposite suspension for improving water and moisture barrier in coating. Compos. Sci. Technol. 2007, 67, 1823–1829. [Google Scholar] [CrossRef]
  62. Radhakrishnan, S.; Sonawane, N.; Siju, C.R. Epoxy powder coatings containing polyaniline for enhanced corrosion protection. Prog. Org. Coat. 2009, 64, 383–386. [Google Scholar] [CrossRef]
  63. Wicks, Z.W.; Jone, F.N.; Pappas, S.P. Organic Coatings: Science and Technology; Wiley: New Jersey, NJ, USA, 2007. [Google Scholar]
  64. Sasikumar, Y.; Kumar, A.M.; Gasem, Z.M.; Ebenso, E.E. Hybrid nanocomposite from aniline and CeO2 nanoparticles: Surface protective performance on mild steel in acidic environment. Appl. Surf. Sci. 2015, 330, 207–215. [Google Scholar] [CrossRef]
Figure 1. Schematic representation of PANI synthesis by rapid mixing oxidative polymerization of aniline.
Coatings 11 00653 g001
Figure 2. Schematic representation of SiO2, TiO2, and CeO2-PANI nanocomposites synthesis by in situ chemical oxidative polymerization by rapid mixing.
Coatings 11 00653 g002
Figure 3. Photography of (a) bare metal and anti-corrosion systems of: (b) PANI/AR, (c) SiO2-PANI/AR, (d) CeO2-PANI/AR, and (e) TiO2A-PANI/AR.
Coatings 11 00653 g003
Figure 4. XRD patterns of (a) PANI, (b) SiO2, SiO2-PANI, (c) CeO2, CeO2-PANI, and (d) TiO2 A, TiO2A-PANI; nanoparticles (black) and nanocomposites (red).
Coatings 11 00653 g004
Figure 5. FTIR spectra for (a) PANI and nanocomposites of (b) SiO2-PANI, (c) CeO2-PANI, and (d) TiO2 A-PANI.
Coatings 11 00653 g005
Figure 6. UV-vis spectra for (a) PANI and nanocomposites of (b) SiO2-PANI, (c) CeO2-PANI, and (d) TiO2 A-PANI.
Coatings 11 00653 g006
Figure 7. SEM micrographs of PANI: (a) 20,000 and (b) 30,000 magnification.
Coatings 11 00653 g007
Figure 8. EDS spectra and micrographs obtained at 20,000 magnification of nanocomposites: (a) SiO2/PANI, (b) CeO2/PANI, and (c) TiO2A/PANI.
Coatings 11 00653 g008
Figure 9. TGA curves of (a) PANI (olive green) and nanocomposites of (b) SiO2-PANI (blue), (c) CeO2-PANI (yellow), and (d) TiO2A-PANI (burgundy).
Coatings 11 00653 g009
Figure 10. (A) OCP variation and (B) Tafel curves of: (a) uncoated 1018 steel (red), coatings of (b) PANI/AR (olive green), (c) SiO2-PANI/AR (blue), (d) CeO2-PANI/AR (yellow), and (e) TiO2A-PANI/AR (burgundy).
Coatings 11 00653 g010
Figure 11. Nyquist and Bode diagrams of: (a) uncoated 1018 steel (gray) and coatings of (b) PANI/AR (olive green), (c) SiO2-PANI/AR (blue), (d) CeO2-PANI/AR (yellow), and (e) TiO2A-PANI/AR (burgundy). The continuous line represents the fit of experimental diagrams.
Coatings 11 00653 g011
Figure 12. Equivalent circuits for the systems of (a) uncoated 1018 steel; coatings of (b) PANI/AR, SiO2-PANI/AR, CeO2-PANI/AR, and TiO2A-PANI/AR.
Coatings 11 00653 g012
Table 1. Tafel parameters obtained for uncoated steel and PANI-base coatings immersed in 3.5% NaCl solution.
SamplesTafel Parameters
E c o r r
(V)
i c o r r
(μA cm−2)
β A
(V dec−1)
β C
(V dec−1)
C R
(mpy)
η P R O T
(%)
1018 STEEL−0.6982.4180.5150.0601.106-
PANI/RA−0.5220.0790.2250.1880.03697.10
SiO2-PANI/RA−0.4790.0730.3850.1240.03397.35
CeO2-PANI/RA−0.6370.1470.1940.1190.06794.28
TiO2A-PANI/RA−0.3620.0180.1950.1920.00898.63
Table 2. EIS parameters obtained for uncoated steel and PANI-based coatings immersed in 3.5% NaCl solution.
SamplesEIS Parameters
R s ( Ω   cm 2 ) Q c o a t ( F   cm 2 ) n R p o r e ( Ω   cm 2 ) Q d l ( F   cm 2 ) n R c t ( Ω   cm 2 ) Q d i f ( F   cm 2 ) n d i f R d i f ( Ω   cm 2 ) η P R O T ( % )
1018 STEEL49.51.34 × 10−30.8070.541.72 × 10−30.811143- --
PANI/RA1576.71 × 10−90.7934006.63 × 10−60.801.78 × 1044.74 × 10−60.601.54 × 10593.58
SiO2-PANI/RA2039.67 × 10−70.4450282.36 × 10−70.854.556 × 1044.56 × 10−50.401.11 × 10597.49
CeO2-PANI/RA1944.75 × 10−70.7137006.40 × 10−70.673.804 × 1042.11 × 10−60.785.68 × 10496.99
TiO2A-PANI/RA1681.06 × 10−80.7761406.40 × 10−70.446.882 × 1048.83 × 10−60.483.84 × 10598.34
Table 3. Tafel parameters obtained for PANI-based coatings immersed in 3.5% NaCl solution for 3, 8, 24, and 72 h.
SamplesTafel ParametersImmersion Time (h)
382472
PANI/RA i c o r r (μA cm−2)0.0790.1120.0700.075
E c o r r (V)−0.522−0.596−0.679−0.680
β A (V dec−1)0.2250.1740.1080.081
β C (V dec−1)0.1880.1970.2050.149
η P R O T (%)97.1095.7397.4897.27
SiO2-PANI/RA i c o r r (μA cm−2)0.0730.1230.0960.069
E c o r r (V)−0.479−0.650−0.726−0.699
β A (V dec−1)0.3850.1720.1170.096
β C (V dec−1)0.1240.1890.2240.170
η P R O T (%)97.3595.2896.4097.52
CeO2-PANI/RA i c o r r (μA cm−2)0.1470.1630.1350.227
E c o r r r (V)−0.637−0.683−0.737−0.750
β A (V dec−1)0.1940.1620.1100.071
(V dec−1)0.1190.1220.1670.162
η P R O T (%)94.2893.6294.7890.96
TiO2A-PANI/RA i c o r r (μA cm−2)0.0180.1390.0740.059
E c o r r (V)−0.362−0.498−0.616−0.662
β A (V dec−1)0.1950.2640.1490.119
β C (V dec−1)0.1920.1920.2320.221
η P R O T (%)99.6394.6197.3197.93
Publisher’s Note: MDPI stays neutral with regard to jurisdictional claims in published maps and institutional affiliations.