Article

Evaluation of Passivation Process for Stainless Steel Hypotubes Used in Coronary Angioplasty Technique

by
Lucien Reclaru
1,2 and
Lavinia Cosmina Ardelean
2,3,*
1
Scientific Independent Consultant Biomaterials and Medical Devices, 103 Paul-Vouga, 2074 Marin-Neuchâtel, Switzerland
2
Multidisciplinary Center for Research, Evaluation, Diagnosis and Therapies in Oral Medicine, “Victor Babes” University of Medicine and Pharmacy Timisoara, 2 Eftimie Murgu sq, 300041 Timisoara, Romania
3
Department of Technology of Materials and Devices in Dental Medicine, “Victor Babes” University of Medicine and Pharmacy Timisoara, 2 Eftimie Murgu sq, 300041 Timisoara, Romania
*
Author to whom correspondence should be addressed.
Coatings 2021, 11(4), 448; https://doi.org/10.3390/coatings11040448
Submission received: 17 March 2021 / Revised: 2 April 2021 / Accepted: 10 April 2021 / Published: 13 April 2021
(This article belongs to the Special Issue Materials with and without Coating-New Perspectives)

Abstract

:
In the manufacturing of hypotubes for coronary applications, austenitic steels of types 304, 304, or 316 L are being used. The manufacturing process involves bending steel strips into tubes and the continuous longitudinal welding of the tubes. Manufacturing also includes heat treatments and stretching operations to achieve an external/internal diameter of 0.35/0.23 mm, with a tolerance of +/− 0.01 mm. Austenitic steels are sensitive to localized corrosion (pitting, crevice, and intergranular) that results from the welding process and various heat treatments. An extremely important step is the cleaning and the internal and external passivation of the hypotube surface. During patient interventions, there is a high risk of metal cations being released in contact with human blood. The aim of this study was to evaluate the state of passivation and corrosion resistance by using electrochemical methods and specific intergranular corrosion tests (the Strauss test). There were difficulties in passivating the hypotubes and assessing the corrosion phenomena in the interior of the tubes. Assessments were made by plotting the open circuit potential curves and exploring the polarization curves in the Tafel domain range of −50 mV vs. Ecorr (redox potential) and +150 mV vs. saturated calomel electrode (SCE, reference micro-electrode) for both the external and the internal surfaces of the hypotubes. The tested hypotubes did not exhibit intergranular corrosion, as mass losses were low and, in general, close to the limit of the analytical balance. Electrochemical techniques made the differentiation of the passivation state of the tested hypotubes possible. The measured currents were of the order of nano–pico amperes, and the quantities of electrical charges consumed for corrosion were of the order of micro–nano coulombs.

1. Introduction

In 1924, William Herbert Hatfield (1882–1943) developed the “18/8” steel (18% chromium and 8% nickel, by mass), which is probably the most representative of the stainless steels that are manufactured and used worldwide.
Stainless steels are defined as alloys containing more than 50% iron and 12% chromium. The structures encountered in stainless steels are similar to those of their main constituent, iron, as they consist of two crystalline forms, depending on the temperature: between 912 and 1394 °C, a face-centered cubic structure, called the austenite or γ phase, is formed. Austenite is characterized as non-magnetic, ductile at any temperature, and strong hardening. Outside the range of 912–1394 °C, a centered cubic structure, known as the ferrite α (if formed below 912 °C) or δ (if formed above 1394 °C) phase is formed. Ferrite is characterized as magnetic and fragile at low temperature, with medium ductility and limited hardening [1].
Over time, the chemical composition, mechanical properties, resistance to corrosion, machinability, and polishability of austenitic steels have evolved considerably. New production processes have been developed by the steel manufacturers, the base being represented by the “18/8” steel. By reducing carbon content, the 304 AISI grade was developed, and by adding molybdenum and less carbon, the 316 AISI grade was obtained.
Hypotubes for coronary applications are used for angioplasty and stent placement, thus restoring the proper irrigation of the heart without resorting to cardiac bypass surgery. Angioplasty enables the widening of a stenosed artery through the simple inflation of a balloon, sometimes accompanied by the placement of a stent [2,3]. Micron-sized specimens, cut from the hypotubes, represent the starting material for the manufacturing of endovascular stents and other biomedical devices [4]. They were designed to navigate vessels to reach lesion sights and act as guides for larger catheters [5,6].
Hypotubes for coronary applications, made of austenitic 304 (DIN 1.4301), 304L (DIN 1.4306), or 316L (DIN 1.4435) grade steels, are manufactured from metal strips, rolled and welded, and then stretched several times to obtain the desired dimensions and hardness. Austenitic stainless steels may cause cracking problems at high temperatures, are sensitive to grain magnification, and require certain welding precautions. Choosing the right welding process and procedure can avoid many problems, particularly intergranular corrosion. Thus, welding can be carried out by a micro plasma or tungsten inert gas (TIG) system, and the filler metal can be TIG ER 316L or W 19 12 3 L. Usually, welding is carried out by a continuous process over a length of 260 m (torch process) (Figure 1) [7,8,9].
The aim of this study was to investigate the corrosion susceptibility and passivation state of the welded hypotubes. Hypotubes used for coronary applications are in the passivated state. Thus, the chemical and electrochemical reactions of their surface with the biological medium (the blood) are strongly inhibited, and the quantities of cations released are highly reduced. Though the hypotubes are short-term, single-use medical devices, they must demonstrate an excellent corrosion resistance, with a minimal release of cations into the blood, because of the risk of generating toxicity phenomena. It is therefore necessary to evaluate the corrosion resistance of the external and internal surfaces, as well as the passivation efficiency (a compulsory step in the manufacturing process), in order to meet the imposed requirements and the usage constraints. Very little information on this subject could be found in the literature [10,11,12].

2. Materials and Methods

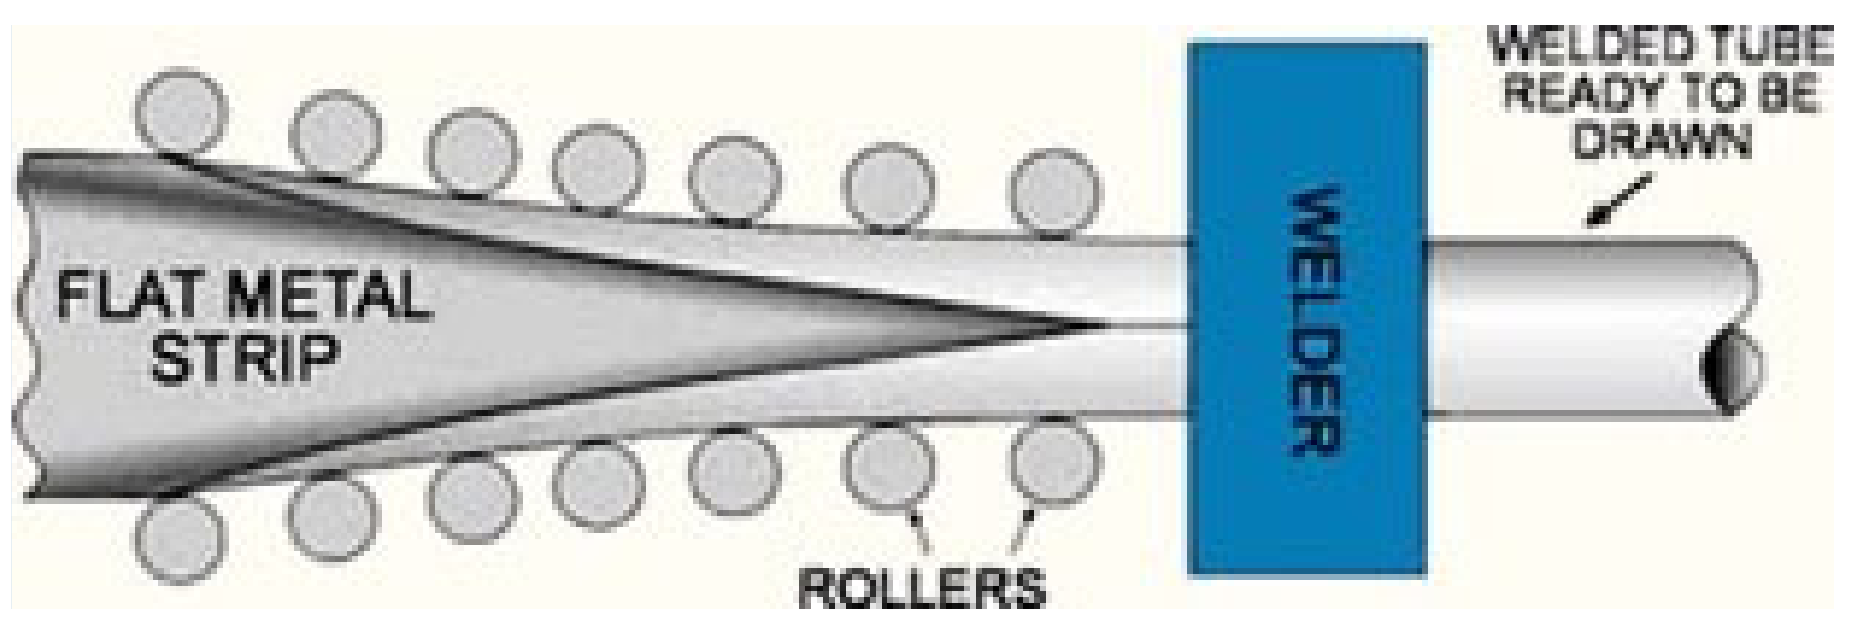
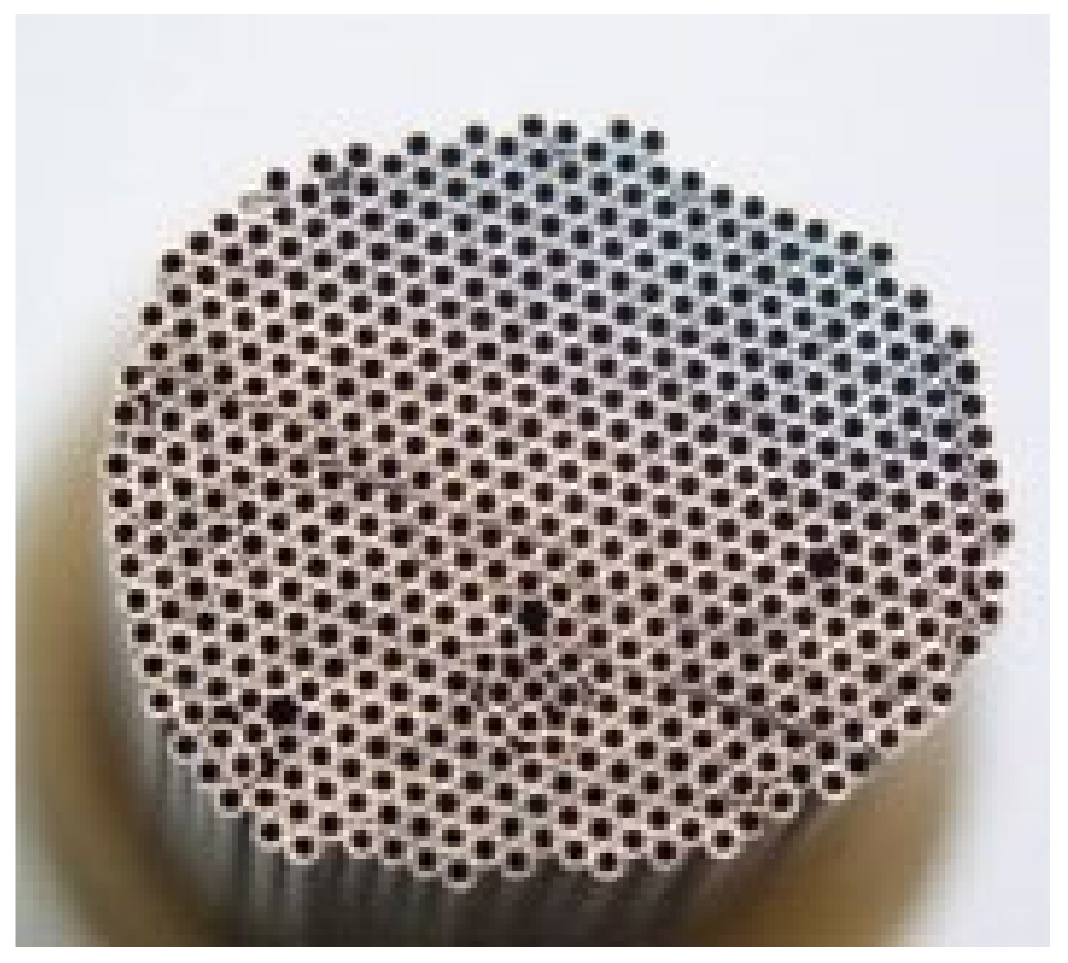
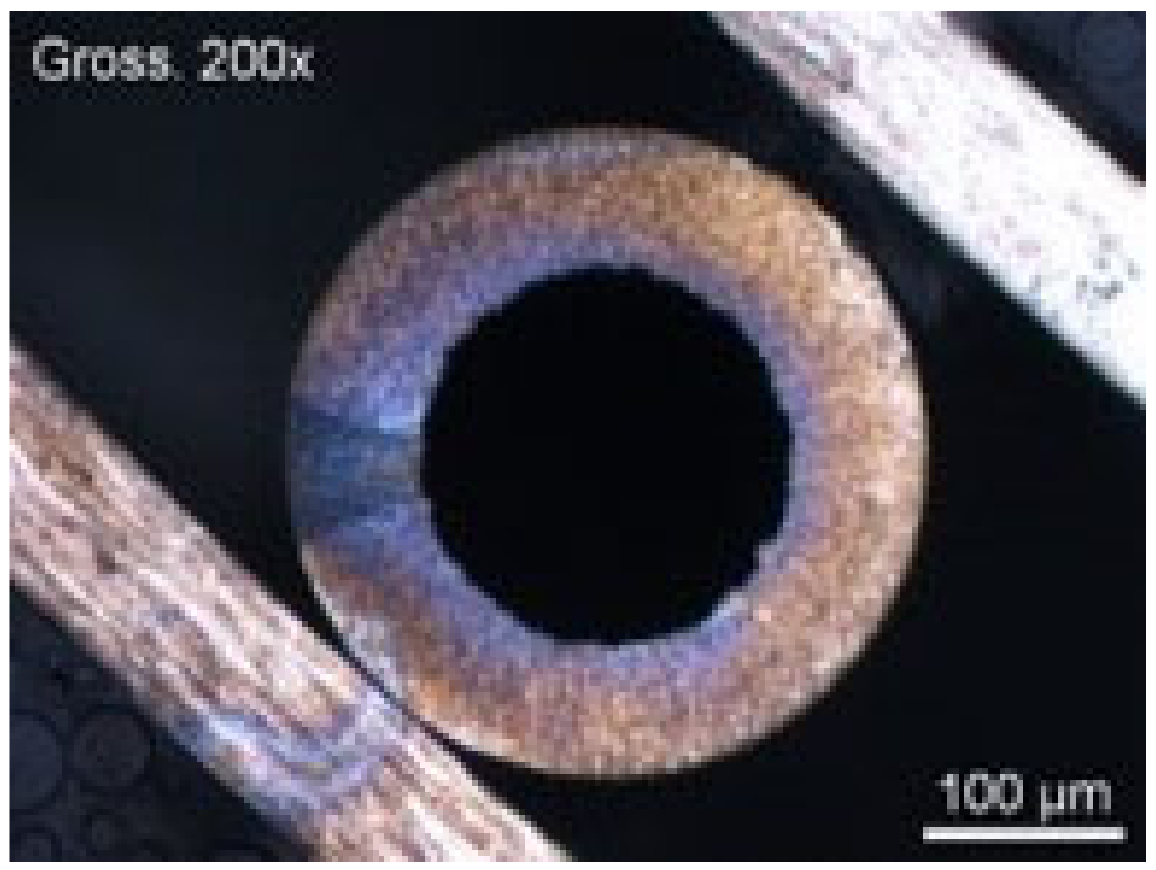
2.1. The Hypotubes’ Characteristics

The assessed hypotubes were made of a 304L (DIN 1.4306) steel. The nominal chemical composition, according to the manufacturer, is given in Table 1.
The hypotubes—with an external diameter (ED) = 0.35 mm, internal diameter (ID) = 0.23 mm (+/− 0.01mm tolerance) and length (L) = 2600 mm—were cleaned, pickled, and passivated. The tightness of their walls was tested by using water with a fluctuation between 20 and 50 bars. A bundle of 500 hypotubes is shown in Figure 2.

Sampling Description

Starting from the original steel strip, the raw tube was bended and laser-welded, in a continuous way, at a length of 260 m (Figure 1). After consecutive several stages of heat treatments and drawing, a hypotube with the required dimensions was obtained and then laser-cut to a length of 2.6 m. A bundle comprised of 200 hypotubes was subsequently cut to a length of 50 cm. The samples obtained in this way were used in tests of chemical passivation pressures of 10 and 50 bars. For the passivation tests at 10 bars, 14 tubes with a length of 2.6 m were selected (cut from the entire length of the initial tube) and then used for the electrochemical and intergranular corrosion tests. Samples #1–#17 were segments originating from the 14 tubes previously passivated at 10 bars, except for samples #2, #8, and #13 (Table 2), which were the reference ones that were selected from a batch previously certified as medical devices that are ready for use in surgical procedures.
Our aim was to enable a comparison between the state of passivation and the corrosion sensitivity of the manufactured hypotubes and the hypotubes certified as medical devices. Another point of interest was to find out if there were any variations of the corrosion sensitivity over the 260 m length of the initial tube.
The outer surface of hypotube #4 was coated with a layer of parylene for isolation purposes. Parylene is a film used to protect almost any substrate material, but it is mostly used for electronics. It is inert and insoluble to most solvents that is thermally stable between −200 and 290 °C and with an extremely high dielectric strength of 7 kV/mil (in US Units, 1V/mil = 3.94 × 10⁴ V/m). The coating thickness can be as thin as 1 µm.

2.2. The Passivation Method

The hypotubes were pickled and passivated according to a strict operating procedure (Table 3).
The pickling medium was composed of 1 volume of nitric acid (67%), 2 volumes of phosphoric acid (85%), and two volumes of glacial acetic acid; it was heated to a temperature of 30 °C for a duration of about 60 min.

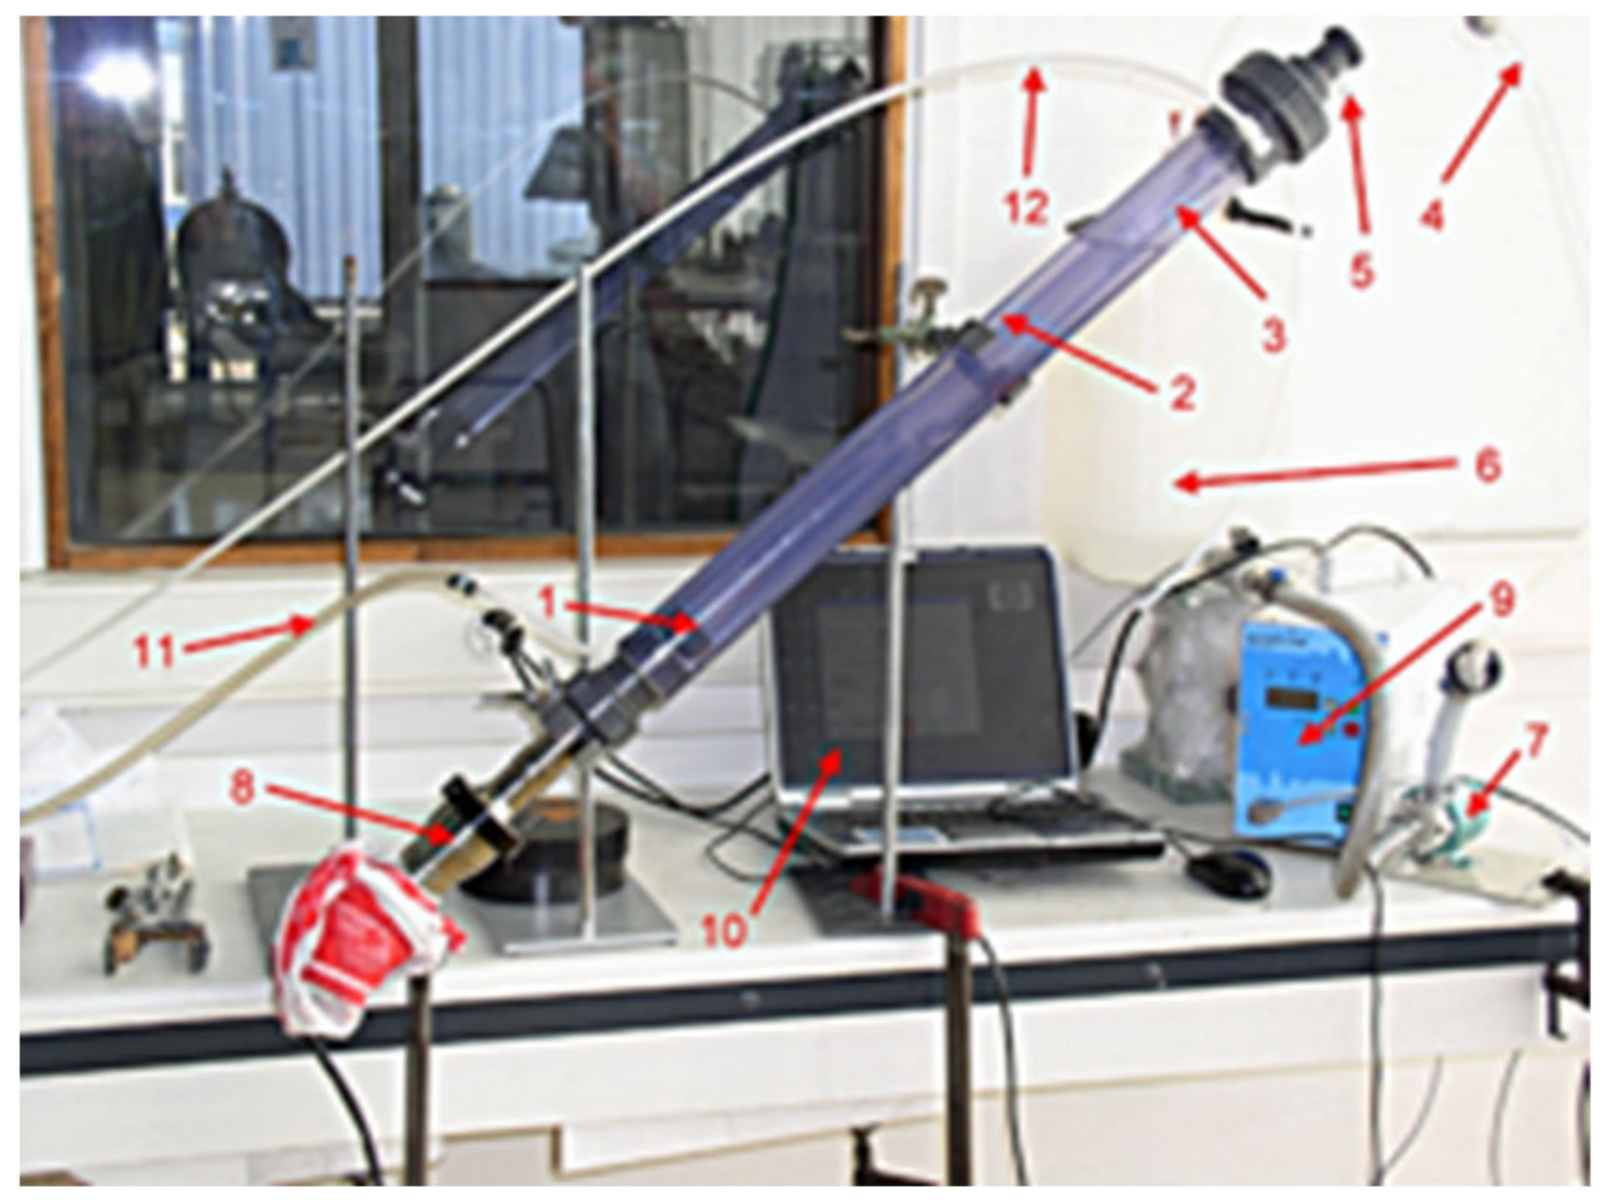
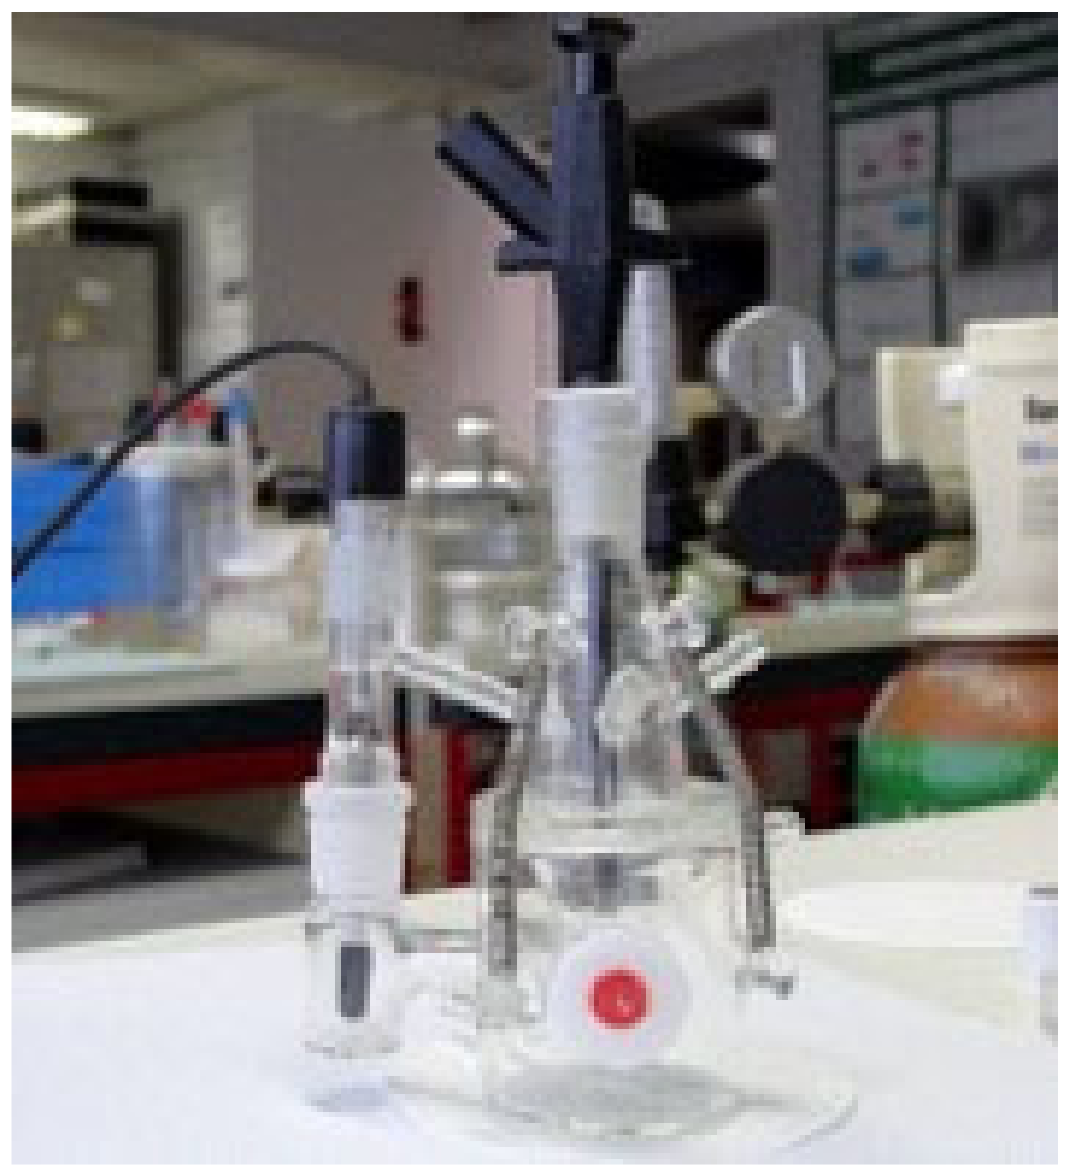
2.2.1. The Micro-Pilot

A micro-pilot was designed according to Figure 3. The pickling reactor consisted of two concentric tubes. The central reactor (3) contained the pickling solution in which the hypotubes were placed. The pickling solution was continuously recirculated from the buffer tank (6) by the pump (7) with a flow rate of 2 L/min. The reactor was positioned with an incline of 45° to facilitate the removal of residual air from the interior of the hypotubes. For stirring, an ultrasound generator (9) was mounted at the bottom part of the reactor. To conduct the ultrasonic waves, water was recirculated within the two tubes. The high-power ultrasonic converter (sonotrode) was hosted in a fully protected housing.
The ultrasonic system was able to generate a strong and efficient ultrasonic-jet excitation of the hypotubes in order to accelerate the internal and external cleaning, surface treatment, and rinsing, based on the ultrasonic capillary effect and cavitation. The combined effects of chemical treatment and ultrasonic agitation aimed to significantly simplify and accelerate the cleaning of the hypotubes.
The micro-pilot, as designed, allowed for the filling of the hypotube samples (DI = 0.23 mm; L = 495 mm), and the maximum quantity was one hundred hypotubes in the reactor. In this type of system, the preferential circulation of liquid in the interior of the hypotubes must be controlled; in other words, there are hypotubes in which the pickling solution does not circulate. To verify if the liquid does circulate in the hypotubes, the orthophenanthroline hydrochloride test was carried out.

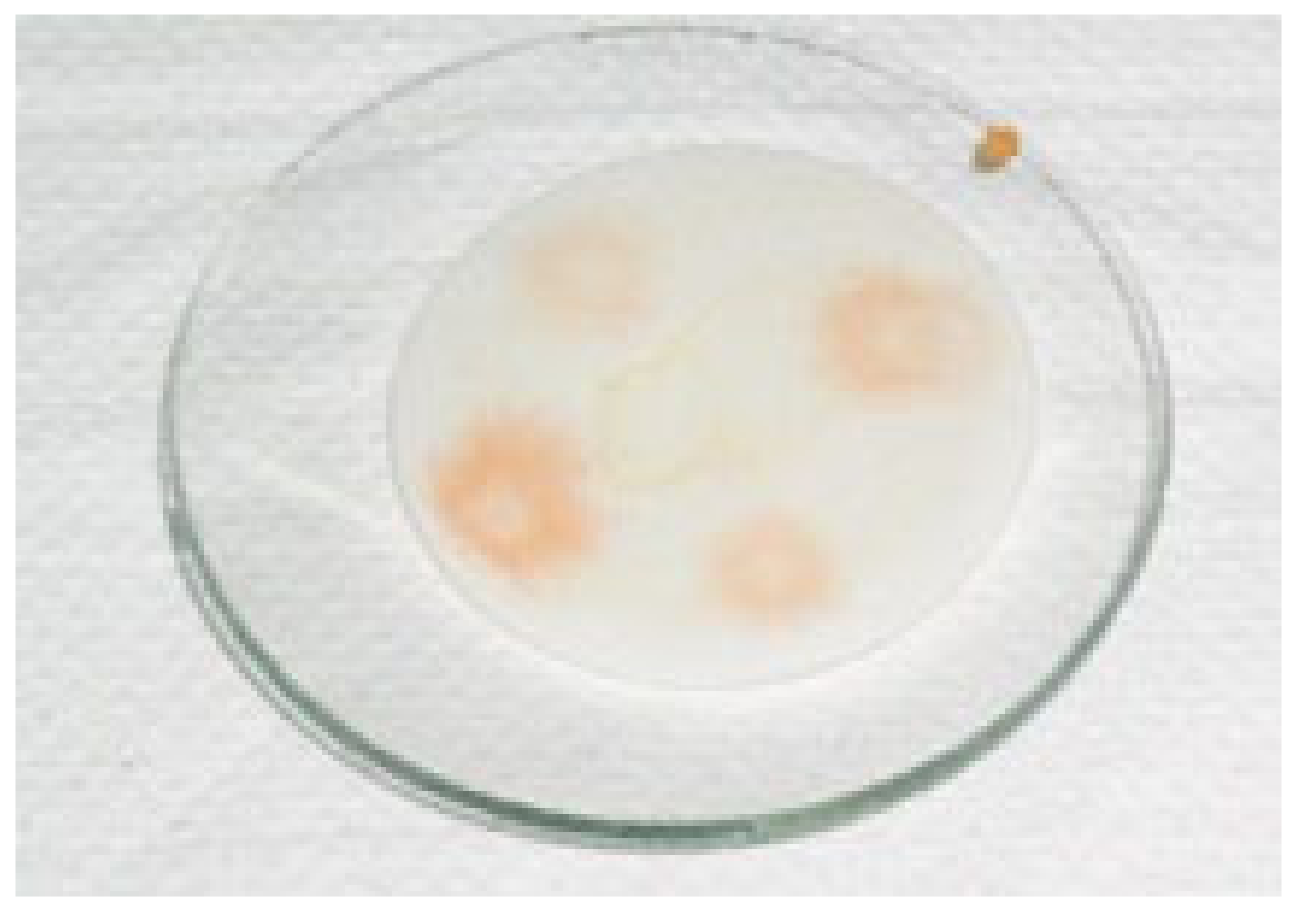
2.2.2. The Orthophenanthroline Hydrochloride Test

Orthophenanthroline hydrochloride is a chemical indicator with the property of giving an intense red color when brought into contact with ferrous ions (Fe+2). This property was used to highlight the circulation of water inside the hypotubes, with the detection limit being 0.7 mg/L. In a first step, the reactor was placed in a vertical position at 90°. Fifty hypotubes were introduced into the reactor, and then water containing orthophenanthroline hydrochloride (4 g/L) was added to fill the reactor. After 10 min of ultrasound, the reactor and tank were purged. In a second step, water (total volume: 15 L) was circulated under ultrasound for 10 min. Checking how many of the fifty hypotubes had been filled was done by emptying them onto filter paper soaked in an iron sulphate solution (1 g/L). The appearance of a red coloration on the filter paper indicated the presence of the indicator inside the hypotube (Figure 4).
Out of the fifty hypotubes, thirty-seven positively responded to orthophenanthroline (staining), eight negatively responded to orthophenanthroline, and six were clogged. According to this result, water circulated in only eight hypotubes out of fifty. By using this technique, the requirements imposed by medical-device legislation cannot be ensured because the interior and the exterior of the hypotubes must be passivated before use.

2.2.3. The under Pressure Passivation

Consequently, we considered another technique to circulate liquid under pressure in a reactor, adapted for carrying out high pressure passivation. The tests were carried for fifty with the ID = 0.23 mm and L = 2600 mm:
  • First bullet; At 10 bars, the cleaning time was 180 s, with a flow rate of 38.17 µL/sec.
  • At 50 bars, the cleaning time was 60 s, with a flow rate of 92.59 µL/sec.
All hypotubes were negative to the orthophenanthroline test. Hypotubes of the 10 bar passivation series were used in the corrosion tests.

2.3. EDX Analysis

The chemical composition of the internal and external part of hypotubes #1–#17 was analyzed by energy-dispersive X-ray spectroscopy (EDX). An image of reference hypotube #8 is given in Figure 5. The samples were cut and washed with ethanol p.a. under ultrasound.
The microscopy investigations (scanning electron microscopy/energy-dispersive X-ray spectroscopy SEM/EDX) were carried out using a JEOL JSM-6300 SEM (JEOL, Peabody, MA, USA) equipped with an Oxford INCA EDS system (Oxford Instruments, Abingdon, UK), for local phase analysis.

2.4. The Carbon (C) and Sulfur (S) Analysis

For the correct designation of a steel grade, it is essential to have information about the amount of carbon and sulfur in its composition. The carbon (C) and sulfur (S) (C/S) analysis was done via combustion and IR analysis (Leco CS-200IH, Plzen, Czech Republic), with a typical accuracy of +/− 2 ppm or 1% relative for C and +/− 2 ppm or 1.5% relative for S.

2.5. Evaluation of Intergranular Corrosion (the Strauss Test)

The assessment of intergranular corrosion was carried out according to ASTM A262-15 [13].
This test investigates the intergranular corrosion behavior of steels in a potential range between 110 and 300 mV, according to Streicher (Figure 6) [14,15].
ASTM A 262-15, part E (the Strauss test), consists of testing the hypotubes for 24 h at reflux in a 100 g/L solution of CuSO4·5H2O and 100 mL/L H2SO4 conc. in the presence of 99.9% wt pure metallic copper. The hypotubes to be tested were placed in specific glass containers. The hypotubes were then rinsed with 18 MΩ·cm deionized water, washed in a Deconex 16NT solution under ultrasound for 2 × 15 min, rinsed with water at 18 MΩ·cm resistivity, and then dried with ethanol p.a. From each hypotube, three samples with a length of 6 cm were assessed. Mass-loss measurements were carried out on an analytical micro-balance (Mettler Toledo, Columbus, OH, USA) with a readability of 0.1 μg. After the test, the samples were analyzed by SEM. The folding of the samples and observation under the optical microscope of possible cracks was also carried out.

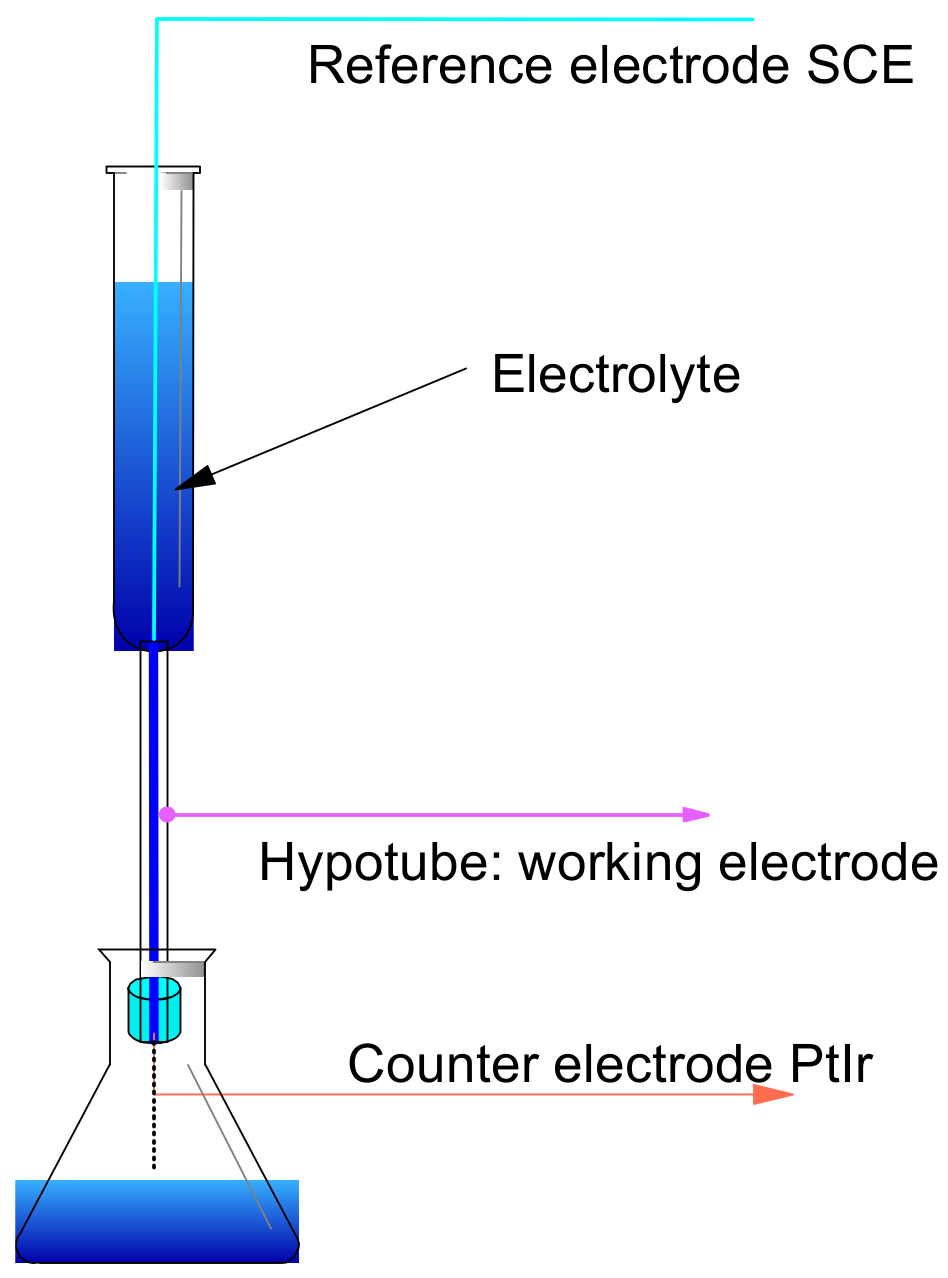
2.6. Electrochemical Evaluation

The electrochemical measurements were adapted for the external and internal surface of the hypotubes.

2.6.1. External Surface

For the external surface, a glass electrochemical cell with a volume of 5 mL of electrolyte was designed (Figure 7). The hypotube, with a length of 3 cm, was immersed in the measuring cell and linked to an electrode holder (Figure 7: black, in the center of the cell). The counter electrode was made of 70% Pt and 10% Ir. The electrolyte was 9 g/L NaCl.

2.6.2. Internal Surface

For measurements of the internal surface of the hypotubes, another assembly—consisting of a 1 mL electrolyte reservoir—was used (Figure 8). The hypotube, 5 cm long, was connected to the working electrode channel of the potentiostat. The reference micro-electrode (saturated calomel electrode-SCE) was positioned at the entry of the hypotube, and the Pt–Ir micro counter-electrode (with a diameter 0.150 mm) was positioned at the exit of the hypotube. The hypotube stood as the measuring electrode, and the electrical contact with the potentiostat was made on the exterior of the hypotube. The electrolyte flowed through the hypotube at a rate of 1 mL for approximately one hour. The electrolyte was 9 g/L NaCl. The insulating sheath from microlumen polyamide (ED = 0.20 mm; ID = 0.18 mm). This sheath could be introduced into the hypotubes with an ID = 0.23 mm.
For both the external and internal surfaces, the open circuit potentials were measured for 180 min. The Tafel curves were plotted after the measurement of the open circuit potential, with a scanning speed of 0.16 mV/s in the range of −150 mV vs. SCE to +50 mV vs. SCE.
The measurement system was controlled by an Eg&G PARSTAT 4000 potentiostat–galvanostat (Princeton Applied Research, Oak Ridge, TN, USA), equipped with an low current (LC) interface, in a current scale with an auto-current ranging capability of 200 Ma and a 4 pA limit (80 fA minimum range). The measuring system was protected by a Faraday cage that was surrounded by a Helmholtz cage.

3. Results and Discussion

3.1. Chemical Composition Determination by EDX

Table 4 shows the average values for the chemical composition of the seventeen tested hypotubes, as determined by EDX.
The hypotubes have revealed similar chemical compositions, which confirmed that the tested samples were made of 304L (DIN 1.4306) steel. The EDX analysis carried out on the internal surface did not show noticeable differences from that of the external surface (Table 4).

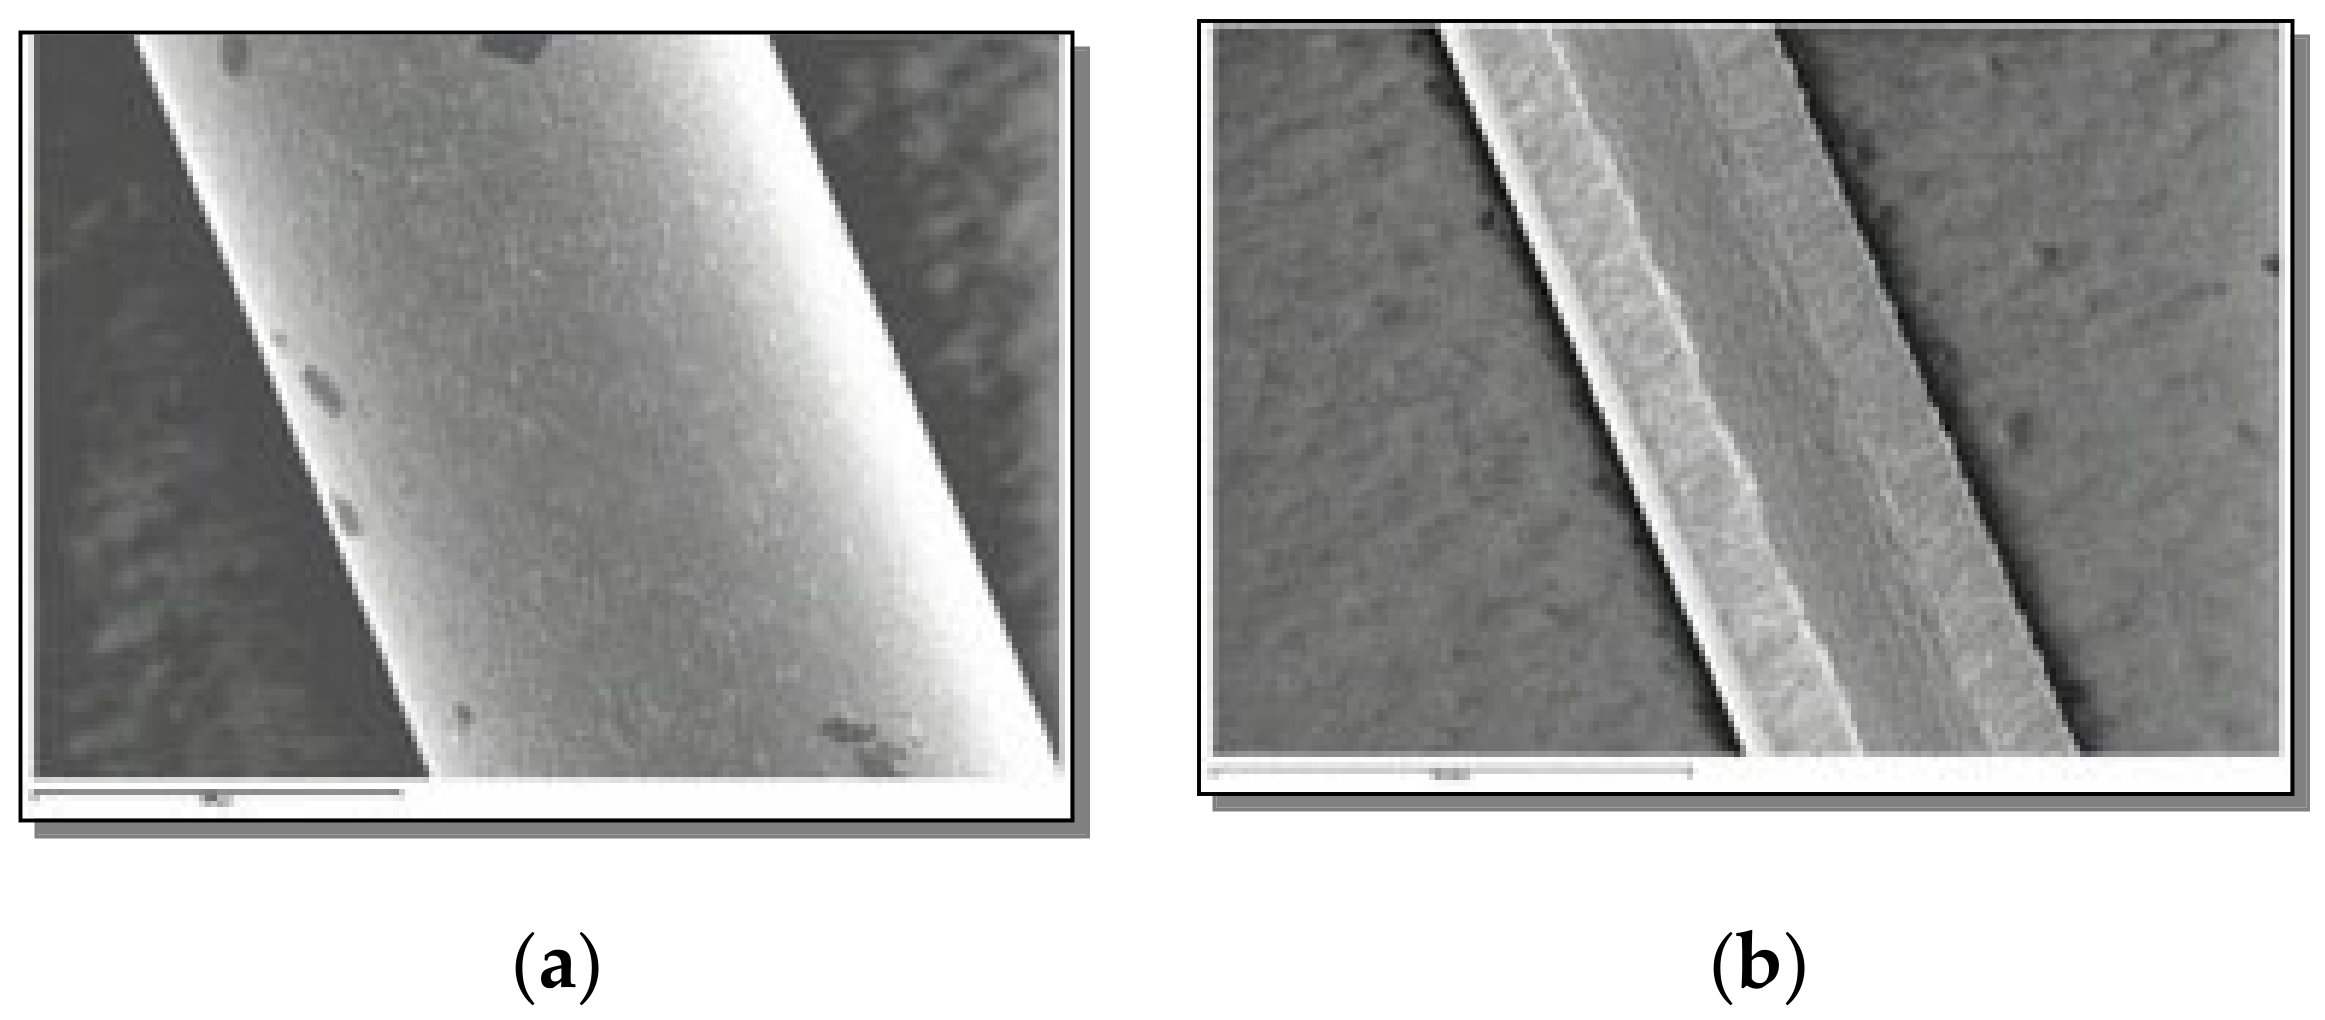
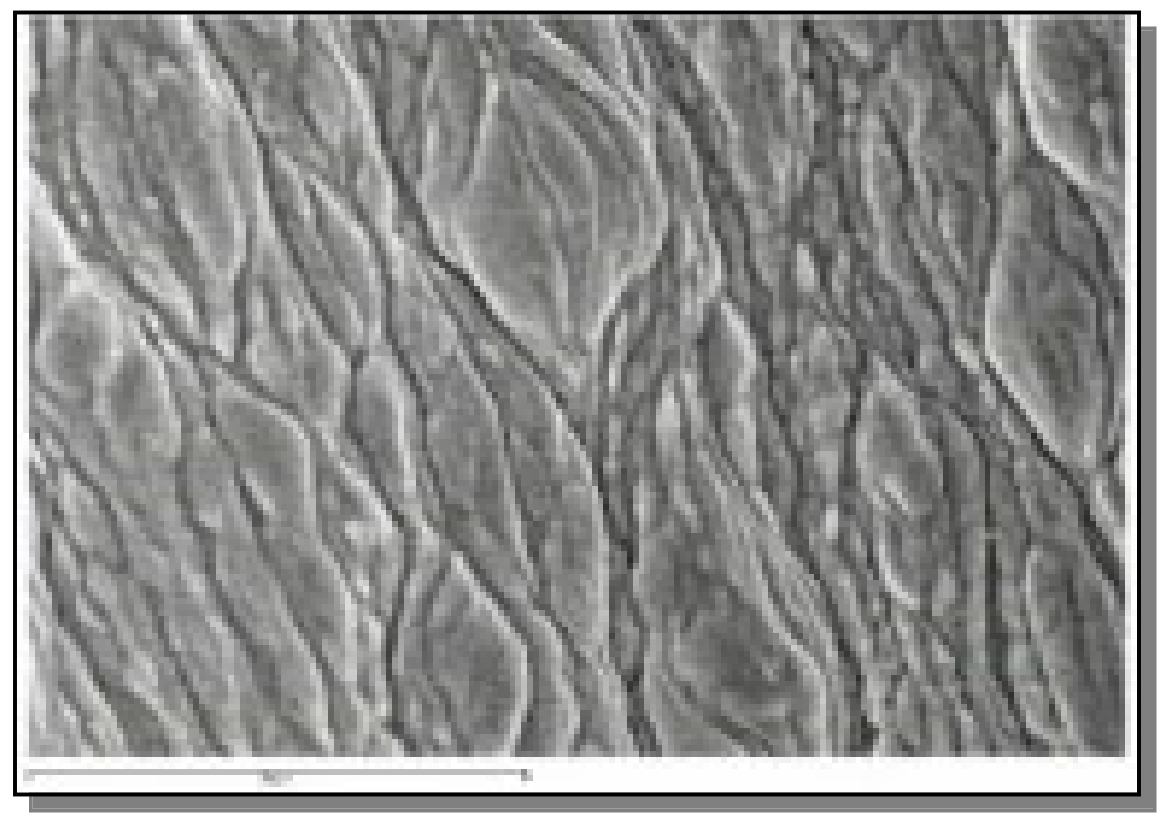
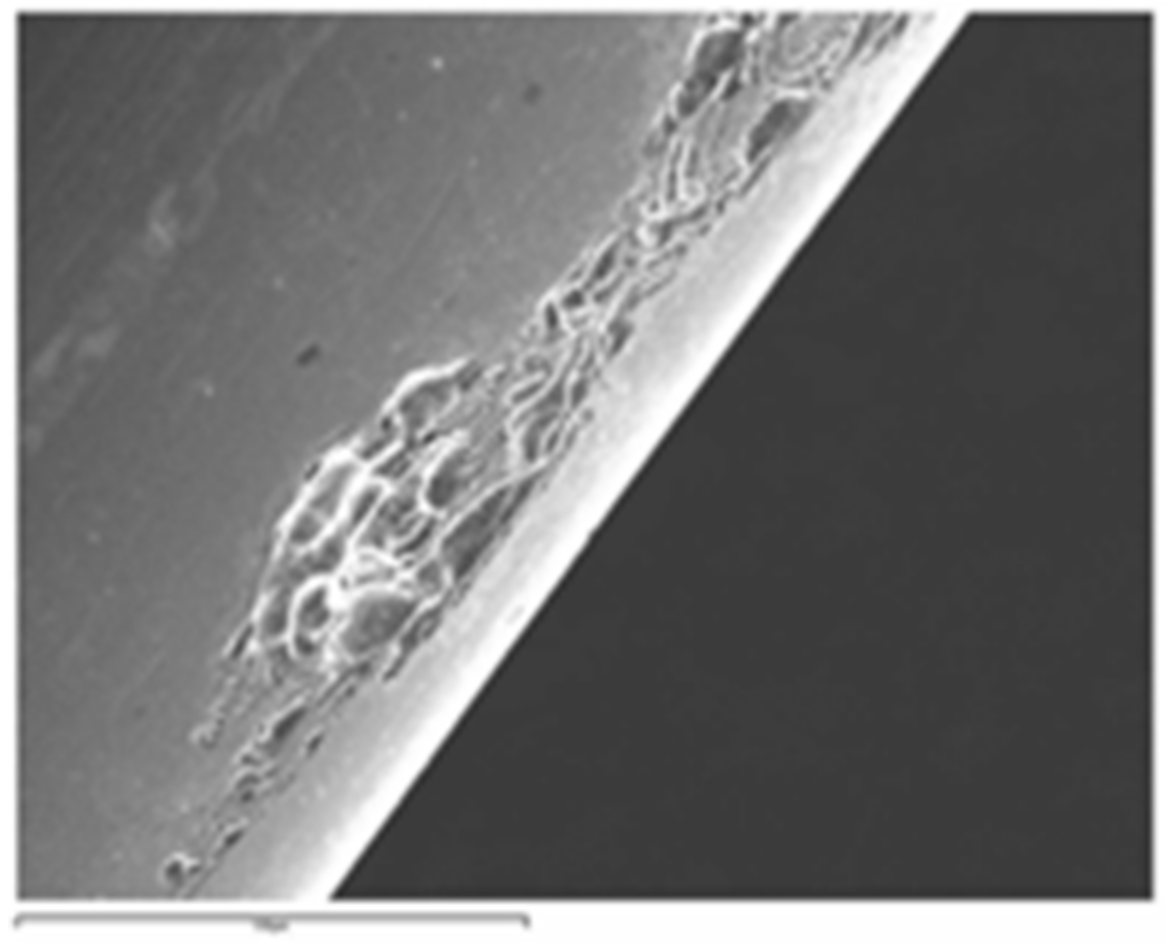
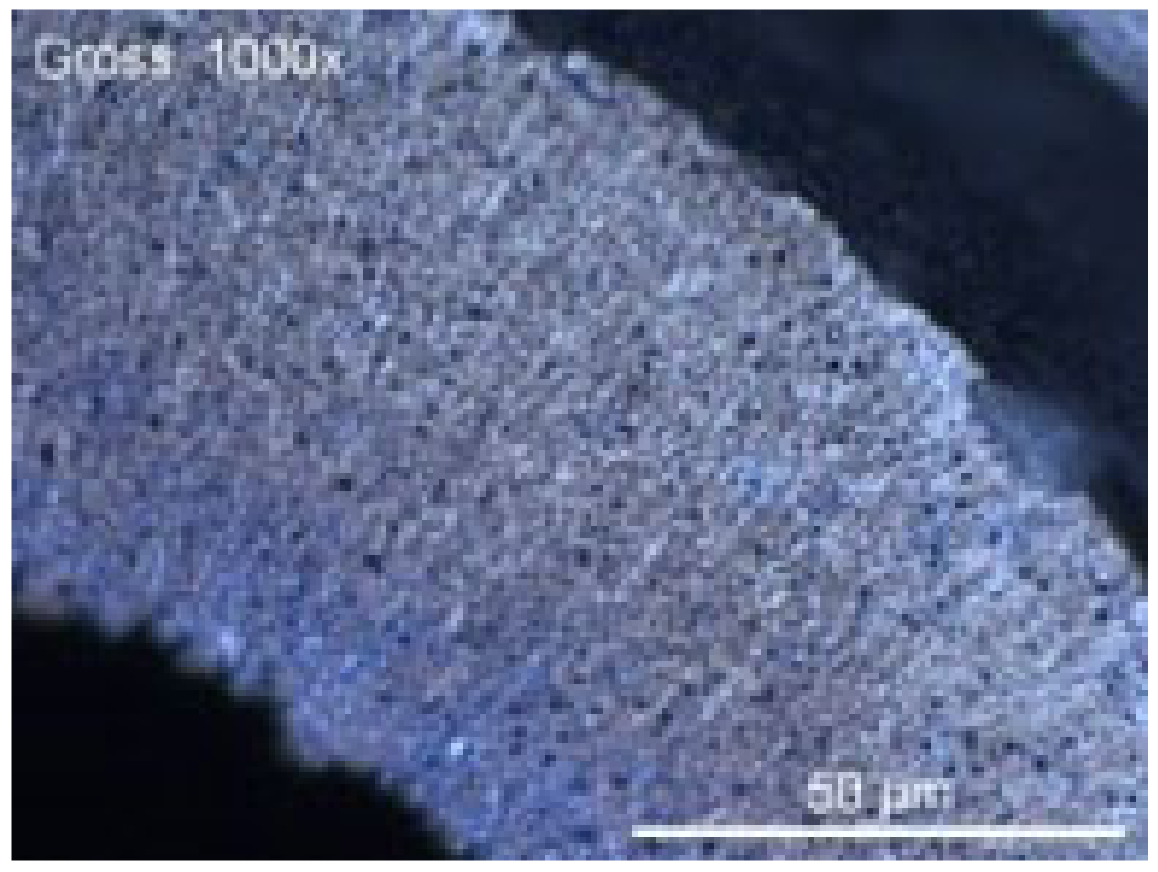
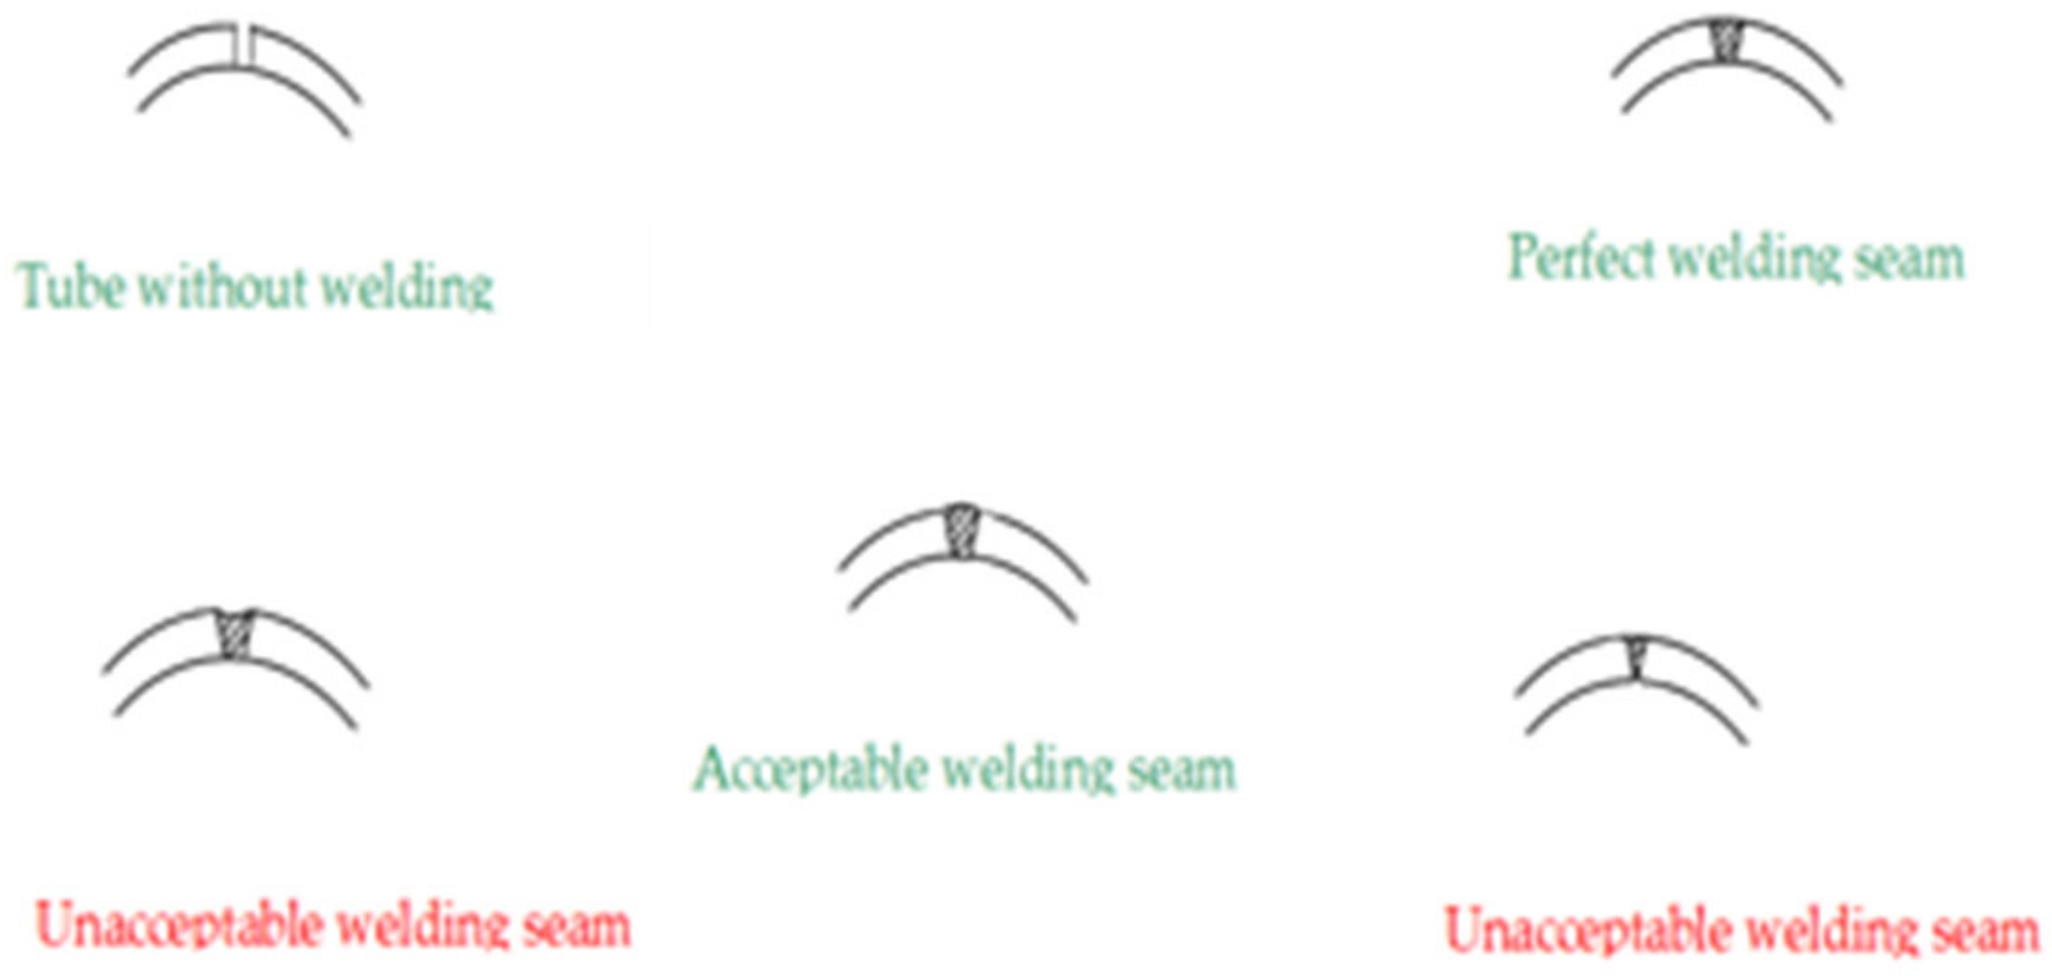
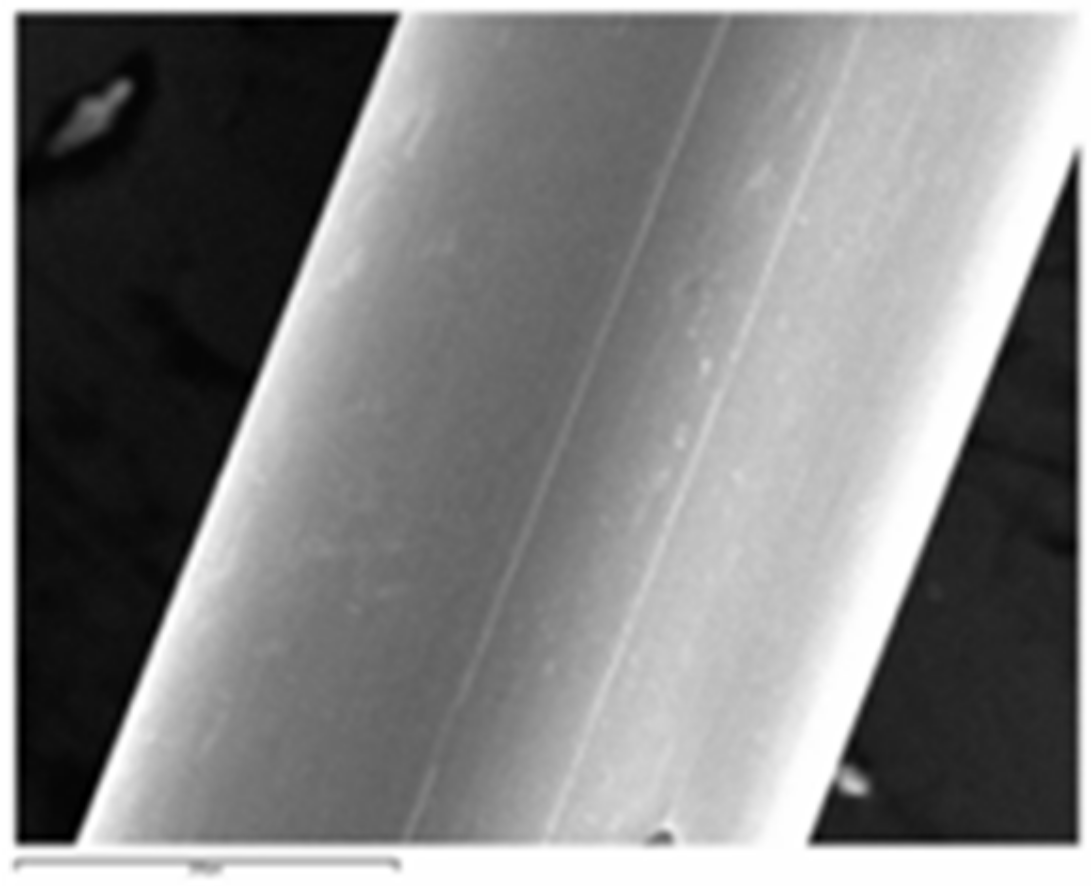
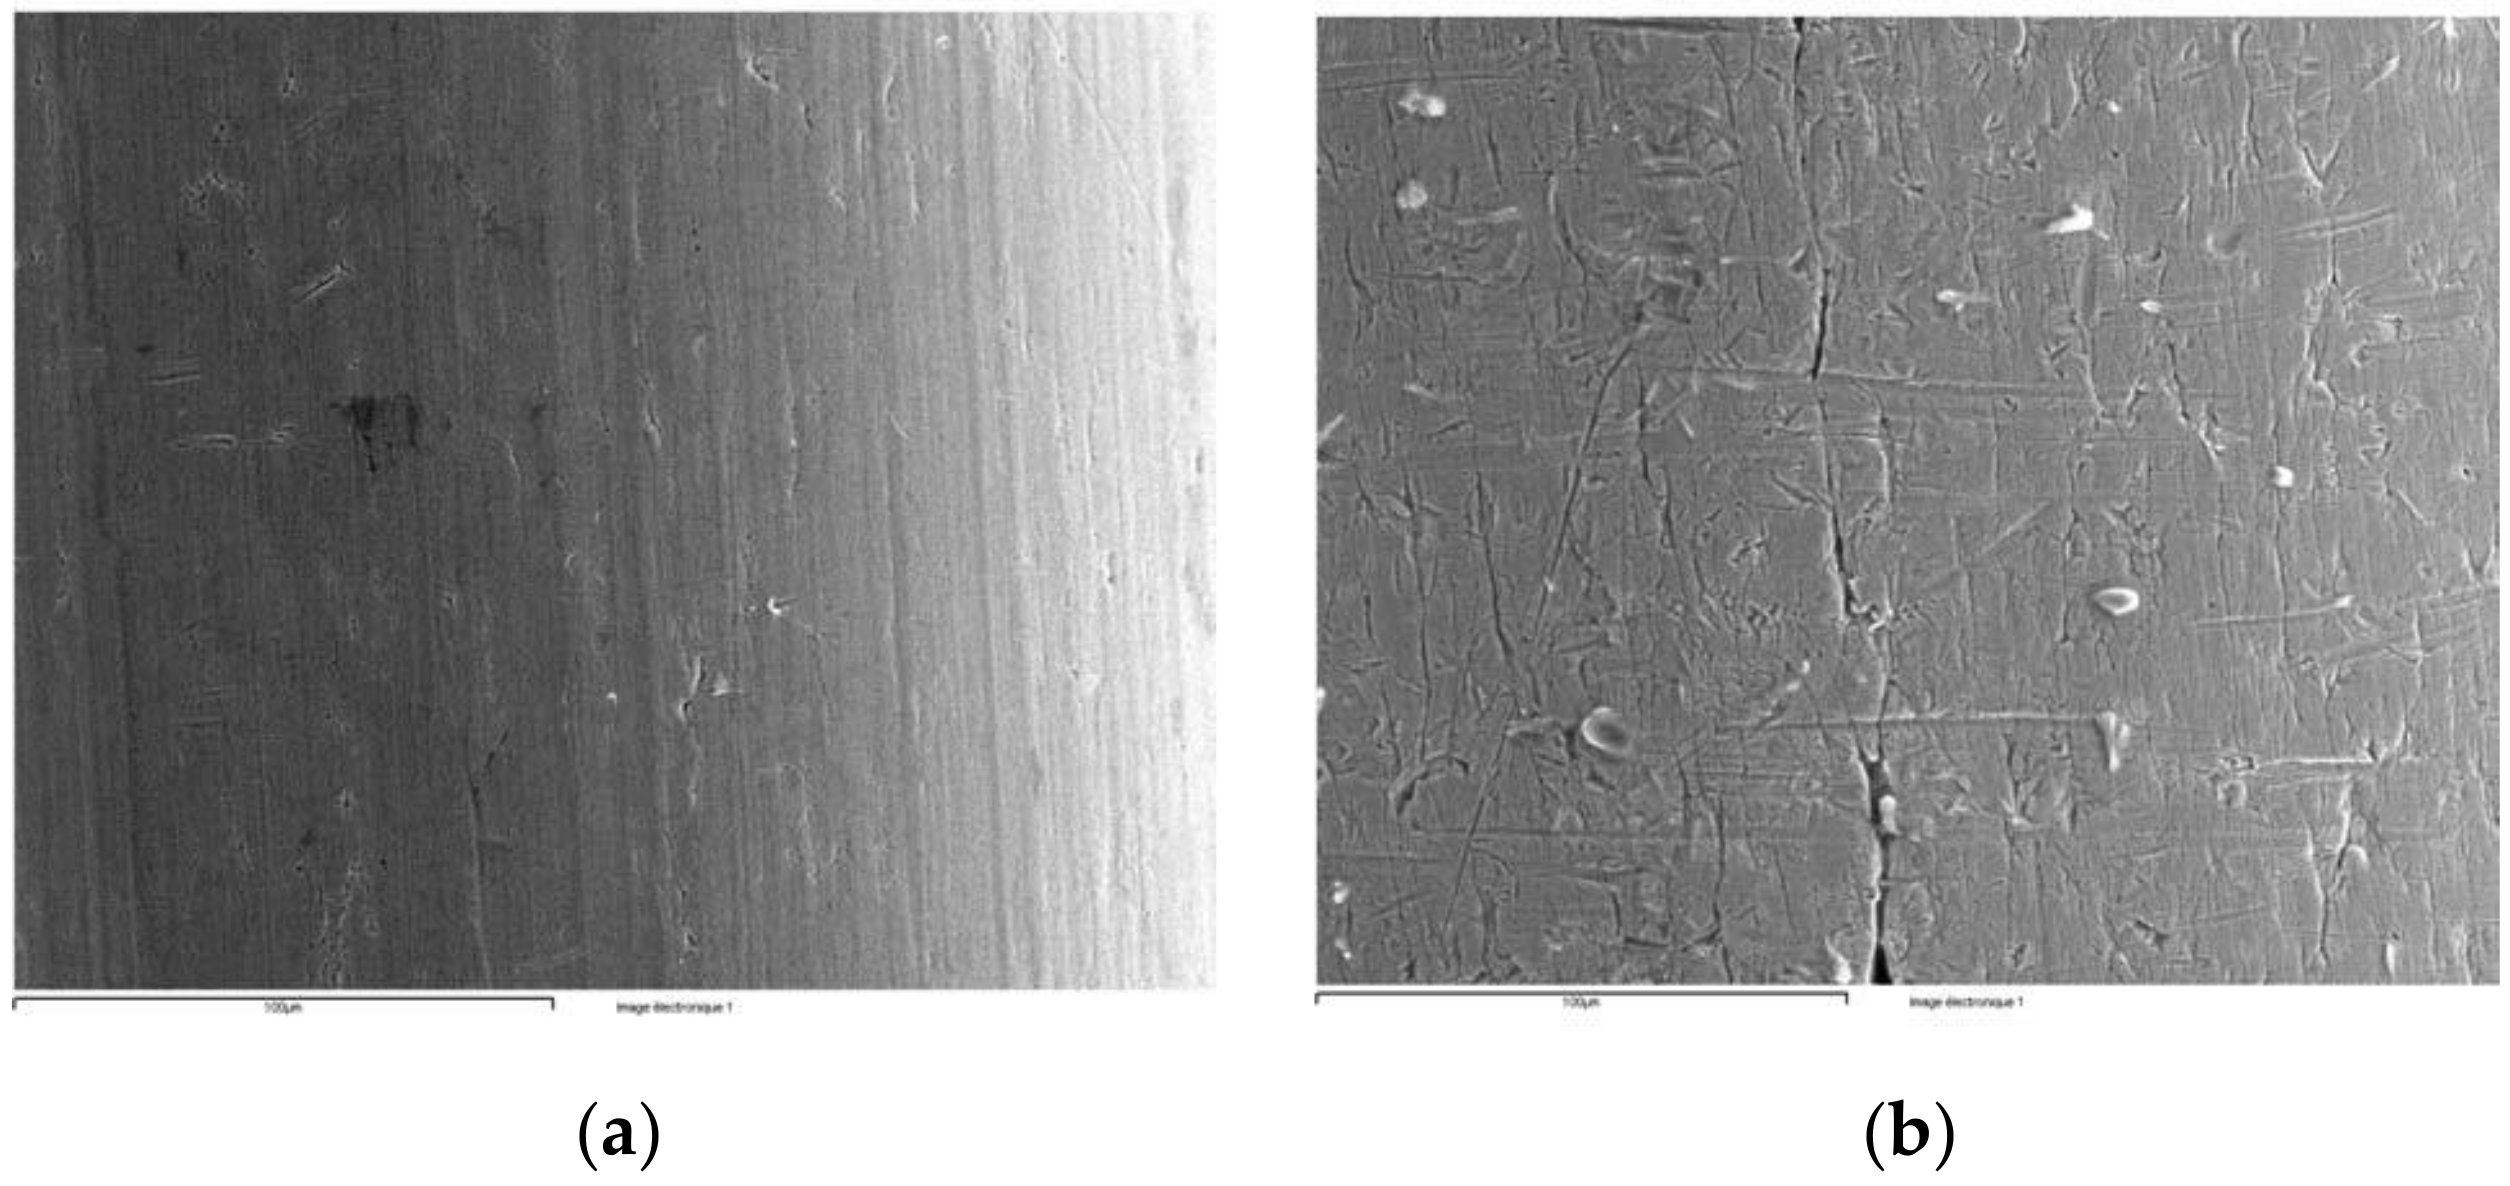
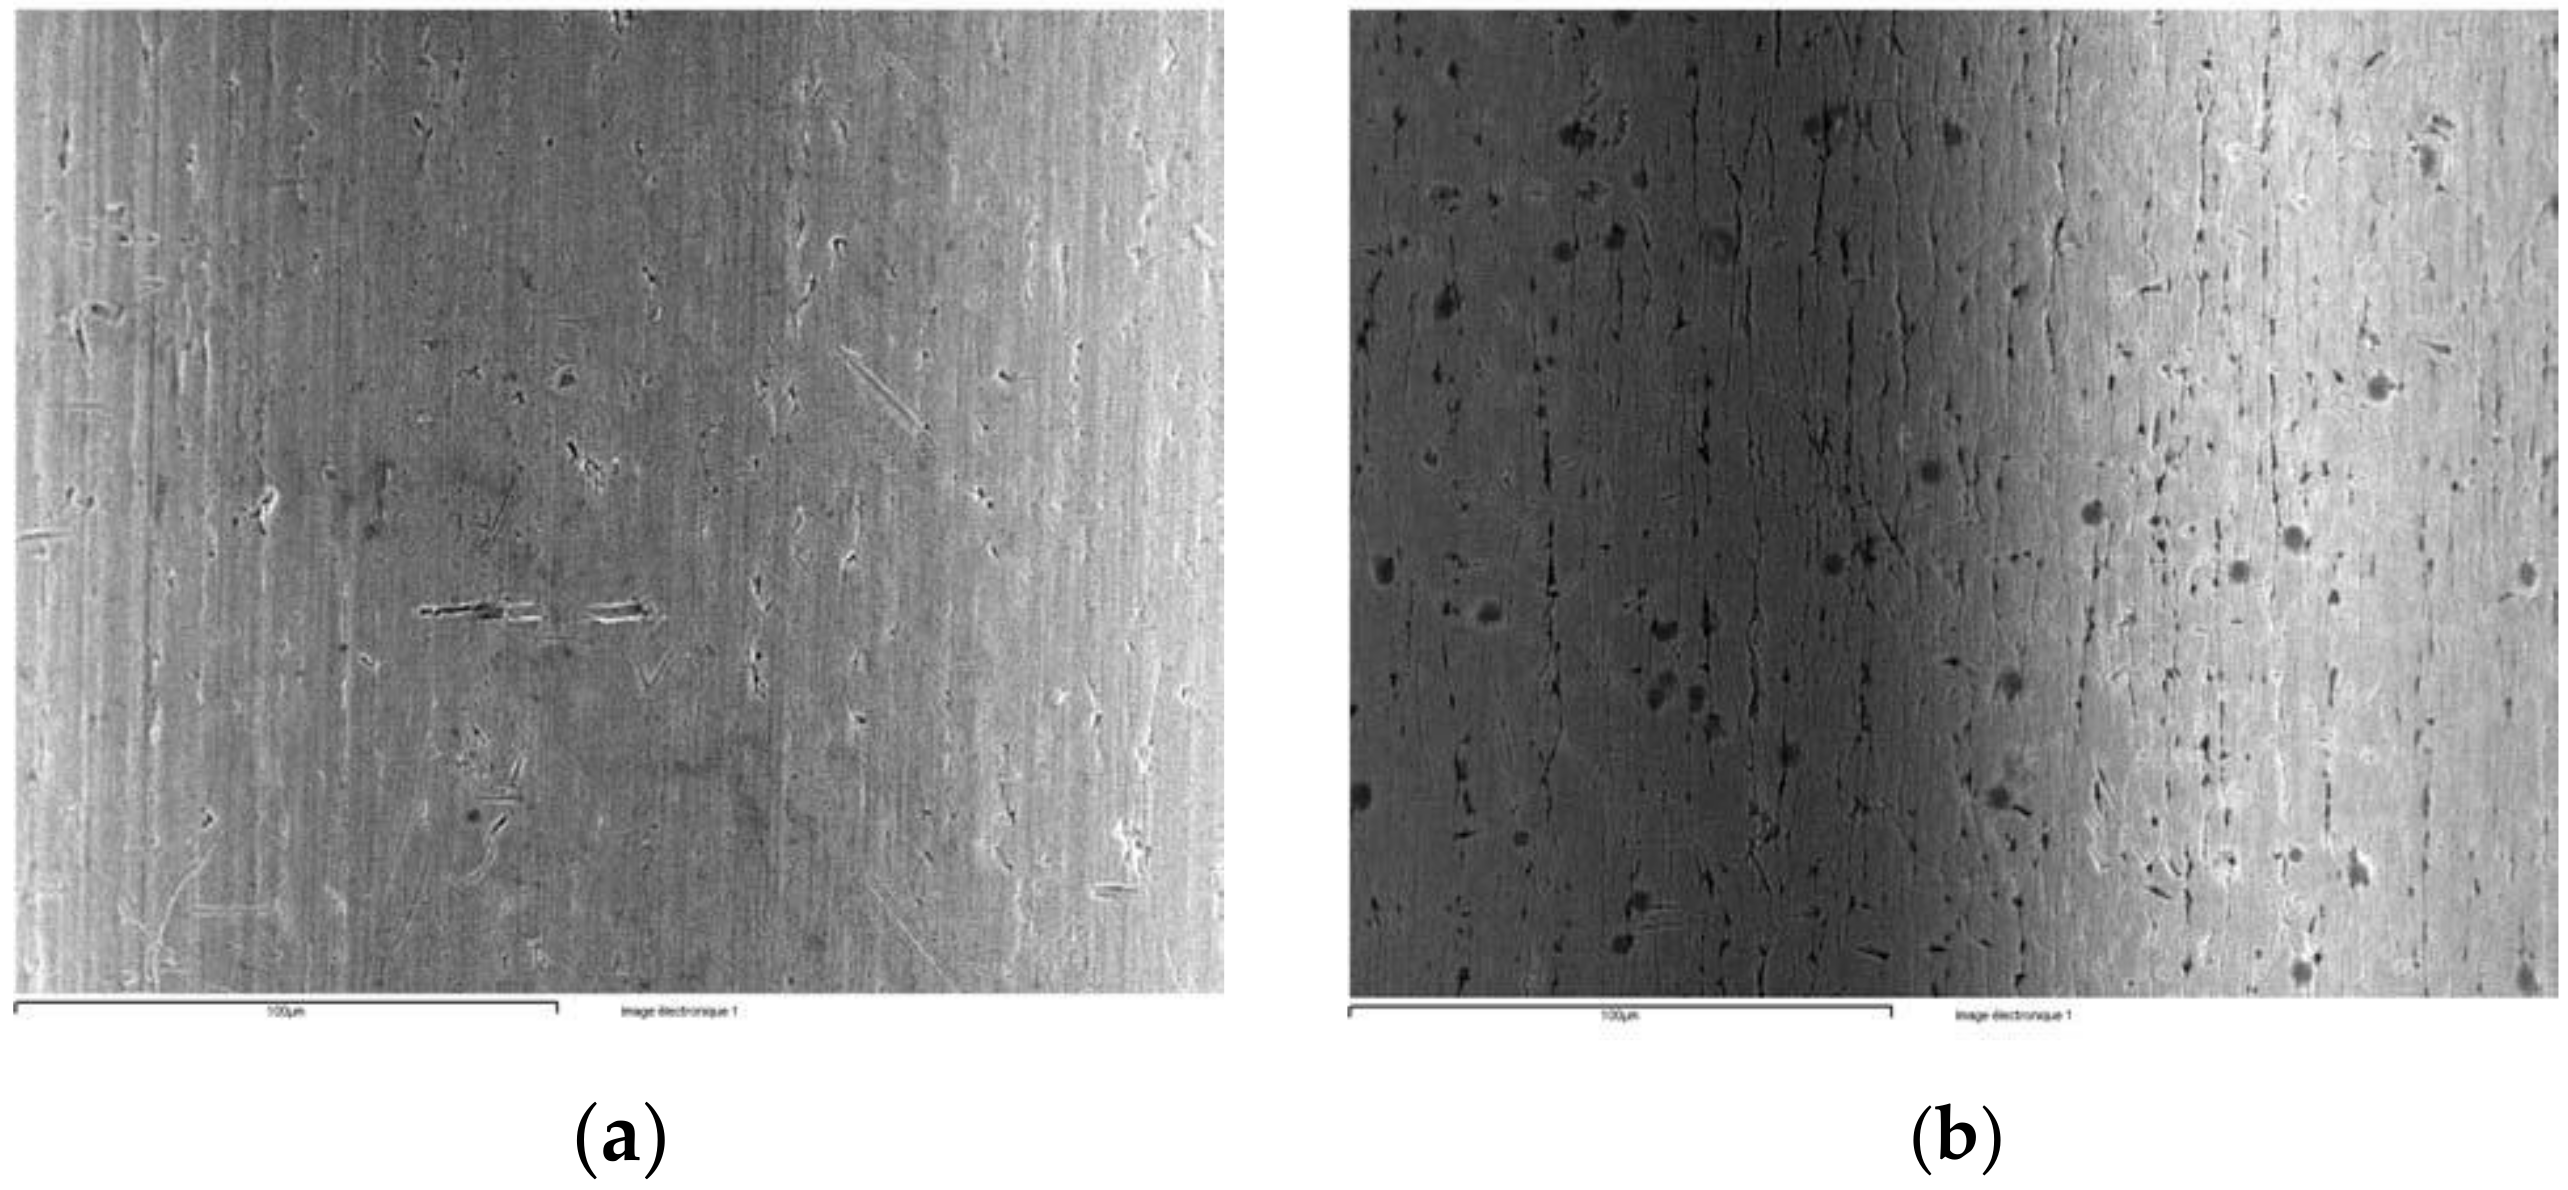
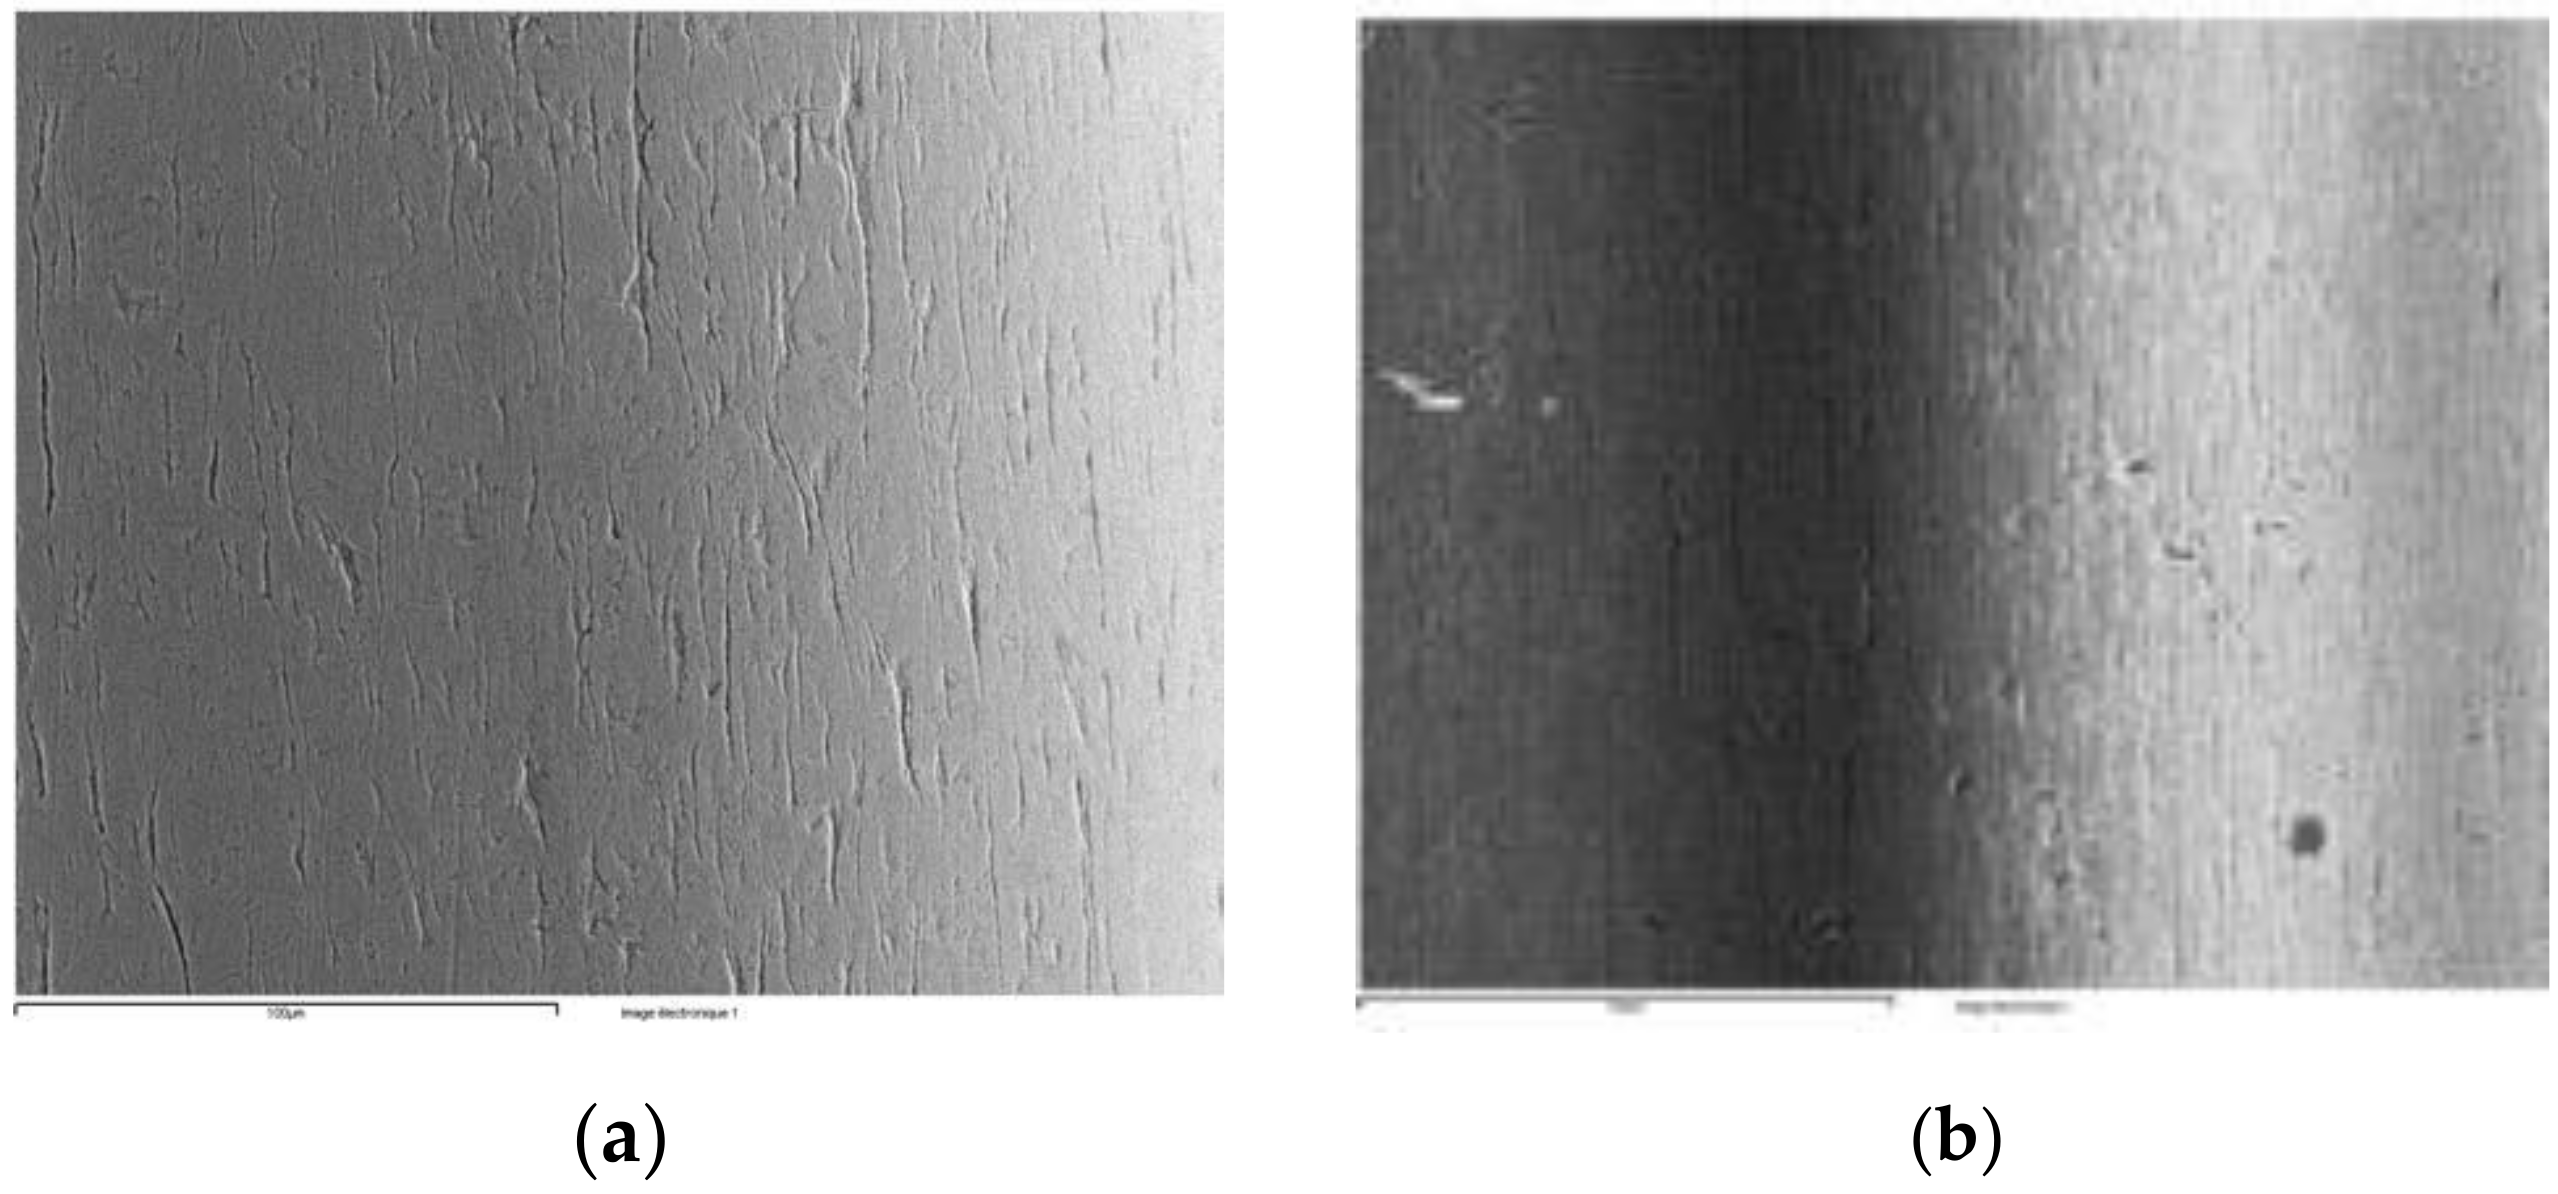
3.2. Microstructure Observation by SEM

The hypotubes were examined by SEM. The irregular appearance of the structure coincided with the rough appearance of the internal surface (Figure 9).
Hypotube #6 presented a longitudinal defect (Figure 10)—due not to corrosion but instead to a tearing off, probably a consequence of the stretching process.
Because the microstructure was very fine and hardened, it would have been very difficult to assess the grain index (Figure 11).
The heating and cooling that take place during the welding process affect the microstructure, surface state, and composition of the welds and adjacent base metals, i.e., the sensitization of the welded area.
There is a very strict acceptance protocol after a welding process, and the following, extremely strict requirements for the parameters have to be respected:
(a) The external diameter must be ED ± 1.5% or minimum of 0.23 mm. (b) The wall thickness must be WT ± 10% or minimum 0.2 mm. (c) Lines, scratches, indents, and cavities, should be considered as defects. When counting the number of defects per meter, several defects within 1 cm (the unit of measurement) are considered to comprise one 1 cm defect. The maximum acceptable limit is 5 cm of defects per meter. (d) Regarding the crushing resistance test: when swatting a hypotube with a hammer, if the weld resists, it should be considered compliant. (e) A metallographic analysis should be used to show the eventual porosities, cracks, and welding seam shape and position. (f) The shape or geometry of the welding seam considered acceptable following welding seam criteria is shown in Figure 12. (g) The heat treatment condition must be considered, whether it is welded from hot-rolled or cold-rolled strip or it is bright annealed (annealing carried out in conditions that make it possible to obtain a metal surface free of oxides or showing only very slight coloring). Heat treatment should be done in a controlled atmosphere to retain the material’s non-oxidized surface or to remove any present oxidized layers. (h) One must obtain a material certificate (through chemical analysis) and measure the mechanical properties (Rp0.2 Mpa or N/mm2, Rp1.0 Mpa or N/mm2, Rm Mpa, or N/mm2 and A100 (%)).
Figure 13 and Figure 14 show the weld appearance of hypotube #8(ref). The transversal cross section reveals the welding cord due to the manufacture process (Figure 14).

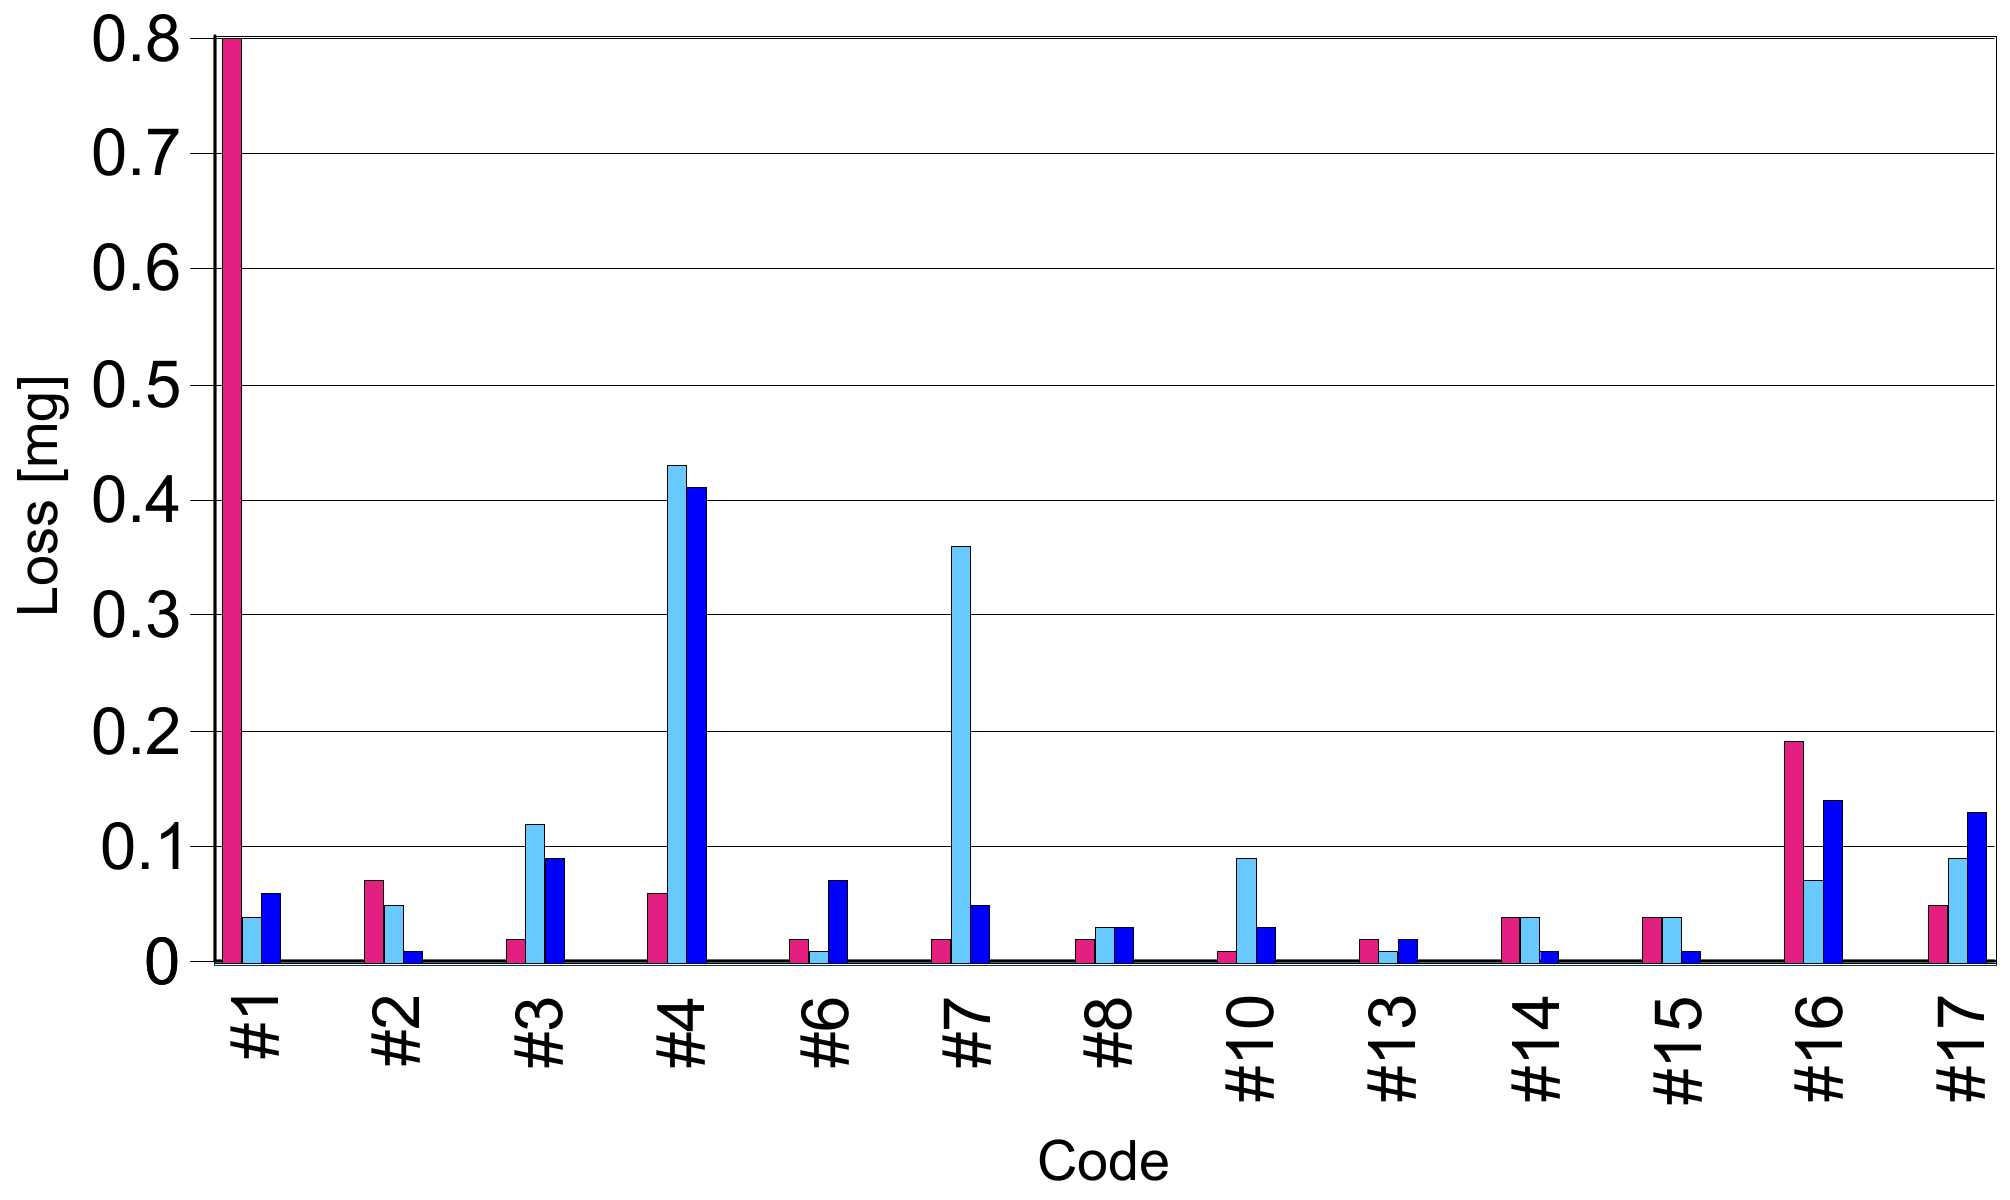
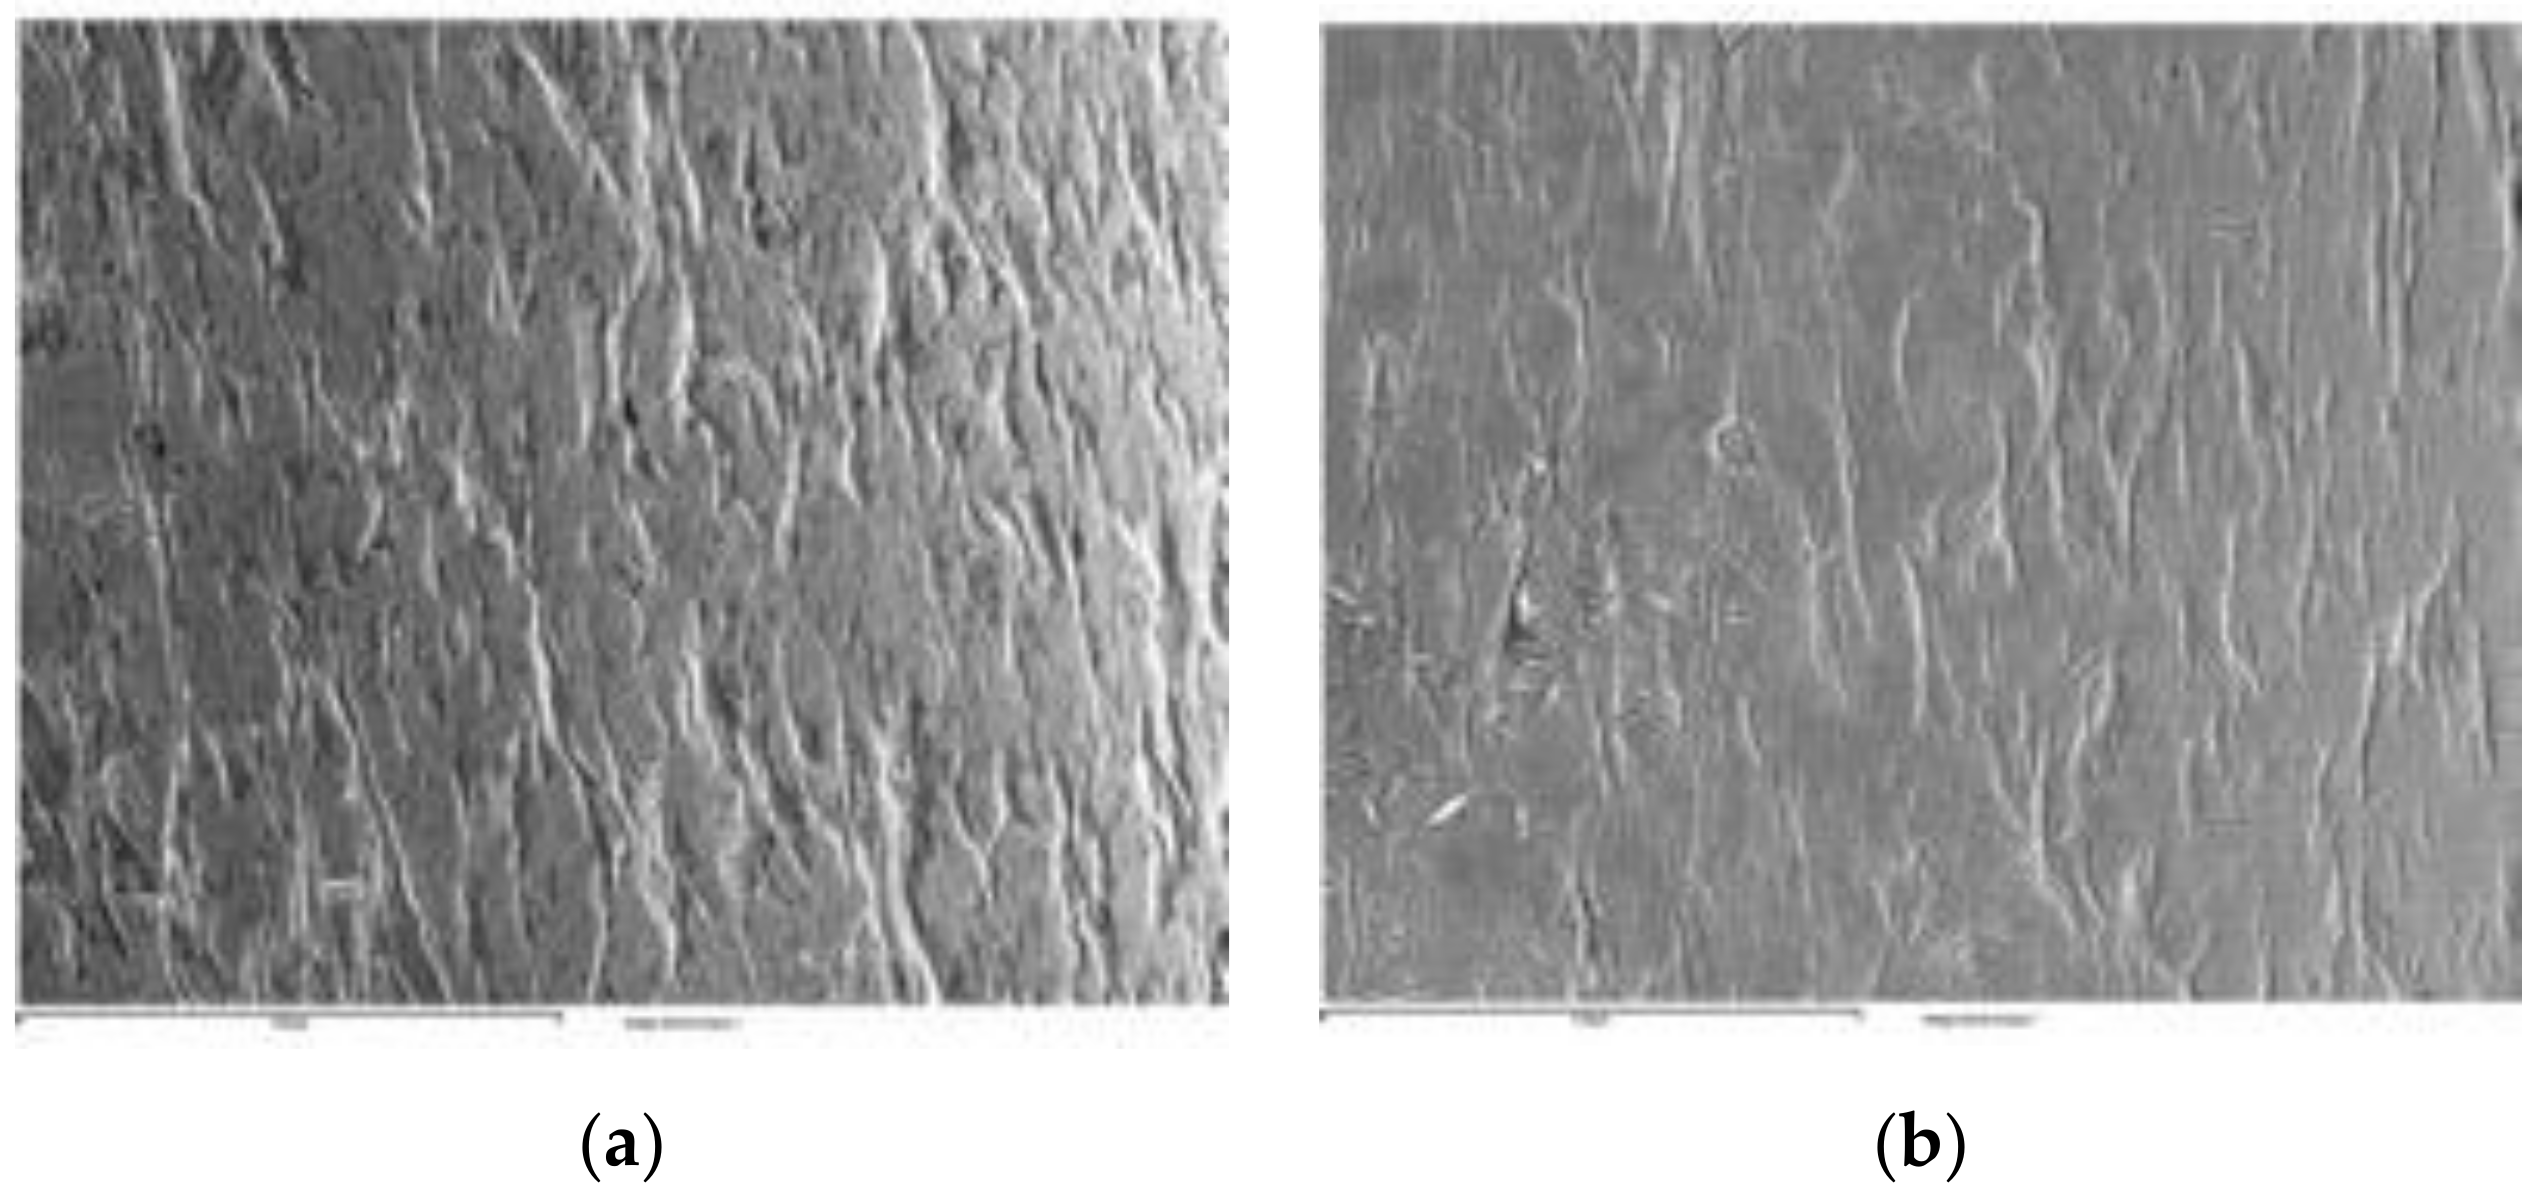
3.3. Detection of Susceptibility to Intergranular Corrosion (the Strauss Test)

Despite their name, stainless steels are highly sensitive to localized corrosion, namely pitting, crevice, and intergranular.
Our previous studies showed that the transverse surface is clearly more sensitive than the longitudinal one in the rolling direction [16,17,18], a fact also supported by Nickel release tests [16,17,18].
The corrosion resistance of both autogenous welds and welds made with a corresponding filler metal is lower than in cases of properly annealed base metals [19]. Corrosion is the consequence of microsegregation, the creation of secondary phases, inhomogeneous area formation, recrystallization and grain growth in the heat-affected zone (HAZ), the evaporation of alloying elements of molten mass, and the contamination of the solidification welding basin.
Hypotubes #1, #2(ref), #3, #4, #6, #7, #8(ref), #10, #13(ref), #14, #16, and #17 (Table 2) were evaluated by the Strauss test. Three samples from each hypotube were tested. For each sample, the following investigations were carried out: SEM examination, mass loss measurements on an analytical balance ±10 μg, and (after folding observation for possible cracks), optical microscopy. Figure 15 shows the mass loss for the tested hypotubes. The average mass loss for each hypotube is presented in Table 5.
In general, the tested hypotubes did not exhibit intergranular corrosion, as mass losses were low. Most of the samples showed a very small mass loss, close to the limit of the analytical balance. Nevertheless, hypotubes #1, #4, and #16 showed very significant mass losses (Figure 15 and Table 5).
SEM observations at magnification did not show any obvious degradations of the surfaces. Observation of the surfaces enabled us to qualitatively discriminate the samples without speaking of intergranular corrosion. Thus, hypotubes #1, #4, and #16 presented the most degraded surfaces (Figure 16, Figure 17 and Figure 18). Considering the mass losses and the electronic micrographs, it appears that hypotubes #1 and #4 were most affected (Figure 16 and Figure 17). The rest of the hypotubes had roughly the same behavior with respect to this test. For comparison, Figure 19 presents reference hypotube #13.
For the bending test, in accordance with ASTM A 262-15, the samples were folded and observed under an optical microscope at a low magnification (64×). No cracks revealing intergranular corrosion were observed.
Overall, the mass loss confirmed a certain corrosion process but no intergranular corrosion. The corrosion was probably due to incorrect cleaning and passivation processes.

3.4. Corrosion Evaluation by Electrochemical Methods

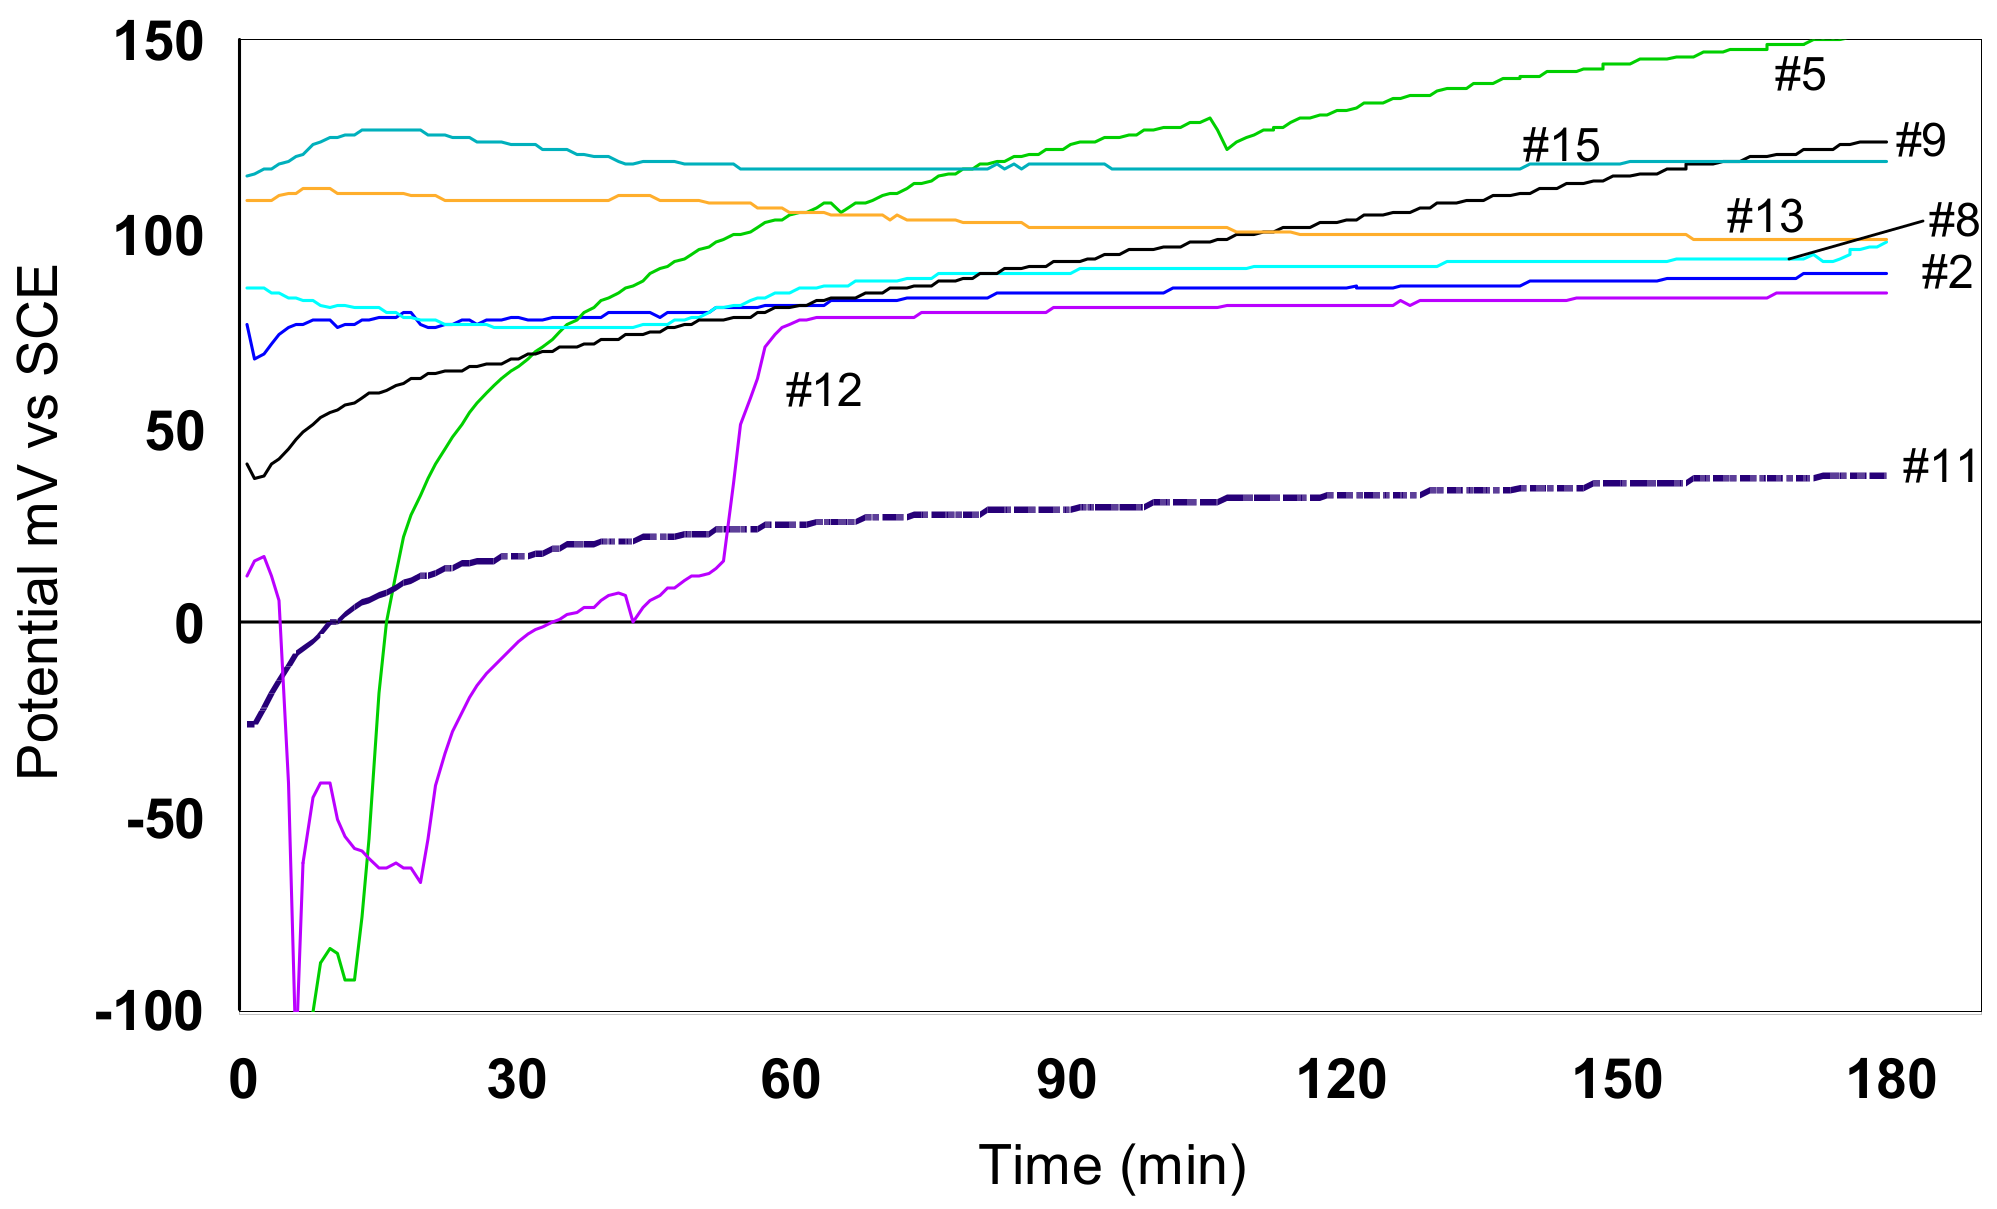
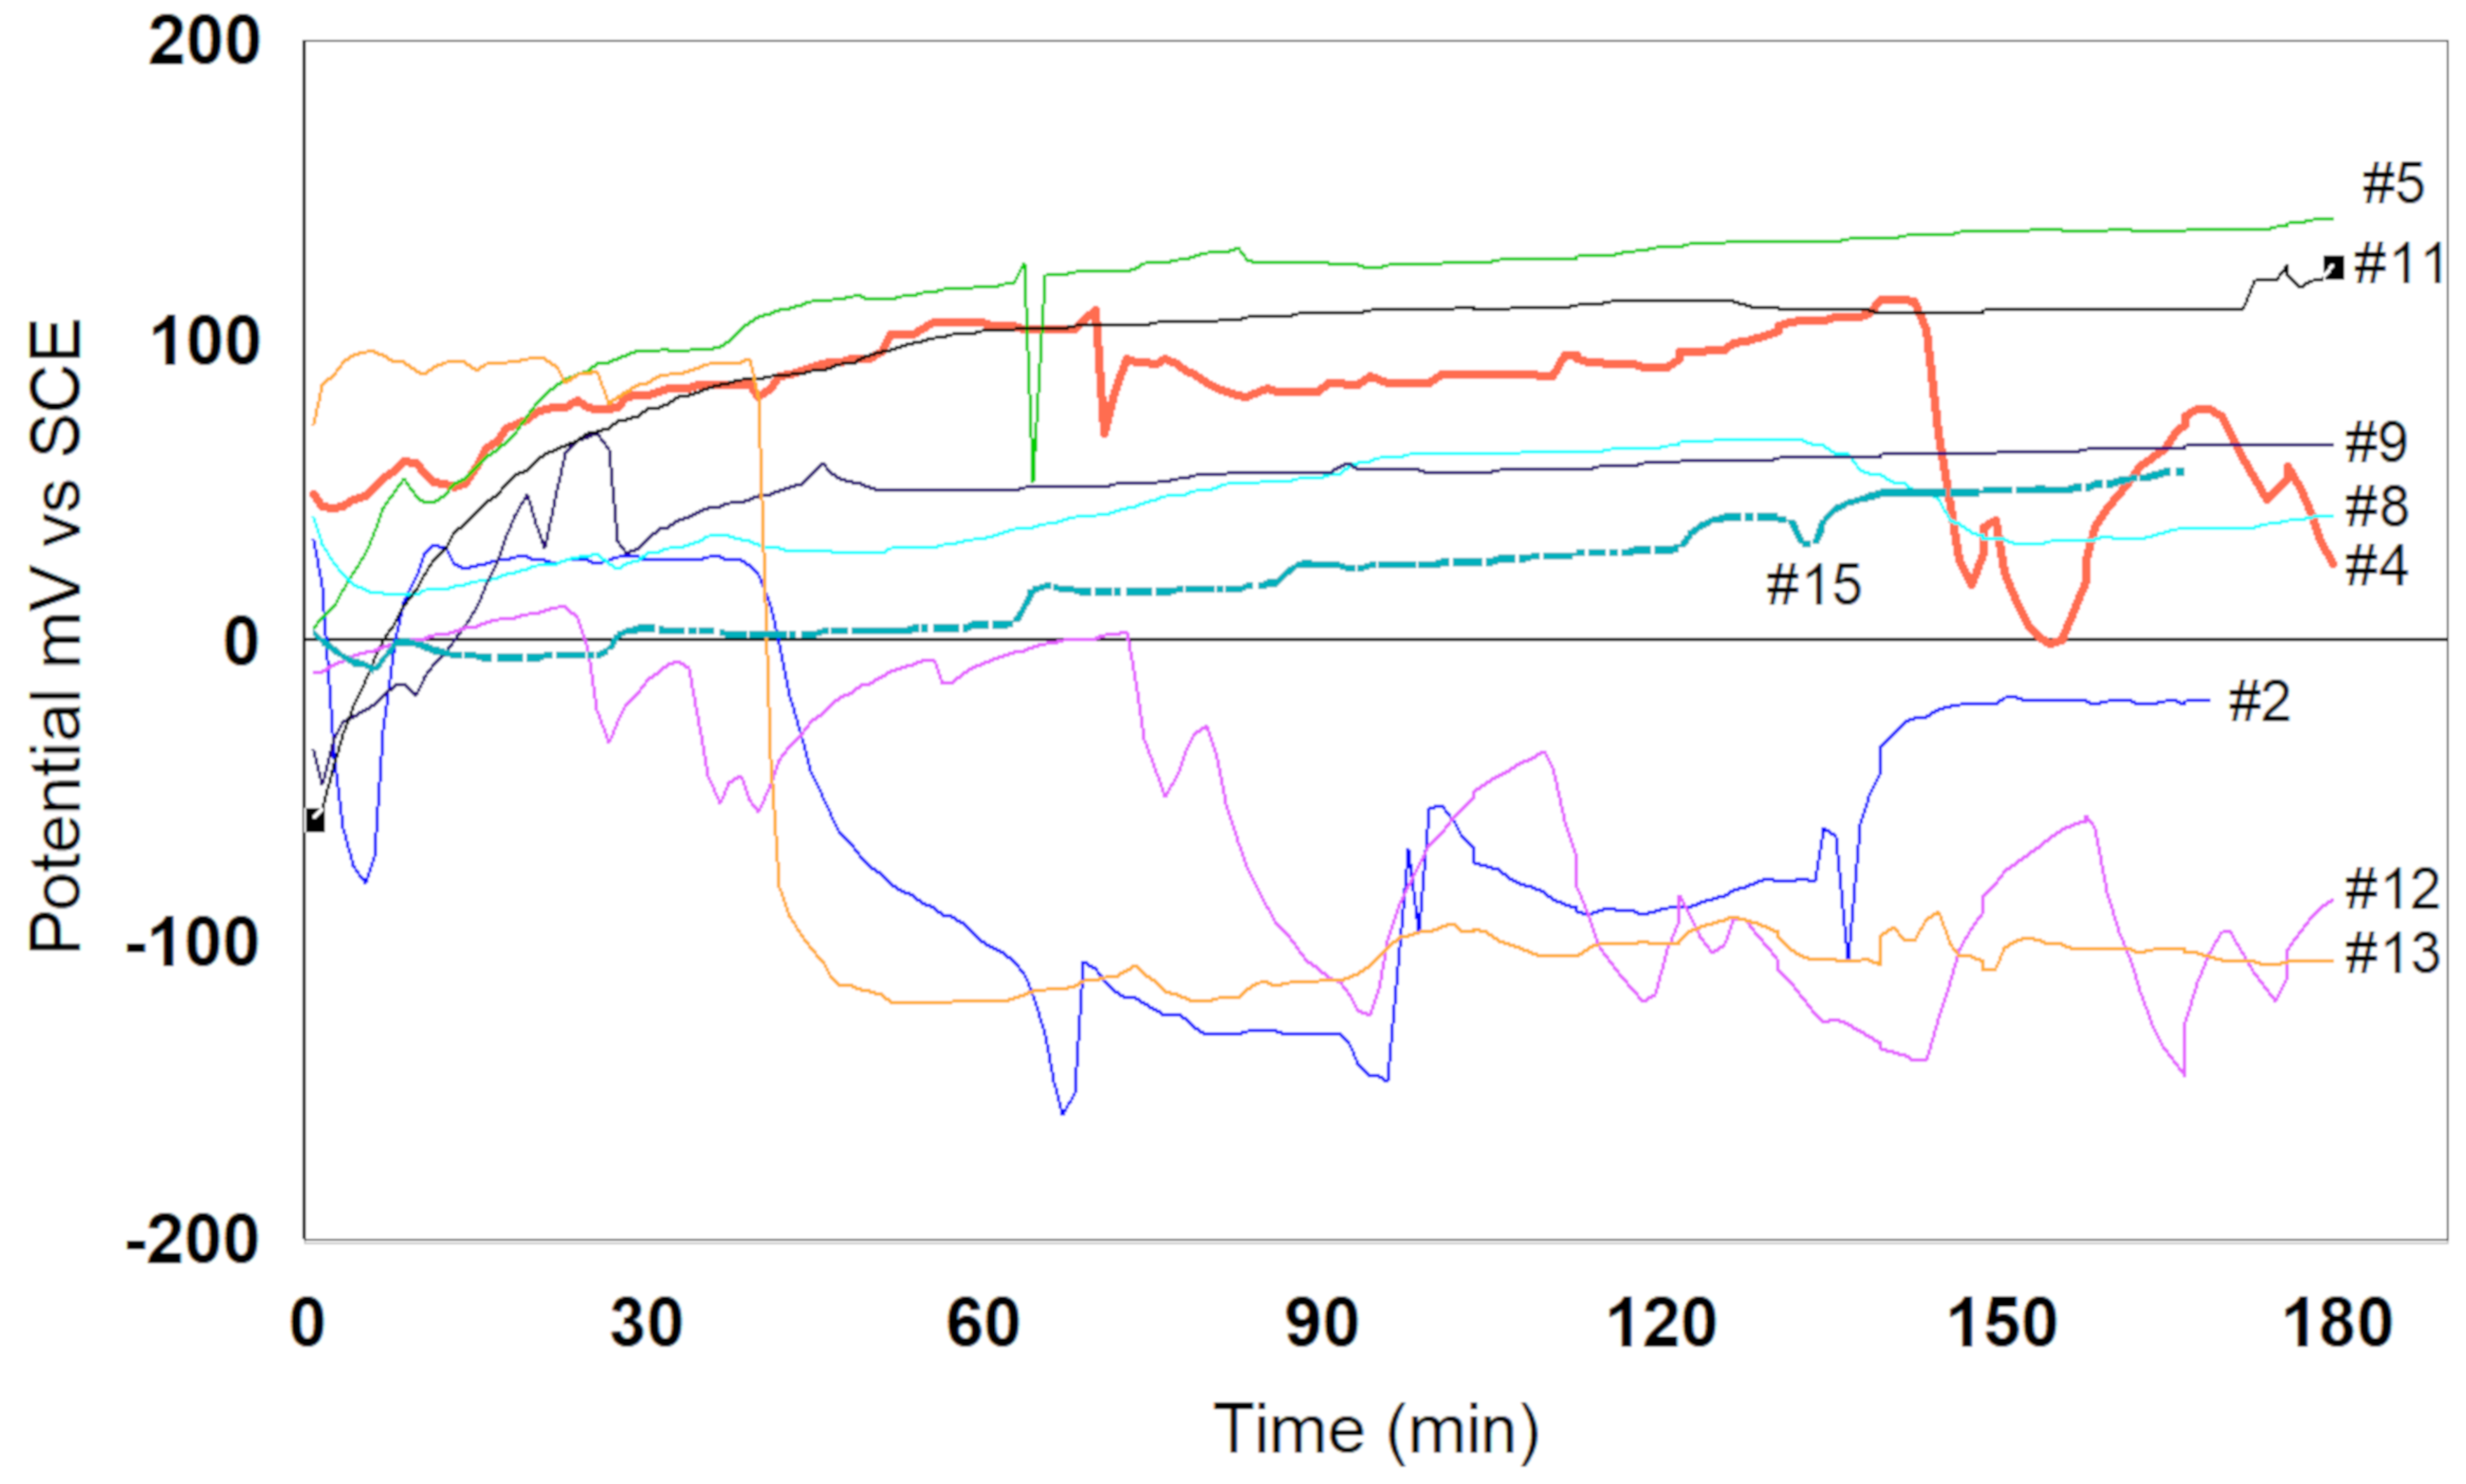
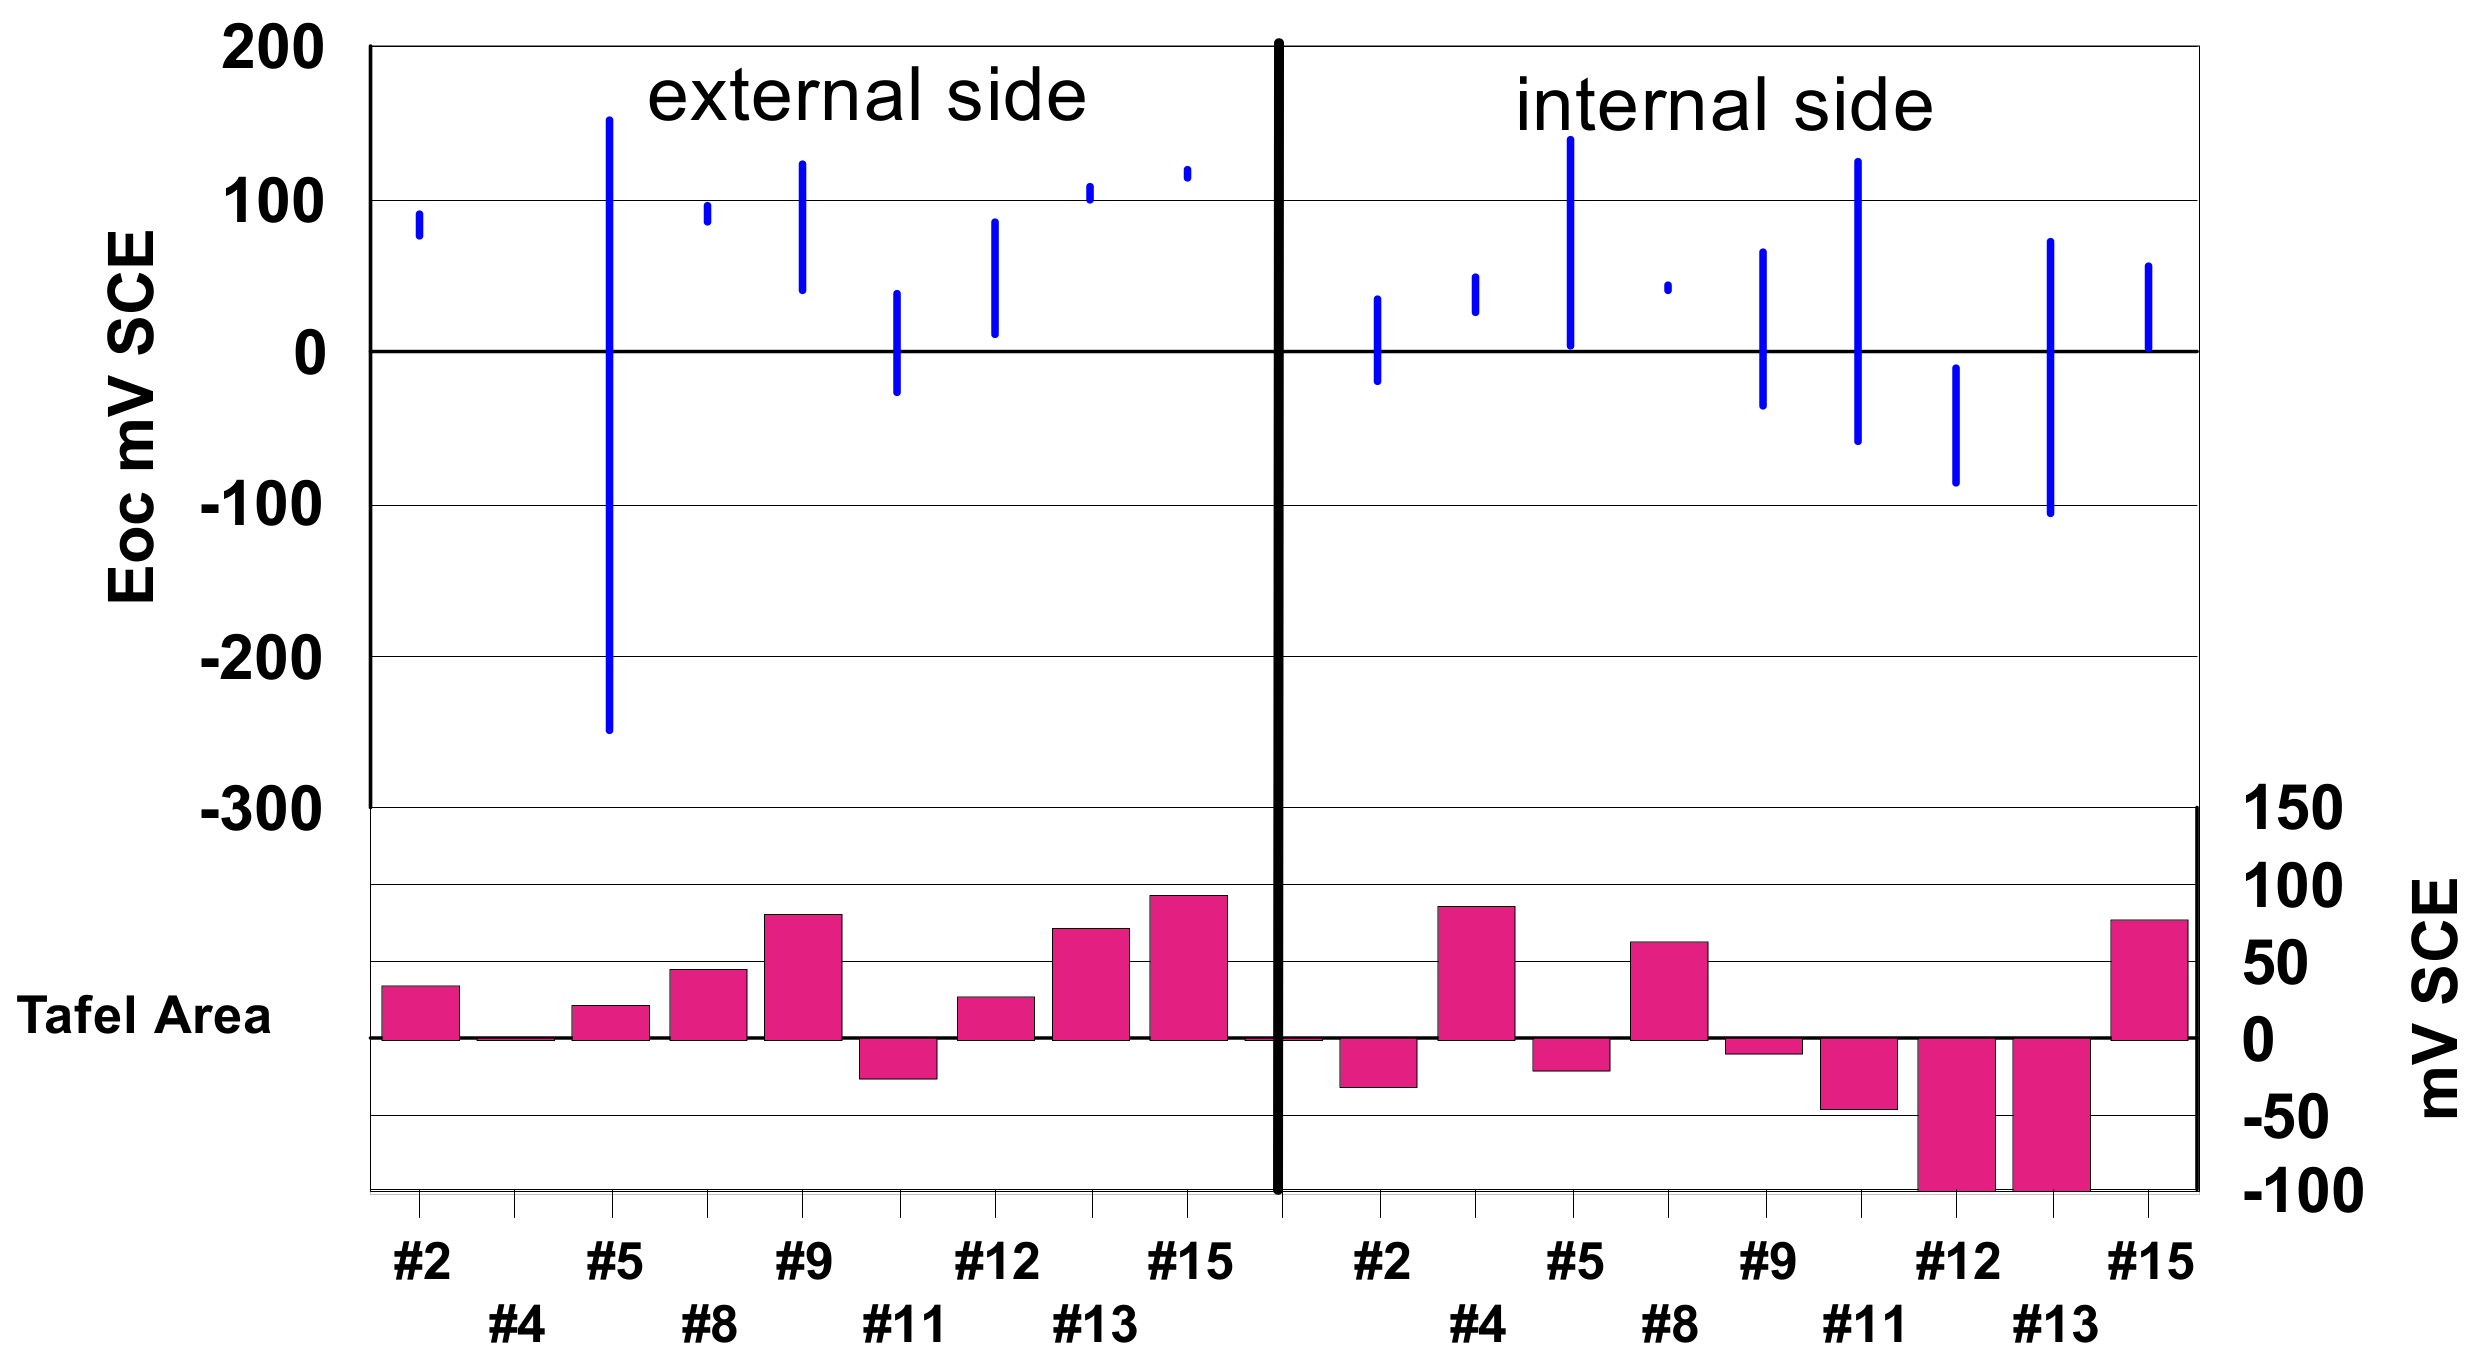
3.4.1. The Open Circuit Potential

The electrical potential of a metal immersed in an electrolyte varies over time but stabilizes at a stationary value after a long immersion time. This potential is not a characteristic of a metal, but it does depend on the experimental conditions, particularly the concentration, the temperature, and the oxygen content of the medium, as well as the surface condition of the metal. The open circuit potential is therefore directly related to the presence or absence of a passivation film [20].
The electrochemical reactions at the metal–electrolyte interface are not reversible, and the equilibrium equation of the Nernst type is therefore no longer valid. Under these conditions, the open-circuit potential is an irreversible potential, since the nature of the metal–electrolyte interface varies over time and can serve as a criterion for the qualitative characterization of the passive film formed on the surface of the metal [21,22].
For both the external and internal surfaces, the open circuit potentials were measured for 180 min. The open circuit potential as a function of time in the external surface of the hypotubes is shown in Figure 20.
Hypotubes # 5, #11, and #12 revealed insufficient passivation. They started from negative (anodic) potential values but had a “passivation” tendency in time in the considered electrolytic medium. The open circuit potential value of a passivated type 304 steel was around +100 mV SCE. Hypotubes #9, #11, and #5 continued to passivate in the electrolytic medium. The hypotubes that underwent a chemical passivation were #2(ref), #8(ref), #13(ref), and #15, as their open circuit potential was characterized by small variations and did not reveal disturbances. In the case of hypotube #4, the external surface presented an electrically non-conductive protective layer for the considered time period of 180 min, so registering the potential was not possible.
The open circuit potentials measured for the internal surface of the hypotubes are presented in Figure 21. Hypotubes #2(ref), #5, #9, #11, #12, #13(ref), and #15 were not chemically passivated. There was a tendency of passivation as a function of time. Hypotubes #2(ref), #9, #11, and #13(ref) started at negative (anodic) potentials. Hypotubes #5 and #15 started at low positive potentials (Table 6) but had a tendency to passivate over time towards a level of 150 mV vs. SCE. The only hypotubes that underwent the passivation of the internal surface were #4 and #8(ref). On the other hand, the electric potential was quite low, and it was difficult to conclude if these values expressed a true chemical passivation in comparison with the external surface of hypotube #8(ref).
A general definition of the passivation state may be considered an impossible task, because it is a question of grouping a series of unusual and very different anode conditions specific to the behavior of metals and metalloids (Fe, Ni, Cr, Mo, W, Cu, V, Al, Mg, Mn, Ba, Si, Ca, etc.) and to the environments they are in contact with into a single sentence. It is impossible to express a general and unique theory that brings together all these abnormal anode conditions, but the main points of view concerning the passivation phenomenon are as follows:
The metals undergo a modification described as a variation of the valence and of the electron density, in balance with the possible ionic states. Passivity is the result of a layer formation, with low electrical conductivity on the metal surface. Various theories have been developed to explain the formation of the passive layer such as the dissolution-precipitation model [23], the nucleation model [24,25], the discharge model proposed by Bockris [26], and the adsorption models (O−2 and OH) proposed by Uhligh [27,28,29,30]. One of the most generally accepted is the formation of a stable OH- (oxy-hydroxide hydrate) film in the area of a few millivolts around the redox potential, Ecorr. More recent articles have brought new information about the passivation process of austenitic steels [31,32,33,34,35], including the role of molybdenum in their passivation [36].
In conclusion, passivity generally represents a kinetic inhibition of the ability of metals and alloys to react with the environment in contact with their surface. Passivity results in the formation of an ultra-thin film (3–100 Å) that is compact, dense, and free of porosity, which uniformly covers the metal surface. It is known that the stationary state of these films is represented by solid oxide layers and not monomolecular adsorption layers [37]. The passivation of a metal or an alloy takes place only if its electrical potential, generated at the film–electrolyte interface, exceeds the passivation potential. The passivation potential, Ep, determined from the polarization curve, is the transition potential from the active state domain to the passive state domain.
There are two ways to reach the passivation state: through the chemical reaction of an oxidant, also known as spontaneous passivation or chemical passivation, and by anodic polarization, also known as anodization.
The passivation process depends on the kinetics of active dissolution in a given medium, the mass transport of dissolution products, the pH and the temperature of the medium, the water content, the chemical composition, and the presence of certain chemical elements [38].
In the case of stainless steels, the presence of chromium, nickel, copper, and molybdenum inhibits anodic dissolution and facilitates the passivation tendency of the surface [36,39,40,41,42,43].

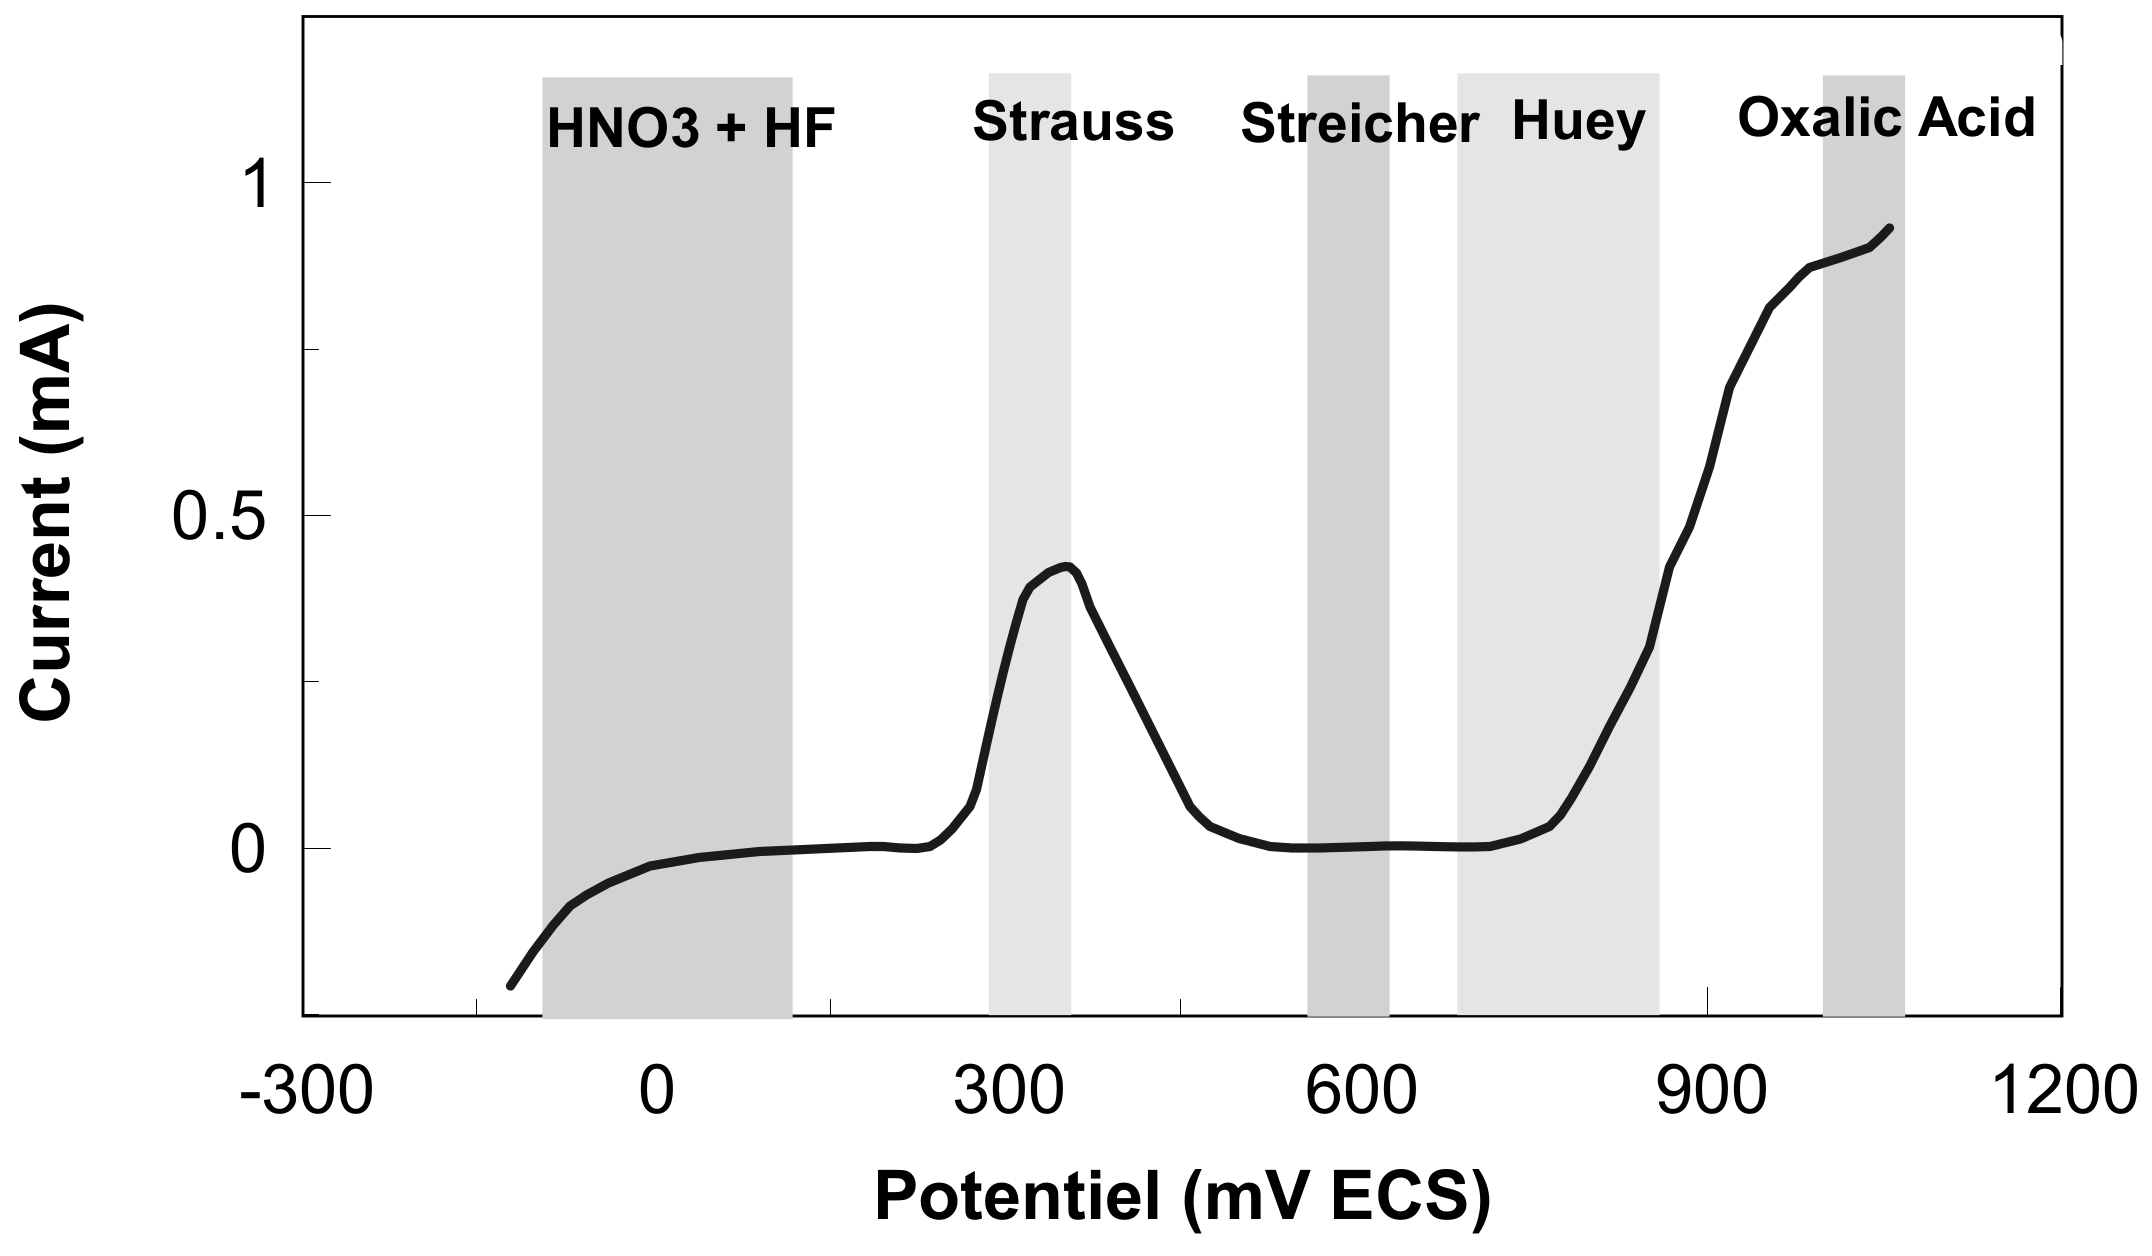
3.4.2. The Polarization Curves in the Tafel Domain

The curves were plotted in the range of −50 mV vs. Ecorr and +150 mV vs. SCE for both the external and internal parts of the hypotube in order to evaluate the value of Ecorr after the “depassivation” and “repassivation” of the surface of the hypotubes.
In an aggressive oxidizing medium, the cathode current, which corresponds to a certain potential value, is higher, and the corrosion potential consequently moves towards higher values. In this case, the corrosion current increases to a certain limit. In fact, if a metal is passive, an increase in the oxidizing power of the environment can reduce the rate of corrosion. The metals that passivate form thin layers of oxide that strongly slow down the dissolution rate. The anodic current, measured as a function of the potential, shows a maximum that separates the so-called active domain (metal in direct contact with the electrolyte) from the so-called passive domain (metal covered with an oxide film). In order for a passive metal to show good corrosion behavior, its corrosion potential must therefore lie in the passive domain. If a metal that has undergone chemical passivation in an oxidizing medium is immersed in an electrolyte, the value of the corrosion potential Ecorr will be Ep < Ecorr < Eb, where Eb is the breakdown potential on the polarization curve and Ep is the electrical potential in open circuit for a given time of sample immersion. If the passivation is correctly done, a scan in the cathodic area will not really influence the Ecorr; therefore, after returning to the anodic domain, the value of Ecorr will remain in the passive domain and will be positive. In other words, the stability of the passivation film will not be disturbed by the cathodic scan.
The scanning curves plotted in the Tafel domain are presented in Figure S1 (Supplementary Materials). For each hypotube, the two curves plotted for the external surface (E) and the internal surface of the hypotube (I) are comparatively represented.
In Table 7, the parameters measured and calculated in the Tafel domain are presented. With the technical development of electronic measurement systems where background noise is in values of Femto and in a Faraday–Helmholtz protection circuit, current values of the order of nano–pico amperes can be measured. The quantities of electric charges calculated by integrating the surfaces below curves in the anode domain are small, in the order of a few micro coulombs. The question to be asked is what is the toxicological risk for a patient in contact with hypotubes?
It should be noted that when passing from the cathode zone to the anode zone, the potential value for the current equals zero (I = 0); in other words, E (i = 0) or Ecorr is not always positive. Therefore, a cathode scan of −150 mV is sufficient to destabilize the “passivation film” of certain samples.
Thus, three distinct situations have been found:
  • First bullet; Surfaces with a positive open circuit potential in the Tafel domain after scanning, where Ecorr is always positive.
  • Surfaces with a positive open circuit potential (at the end of the test) and a negative after scanning Ecorr in the Tafel domain.
  • Surfaces with a negative open circuit potential and a negative after scanning Ecorr in the Tafel domain.
In Figure 22, a summary of the results is represented. In the upper section, the open circuit potential values—, or more precisely, the starting value and the value at the end of the test—are represented. In the lower section, the Ecorr values after plotting the potentiodynamic polarization curves in the Tafel domain are represented.
The two surfaces of the hypotubes, external and internal, were treated separately.
Regarding the external surface, according to the results obtained by the open circuit and Tafel polarization measurement techniques, the hypotubes that underwent a chemical passivation treatment were #2(ref), #8(ref), #13(ref), and #15.
The surfaces of hypotubes #9 and #12 also showed passivation, but there was a variation of potential due to the fact that the pseudo-stationary equilibrium had not been reached.
In these cases, the layer was often strengthened as a result of the action of dissolved oxygen or by the formation of insoluble corrosion products.
In the case of hypotube #11, there was a passivation tendency in the presence of oxygen or corrosion products, but the “film” of the surface was not stable, and it was easily dislodged by a cathodic scan (Ecorr = −25 mV vs. SCE).
Regarding the internal part, according to the obtained results, the following remarks can be made.
Hypotubes #2(ref), #5, #9, #11, #12, and #13(ref) did not reveal passivated surfaces. There was a passivation tendency (not well-defined), except for hypotube #12, which could naturally occur due to the presence of dissolved oxygen and dissolving products or during the storage of the sample in the air. The passivation film was unstable, and it did not really provide a protective property for the metal surface (rupture or porosity). As a result, it is not likely that the interior of these hypotubes underwent chemical passivation.
Hypotubes #4, #8(ref), and #15 showed surface passivation, according to the two investigation methods. Presumably they underwent the passivation treatment of the internal surface, as also confirmed by the results obtained for the external surfaces. A further remark has to be made: the potential values in open circuit were lower for the internal surfaces than for the external ones, but it was obviously the same steel. Hypotube #4 made an exception, because it had an external protective surface and its open circuit potential could not be measured.
In our opinion, the two techniques (open circuit potential and polarization curve in the Tafel domain) used for the evaluation of the surface condition (passivated or non-passivated) of hypotubes have proven to be reliable. According to the results obtained for the external surfaces, only hypotubes #8(ref), #13(ref), and #15 had undergone passivation. As for the internal parts, only hypotubes #4 and #8(ref) seem to have been passivated by a chemical oxidation process.

4. Conclusions

It is preferable that welds, which are usually sensitive elements, are in the cathode position. Thus, the risk of launching localized corrosion phenomena (pitting, crevice, and intergranular) powered by a galvanic battery remains very low. From this point of view, the tested hypotubes confirmed the cathodic position of the laser weld. The Strauss test did not reveal intergranular corrosion in the welds, and no degradation of the welds after scanning in the Tafel domain was found. The welds did not reveal microcracks, incorporated gas bubbles or blisters, or specific defects in welding. There are two issues to be considered. The first regards respecting the very strict manufacturing parameters, and the second regards the external and internal passivation of the hypotubes. One must be aware of the potential risks that derive from the release of metal cations like Cr, Ni, Mo, Mn, and Fe, as well as traces of other chemical elements in the coronary artery during coronary intervention.

Supplementary Materials

The following are available online at https://www.mdpi.com/article/10.3390/coatings11040448/s1, Figure S1: Polarization curves in the Tafel domain of the hypotubes: (a). #2(ref), (b). #4, (c). #5, (d). #8(ref), (e). #9, (f). #11, (g). #12, (h). #13(ref), (i). #15. E: external surface; I: internal surface.

Author Contributions

Conceptualization, L.R. and L.C.A.; methodology, L.R.; validation, L.R.; formal analysis, L.R.; investigation, L.R.; resources, L.R.; data curation, L.R..; writing—original draft preparation, L.R. and L.C.A.; writing—review and editing, L.C.A.; visualization, L.C.A.; supervision, L.R.; project administration, L.R. All authors have read and agreed to the published version of the manuscript.

Funding

This research received no external funding.

Institutional Review Board Statement

Not applicable.

Informed Consent Statement

Not applicable.

Data Availability Statement

Not applicable.

Conflicts of Interest

The authors declare no conflict of interest.

References

  1. Streicher, M.A. Austenitic and Ferritic Stainless Steels. In Uhlig’s Corrosion Handbook, 3rd ed.; Winston Revie, R., Ed.; Revised by Grubb, J.F.; Wiley: Hoboken, NJ, USA, 2011; pp. 657–694. [Google Scholar]
  2. Fondation Suisse de Cardiologie, Angioplastie Coronaire. Available online: https://www.swissheart.ch/fr/maladies-cardiaques-avc/traitements/traitements/angioplastie-coronaire.html (accessed on 12 December 2020).
  3. Ali, R.; Greenbaum, A.B.; Kugelmass, A.D. A Review of Available Angioplasty Guiding Catheters, Wires and Balloons–Making the Right Choice. Interv. Cardiol. Rev. 2012, 7, 100–103. [Google Scholar] [CrossRef]
  4. Lin, Z.; Hsiao, H.-M.; Mackiewicz, D.; Anukhin, B.; Pike, K. Anisotropic Behavior of Radiopaque NiTiPt Hypotube for Biomedical Applications. Adv. Eng. Mater. 2009, 11, B189–B193. [Google Scholar] [CrossRef]
  5. Diagnostic and Interventional Cardiology, The Basics of Guide Wire Technology. Available online: https://www.dicardiology.com/article/basics-guide-wire-technology (accessed on 12 December 2020).
  6. Iñigo-García, L.A.; Iñigo-Almansa, L.; Gil-Jiménez, T.; Siles-Rubio, J.R.; Ramírez-Moreno, A.; Pons, J.; Sanz Vazquez, O.; Munoz Bellido, J.F.; Urbaneja Salas, A.; Ruiz Mateas, F. Coronary Angioplasty Guidewires: Differential Characteristics and Technology. J. Cardiol. Curr. Res. 2017, 8, 00278. [Google Scholar] [CrossRef]
  7. Cunat, P.J. Soudabilité et métallurgie des soudures. In Les Aciers Inoxydables; Lacombe, P., Baroux, B., Beranger, G., Colombier, L., Hochmann, J., Eds.; Les Editions de Physique: Les Ulis, France, 1990; pp. 798–855. [Google Scholar]
  8. Siddhagiri Metals & Tubes, Welded Tubes. Available online: http://www.siddhagirimetals.com/welded-tube-supplier-astm-b516-b704-b515-b730-b626-a789-a269-b467-b468-b674-b338-a519.html (accessed on 12 December 2020).
  9. VitaNeedle Stainless Steel, Welded and Drawn Tubing. Available online: https://www.vitaneedle.com/welded-and-drawn-tubing (accessed on 12 December 2020).
  10. Høl, P.J.; Gjerdet, N.R.; Jonung, T. Corrosion and metal release from overlapping arterial stents under mechanical and electrochemical stress-An experimental study. Mech. Behav. Biomed. Mater. 2019, 93, 31–35. [Google Scholar] [CrossRef] [PubMed]
  11. Zhang, C.; He, L.; Chen, Y.; Dai, D.; Su, Y.; Shao, L. Corrosion Behavior and in Vitro Cytotoxicity of Ni-Ti and Stainless Steel Arch Wires Exposed to Lysozyme, Ovalbumin, and Bovine Serum Albumin. ACS Omega 2020, 5, 18995–19003. [Google Scholar] [CrossRef]
  12. Gotman, I. Characteristics of metals used in implants. J. Endourol. 1997, 11, 38338–38339. [Google Scholar] [CrossRef] [PubMed]
  13. ASTM A262-15, Standard Practices for Detecting Susceptibility to Intergranular Attack in Austenitic Stainless Steels, ASTM International. 2015. Available online: www.astm.org (accessed on 2 May 2020).
  14. Streicher, M.A. Intergranular. In Corrosion Tests and Standards: Application and Interpretation, 2nd ed.; Baboian, R., Ed.; ASTM International: West Conshohocken, PA, USA, 2004; pp. 244–266. [Google Scholar]
  15. Henthorne, M. Intergranular corrosion in Iron and Nickel Base Alloys. In Localized Corrosion-Cause of Metal Failure; Henthorne, M., Ed.; ASTM Technical Publication: Philadelphia, PA, USA, 1972; pp. 66–119. [Google Scholar]
  16. Reclaru, L.; Lüthy, H.; Ziegenhagen, R.; Eschler, P.-Y.; Blatter, A. Anisotropy of nickel release and corrosion in austenitic stainless steels. Acta Biomater. 2008, 4, 680–685. [Google Scholar] [CrossRef]
  17. Reclaru, L.; Ziegenhagen, R.; Eschler, P.-Y.; Blatter, A.; Lüthy, H. Effects of Crystallographic Orientation of Stainless Steels on Pitting and Crevice Corrosion and Nickel Release. In New Research on Biomaterials; Bloomington, D.R., Ed.; Nova Science Publisher Inc.: New York, NY, USA, 2007; pp. 237–279. [Google Scholar]
  18. Reclaru, L.; Ardelean, L.C. Corrosion Susceptibility and Allergy Potential of Austenitic Stainless Steels. Materials 2020, 13, 4187. [Google Scholar] [CrossRef]
  19. ASM Handbook. Corrosion of Stainless Steel Weldments, Corrosion: Fundamentals, Testing, and Protection; ASM International: Russell Township, OH, USA, 2003; Volume 13A, pp. 301–316. [Google Scholar]
  20. Wagner, C.; Traud, W. Über die Deutung von Korrosionsvorgängen durch Überlagerung von elektrochemischen Teilvorgängen und über die Potentialbildung an Mischelektroden. Z. Electrochem. 1938, 44, 391–402. [Google Scholar] [CrossRef]
  21. Haruyama, S. Electrochemical methods in passivity study. Corros. Sci. 1990, 31, 29–38. [Google Scholar] [CrossRef]
  22. Olefjord, I.; Elfstrom, B.-O. The Composition of the Surface during Passivation of Stainless Steels. Corrosion 1982, 38, 46–52. [Google Scholar] [CrossRef]
  23. Müller, W.J. Die Bedeckungstheorie der Passivität der Metalle und ihre experimentelle Begründung. J. Phys. Chem. 1934, 38, 132. [Google Scholar] [CrossRef]
  24. Fleischmann, M.; Pattison, J.; Thirsk, H.R. Electrocrystallization of thin films of thallous chloride on thallium amalgam. Trans. Faraday Soc. 1965, 61, 1256–1269. [Google Scholar] [CrossRef]
  25. Lukac, C.; Lumsden, J.B.; Smialowska, S.; Staehle, R.W. Effects of Temperature on the Kinetics of Passive Film Growth on Iron. J. Electrochem. Soc. 1975, 122, 1571–1580. [Google Scholar] [CrossRef]
  26. Bockris, J.O.; Genshaw, M.A.; Brusic, V.; Wroblowa, H. The mechanism of the passivation of iron in neutral solutions: An ellipsometric and coulometric investigation. Electrochim. Acta 1971, 16, 1859–1894. [Google Scholar]
  27. Foroulis, Z.A.; Uhlig, H.H. Effect of Cold-Work on Corrosion of Iron and Steel in Hydrochloric Acid. J. Electrochem. Soc. 1964, 111, 522–528. [Google Scholar] [CrossRef]
  28. Kabanov, B.N.; Leikis, Z.I. Untersuchung der Passivität von Metallen durch Messung der Elektrodenimpedanz bei hohen Frequenzen. Z. Elektrochem. 1958, 62, 660–663. [Google Scholar]
  29. Kolotyrkin, Y.M. Electrochemical behaviour and anodic passivity mechanism of certain metals in electrolyte solutions. Z. Elektrochem. 1958, 62, 664–669. [Google Scholar]
  30. Frankenthal, R.P. On the Passivity of Iron-Chromium Alloys: II. The Activation Potential. J. Electrochem. Soc. 1969, 116, 580–585. [Google Scholar] [CrossRef]
  31. Lara Banda, M.; Gaona Tiburcio, C.; Zambrano-Robledo, P.; Cabral, J.A.; Estupinán, F.; Baltazar-Zamora, M.A.; Croche, R.; Vera, E.; Almeraya-Calderón, F. Corrosion Behaviour of 304 Austenitic, 15-5PH and 17-4PH Passive Stainless Steels in Acid Solutions. Int. J. Electrochem. Sci. 2018, 13, 10314–10324. [Google Scholar] [CrossRef]
  32. Hegelmann, E.; Hengst, P.; Hollmann, P.; Thronicke, P.; Buchwalder, J.A.; Schimpf, C.; Hunger, R.; Zenker, R. Improvement of Wear and Corrosion Resistance of Austenitic Stainless Steel by Combined Treatment Using Electron Beam Cladding and Subsequent Gas Nitrocarburizing. Adv. Eng. Mater. 2019, 21, 1900365. [Google Scholar] [CrossRef]
  33. Gietzelt, T.; Toth, V.; Huell, A. Challenges of Diffusion Bonding of Different Classes of Stainless Steels. Adv. Eng. Mater. 2017, 23, 1700367. [Google Scholar] [CrossRef] [Green Version]
  34. Srinivasan, N.; Kain, V.; Birbilis, N.; Sunil Kumar, B.; Gandhi, M.N.; Sivaprasad, P.V.; Chai, G.; Lodh, A.; Ahmedabadi, P.M.; Samajdar, I. Plastic deformation and corrosion in austenitic stainless steel: A novel approach through microtexture and infrared spectroscopy. Corros. Sci. 2016, 111, 404–413. [Google Scholar] [CrossRef]
  35. Tranchida, G.; Clesi, M.; Di Franco, F.; Di Quarto, F.; Santamaria, M. Electronic properties and corrosion resistance of passive films on austenitic and duplex stainless steels. Electrochim. Acta 2018, 273, 412–423. [Google Scholar] [CrossRef]
  36. Jargelius-Pettersson, R.F.A.; Pound, B.G. Examination of the Role of Molybdenum in Passivation of Stainless Steels Using AC Impedance Spectroscopy. J. Electrochem. Soc. 1998, 145, 1462–1469. [Google Scholar] [CrossRef]
  37. Kruger, J. Passivity. In Uhlig’s Corrosion Handbook, 3rd ed.; Winston Revie, R., Ed.; Wiley: Hoboken, NJ, USA, 2011; pp. 151–157. [Google Scholar]
  38. Bohni, H. Localized Corrosion of Passive Metals. In Uhlig’s Corrosion Handbook, 3rd ed.; Winston Revie, R., Ed.; Wiley: Hoboken, NJ, USA, 2011; pp. 157–171. [Google Scholar]
  39. Lizlovs, E.A.; Bond, A.P. Anodic Polarization Behavior of High-Purity 13 and 18% Cr Stainless Steels Bond. J. Electrochem. Soc. 1975, 122, 719–723. [Google Scholar] [CrossRef]
  40. Uhlig, H.H.; Revie, R.W. Corrosion and Corrosion Control, 3rd ed.; Wiley-Interscience: New York, NY, USA, 1985. [Google Scholar]
  41. Crow, W.B.; Myers, J.R.; Marvin, B.D. Anodic polarization behaviour of Ni-Al alloys in sulfuric acid solutions. Corrosion 1971, 27, 459–465. [Google Scholar] [CrossRef]
  42. Okamoto, G. Passive film of 18-8 stainless steel structure and its function. Corros. Sci. 1973, 13, 471–489. [Google Scholar] [CrossRef]
  43. Tomashov, N.D.; Chernova, G.P.; Ruscol, Y.S.; Ayuyan, G.A. The passivation of alloys on titanium bases. Electrochim. Acta 1974, 19, 159–172. [Google Scholar] [CrossRef]
Figure 1. The manufacturing process of a welded hypotube.
Coatings 11 00448 g001
Figure 2. Image of a bundle of 500 hypotubes.
Coatings 11 00448 g002
Figure 3. Micro-pilot for pickling and passivation of the hypotubes. 1: Tube originating from the tank (6); 2: reactor containing water (conduction of ultrasonic waves and refrigerant); 3: reactor containing the hypotubes; 4: pipe originating from the tank (6); 5: reactor (3) outlet pipe; 6: buffer tank; 7: pump; 8: sonotrode (titanium booster—2 pieces at 20 kHz); 9: ultrasound generator (20 kHz, with a maximum of 4000 W); 10: generator (9) control software; 11: refrigerating water (arrival); 12: refrigerator water (exit).
Coatings 11 00448 g003
Figure 4. Red coloration due to the presence of orthophenanthroline hydrochloride inside the hypotubes.
Coatings 11 00448 g004
Figure 5. Images of hypotube #8(ref): (a) exterior surface (scale = 200 µm) and (b) interior surface (scale = 500 µm).
Coatings 11 00448 g005
Figure 6. Corrosion potential corresponding to the various intergranular corrosion tests superimposed on a polarization curve of a 304L austenitic steel in 1M H2SO4.
Coatings 11 00448 g006
Figure 7. Electrochemical cell for the evaluation of the external surface.
Coatings 11 00448 g007
Figure 8. Assembly for the evaluation of the internal surface of the hypotube.
Coatings 11 00448 g008
Figure 9. Hypotube #8(ref): structure of the interior surface (scale = 20 µm).
Coatings 11 00448 g009
Figure 10. Longitudinal defect of hypotube #6 (scale = 200 µm).
Coatings 11 00448 g010
Figure 11. Microstructure of hypotube #8(ref): transverse surface (scale = 50 µm).
Coatings 11 00448 g011
Figure 12. Welding seam criteria.
Coatings 11 00448 g012
Figure 13. Longitudinal welding cord: hypotube #8(ref) (scale = 200 µm).
Coatings 11 00448 g013
Figure 14. Weld in cross section: hypotube #8(ref) (scale = 100 µm).
Coatings 11 00448 g014
Figure 15. Mass loss of the samples tested.
Coatings 11 00448 g015
Figure 16. Images of hypotube #1: (a) before the intergranular test (scale = 100 µm) and (b) after the intergranular test (scale = 100 µm).
Coatings 11 00448 g016
Figure 17. Images of hypotube #4: (a) before the intergranular test (scale = 100 µm) and (b) after the intergranular test (scale = 100 µm).
Coatings 11 00448 g017
Figure 18. Images of hypotube #16: (a) before the intergranular test (scale = 100 µm) and (b) after the intergranular test (scale = 100 µm).
Coatings 11 00448 g018
Figure 19. Images of reference hypotube #13(ref): (a) before the intergranular test (scale = 100 µm) and (b) after the intergranular test (scale = 100 µm).
Coatings 11 00448 g019
Figure 20. The open circuit potentials measured on the external surfaces of the hypotubes.
Coatings 11 00448 g020
Figure 21. The open circuit potentials measured on the internal surfaces of the hypotubes.
Coatings 11 00448 g021
Figure 22. Summary of results.
Coatings 11 00448 g022
Table 1. Nominal chemical composition of the 304L steel.
DINAISICSiMnPSCrMoNiOther
1.4306304 L<0.030<1.50<1.50<0.035<0.02017.0–20.0--8.0–12.0N 0.10–0.20
Table 2. Examination plan of the evaluated hypotubes. EDX: energy-dispersive X-ray spectroscopy.
Sampling#1#2(ref)#3#4#5#6#7#8(ref)#9#10#11#12#13(ref)#14#15#16#17
Passivation processx xxxxx xxxx xxxx
EDX analysis xxxx xxx x xxxxx
Carbon (C) and sulphur (S) analysisxxxx xxx x xxxxx
Metallography (welding) xxx x x xx
Strauss Test (ASTM A262-15)xxxx xxx x xxxxx
Optical and SEM observation xxxx xxx x xxxxx
Passivation polarization test x xx x x xxx x
Table 3. The operating procedure for pickling and passivation of the hypotubes.
ProcedureMediumTime (min)
PicklingHNO3 + H3PO4 + CH3COOH60
RinsingDeionized H2O15
Passivation20% HNO320
RinsingDeionized H2O 15
NeutralisationSol. 2% ETA 10
RinsingDeionized H2O10
DryingN2 of N55 purity-
Table 4. Average values of the chemical composition of hypotubes #1–#17.
SpectreSiCrMnFeNi%C%S
Internal surface 0.7418.871.5365.938.420.0460.004
External surface0.7618.711.6166.589.04
Table 5. Average mass loss (mg) calculated for each hypotube.
CodeLoss [mg]
#10.44
#2(ref)0.04
#30.065
#40.235
#60.045
#70.035
#8(ref)0.025
#100.02
#13(ref)0.02
#140.02
#150.035
#160.165
#170.09
Table 6. The open circuit potentials measured at the start and at the end of each test.
CodeExternal SurfaceInternal Surface
Start potential Final potential Start potential Final potential
(mV vs. SCE)(mV vs. SCE)(mV vs. SCE)(mV vs. SCE)
#2(ref)779034−20
#4--4926
#5−2491524140
#8(ref)86964141
#941123−3665
#11−2638−59125
#121285−11−86
#13(ref)1099972−106
#15115119356
Table 7. Electrochemical parameters measured and calculated in the Tafel domain. E: external surface; I: internal surface.
CodeE(i=o)
mV
Icorr
nA
ba
mV/dec
bc
mV/dec
°(Ei = 0 + 150 mV)
µC
CodeE(i=o)
mV
Icorr
nA
ba
mV/dec
bc
mV/dec
°(Ei = 0 + 150 mV)
µC
#2E246.4246690.99#2I−424.44249833.88
#4E---- #4I810.48124540.78
#5E2917.5168605.56#5I820.11162438.74
#8E707.58201571.19#8I202.86220555.71
#9E820.77200724.14#9I−122.85259500.91
#11E−301.71187344.69#11I301.79174404.99
#12E266.81895219.72#12I−1003.0486725.76
#13E606.15136750.75#13I−10070.21661482.68
#15E780.1899430.66#15I701.15218201.73
Icorr: corrosion current calculated; ba and bc: Tafel slope; Ei=0: electrical potential for current equals zero.
Publisher’s Note: MDPI stays neutral with regard to jurisdictional claims in published maps and institutional affiliations.

