Article

Performance of Exterior Wood Coatings in Temperate Climates

1
College of Sciences and Engineering, University of Tasmania, Locked Bag 1362, Launceston, TAS 7250, Australia
2
Wood Science and Engineering, College of Forestry, Oregon State University, Corvallis, OR 97331, USA
3
National Centre for Timber Durability and Design Life, University of the Sunshine Coast, Brisbane, QLD 4102, Australia
*
Author to whom correspondence should be addressed.
Coatings 2021, 11(3), 325; https://doi.org/10.3390/coatings11030325
Submission received: 6 January 2021 / Revised: 1 March 2021 / Accepted: 9 March 2021 / Published: 11 March 2021

Abstract

:
Wood used in exposed exterior applications degrades and changes color due to weathering. Expanded use of mass timber is resulting in architects increasingly designing structures with wood in exterior exposure. Coatings can reduce the effects of weathering and prolong the visual characteristics of wood. However, coating performance depends on a variety of factors including the blend of resins, oils, pigments, and binders. Coating manufacturers often claim superior performance for products, but data directly comparing different coatings on different species is rarely publicly available. Premature coating failure increases long-term building maintenance expense while potentially enhancing biological degradation and reducing service life. This study compares the performance of 12 exterior wood coatings on 5 wood species. Performance was evaluated according to changes in the components in the International Commission on Illumination (CIE) L*a*b* color space of images taken at 6-month intervals over 18 months of the wood samples. The analysis was performed using Welch’s ANOVA, Games-Howell pairwise comparisons tests, and a clustering procedure using distances between each pair of groups means for the 18 months ΔL*, Δa*, Δb* values. Most of the coatings lost their protective effects within 1 year of exposure due to combinations of biological and ultraviolet radiation (UV) degradation illustrating the difficulty of protecting timber in exterior exposures. This study provides a guide for users wishing to specify coatings for exposed wood in mass timber structures.

1. Introduction

Wood used in exterior architectural and appearance applications weathers in four principal ways [1]: It can lose color and appear to turn silver or grey, mold fungi can grow on and disfigure the surface, it can decay from fungi growth when exposed to high ambient moisture, and/or it can split and warp due to repeated changes in moisture content. Greying is largely caused by exposure to the UV component of sunlight [2], which degrades the lignin and extractives on the wood surface. Mold typically grows on the surface while decay fungi grow through the wood. Mold consumes the stored food materials in the wood or from the natural oils found in some finishes, causing unsightly discoloration marked with black deposits. The presence of mold is commonly referred to as mildew and can be accompanied by algae, contributing green discoloration to the surface of the material. Both mildew and algae are common where air movement is restricted, and moisture is common. Therefore, special consideration should be given to the use of mildew susceptible coatings for applications that likely to condense water in service.
The early effects of weathering do not usually cause structural issues; rather most short-term weather results in a decline of the aesthetic attributes of wood surfaces that likely influenced the specification of wood in the first place. On uncoated surfaces or for surfaces where the coating has failed, the process of surface degradation generally begins when UV initiates photochemical reactions that decompose lignin, hemicelluloses [2,3,4,5], and extractives [6,7] and which are then leached from the wood by water. This typically results in wood surfaces turning yellow or brown and eventually grey [8]. Mildew is often associated with this damage, especially in wetter climates. Erosion, while only representing losses in the surface depth of mm per century, continues while checks, splits, and cracks cause a further loss in surface appearance [9]. Although surface degradation rarely results in significant losses in structural capacity, the unsightly surface appearance often requires refinishing the wood surface or replacement of the material. In advanced stages, special time-consuming procedures, such as washing and sanding, are required to remove mold, algae, and degraded wood before the application of a new surface coating. These procedures can be expensive and time-consuming process that increases building maintenance expense. Therefore, it is advantageous to initially apply a coating that prevents surface degradation in terms of color change and the growth of mildew for the longest possible timeframe.
Exterior wood coatings are commonly applied to limit UV degradation and exclude water, thereby minimizing the dimensional changes that lead to physical degradation and reduce and discourage the growth of mildew and algae. Coating performance can be measured in several ways, including ease of application, toxicity, scratch and dent resistance, and adhesion to the surface. However, the ability for the wood to retain the attractive visual attributes of the wood surface remains an important characteristic for most specifies of coatings on exterior timber applications.
Many types of coatings exist on the market, but coating performance depends on many factors, such as wood species, exposure, climate, and user requirements. The ideal finish would allow the natural visual characteristics to be visible, minimize discoloration from UV, reduce water exchange between the atmosphere and the material, and accommodate the dimensional changes of the material to reduce cracking and peeling from the wood surface for the longest possible time, thereby reducing maintenance expense.
Paint, perhaps the most widely recognized and used coating, provides superior protection, but many users prefer coatings that preserve the natural appearance of wood. Binders and pigments in pigmented stains resist both UV and water penetration while highlighting some of the visual characteristics but are less effective than film-forming paints. Pigmented stains are relatively easy to maintain but require more frequent re-treatment than paint. As paints and heavily pigmented stains obscure the naturally occurring visual character of wood, clear and lightly pigmented coatings are commonly used. This class of coatings (hereinafter referred to as clear coatings) can be formulated to resist water and UV light by adding UV absorbers. Clear coatings are typically marketed as marine varnish, spar varnish, or penetrating oils and are commonly formulated with either waterborne or petroleum-based solvents. Formulations vary widely but usually include a mix of oils (linseed, tung, or other natural oils), resins, binders, pigments, stains, biocides, stabilizers, and UV absorbers [1,10]. Protective action is obtained by either allowing the coating from a film on top of the surface or to penetrate it. As waterborne finishes have more positive environmental attributes than solvent-based finishes and are less harmful to the user, waterborne finishes are becoming commonplace as viable replacements to solvent-based finishes.
Coating performance varies widely among the different types. Film finishes (varnishes) usually fail after UV degrades the lignin to the point where the coating can no longer adhere to the wood surface and/or following significant shrinking and swelling of the material, resulting in the coating peeling. Penetrating oil finishes can reduce dimensional changes, thereby decreasing cracking and checking; however, the oil degrades over time and the protective characteristics of the coating are diminished. After the coating has either peeled or has been destroyed, the natural process of color change will begin to occur. The time between initial application and the unacceptable color change is one important measure of coating performance and is the main objective addressed in this research.
Coatings have been the subject of considerable research [2,8,9,11,12,13,14]. Most studies have evaluated generic finishes or have not identified brand names. Coating performance can be highly dependent on interactions between the formulation chemistry and the wood species. For example, van Meel et al., [11] found that a waterborne non-film-forming alkyd stain reduced water uptake on Norway spruce (Picea abies L.) but had little or no effect on Scots pine (Pinus sylvestris L.) or meranti (Shorea sp.). An alkyd film-forming coating inhibited moisture absorption for the three species, while acrylic coating performance was species-dependent. Performance differences were largely attributed to anatomical differences, the molecular weight of the polymers used in the coating, and naturally occurring water repellent properties for some species, such as spruce. Additionally, Ozgenc et al., [15] found that color change was reduced by coating the surface of Scots pine with different vegetable oils. Nzokou et al., [16] showed that when exposed to UV light, finished oak wood had the least color change, followed by maple while ash wood displayed the greatest color change. However, when the species were exposed to UV light and water spray, oak showed the least color change while maple and ash had similar changes in color. The authors concluded that because color change differed depending on the different exposure elements, that ash wood could be used as a replacement for oak and maple in certain applications, but not others. Therefore, it is important to understand how these differences would influence the change of the visual characteristics at longer-term for different species and coatings combinations.
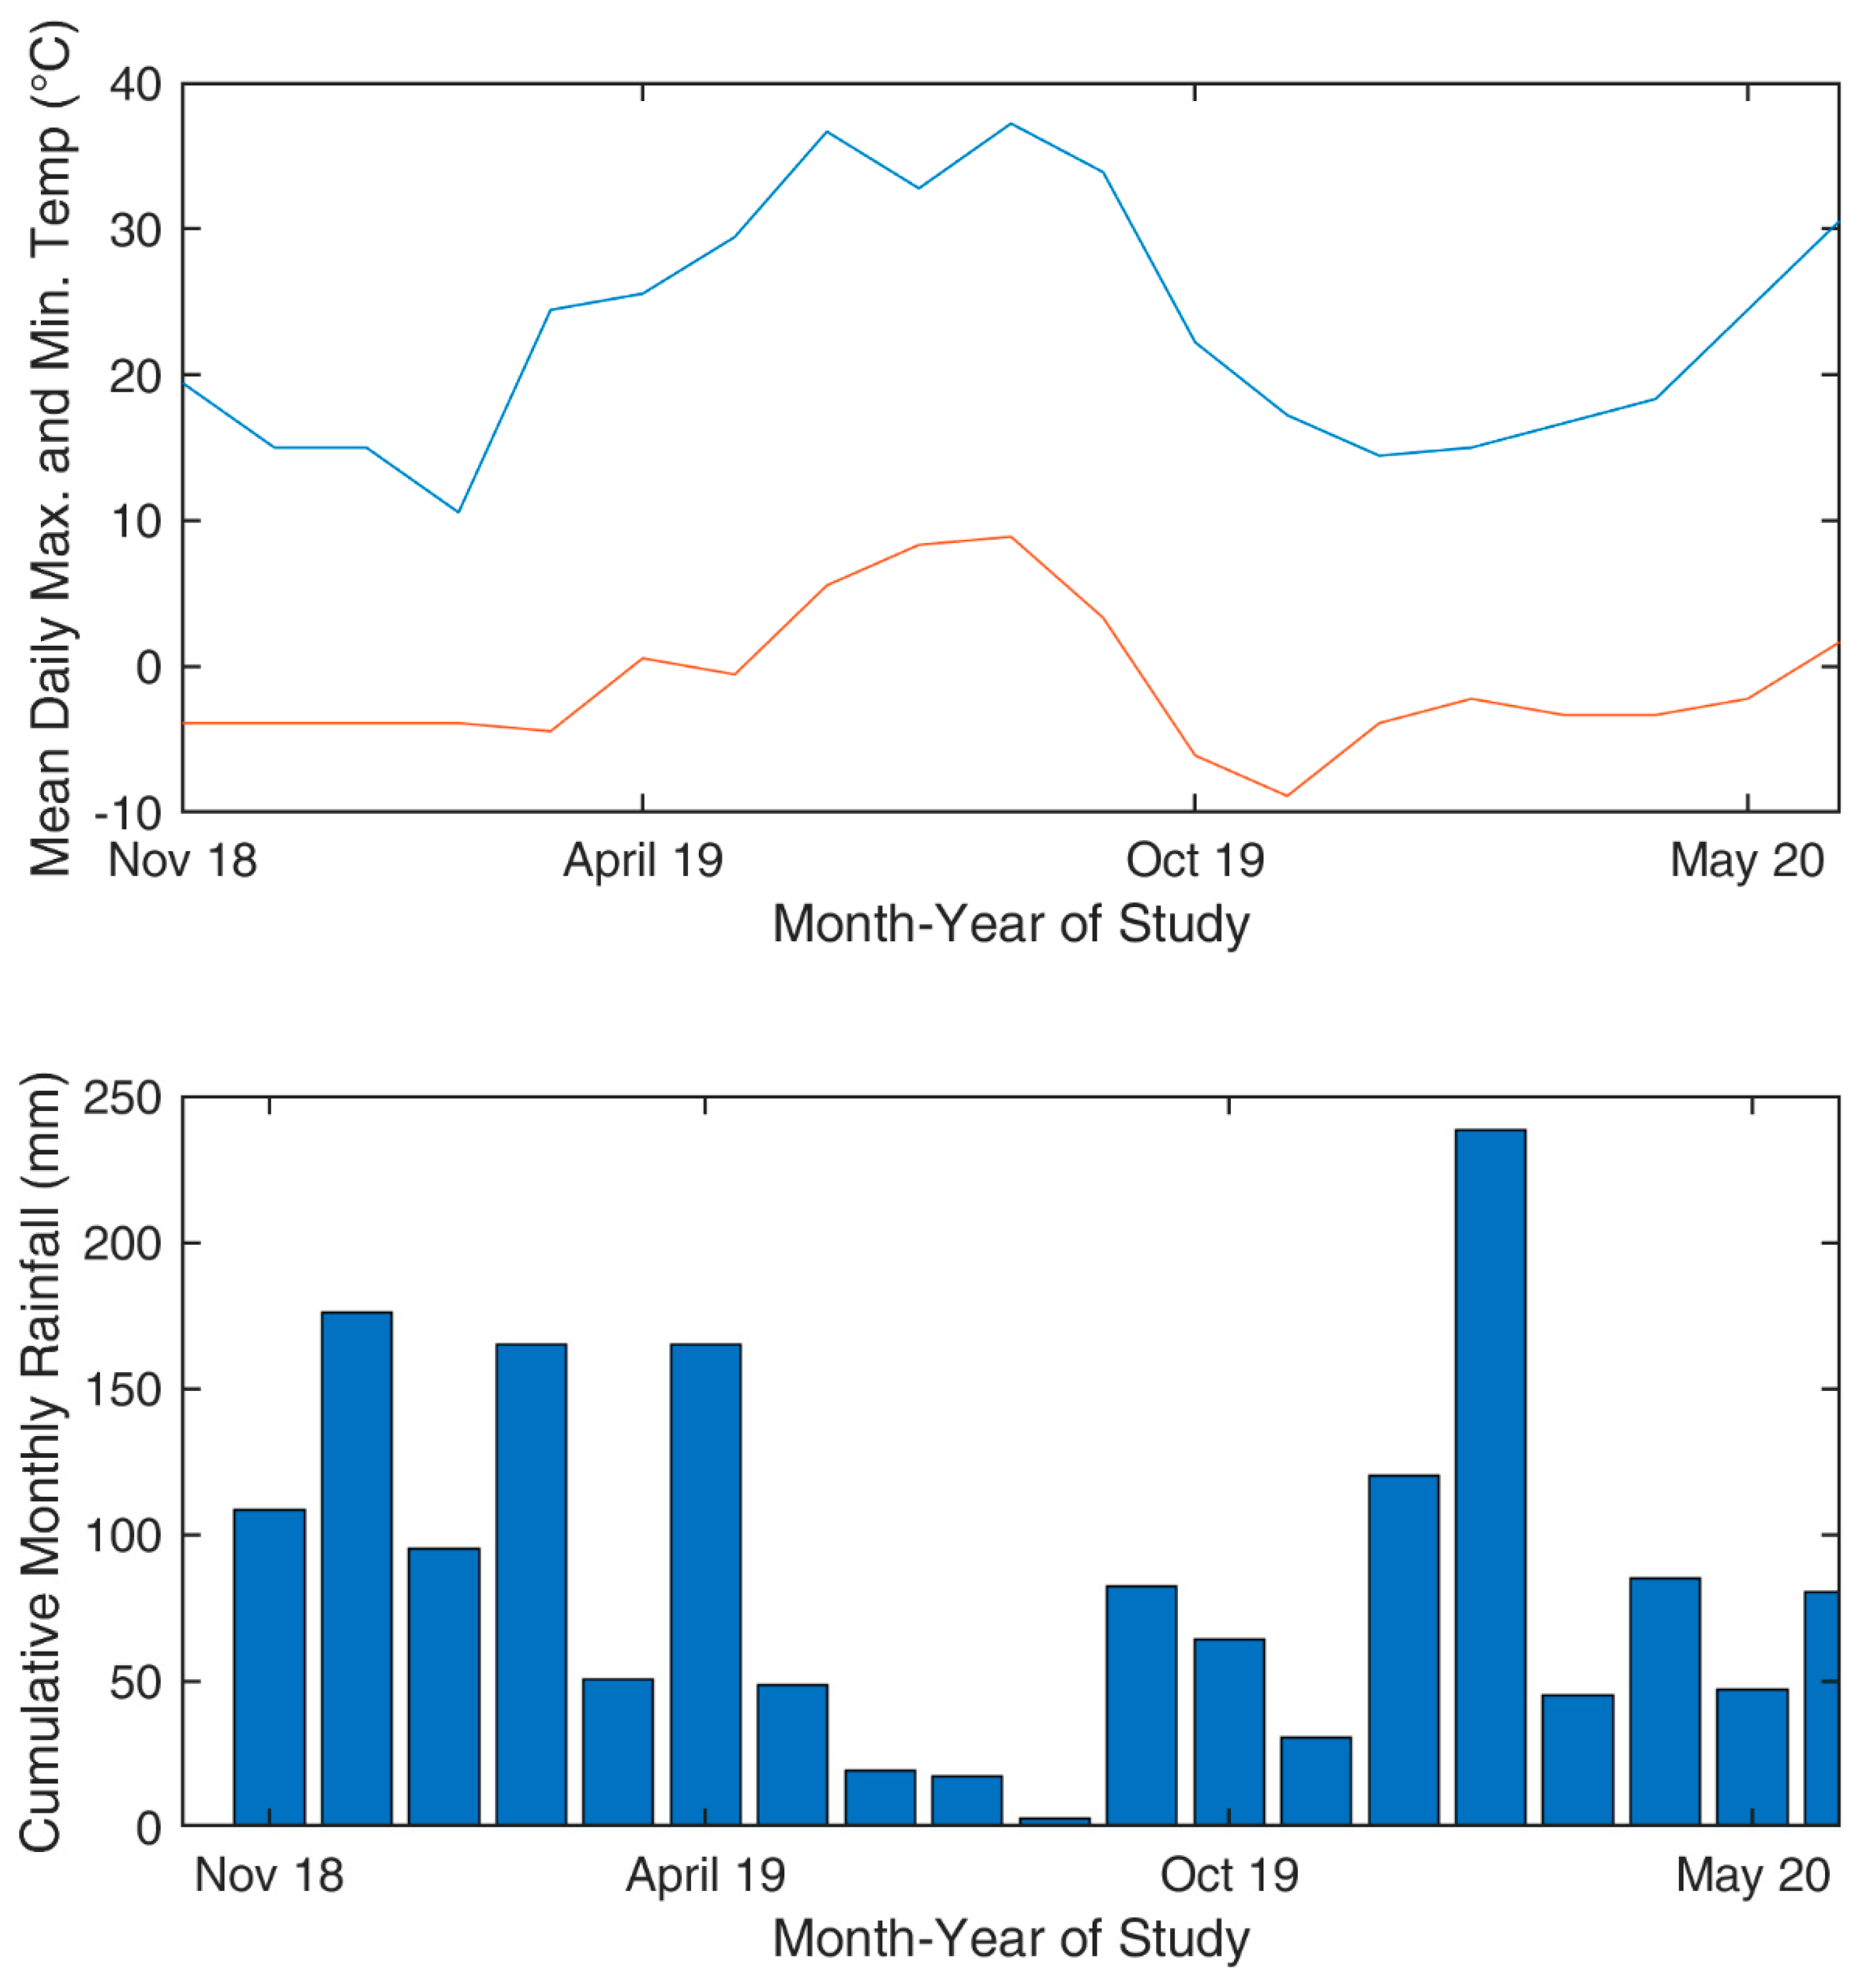
Many so-called clear finishes and pigmented stains claim to provide years of reliable protection; however, there are few publicly available studies documenting the performance claims of different coatings for different applications, wood species, and climates. The choice of one coating over another is often based on vague claims by coating manufacturers, user experience, or brand loyalty. There is little experimental data to support matching the best-suited finish to different application requirements and climates. Such performance information is especially important in temperate climates such as those found in the Pacific Northwest (PNW) region of North America and elsewhere globally. The temperate climate of the PNW is marked with dry, hot summers and wet, cool winters [17].
There are a variety of methods for assessing the performance of wood coatings but changes in roughness, reduction of water permeability, and color changes are among the most common for short-term (months) studies. For example, surface roughness generally increases as the wood surface degrades [16,18,19]. The rate of surface degradation is typically related to UV intensity [20], time of exposure [21,22] wood species [21], and climatic factors [21,23]. Changes in surface color are usually expressed with changes in the components of the L*a*b* color space where the L* component represents the perception of lightness, the a* component represents green and red, and the b* component represents blue and yellow. In the early stages of weathering, dark woods tend to become light and light woods tend to darken or turn silver [24,25]. These changes can be accurately detected and represented using the L*a*b* components and have been used in many studies.
Most studies have examined roughness and surface degradation on relatively small samples or studied small areas of the sample within relatively short timeframes. For example, Pastore et al., [4] studied changes in the color of four unfinished tropical hardwood species using samples just 4.00 cm × 1.5 cm. Laskowska et al., [3] used a small handheld colorimeter to measure the effects of UV radiation on the color of 4 unfinished wood species commonly used as façade material in Europe. Pandey et al., [7] studied the effects of photo-discoloration on 135 mm × 45 mm unfinished wood samples. Nzokou et al., [16] examined the changes in color and surface roughness of both unfinished and finished samples that were 100.8 mm × 69.3 mm to determine the potential for ash (Fraxinus americana) to be used as a replacement for red oak (Quercus rubra) for finished and unfinished interior and exterior applications. Ozgenc et al., [15] measured color change on areas of wood samples just 8 mm in diameter coated with various seed oils. Additionally, most studies have used accelerated weathering equipment in which other factors, such as growth mildew, do not have the necessary time to fully develop.
Few studies have examined changes in the overall visual characteristics due to surface degradation or from the growth of mildew on comparatively large samples over long timeframes. Oberhofnerova et al., [13] studied the color change of several softwood and hardwood species under natural weathering conditions for 12 months. Despite a much larger sample size (375 mm × 78 mm), only 6 measurements over a small area were taken on each sample using a handheld spectrophotometer, which provides a relatively small area of interest compared to the overall sample size. Given the complex arrangement of color differences in earlywood, latewood, sapwood and heartwood and the non-uniform growth of mildew due to varying composition of different proportions of extractives, lignin, cellulose and hemicelluloses within the material, point measurements may not fully capture the inconsistent nature of discoloration attributed to UV surface degradation and the growth of mildew over large areas of wood surfaces.
Increased use of mass timber elements in mid-to-high rise construction has resulted in designs that expose timber elements to UV and repeated wetting and drying cycles that may result in surface discoloration. Architects are increasingly seeking coatings that protect, but do not obscure the visual attributes of these exposed elements. However, few comparative studies explore the performance of more recently developed coating systems in these applications. There is a critical need to develop comparative performance data, maintenance schedules, and expected service life of different coatings for these applications.
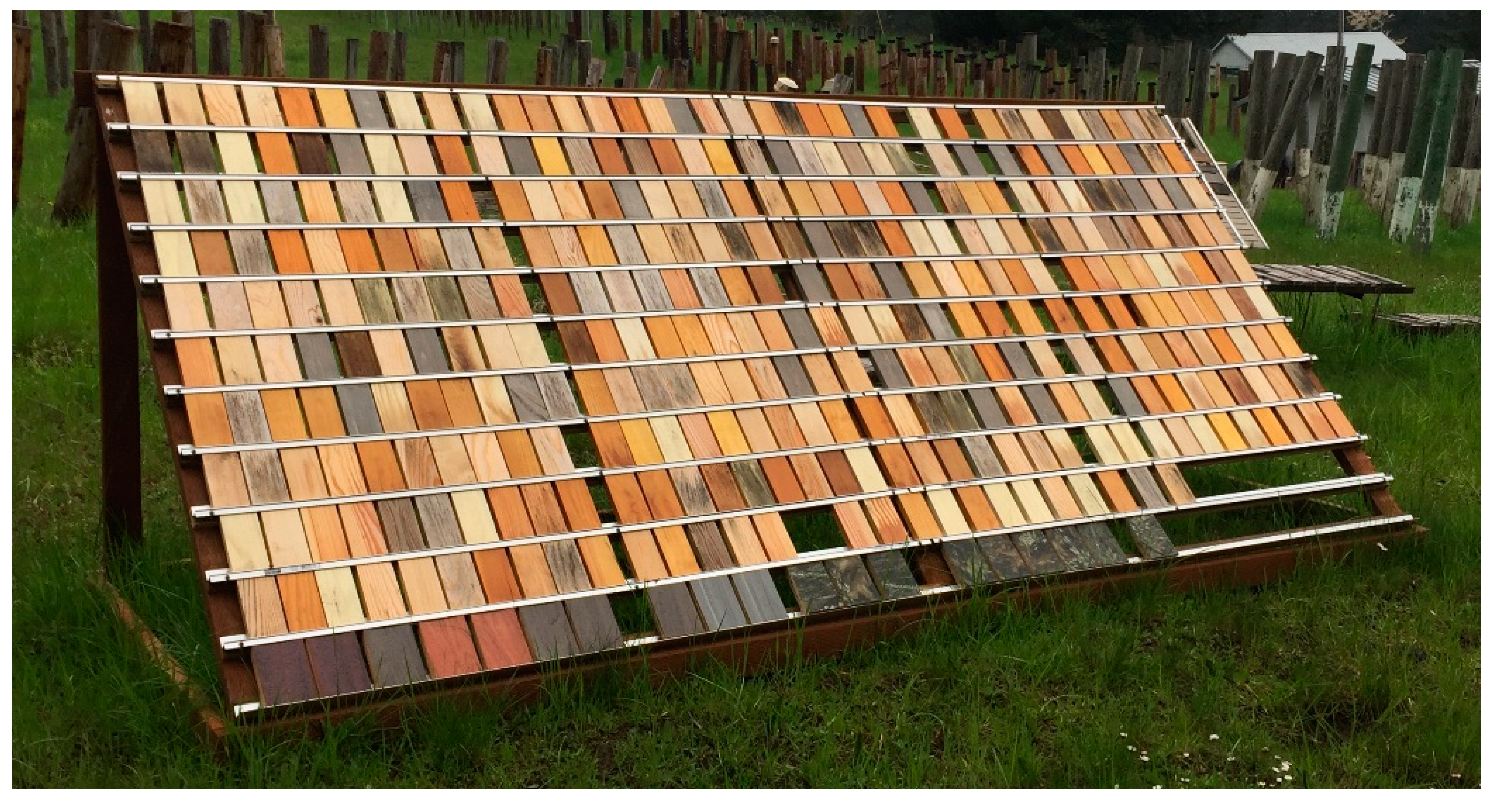
The objective of this research was to evaluate the ability of a range of clear and pigmented wood surface coatings (both waterborne and solvent-based) to prevent discoloration for up to 18 months of wood surfaces exposed to natural weathering conditions for species that are likely to either be used for mass timber products or other exterior applications in temperate climates. The aim was to provide guidance to coating selection for different species to reduce color change due to UV degradation and the growth of mildew.

2. Materials and Methods

2.1. Sample Preparation

Kiln-dried lumber of Douglas-fir (Pseudotsuga menziesii (Mirb.) Franco), ponderosa pine (Pinus ponderosa Laws.), western redcedar (Thuja plicata D. Don.), and red alder (Alnus rubra Bong.) was purchased locally and cut into clear, straight-grained coupons 19 mm thick, 75 mm wide and 150 mm long. Material of commercially acetylated radiata pine (Pinus radiata D. Don. Accoya, Accsys, Arnhem, The Netherlands) was acquired as well and cut to the same dimensions. A total of 72 coupons were cut from several boards for each species and allocated into 12 treatment groups each containing six samples randomly selected from samples. The samples were representative of commercially available material and were primary flat-sawn, although the Douglas-fir samples contained nearly equal proportions of tangential and radial surfaces. The density of the sample material was within the published ranges for the species [26]. The density of the acetylated wood was 0.508 g/cm3. The samples were conditioned at 20 °C and 65% relative humidity (RH) before being coated.
Coatings were chosen to represent a wide range of both penetrating oil and film-forming finishes used on exterior applications (Table 1). All the coatings were publicly and commercially available at the time the study was initiated. The coatings were applied to freshly sanded surfaces according to the manufacturers’ instructions including the recommended number of coats.
The coatings were allowed to cure, then stored indoors away from UV light until one wide face of each sample could be scanned using an Epson Perfection V200 flatbed scanner (Epson America, Inc., Los Alamitos, CA, USA) at a resolution of 4800 dpi. Images were saved in a lossless .tiff file format.
As the aim of this study was to evaluate the ability of different coatings to prevent color change during the experiment, the initial image was used as a form of control. That is, color parameters from subsequent samples were compared to the original images. Therefore, un-coated samples would serve little purpose and were not included in the study.

2.2. Installation Location

Samples were exposed to natural environmental conditions at Oregon State University’s Peavy Arboretum, approximately 12 km north of Corvallis, Oregon. Samples were placed randomly on racks so that one wide face was exposed at a 45-degree surface oriented at 180° azimuth (Figure 1). The site has a Mediterranean temperate climate with cool, wet winters and dry, warm summers. The average rainfall is around 1.2 m per year, mostly in the winter months between October and March when the average monthly temperatures range between 4 and 12 °C. The average monthly maximum and minimum temperature and the monthly rainfall (Figure 2) were obtained from the closest weather monitoring station at the Oregon State University Hyslop Farm approximately 7 km southeast. The direct normal solar annual radiation index at this site is approximately 3.5 kWh/m2/day, representing a moderate UV exposure, with a high likelihood that surface microbial activity (mildew) will occur throughout the experiment.
The samples were removed at 6-month intervals over 18 months, rescanned, and immediately returned to the test site. This provided three intervals by which to judge the color change in the sample coupons due to natural weathering after the initial application of coatings.

2.3. Analysis

Images were converted from .tiff to L*a*b* using MATLAB 2019 (MathWorks, Natick, MA, USA). Images were cropped to minimize edge effects during subsequent analyses. The mean L*a*b* values were calculated for each of the 6 samples for each scanning interval. This method integrated color parameters across different grain types to indicate the true color of each sample. The authors believe this method gives a better indication of the overall visual character of wood surfaces. These values were used to calculate the combined mean and standard deviation for each coating of each color component for each set of images. The differences in the means for each of the 6-month scanning intervals and the initial values L*, a*, and b* were then calculated and expressed as ΔL*, Δa*, Δb*. The total color difference (ΔE) was calculated as:
Δ E = ( Δ L * ) 2 + ( Δ a * ) 2 + ( Δ b * ) 2  
where L* is the lightness from 100 (white) to 0 (black), a* is the chromaticity coordinate from −60 (green) to +60 (red), b* is the other chromaticity coordinate from −60 (blue) to +60 (yellow), and ΔE represents the differences between L*, a* and b* values between the exposure intervals.
Welch’s ANOVA [27] and Games–Howell [28] multiple pairwise post hoc comparison tests were performed using functions written for MATLAB 2019 to detect significant differences in ΔE among the coatings for each interval and to determine significant differences in ΔE for each coating during the study. The Welch’s test indicated at least one group mean was different than the rest at a p < 0.05 significance level. Welch’s ANOVA and Games–Howell tests were selected because the initial data analysis indicated that variances were not equal among the sample images. These tests focused on ΔE to indicate the overall color change of the samples during the study, however, they do not imply a direction of color change (i.e., light to dark).
To examine the direction of color change, a MANOVA on the 18-month (i.e., final) ΔL*, Δa*, and Δb* was used to calculate a matrix of Mahalanobis distances between each pair of group means. All MANOVA tests indicated that these variables differed within the coatings at p < 0.05 level. The distances were then used to calculate Ward’s linkage values. Clusters of coatings were then determined with threshold values greater than 50% of the maximum linkage for each coating.

2.4. Compilation Images

Compilation images were composed of cropped images in red, green, blue color model (RGB) of sample number 1 (of 6) for each interval. These images were used to visually compare changes in RGB color space as perceived by the human eye. The smallest and largest ΔE at 18 months was used to select species-coating combinations that represented the best and worst coating performance in the study. In many cases, the analysis did not indicate a single definitive coating with the lowest and highest ΔE. However, it was thought that the chosen images would represent the visual attributes of coatings in the lowest and highest groups.

3. Results

3.1. Color Change

The color change at 18 months, expressed as ∆E, varied considerably for the different coating/species combinations (Table 2). The highest overall values were observed for PV, while the lowest were observed for V, S2, and S3, although the lowest values did not occur for the same species/coating combinations. Color change did not significantly differ for several coatings (PV, FLF, and FXL) across the different species. However, other coatings, such as OM, S2, and S3 showed considerable variation in color change among the species. The lowest value (6.7) occurred for acetylated wood with S3 as a coating. Other species treated with S2 or V had slightly higher values of ∆E. The highest ∆E value occurred for ponderosa pine treated with PV; values were slightly lower for the other species.

3.2. Douglas-Fir

The results of the pairwise comparisons are shown in Table 3. A few distinct groups were indicated by the analysis. One group with moderate ∆E at 6 months included RM, TP, and S2. Another with lower ∆E at 6 months included MM and FXL. Groups became slightly more distinct at 12 months where V, OM, HN, FLX, FXL, and S3 and MM, TP, S1 are similar. Coatings also grouped at 18 months; however, the groups did not contain the same coatings as the 12-month groups. This pattern indicated different rates of change in ∆E for the different coatings during the study.
Overall, ∆E increased for most of the coatings during the study. However, the change was not consistent among the coatings. For example, the mean ∆E increased from 10.2 to 19.4 for V, while it increased from 22.3 to 45.6 for PV. In addition, the coatings with the least ∆E at 6 months continued to have low ∆E at 12 months and 18 months. These coatings include V, S1, and S3. Coatings with high ∆E continued to show the largest ∆E at the end of the study. These included PV and OM.
The results of pairwise comparisons between the mean of ∆E for each coating (i.e., change within coatings at each time interval) during the study are shown in Figure 3. ∆E changed in several different ways during the study. ∆E remained unchanged between 6 and 12 months but increased at 18 months (often dramatically) for MM, TP, HN, FLF, and S2, indicating that ∆E changed quickly at first, slowed between 6 and 12 months, and reached the maximum ∆E at 18 months. However, ∆E remained unchanged between 12 and 18 months for V, OM, RM, FLF, and FXL, indicating the maximum ∆E was reached by 12 months. In general, ∆E was lowest for this group at 18 months (Table 3) and the difference in ∆E between 12 and 18 months was relatively small. This pattern indicated most of the change in ∆E occurred within the first 6 months. For PV, S1, and S3, significant differences in ∆E were indicated for all three intervals (except for PV, these coatings did not show the greatest ∆E). This indicated that ∆E continued to increase for these coatings during all intervals of the study.
The 18-month cluster results plotted on the ΔL* and Δb* axes are shown in Figure 4. In simple terms, the closer a coating is to the origin (0, 0) in Figure 4, the less change there was in ΔL* and Δb*. The cluster solution shows 3 groups of coatings. The first group, S3 and S2, showed the least increase in the blue component, while PV, TP, and HN showed the greatest increase in the blue component. All groups darkened to some degree; the largest change occurred for PV and the least occurred for S2, FLF, FXL, and HN. Based on the above analysis (lowest ∆E at 18 months, generally small changes in ∆E between 12 and 18 months, and slight darkening and small increases in the blue component), S2, S3 FLF, and FXL should be considered the most suitable coatings for relatively long-term protection on Douglas-fir used in exterior applications in this exposure setting. In the shorter term (6–12 months), V, MM, FXL, and S1 may provide reasonable protection against color change. The results also indicated that TP, PV, HN, and S1 would provide little protection against color change for coated surfaces of Douglas-fir wood in the relatively long-term.
All of the test specimens experienced both UV damage and microbial colonization although the differences between coatings were sometimes large (Figure 5 and Figure 6). Sight mildew was observed at 6 months on PV treated surfaces and continued to develop during the study, thus resulting in the largest ∆E. However, mildew did not appear until after 12 months on surfaces treated with the S2 coating. The absence of mildew probably contributed to a low ∆E for the coating on this wood species. These two examples show the worst and best cases (i.e., most and least ∆E after 18 months) of coating performance on Douglas-fir wood as judged by the methods used in this study.

3.3. Acetylated Wood

The results of the Games–Howell pairwise comparisons are shown in Table 4. Due to large variation, which resulted in overlapping confidence intervals between many combinations of coatings, there were a few distinct groups of coatings early in the study. However, more differentiation in coating performance started to emerge by 12 and 18 months. For example, at 6 months, MM and S3 grouped as the coatings with the lowest ∆E, however, at 12 months, V, MM, OM, and S3 showed the lowest ∆E, and TP, PV, FLF, and S2 showed the greatest ∆E. Overall, ∆E increased during the study. Few clear patterns appeared between ∆E at 6 and 18 months; some coatings showed little change at 6 months only to show moderate ∆E at the end of the study. S1 was the only coating to show the least ∆E at both 6 and 18 months.
The results of the pairwise comparisons for each coating during the three intervals of the study are shown in Figure 7. As with Douglas-fir, there appear to be several patterns of coating response. The first response was demonstrated by V, RM, and HN for which ∆E did not change significantly during the study. The second pattern displayed by MM, OM, PV, and S2 indicated no significant change between 6 and 12 months and no difference between 12 and 18 months, suggesting a relatively stable rate of change throughout the study. A third pattern observed for TP, FLF, S1 and S3 indicated no difference in ∆E between 6 and 12 months, but an increase at 18 months. Six coatings showed a decrease in ∆E over at least one interval of the study.
The cluster results for acetylated wood are shown in Figure 8. The method indicated the presence of 2 clusters of coating response for this species at 18 months. The first group (S2, S1, and FLF) showed an increase in the yellow component while the rest of the coatings showed an increase in the blue component. Most of the second group also darkened during the study. Based on the results presented above, it appears that OM, MM, and S3 provided the best protection in the relative long-term for acetylated wood. The least protection was provided by PV and HN. Several coatings (V, MM, OM, TP, FXL, and S3) provided equal protection in the short term, however, no consistent pattern occurred for these coatings during the rest of the study.
Acetylated wood surfaces treated with PV and S3 experienced progressive weathering and mildew growth over the 18 month exposure (Figure 9 and Figure 10). Darkening of wood surfaces appeared to be largely caused by mildew growth suggesting that these treatments had little effect on these ubiquitous fungi. In contrast, PV-treated acetylated radiata pine was colonized by mildew within the first 6 months of exposure and continued to develop throughout the study. However, mildew was not observed on S3-coated samples until after 12 months. These two examples provide the worst and best cases (i.e., most and least darkening of the surface after 18 months) of coating performance on acetylated wood.

3.4. Red Alder

Red alder is among the most difficult timber species to protect from microbial attack, consequently, ∆E was considerably greater at 12 and 18 months for many of the coatings than for other species (analysis not presented). The Games–Howell pairwise comparisons are shown in Table 5. As before, few distinct groups are present in the analysis. Overall, ∆E increased during the study for most of the coatings. However, coatings with low ∆E at 6 months did not always have the lowest (or even moderate) ∆E by 18 months. For example, OM, RM, TP, and HN showed the greatest ∆E by the end of the study, but ∆E was low for these coatings at 6 months. This pattern indicates that color change responded differently for the coatings tested here; similar trends were observed for other wood species.
The results of the pairwise comparisons for each coating during the three intervals of the study are shown in Figure 11. As observed for other species, there were several patterns of response. As seen for V, MM, and S1, there was little change in ∆E between 12 and 18 months. This indicated that the maximum ∆E was reached within 12 months. For OM, RM, FLF, FXL, S1, and S3, there was little change in ∆E between 6 and 12 months, but levels increased (sometimes dramatically) between 12 and 18 months. The final pattern showed a continuous change in ∆E throughout the study for TP, PV, and HN. Incidentally, these coatings also had the highest ∆E by 18 months. For several coatings (S1, S2, and FLF) ∆E decreased during the study. This pattern was probably due to a large increase in the Δb* color component during the first 6 months. The mean Δb* values for these coatings were 23.3, 20.8 and 22.2, respectively, while the mean Δb* values at 12 months were 0.3, 6.7, and 13.9.
The cluster results for red alder are shown in Figure 12. The method indicated two groups of coatings. Most coatings (excluding S3) in the first group showed a small decrease in the lightness and slight increases in the blue component. Most coatings in the second (excluding PV) showed greater decreases in lightness and greater increases in the blue component. Based on the results presented here, OM, RM, TP, PV, and HN provided little protection against color change in the long term (18 months), however OM, and RM appears to provide moderate protection for up to 12 months. According to these results, V, FXL, FLF, and S1 provide about equal protection at 18 months exposure and S3 and S1 provide about equal protection at 12 months as OM and RM.
Mildew was observed on red alder treated with PV after 6 months of exposure (Figure 13 and Figure 14) and continued to develop during the study. Mildew was not observed on V-treated red alder until 12 months of exposure. These two examples provide the worst and best cases (i.e., most and least darkening of the surface after 18 months) of coating performance on red alder wood.

3.5. Western Redcedar

Western redcedar heartwood is highly resistant to fungal decay and mildew and is frequently used for cladding in the Pacific Northwest. Overall, ∆E was lower at 18 months than for several of the other species. The results of the Games–Howell mean difference pairwise comparisons are shown in Table 6. In general, ∆E increased for most coatings during the study. Groups of coatings were more defined at 6 and 12 months but less distinct by 18 months. For example, low ∆E was observed for V, TP, FXL, and S3, and moderate ∆E was observed for RM, HN, and S2 at 6 months. Additionally, low ∆E initially did not always correspond to low ∆E by the end of the study.
The results of the pairwise comparisons for each coating during the three intervals of the study are shown in Figure 15. As with other species, the changes in ∆E during the study followed several patterns. One pattern observed for V, MM, HN, FXL, S1, and S3 indicated little change in ∆E between 12 and 18 months. This suggested that the maximum ∆E was reached before 12 months. Another pattern observed for OM, RM, TP, and PV indicated a continuous change in ∆E throughout the study. Due to the continuous change, the largest changes in ∆E were observed for many of the coatings in this group.
The cluster results plotted on the ΔL* and Δa* axes are shown in Figure 16. Note that this figure utilized Δa* instead of Δb*. This change helped illustrate the separation of the clusters and indicated that the Δa* color component contributed significantly to the cluster solution. The method indicated three groups of coating responses separated mostly on the degree of increasing redness. The first group, S3 and S2, showed slight increases in the red component, while the second group, V, MM, FX TP, and OM, showed a greater increase. The remaining coatings showed the greatest increase in the red component. There was no discernible trend in changes in the L* component between the groups. Based on the analysis, S2 would provide the highest level of protection against color change for western redcedar wood. The remaining coatings provided various levels of protection, and PV provided the least protection against long-term color change. In the short-term (6 months), it appeared that V, TP, and S3 could be considered to provide reasonable protection against color change.
Examples of western redcedar surfaces treated with PV and S3 are shown in Figure 17 and Figure 18. Slight mildew was observed on PV coated western redcedar samples after 6 months of exposure, while mildew was not observed on S2 coated samples until the 12 month assessment. PV coated samples once again appeared to be most susceptible to mildew which was especially noticeable on the western redcedar samples that were lighter in color.

3.6. Ponderosa Pine

The results of the pairwise comparisons are shown in Table 7. A few distinct groups are indicated by the analysis. One group with relatively low ∆E at 6 months included V, MM, and OM. Another with moderate ∆E at 6 months included TP and FLF. Groups became slightly more distinct at 12 months where V, TP, HN, FLF, and FXL were similar with moderate values of ∆E. Coatings also grouped at 18 months, however, the groups did not contain the same coatings as the 12 month groups. This pattern indicated different rates of change in ∆E for the different coatings during the study.
Overall, ∆E increased for most of the coatings during the study. However, the change was not consistent among the coatings. For example, the mean ∆E increased from 9.7 to 17.6 for V, while it increased very slightly for PV. In addition, the coatings with the least ∆E at 6 months did not necessarily show the lowest ∆E at 12 months and 18 months. Coatings with high ∆E initially continued to show the largest ∆E at the end of the study. These included RM, TP, and PV.
The results of pairwise comparisons between the mean of ∆E for each coating (i.e., change within coatings at each time interval) during the study are shown in Figure 19. ∆E changed in several different ways during the study. ∆E remained unchanged between 6 and 12 months, but increased at 18 months (often dramatically) for TP, HN, and FLF, indicating that ∆E changed quickly at first, slowed between 6 and 12 months, and reached the maximum ∆E at 18 months. However, ∆E remained unchanged between 12 and 18 months for V, MM, and RM, indicating the maximum ∆E was reached by 12 months. This pattern indicated most of the change in ∆E occurred within the first 6 months. For S2 and S3 significant differences in ∆E were indicated for all three intervals, although the change was in different directions for the two coatings. There were no significant changes in ∆E over the duration of the study for FLF, FXL, and S1, indicating most of the change occurred within the first 6 months. These coatings also showed some of the lowest ∆E at 18 months. OM and PV showed continuous change throughout the study.
The 18-month cluster results plotted on the ΔL* and Δb* axes are shown in Figure 20. The cluster solution shows 2 groups of coatings. The first group, S1, S2, S3 and FLF, showed the least increase in the blue component, while the remaining coatings showed the greatest increase in the blue component. All groups darkened to some degree; however, overall, the members of the first group darkened less than the second group. In addition, the largest change occurred for PV and the least occurred for S1 and S2. Based on the above analysis, V, S1, S2, and S3, appeared to provide the greatest protection against color change in relatively long-term protection on ponderosa pine used in exterior applications in this exposure setting. In the shorter term (6–12 months), V, OM, S1, S2 and S3 may provide reasonable protection against color change. The results also indicated that TP, PV, MM, and RM would provide little protection against color change for coated surfaces of ponderosa pine wood in the relatively long-term.
Figure 21 and Figure 22 show the typical transformation of ponderosa pine wood surfaces treated with PV and S2 during the study. Sight mildew can be observed at 6 months for PV-treated surfaces and continued to develop during the study. However, mildew did not appear until the 18-month interval for surfaces treated with the S2 coating. These two examples provided the worst and best cases (i.e., most and least darkening of the surface after 18 months) of coatings performance on ponderosa pine wood.

4. Discussion

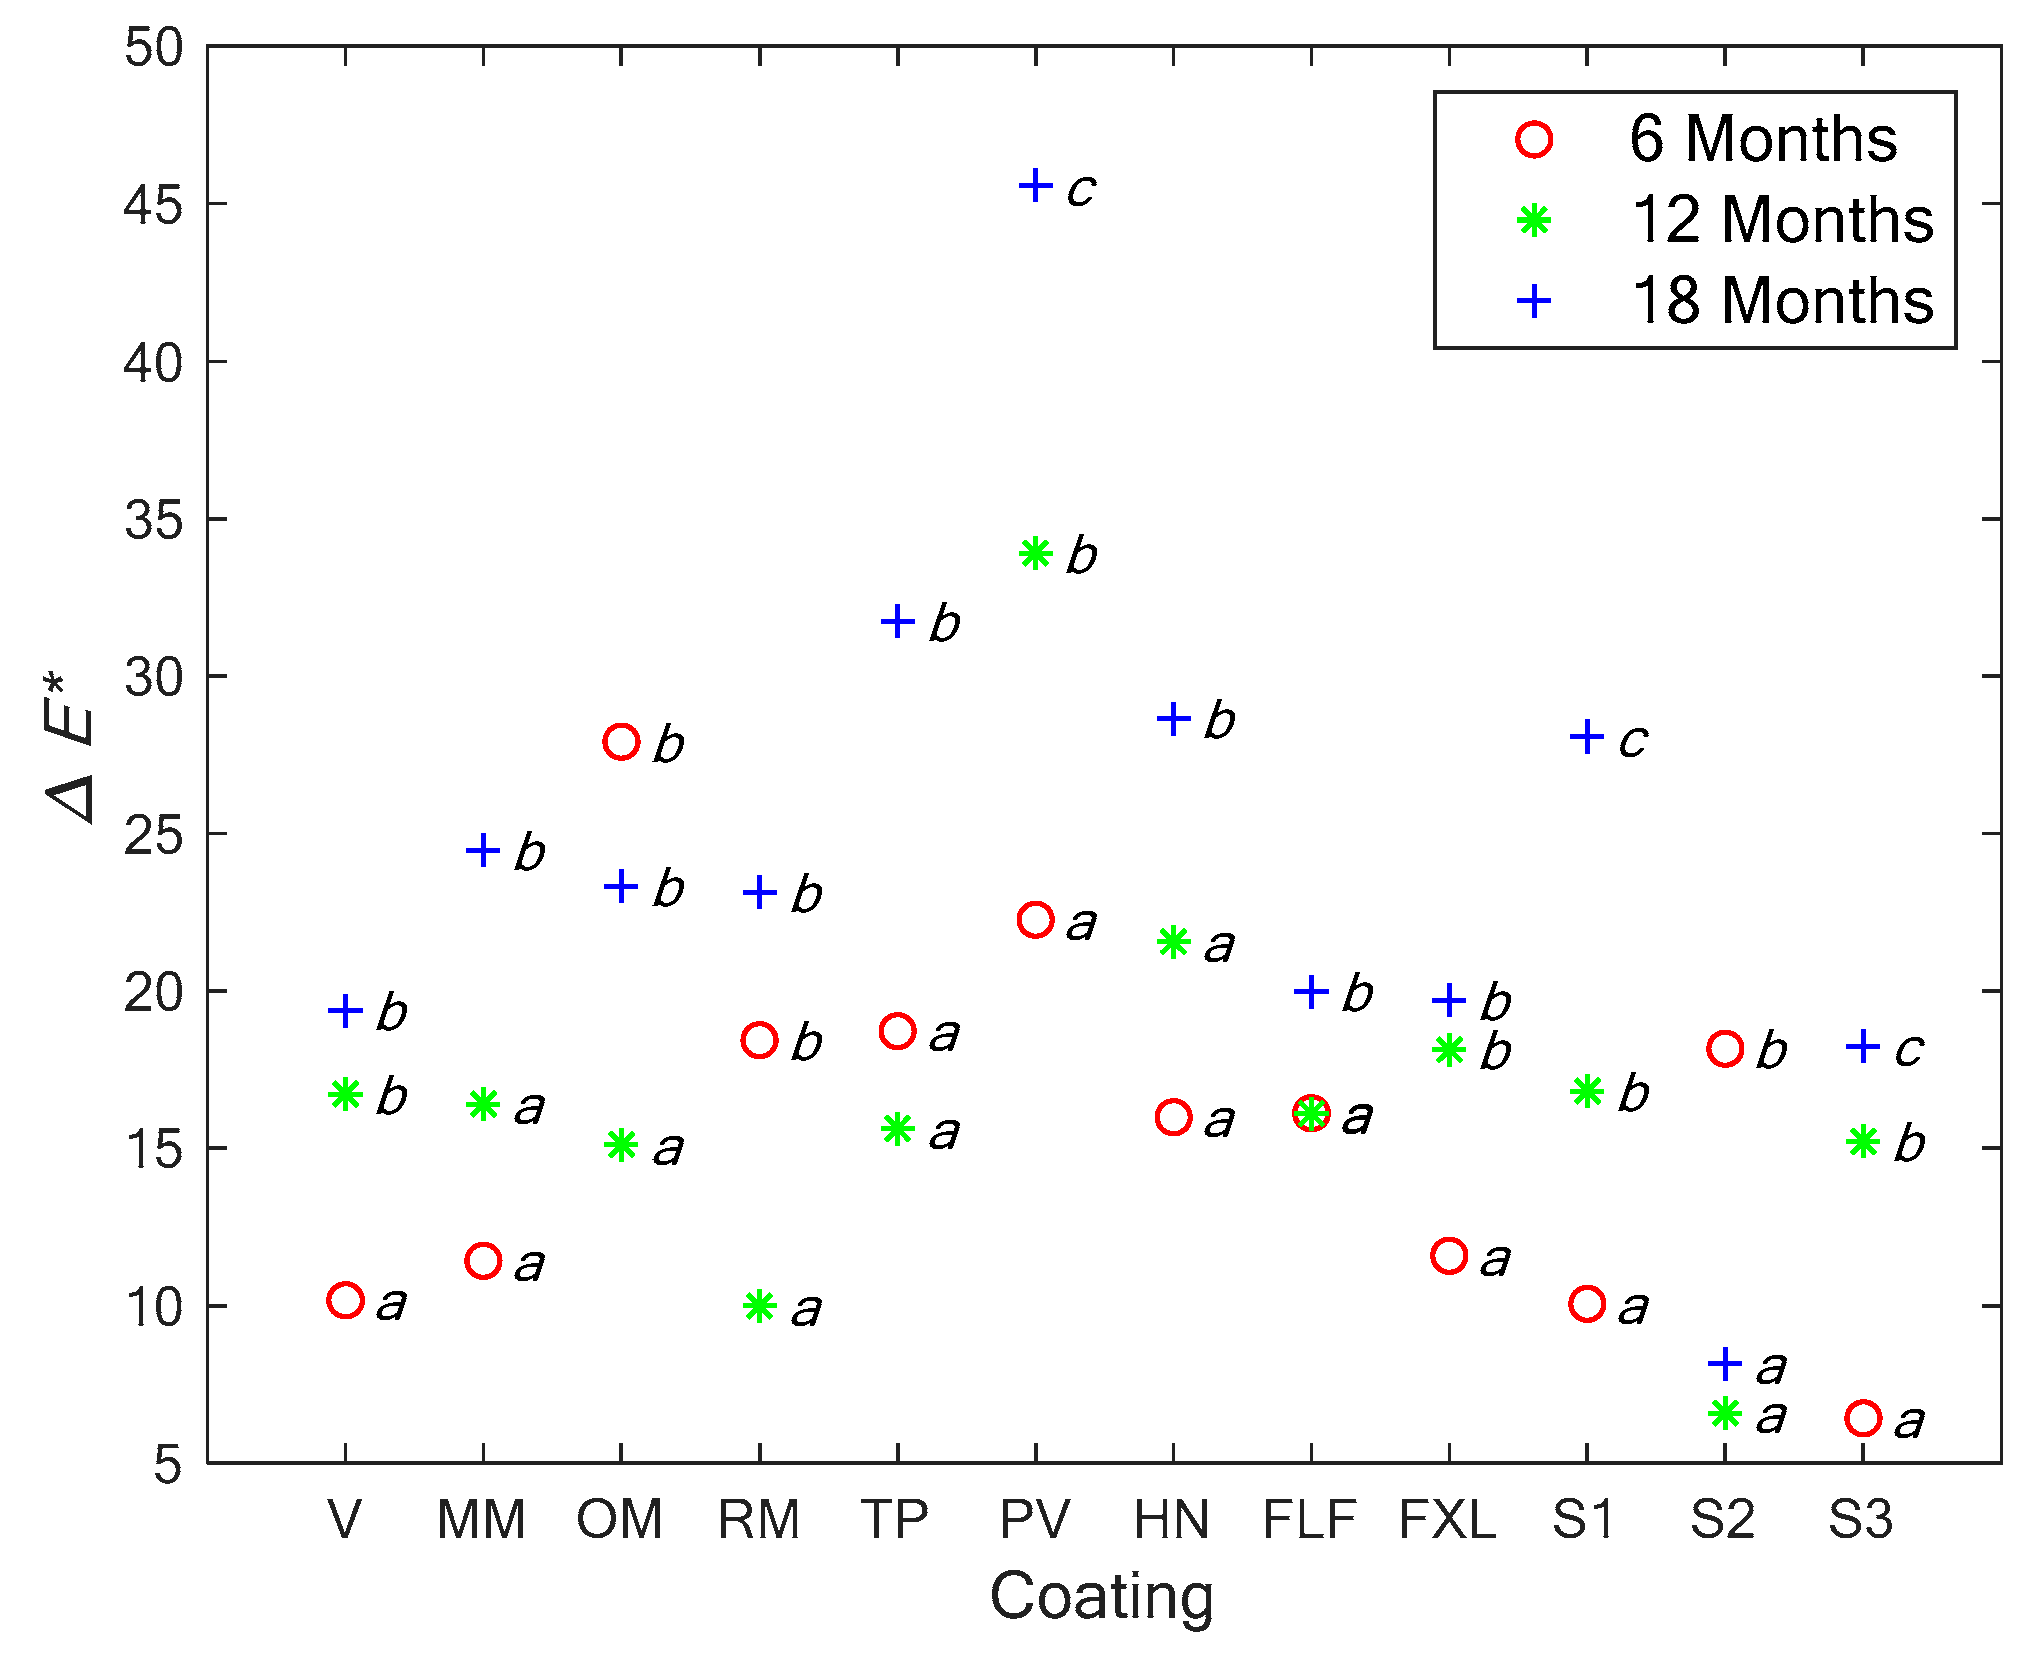
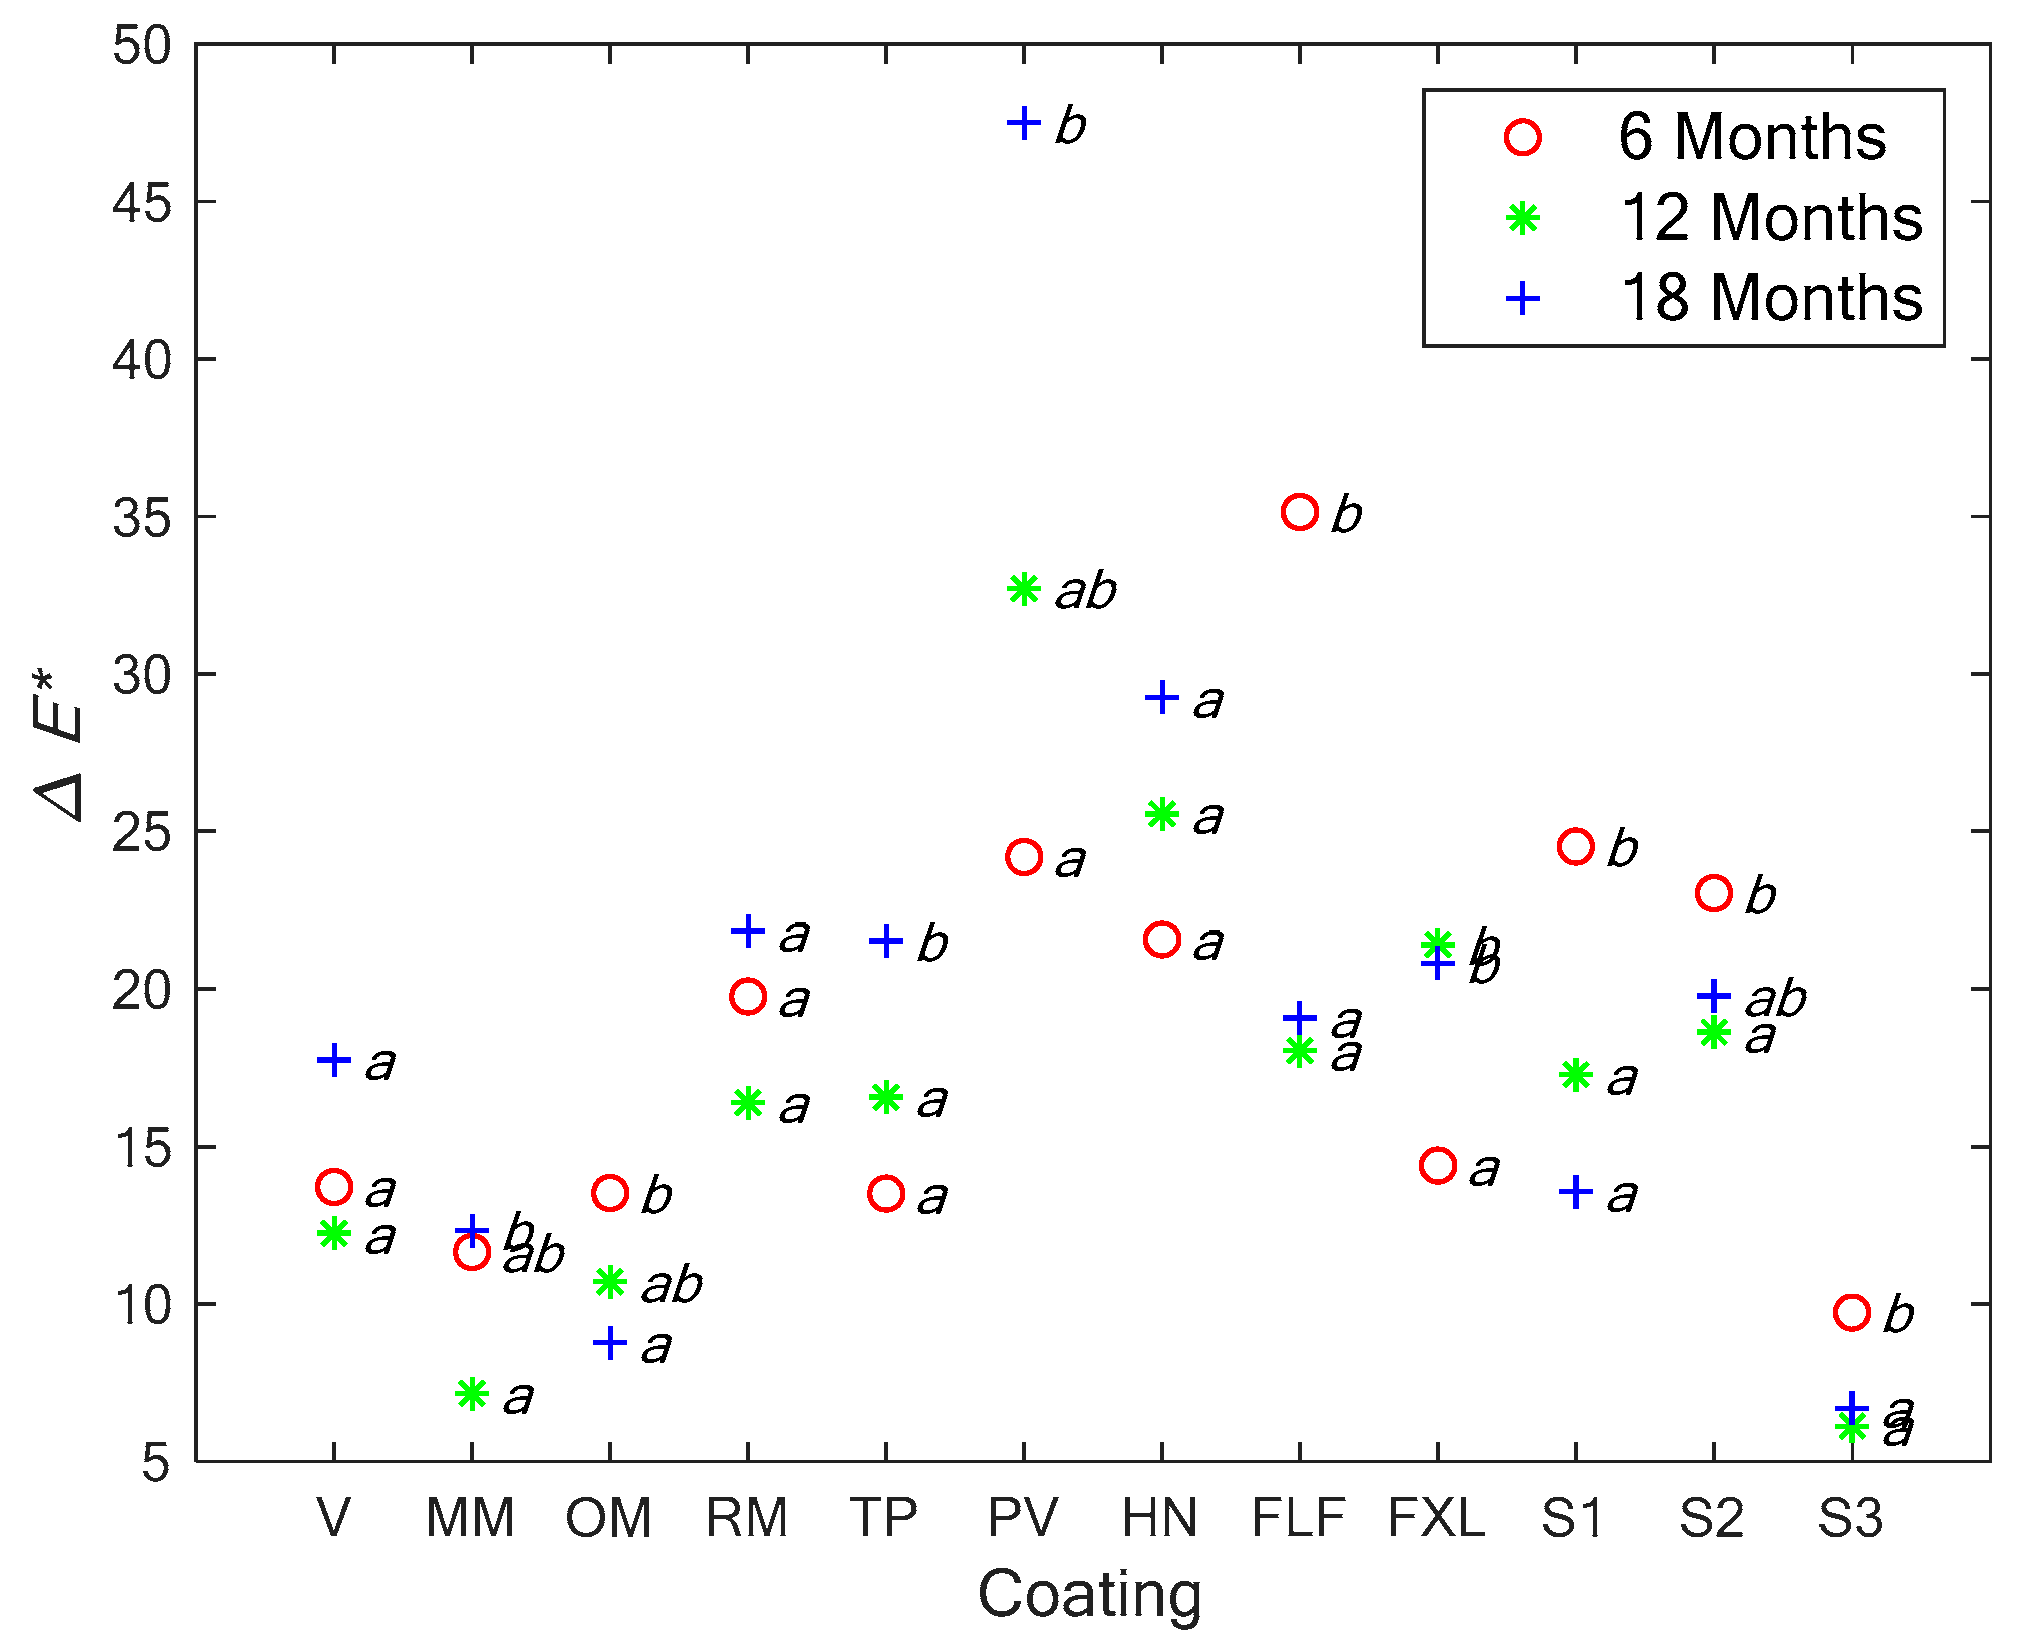
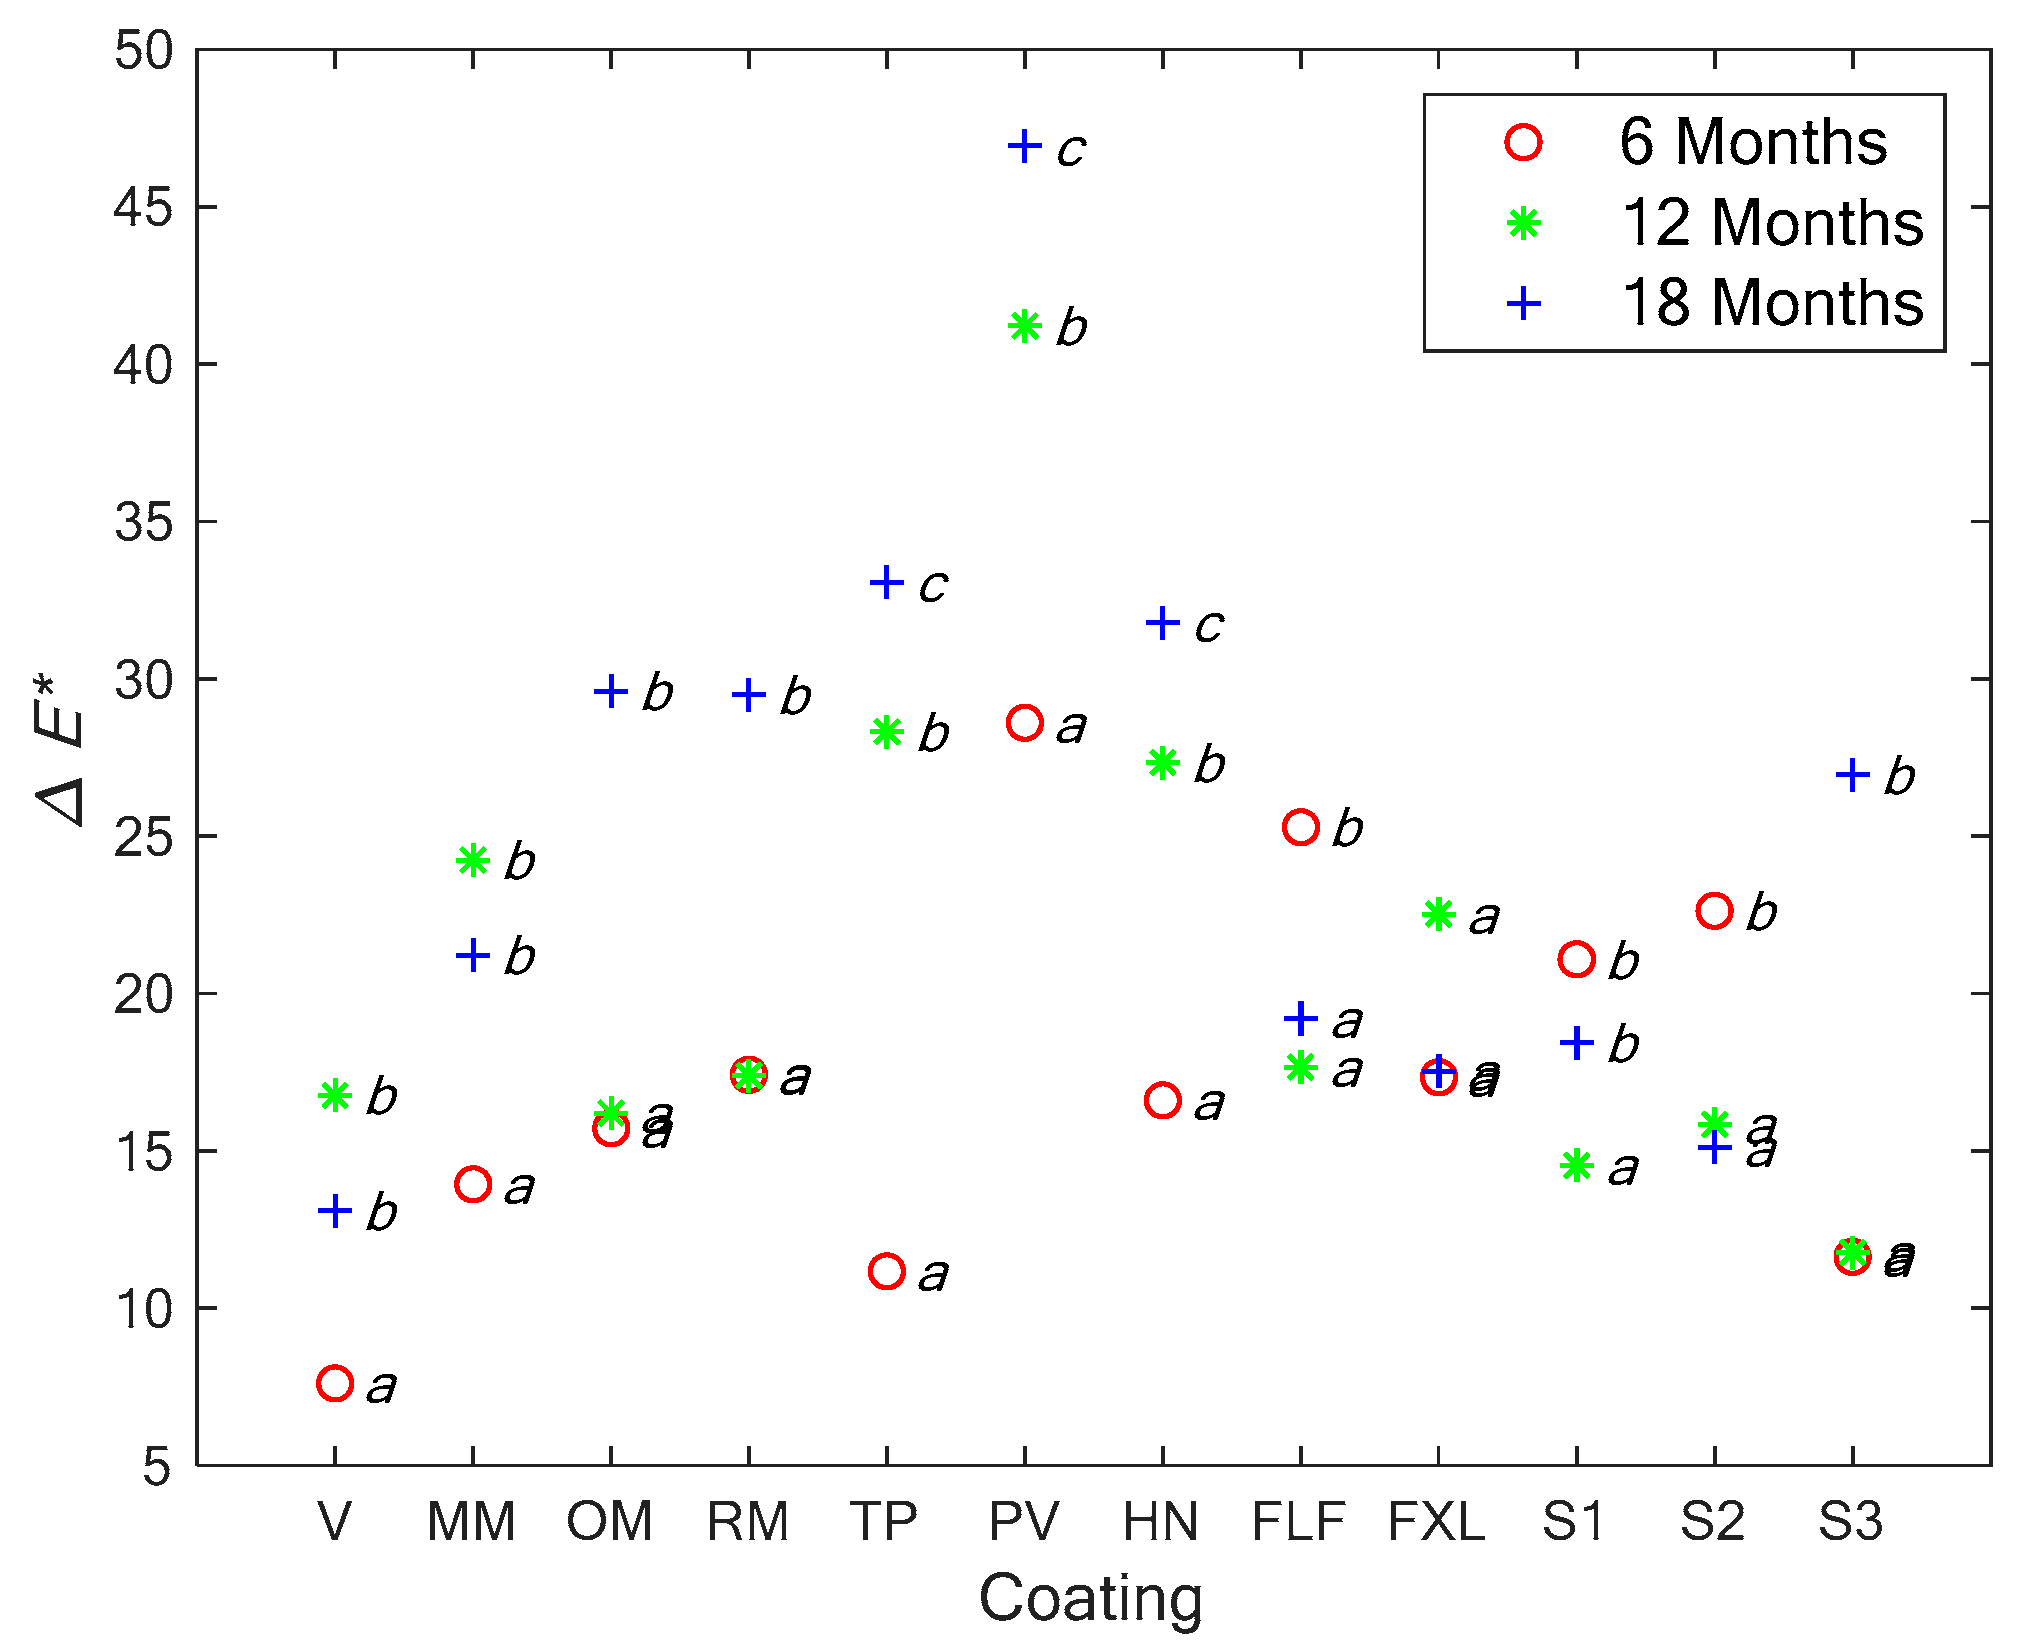
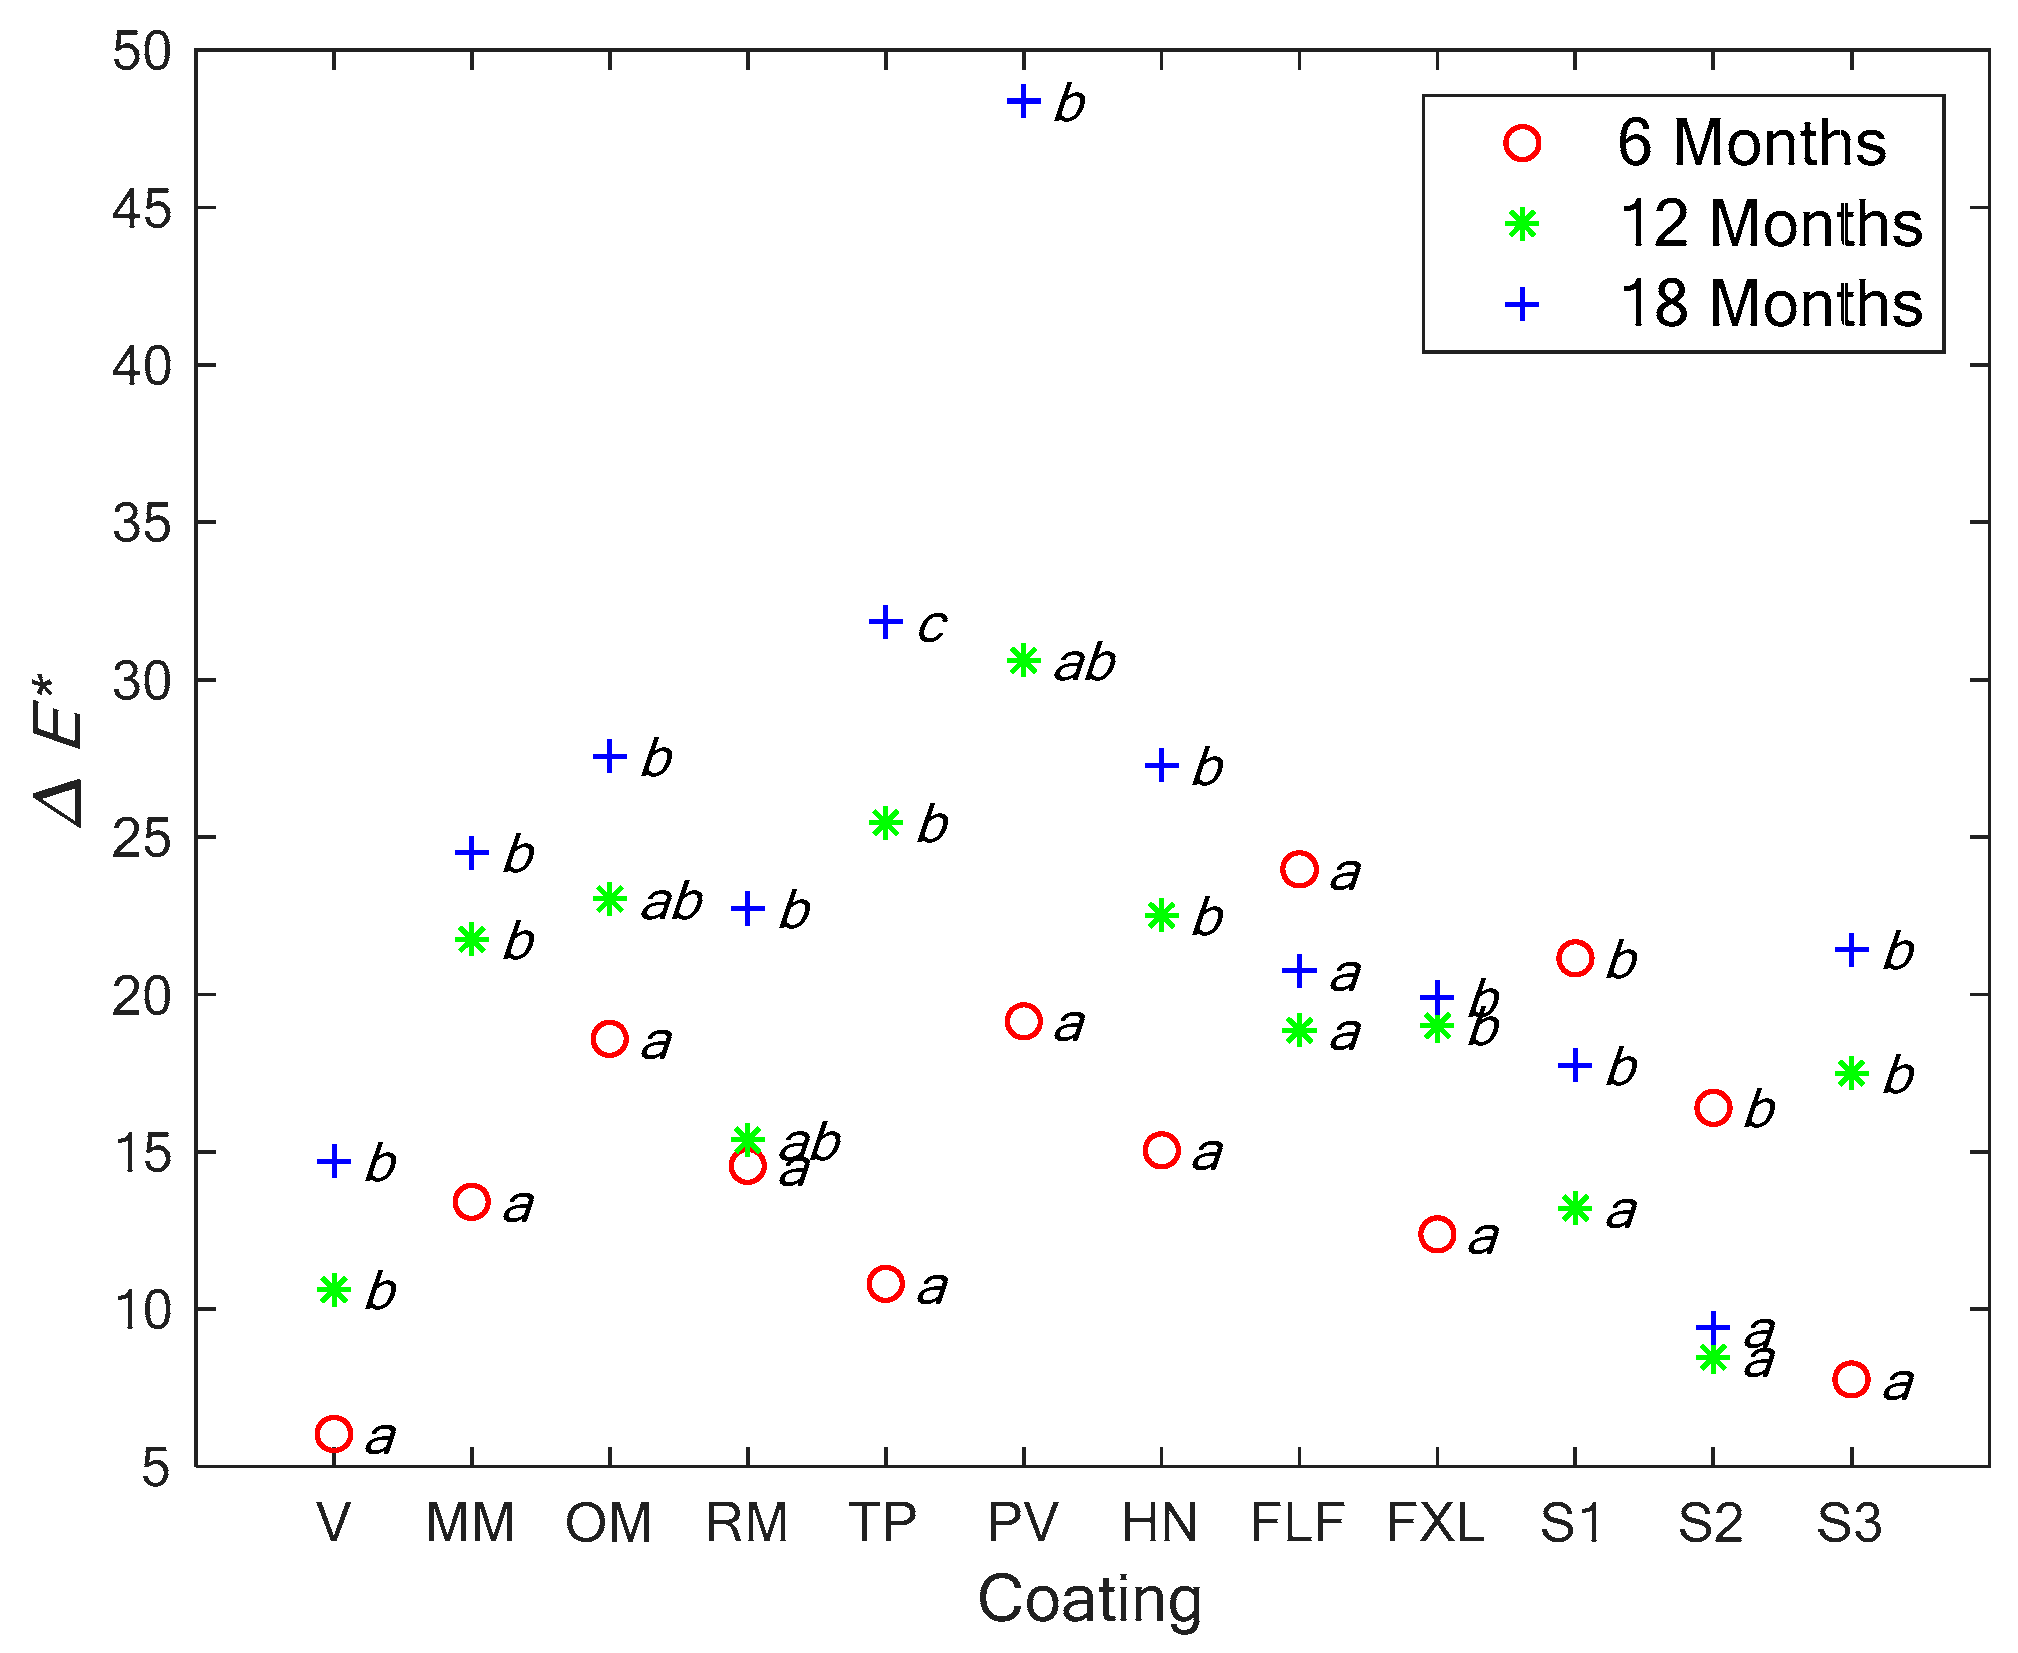
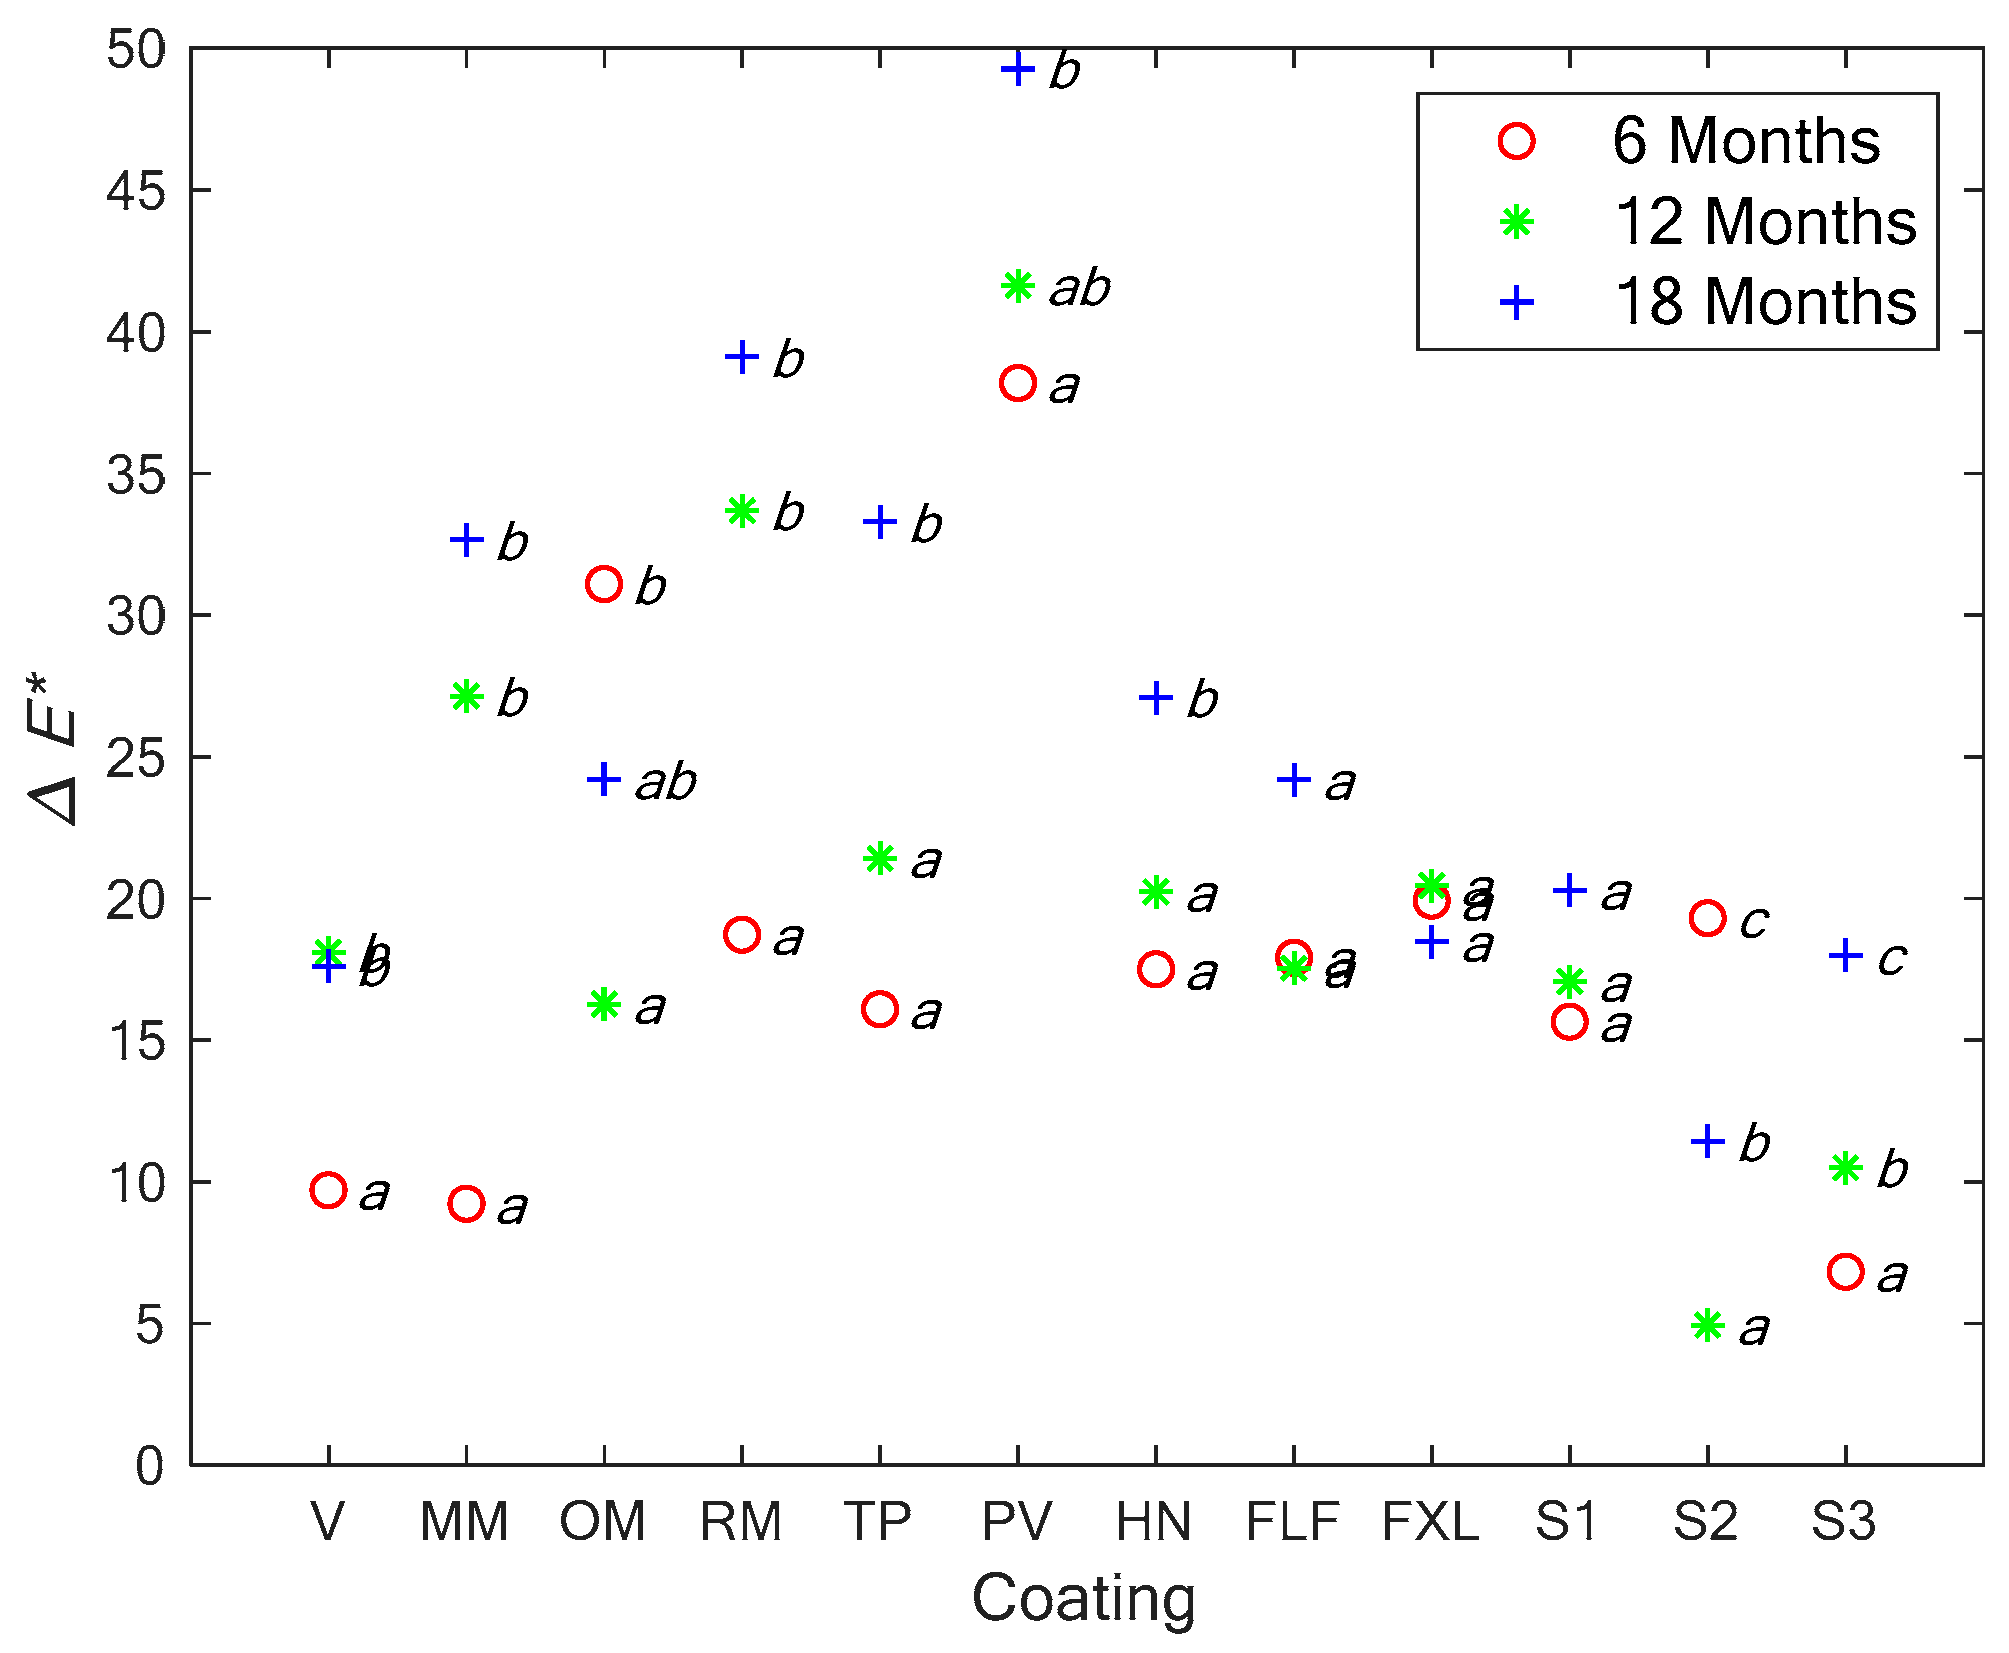
The results of this study indicate that the color changed for all wood surfaces exposed to natural weathering and rain to some degree over the 18-month period for the coatings and species combinations tested. Color change was explored as the result of changes in the L*, a*, and b* components of color images of the wood surfaces. Although the color changed for all surfaces, the change was not consistent across wood species or coatings tested; both the rate and the overall magnitude varied for ∆E* for different species/coatings combinations during the study. Games–Howell pairwise comparison tests indicated few distinct groups or patterns of coating responses in terms of ∆E*. The analysis did reveal that different coatings provide different levels of protection against color change. In some cases, the maximum change was reached early in the experiment. In other cases, it was not reached until later, or, at the end of the study. Ideally, a coating would prevent or reduce overall color change over the long-term. While no coating prevented color change entirely, several indicated relatively small changes (compared to the other coatings) in both the short and long term.
These results agree with other research on the topic for both finished and unfinished wood surfaces [3,10,13,16,29]. As with other studies, the degree of color change varied depending on the coating and species. While some coatings in this study provided short-term protection against physical attack, none was uniformly effective over the relatively short 18 month exposure. The results illustrate the difficulty in using clear (or slightly pigmented) finishes to protect timber as well as the need for more substantial additives for limiting color change of the surface.
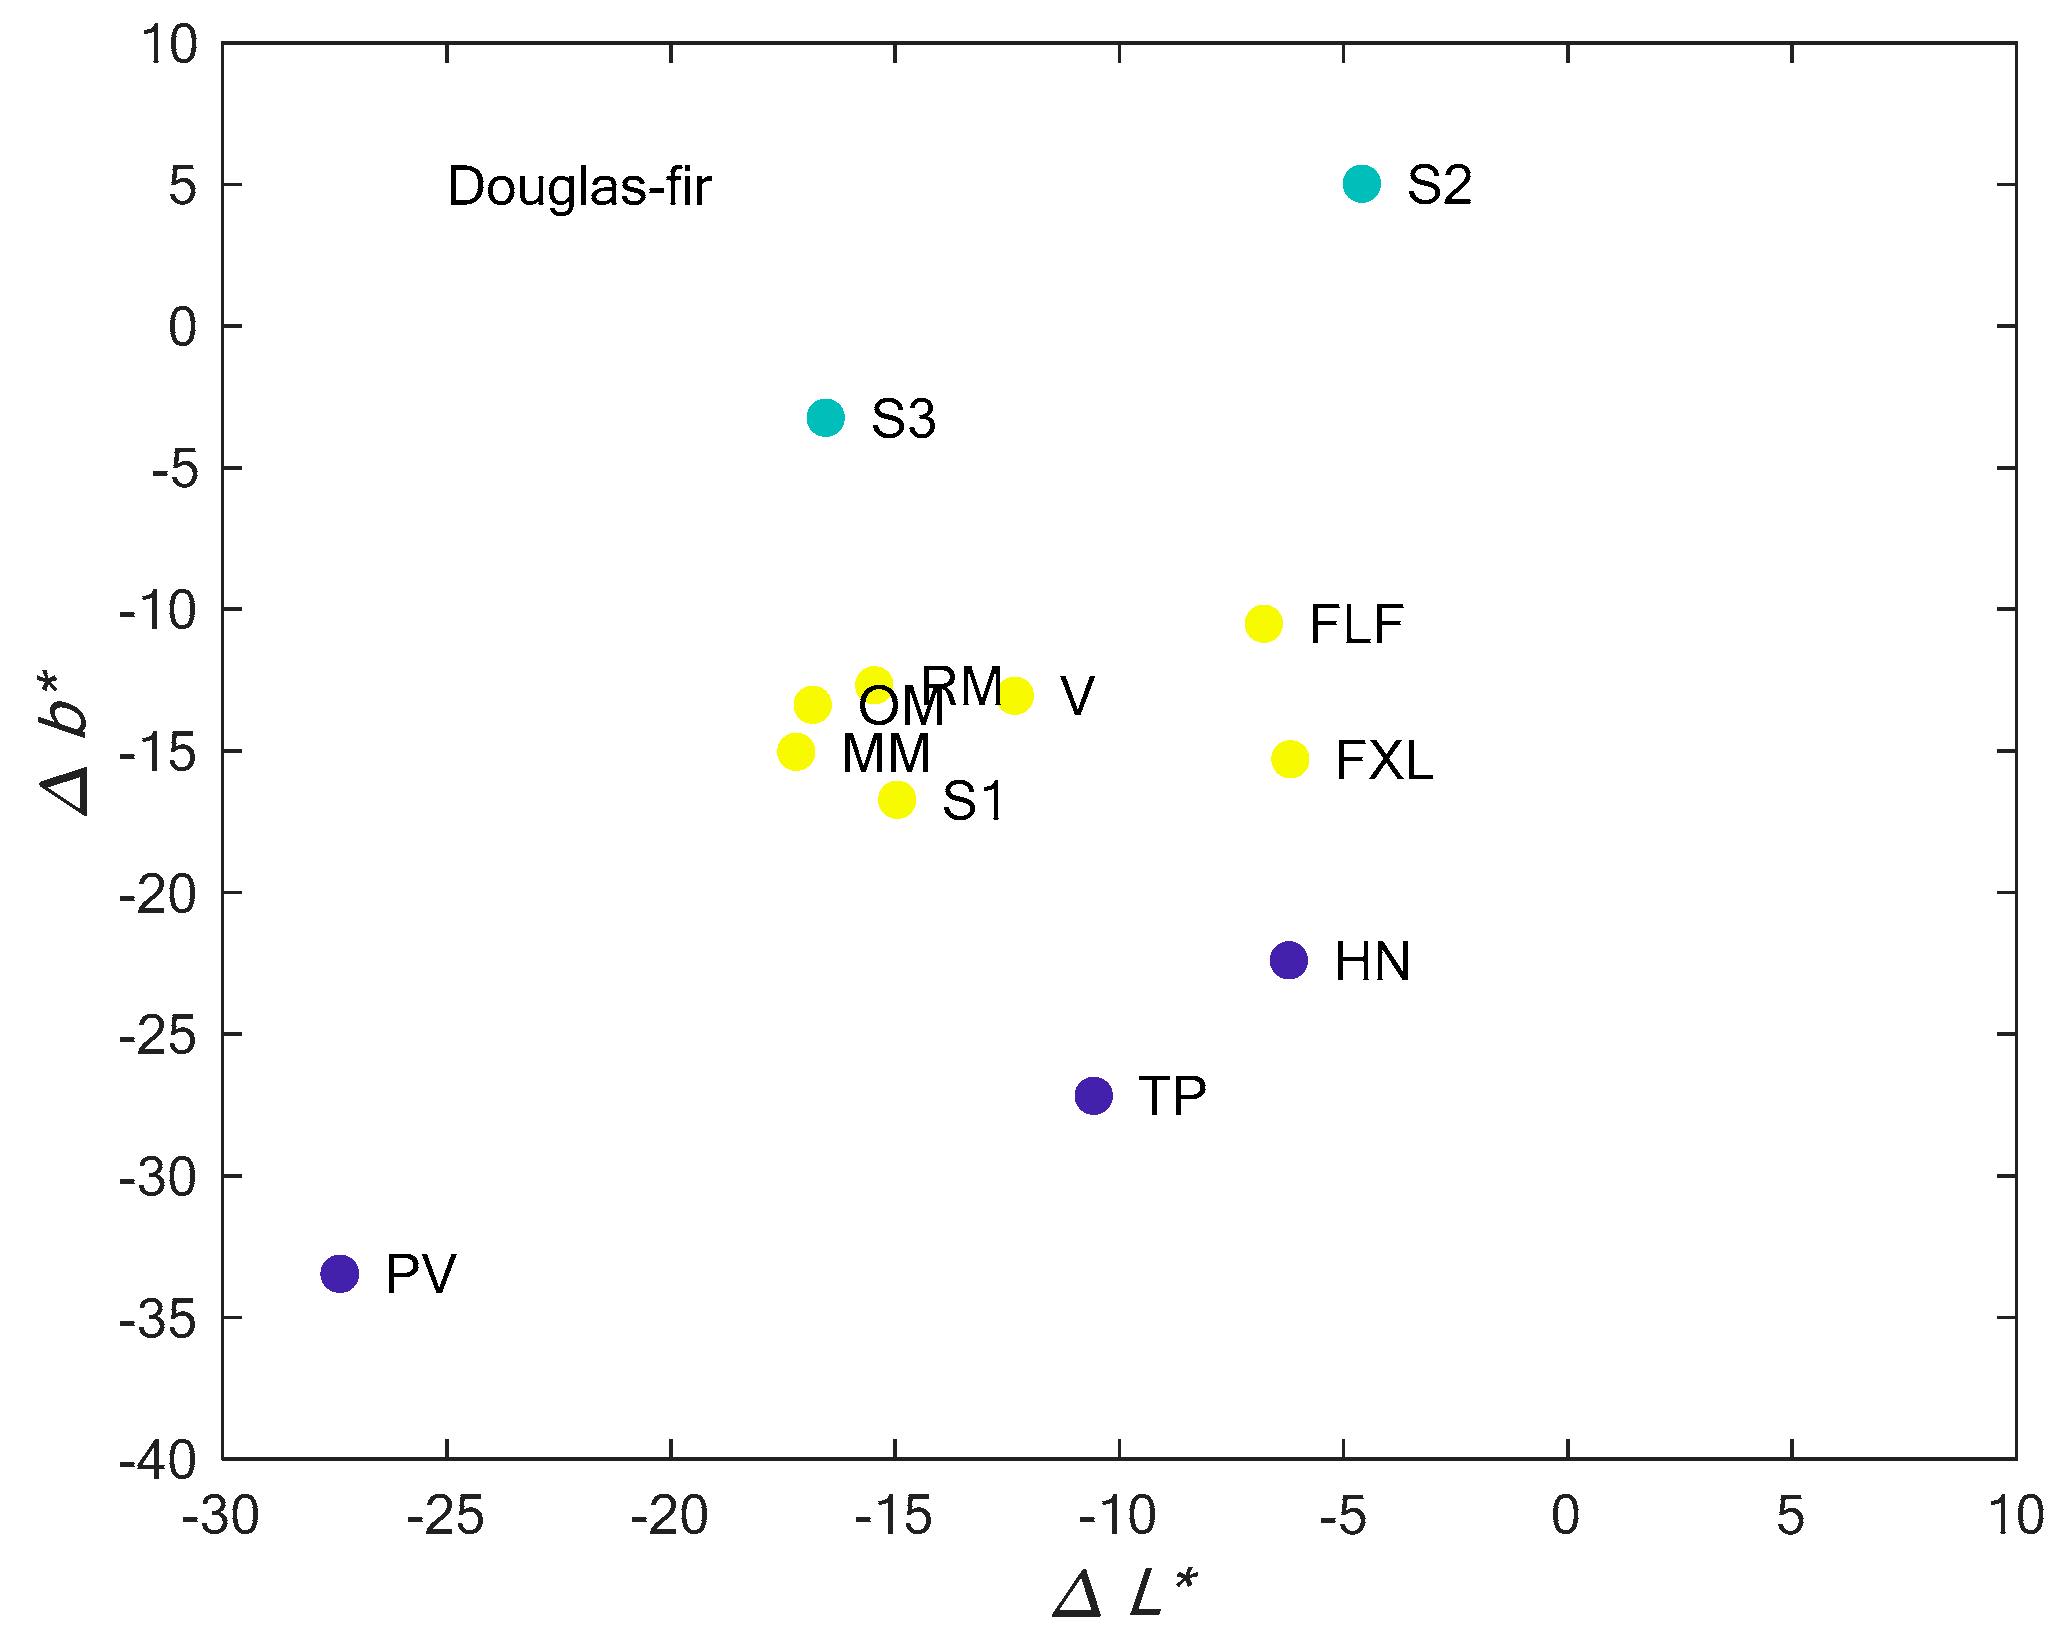
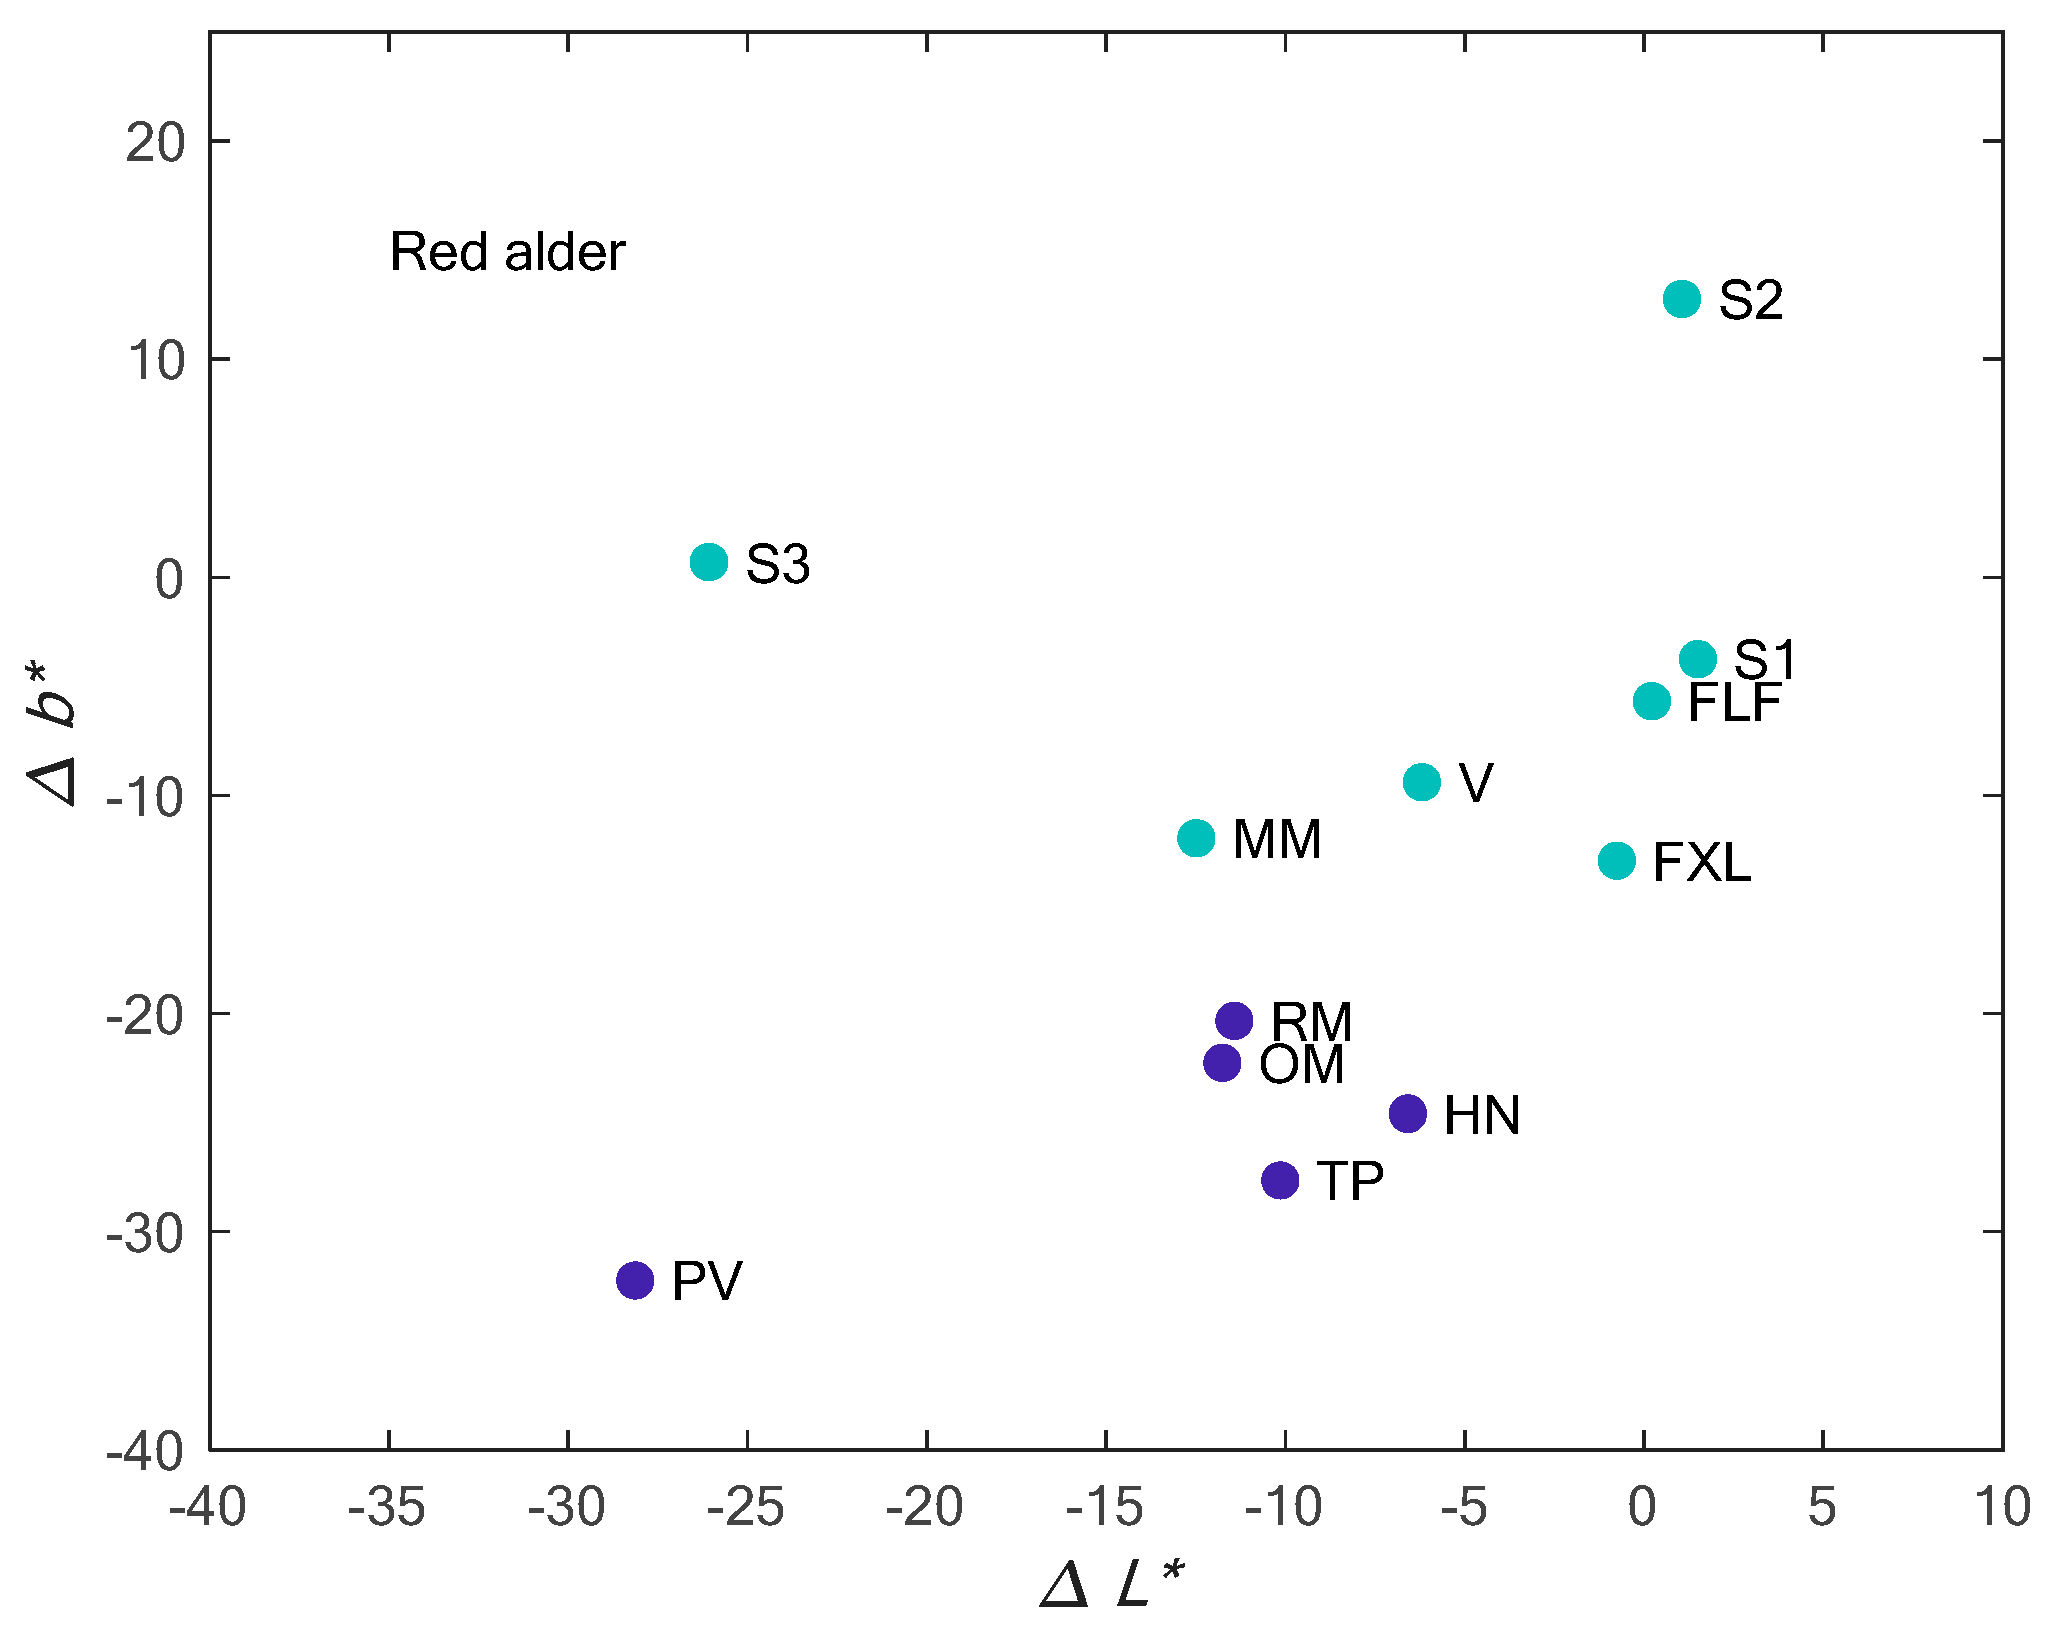
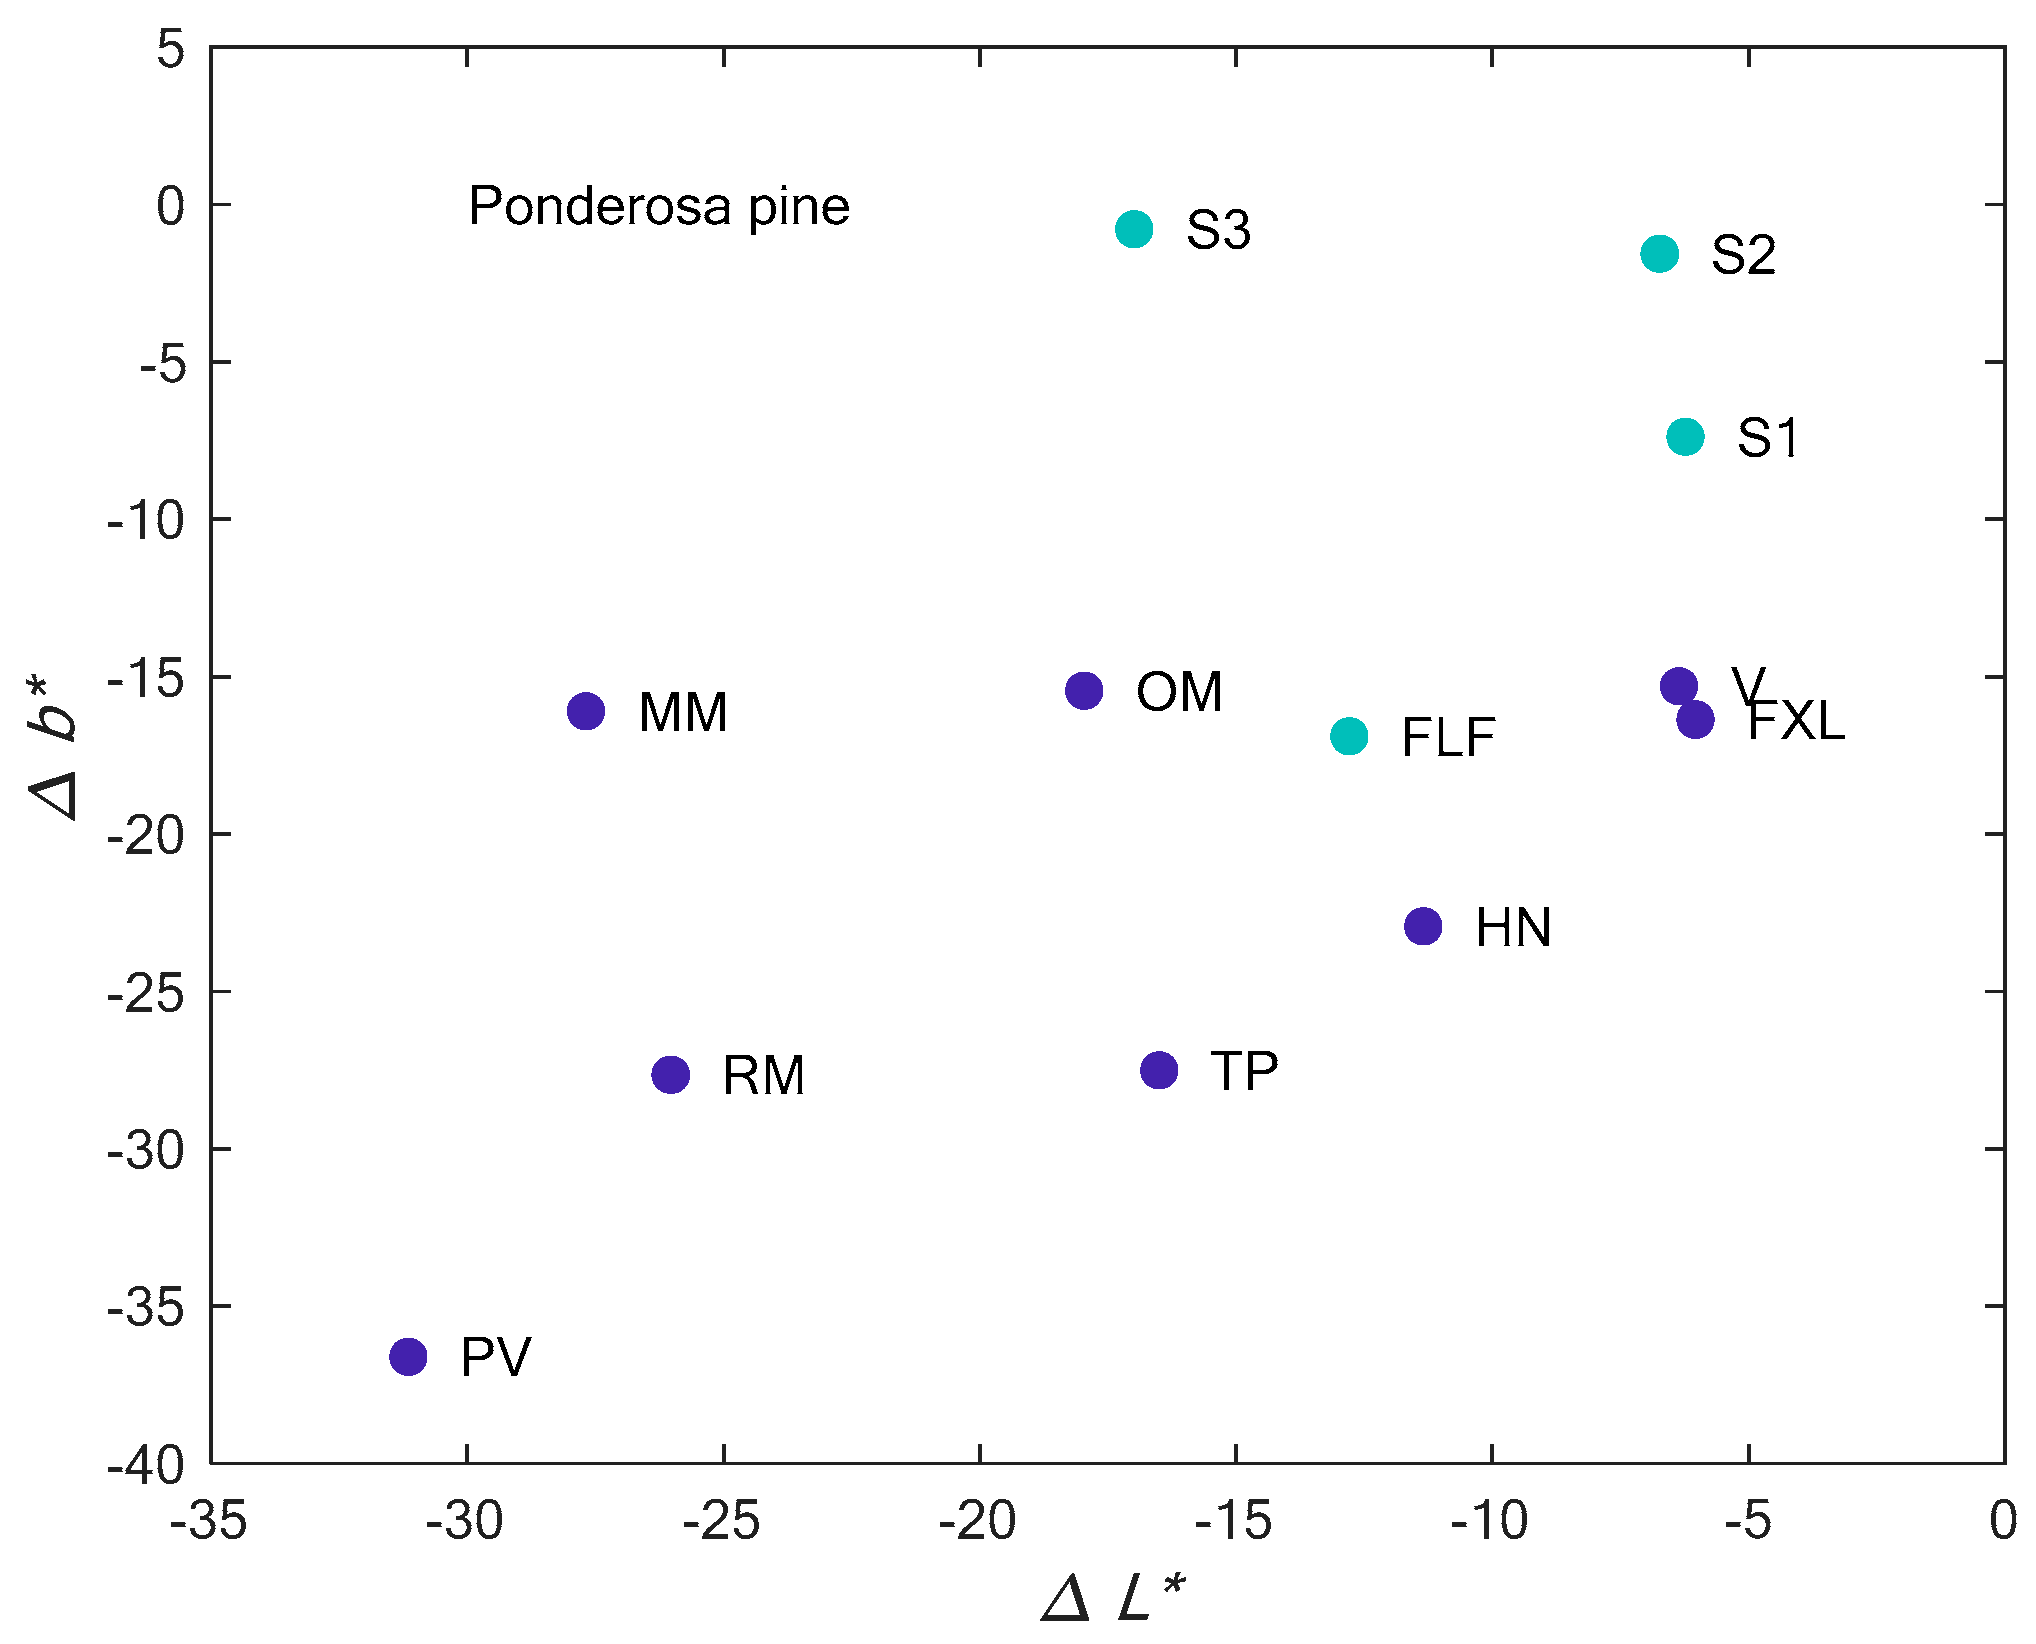
Although ∆E* provided an indication of the magnitude of color change, it did not provide information as to the direction of change (i.e., overall darkening or lighting). Therefore, changes in the color components were used to evaluate the direction of color change over 18 months. Overall, the coatings performed differently on the species throughout the study. Although not presented in detail here, visual inspection of compilation images and scatter plots of group means of ∆L*, ∆a*, and ∆b* of all coatings/species combinations revealed that in some cases, surfaces would lighten and yellow early in the experiment only to darken and blue later. In other cases, surfaces would darken and blue early and continue to do so as the experiment continued. This pattern was also noted by Oberhofnerova et al., [13]. In that study, ∆L* for oak did not decrease until after 6 months, while it decreased between 11 and approximately 18 months for 4 softwoods. Decreases in ∆L* for the softwoods in this study were within the range (varied between slightly positive to approximately −30) presented in the study mentioned above.
Many other studies have examined color change at a small scale over short timeframes or under accelerated weathering conditions. The methods used in this study examined color change across larger surfaces (millions of pixels), which probably better represented human perception of the visual attributes of wood surfaces. This study used two methods to examine both color change and the direction of change. The first method (Games–Howell) was used to understand the differences in color change across coatings and sampling intervals. This method was selected due to the large range of variability in ∆E* across the samples. The second method used the distances between each pair of group means (MANOVA output) to cluster the coatings according to the individual measurement of ∆L*, ∆a*, and ∆b* over 18 months. The cluster analysis allowed groups of coatings that performed similarly in terms of color change to be identified for each species. Usually, the procedure produced groups that could be considered good, moderate, or poor performers in terms of increases in darkness and blueness of the images, typically caused by the growth of mildew. However, what was particularly interesting was that often the coatings varied among the species for the two or three groups. This technique provided some guidance to the user wishing to select the best coating(s) for a particular type of wood that was likely to result in the least amount of increase in darkness or blueness.
In this study, samples were exposed to natural weathering conditions that included sunlight, moisture as rain and fog, and a range of temperatures, sometimes below the freezing point for 18 months. These conditions provided extreme testing conditions which certainly accelerated the degradation of both the coatings and the timber and encouraged the growth of mildew. The coating effectiveness presented here should be taken as a worse case outcome for the species/coating combinations studied. As noted in by Nzokou et al., [16], coating effectiveness can vary with different conditions. Therefore, the results presented here may be different for applications that, for example, are not exposed to direct rainfall or direct sunlight. For applications that experience direct sunlight, rain, and temperature variations, other coatings, such as paint should be considered to reduce maintenance schedules.
The growth of surface mildew occurred for most of the samples tested, sometimes to an extreme level. Linseed and tung oil provide sustenance for mildew [
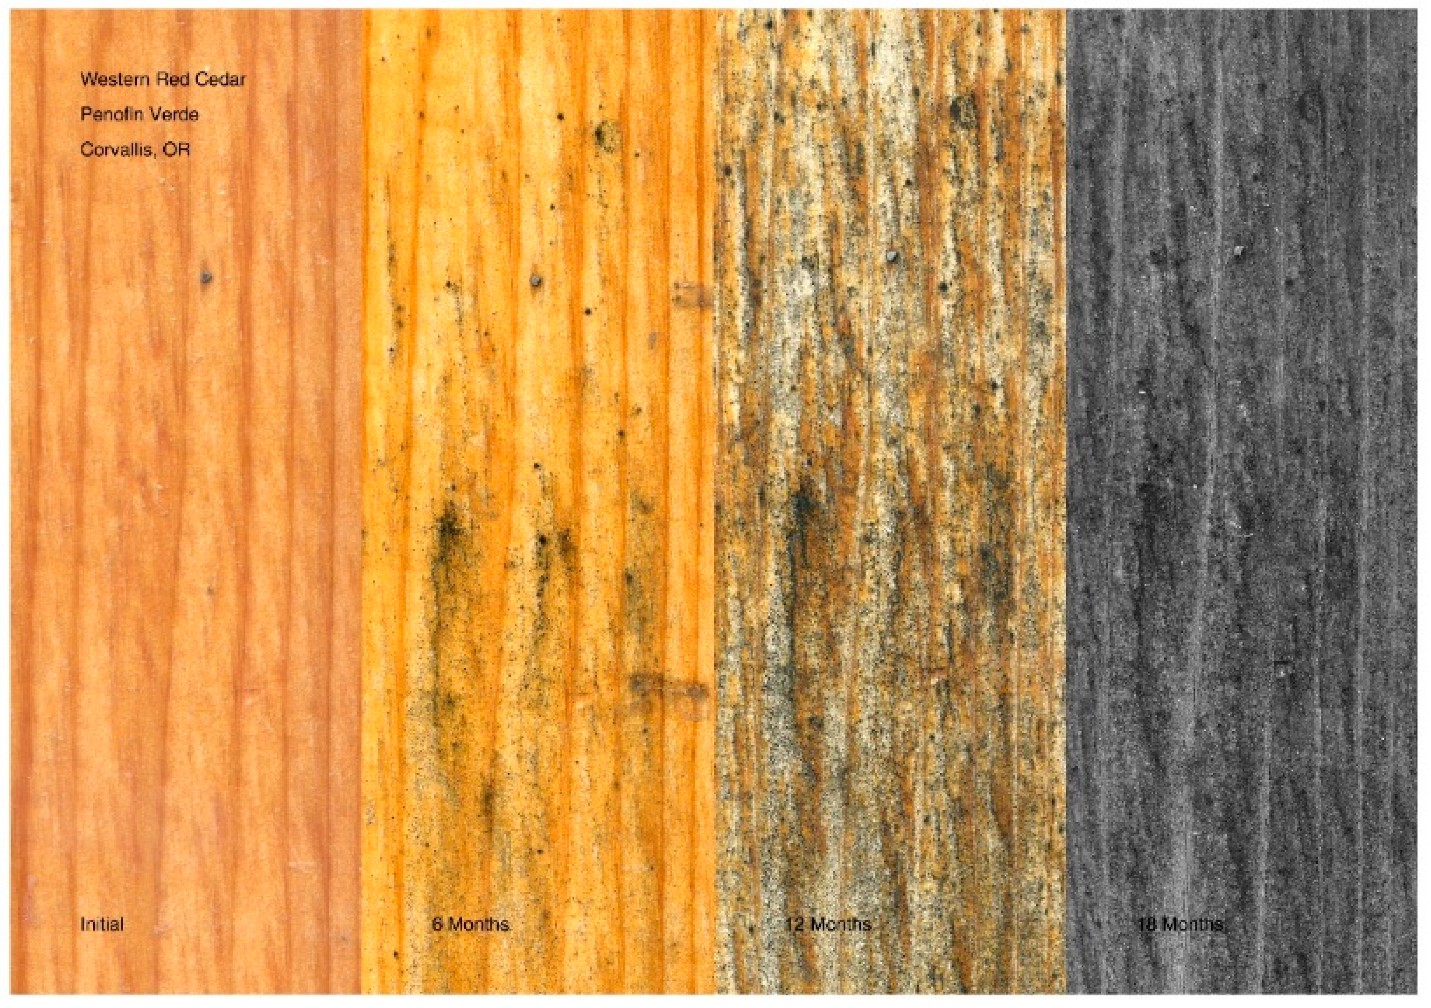
26] and combined with the near consistent supply of moisture at the site, mildew contributed to the substantial darkening of the surfaces, especially towards the end of the experiment. This indicates that the growth of mildew on exterior applications is difficult to control in temperate climates with clear coatings.
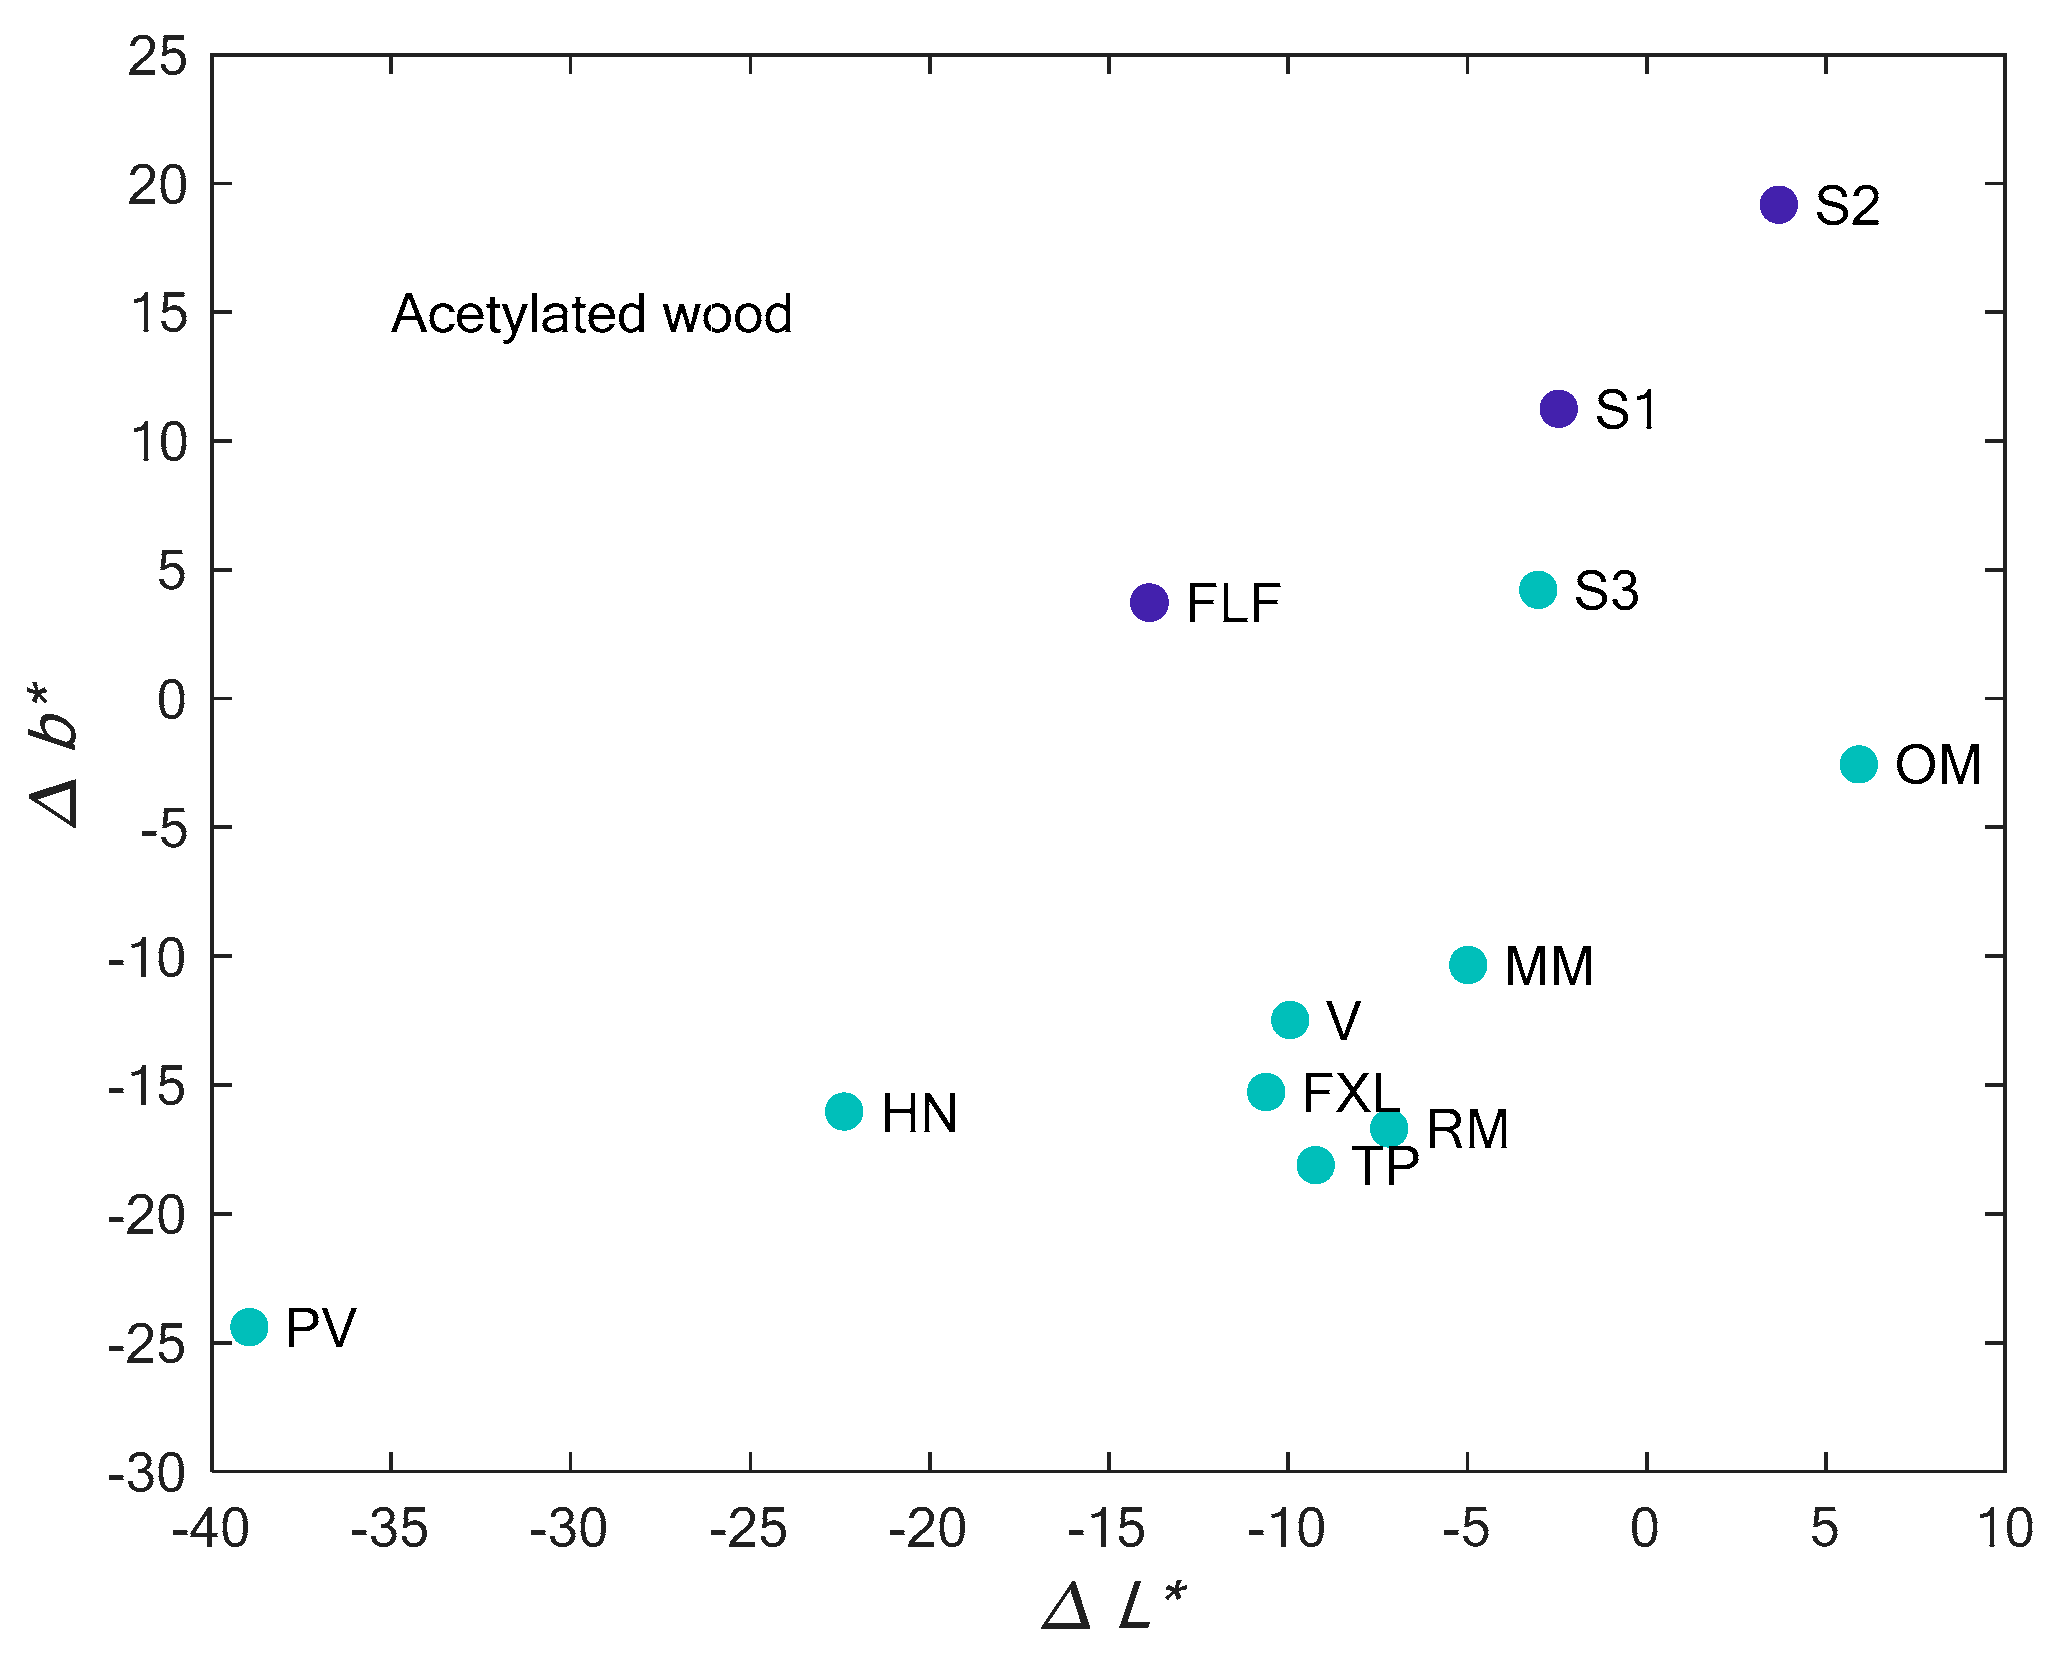
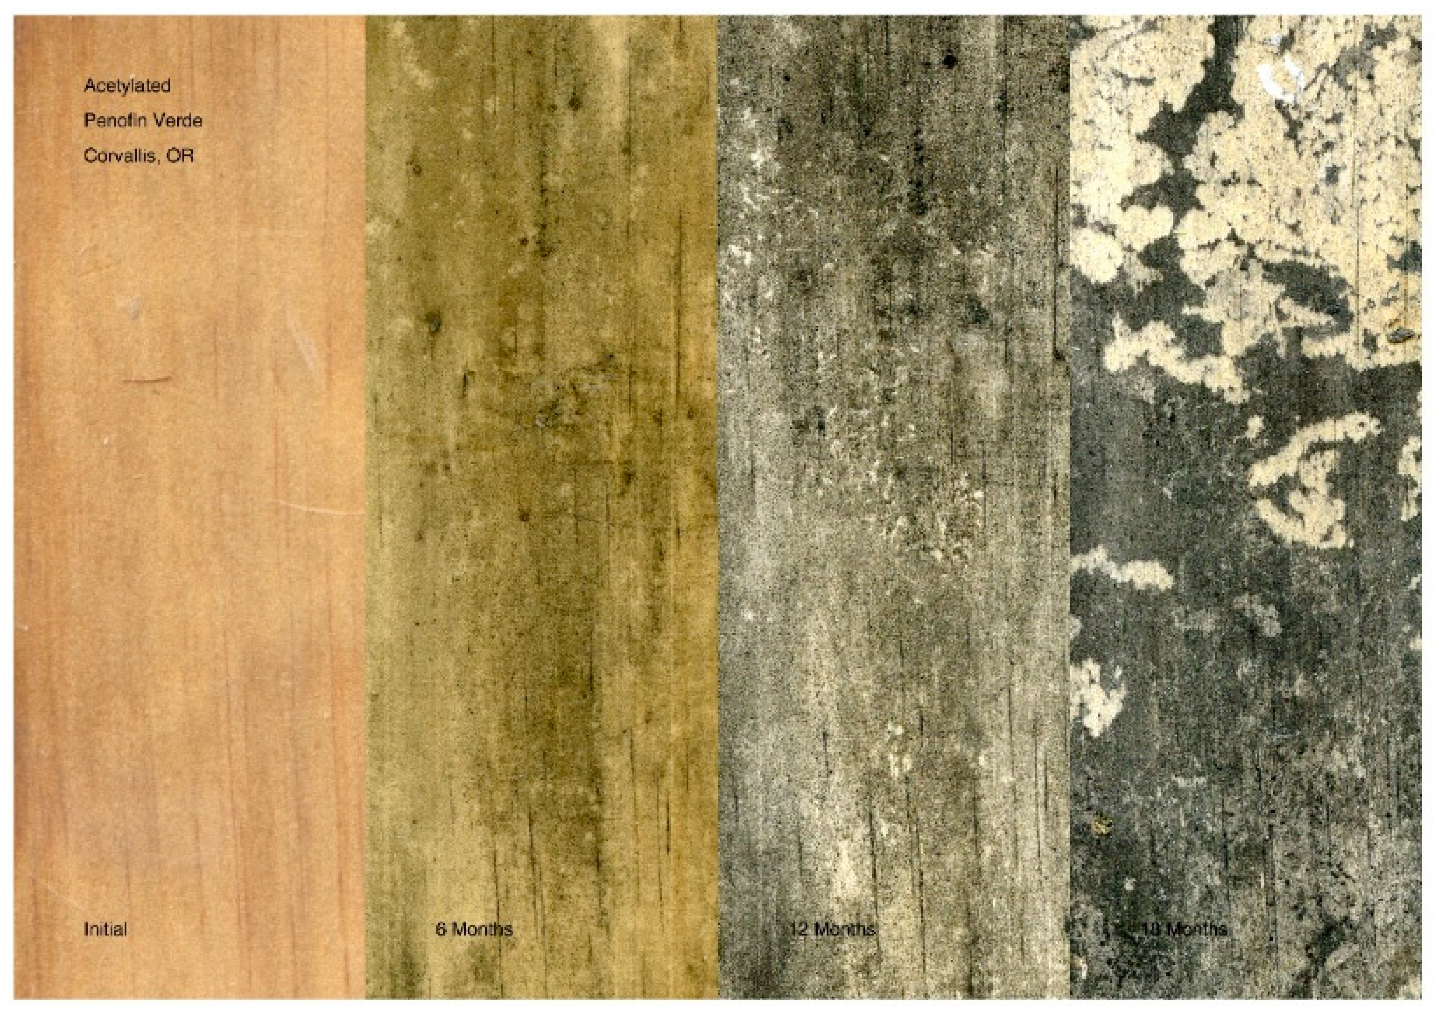
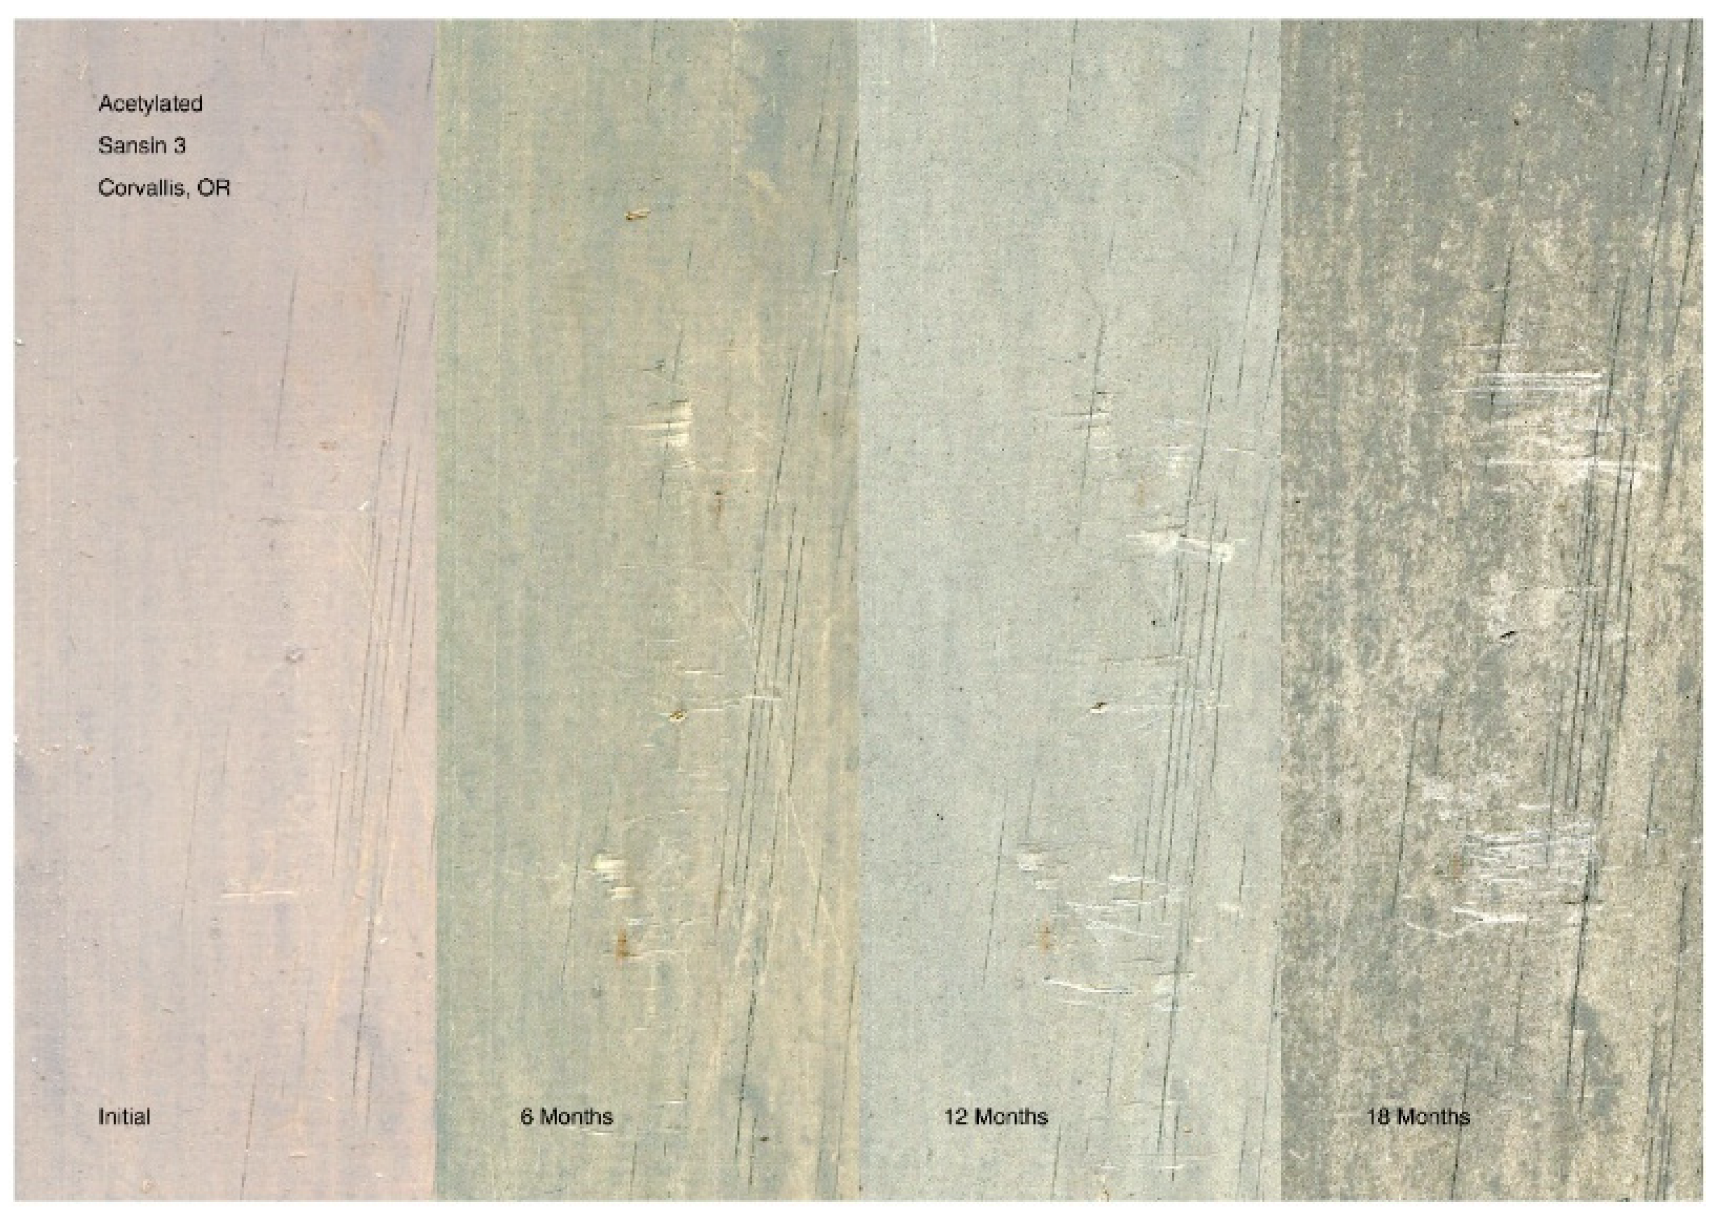
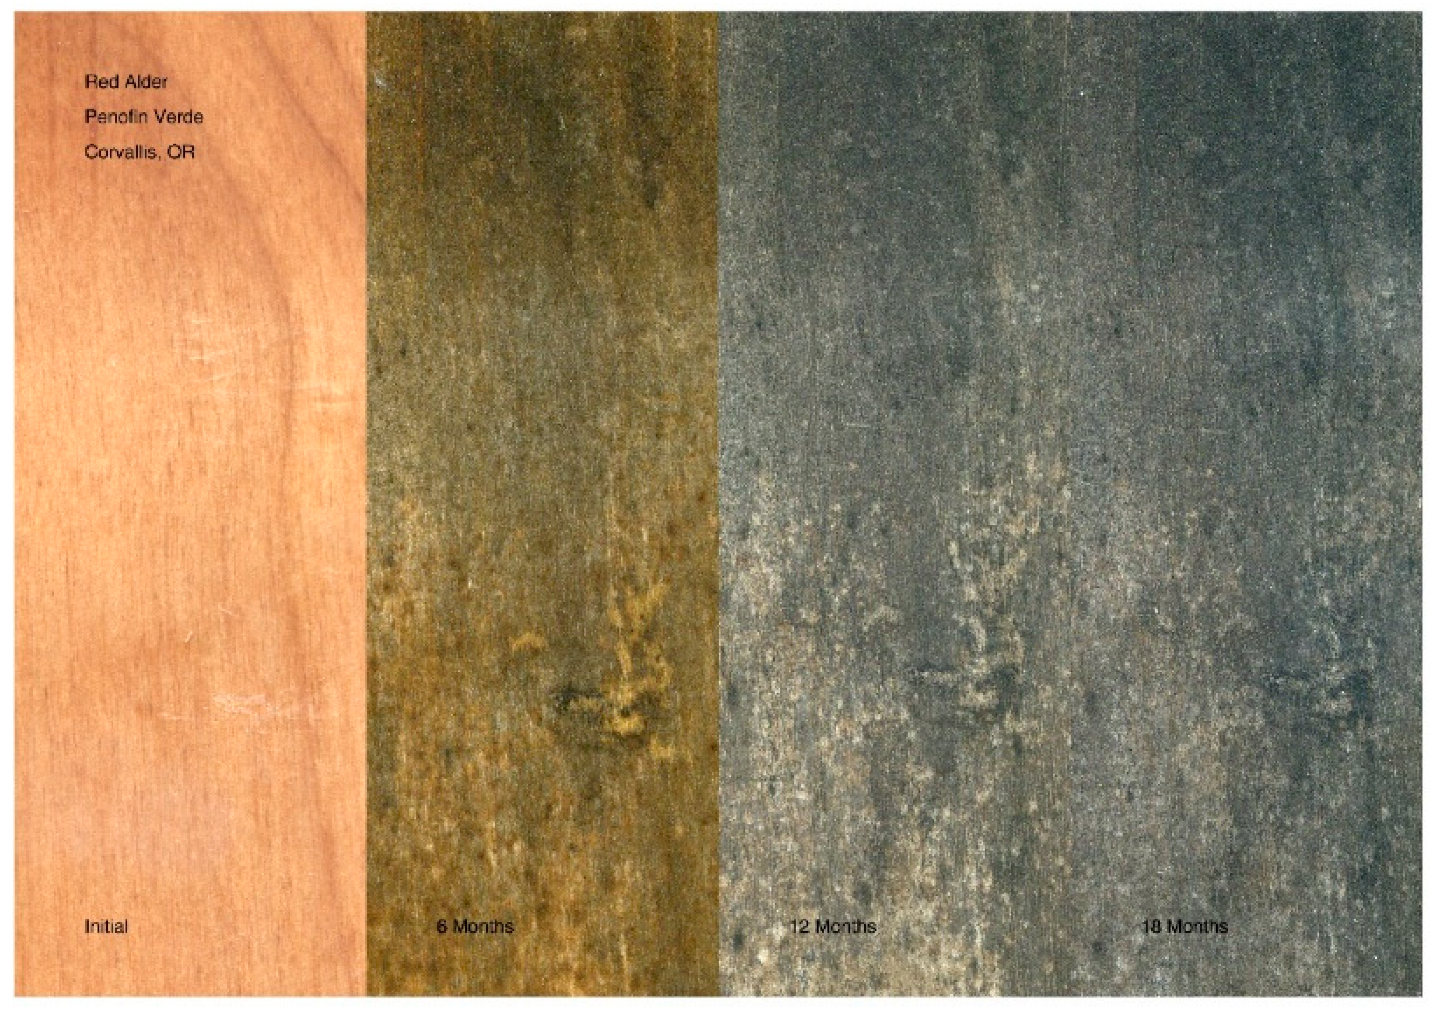
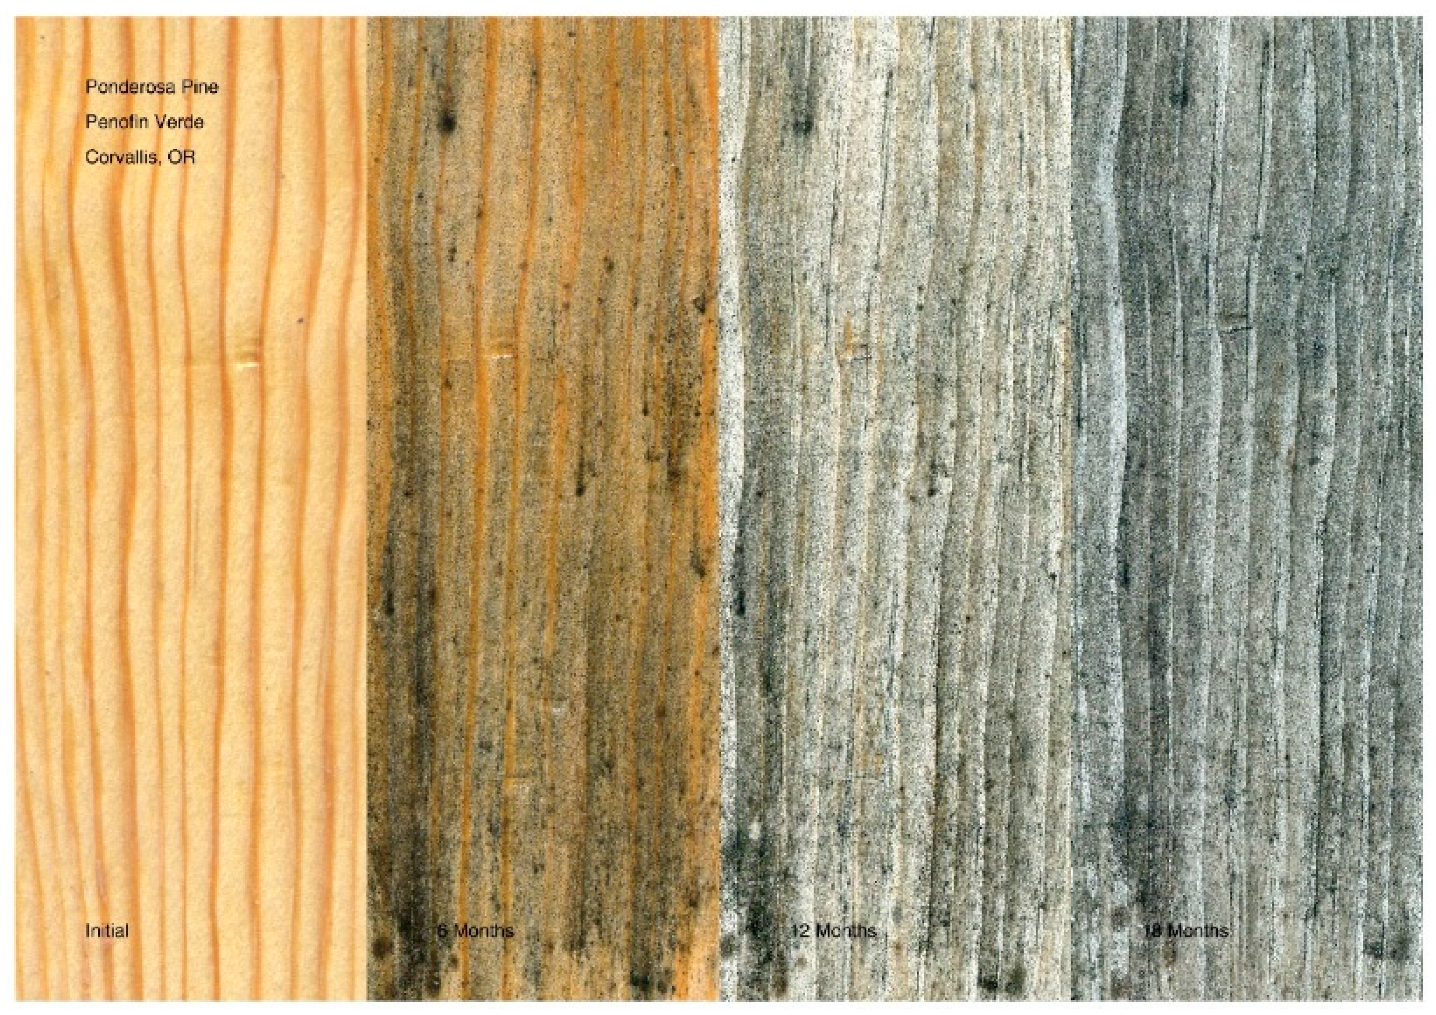
Extreme darkening was observed on most surfaces treated with PV early in the experiment. As the experiment took place in a damp, cool climate, the darkening was probably due to the growth of mildew on the surface of the samples. Acetylated wood darkened more than the other species with PV and showed considerable darkening for several of the other waterborne oil-based coatings. According to the Accoya Wood Information Guide [30], acetylated wood is susceptible to mildew growth in wet and damp areas. Combined with oil that could contribute to the growth of mildew, many of the coatings used in this study would not provide long-term protection against extreme darkening of acetylated wood in exterior applications.
Red alder, the only hardwood in the study, showed similar, but less extreme darkening using PV and S3. In general, the other coatings performed with moderate darkening, and some showed lightening throughout the study. The best performance was found for V, S2, S1, FLF, and FXL in the relative long-term. It is interesting to note that this group contained both film finishes and penetrating oil finishes.
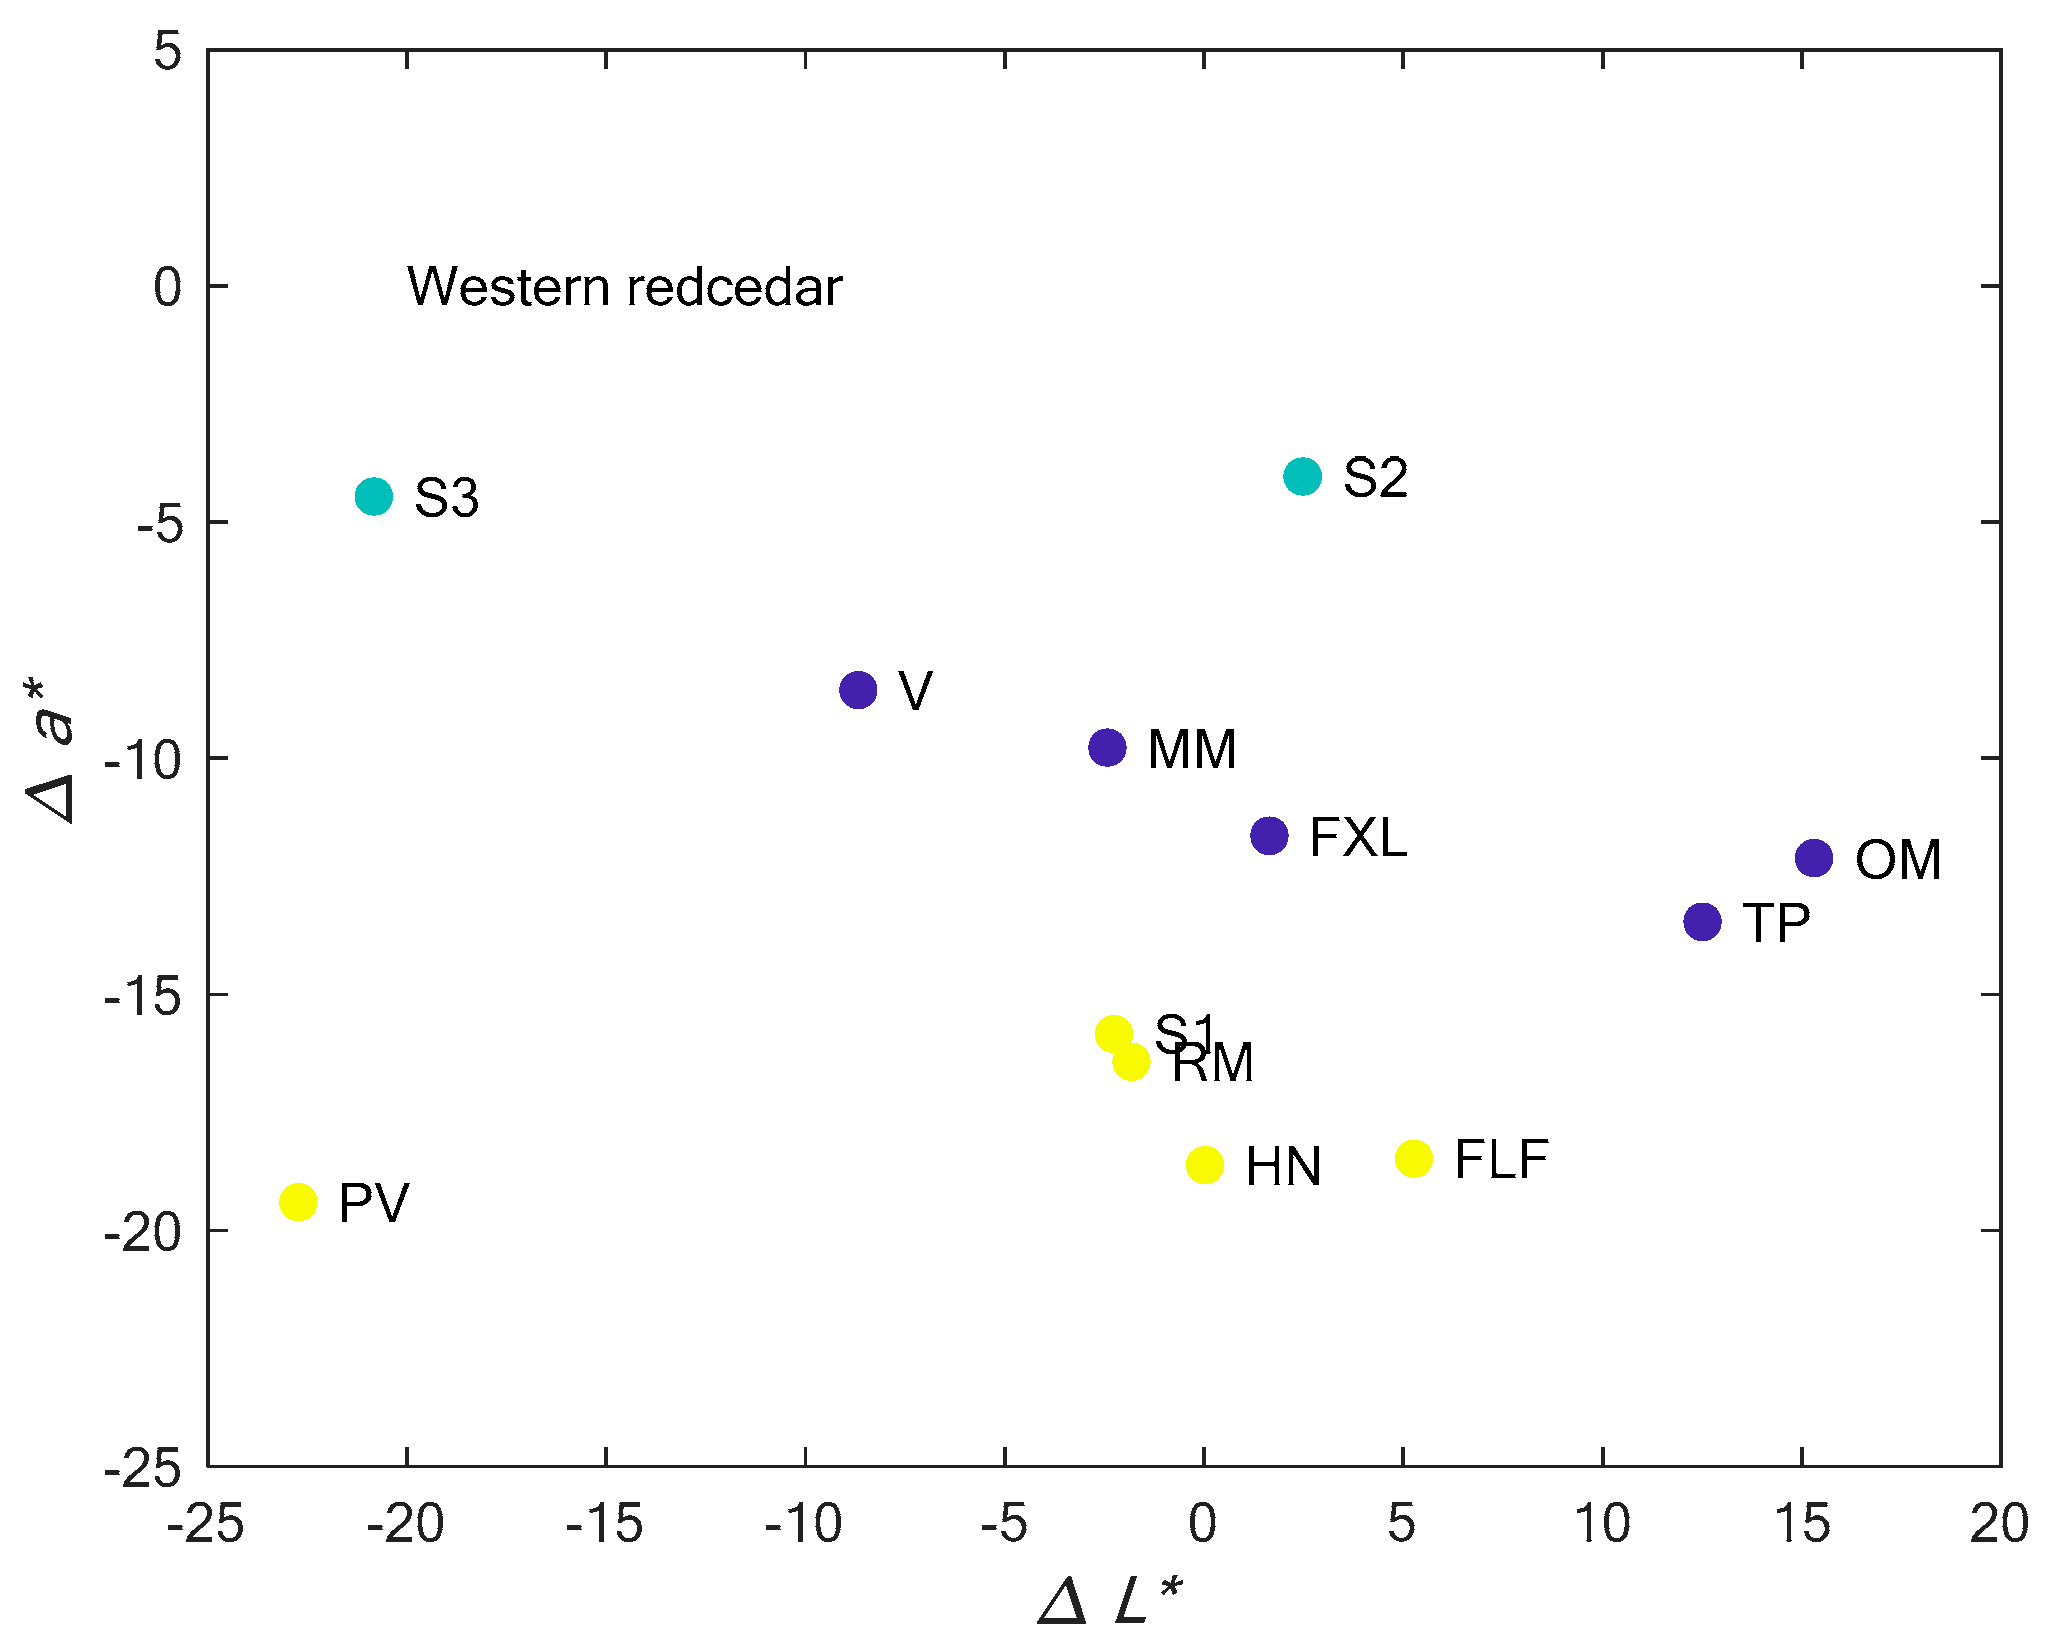
Most finishes, except TP, PV, OM, MM, and S3, performed well for western redcedar. This could be related to the species’ natural resistance to fungal growth [22]. The species also has a natural deep red-brown color and changes in this component are not indicated using the ∆L* and ∆b* axis, instead ∆a* was used to indicate increases in the redness of the surfaces.
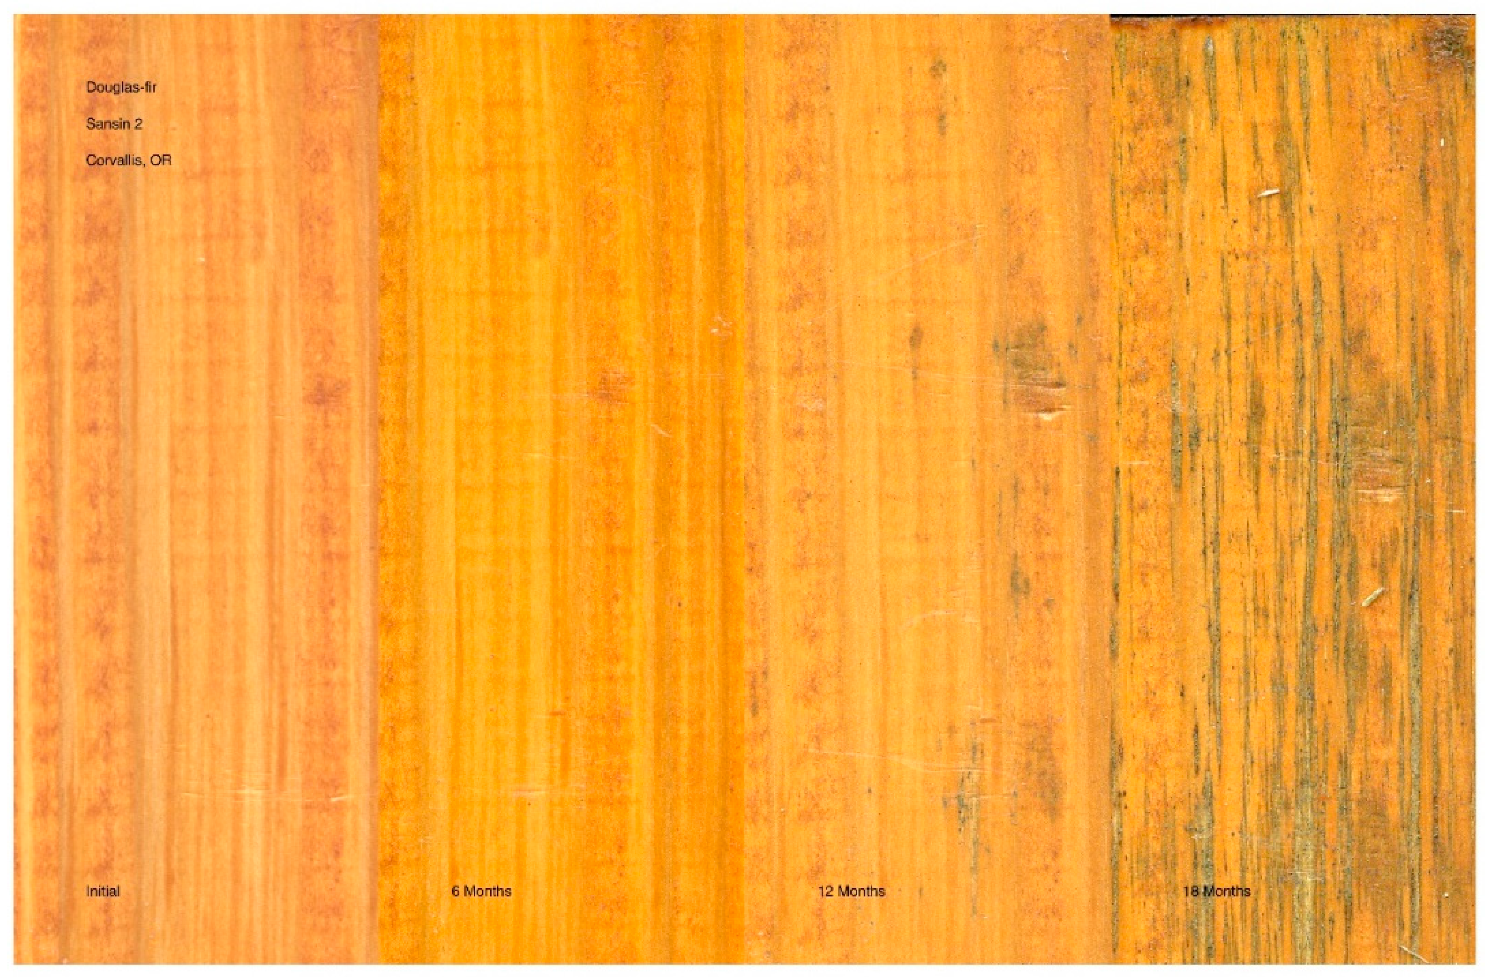
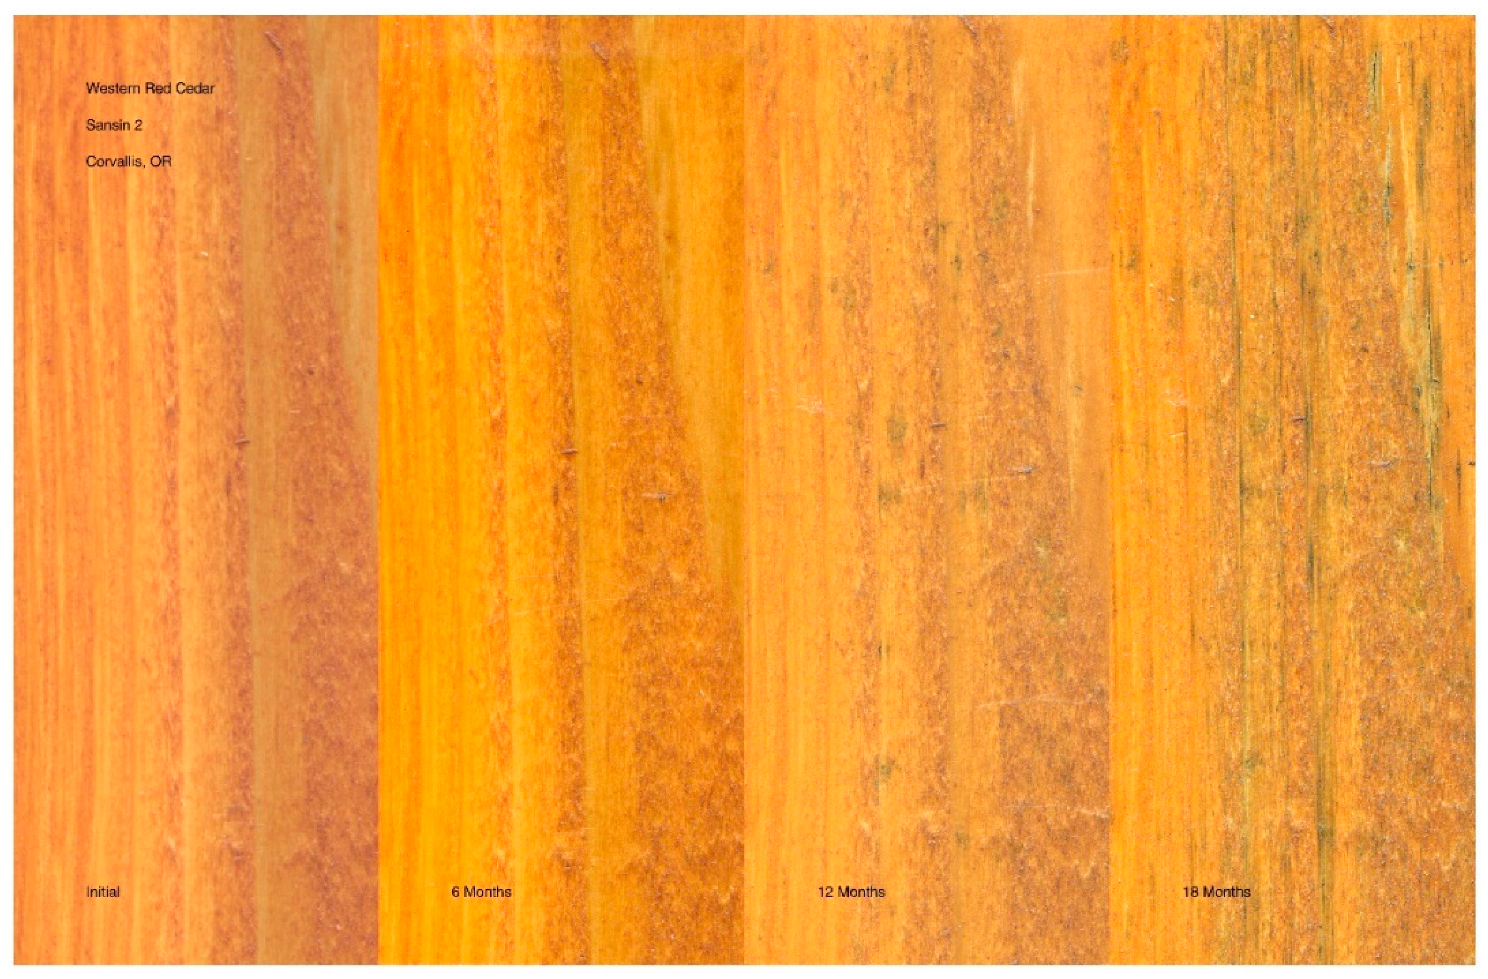
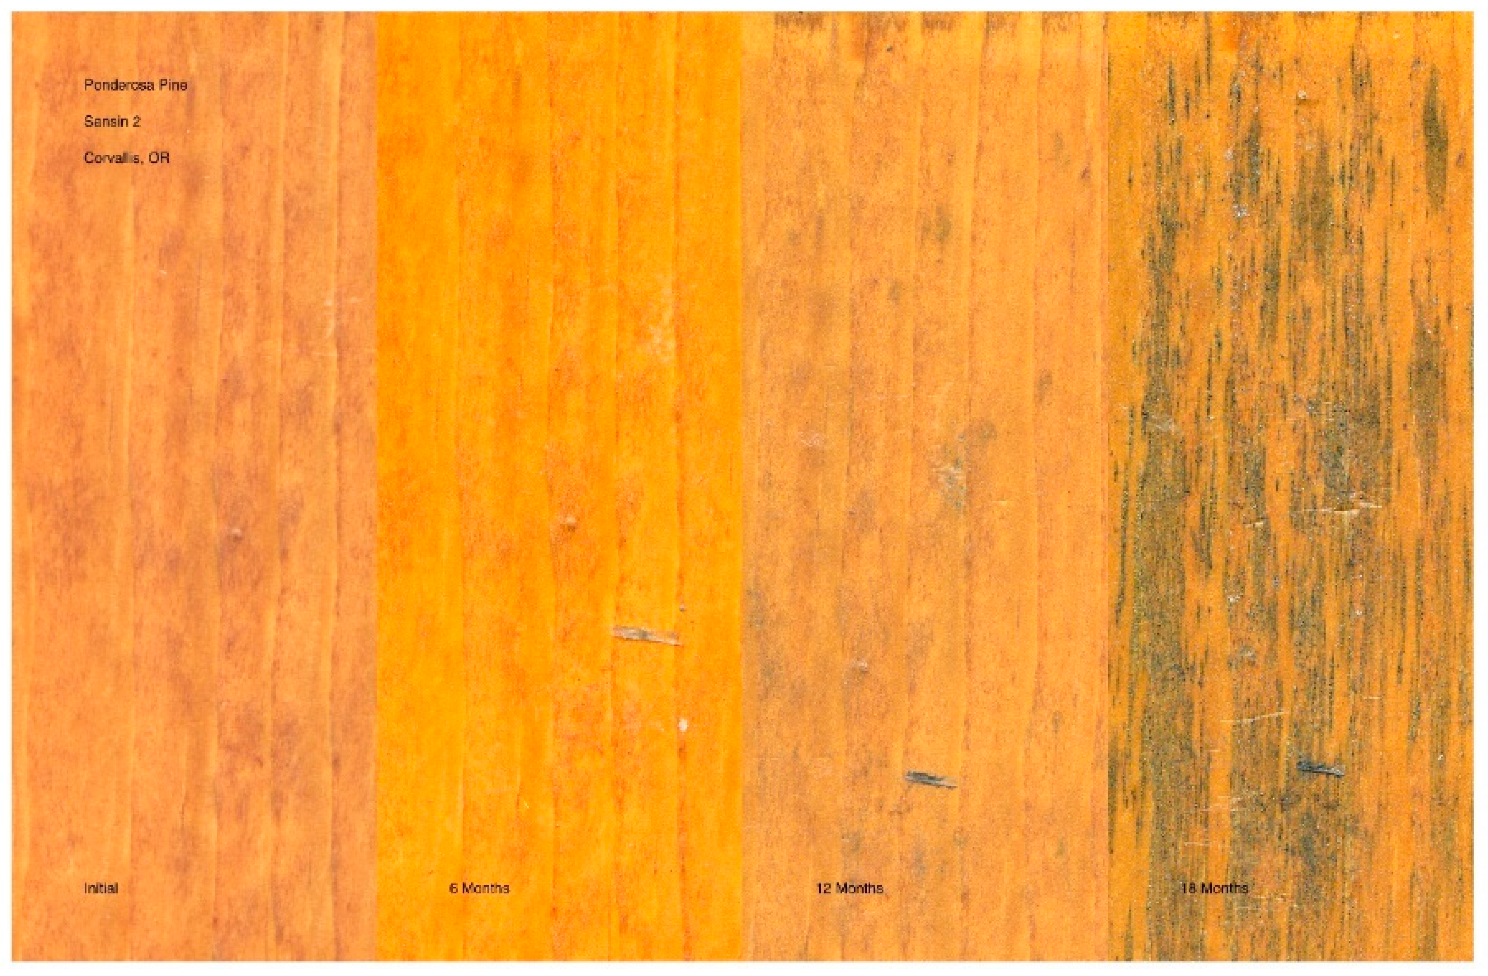
Most finishes performed about the same for Douglas-fir and ponderosa pine, however, S2 showed the least overall color change and the least darkening at 18 months. A few surfaces darkened a bit more for ponderosa pine than for Douglas-fir. As for the other species, PV did not appear to protect from mildew growth for these softwood species. Coatings such as S1, S2, FLF, FXL, HN, and V appeared to provide more protection against surface darkening and bluing, likely the result of the growth of surface mildew.
Although the Sansin coatings provided good performance for many of the samples, the S1 and S2 coatings imparted a strong orange tone after application to many of the species. Interestingly, this often resulted in a decrease in ∆E* after 6 months due to large increases in the red component. It appeared that these two were the most heavily pigmented coatings tested, and therefore, not surprisingly, provided good performance and lower incidence of mildew. As pigmented coatings can obscure or even change the desired visual attributes of wood, selection of heavily pigmented coatings should be carefully considered, despite the increased assurance of good performance.
The test site would be considered a typical exposure that might be experienced in the Pacific Northwest and illustrated the inevitable development of both UV damage and microbial growth. Routine reapplication of the coatings, periodic cleaning, or inclusion of more substantial anti-microbial compounds might forestall this process, but it is important to note the difficulty of maintaining coatings without these components.
The results of this study may guide users wishing to specify coatings for exposed wood in mass timber structures. As mass timber is used in more applications and climates, knowledge of the best coatings to be used is necessary. A good coating will prevent or delay surface discoloration and increase time in the finish maintenance schedule. Future research should include other coatings, other species, and other climates to better match exterior coatings to different species and their location of use.

5. Conclusions

Although the results did not produce hard-and-fast guidance by which to select one finish over another, the study reinforces the fact that coating selection should be a carefully considered decision. Obviously, a single coating formulation should not be used for all applications and exposure conditions. In addition, coating selection is a multifaceted decision that should include not only performance, but also environmental implications, ease of application, and color effects on different species.
While the Games–Howell and cluster analyses suggested that there were large differences in the performance of some coatings among species, there were a few notable trends. The Penofin Verde coating uniformly separated from almost all the other coatings in both analysis methods in the first six months suggesting that it provided little protection to the wood. No single coating was uniformly protective within the range of species tested nor was any coating completely effective over 18 months of exposure. The test site would be considered moderate in terms of both biological and UV exposure and illustrates the difficulties in preventing color change of wood surfaces with commercially available clear coatings for long term (months to years). Although these findings may contradict manufacturers claims and users experience, they present comparative evidence of relatively poor clear coating performance for exterior applications in temperate climates. This information should be useful to architects and specifiers that are considering showcasing the visual attributes of exterior mass timber elements.

Author Contributions

Formal analysis, K.D.; conceptualization, methodology, J.J.M.; supervision, project administration, S.L.; Writing—Review and editing, K.D., J.J.M., and S.L. All authors have read and agreed to the published version of the manuscript.

Funding

This research received no external funding.

Institutional Review Board Statement

Not applicable.

Informed Consent Statement

Not applicable.

Data Availability Statement

The data presented in this study are available upon request from the corresponding author.

Acknowledgments

The authors would like to acknowledge the contributions of Matt Konkler for developing the exposure rack, placing and retrieving specimens, student workers Eliazar Lopez and Kathy Hu for their work preparing the test specimens; and Vikki Leavengood for scanning the specimens.

Conflicts of Interest

The authors declare no conflict of interest.

References

  1. Flexner, B. Understanding Wood Finishing: How to Select and Apply the Right Finish; Reader’s Digest Association Inc.: Pleasantville, NY, USA, 1999. [Google Scholar]
  2. Feist, W.C.; Hon, D.N.S. Chemistry of weathering and protection. Chem. Solid Wood 1984, 207, 401–451. [Google Scholar]
  3. Laskowska, A.; Dobrowolska, E.; Boruszewski, P. The impact of ultraviolet radiation on the colour and wettability of wood used for facades. Drew. Pr. Nauk. Doniesienia Komun. 2016, 59, 99–111. [Google Scholar]
  4. Pastore, T.C.; Santos, K.O.; Rubim, J.C. A spectrocolorimetric study on the effect of ultraviolet irradiation of four tropical hardwoods. Bioresour. Technol. 2004, 93, 37–42. [Google Scholar] [CrossRef]
  5. Tolvaj, L.; Mitsui, K. Correlation between hue angle and lightness of light irradiated wood. Polym. Degrad. Stab. 2010, 95, 638–642. [Google Scholar] [CrossRef]
  6. Chang, T.-C.; Chang, H.T.; Wu, C.L.; Chang, S.T. Influences of extractives on the photodegradation of wood. Polym. Degrad. Stab. 2010, 95, 516–521. [Google Scholar] [CrossRef]
  7. Pandey, K.K. A note on the influence of extractives on the photo-discoloration and photo-degradation of wood. Polym. Degrad. Stab. 2005, 87, 375–379. [Google Scholar] [CrossRef]
  8. Feist, W.C. Weathering of Wood in Structural Uses; USDA Forest Service, Forest Products Laboratory: Madison, WI, USA, 1982; pp. 156–178.
  9. Feist, W.C. Outdoor Wood Weathering and Protection, in Archaeological Wood; Advances in Chemistry; American Chemical Society: Washington, DC, USA, 1989; pp. 263–298. [Google Scholar]
  10. Oberhofnerová, E.; Panek, M.; Böhm, M. Effect of surface pretreatment with natural essential oils on the weathering performance of spruce wood. Bioresources 2018, 13, 7053–7070. [Google Scholar]
  11. Van Meel, P.A.; Erich, S.J.; Huinink, H.P.; Kopinga, K.; De Jong, J.; Adan, O.C. Moisture transport in coated wood. Prog. Org. Coat. 2011, 72, 686–694. [Google Scholar] [CrossRef]
  12. Müller, U.; Rätzsch, M.; Schwanninger, M.; Steiner, M.; Zöbl, H. Yellowing and IR-changes of spruce wood as result of UV-irradiation. J. Photochem. Photobiol. 2003, 69, 97–105. [Google Scholar] [CrossRef]
  13. Oberhofnerová, E.; Panek, M.; Garcia-Cimarras, A. The effect of natural weathering on untreated wood surface. Maderas. Cienc. Tecnol. 2017, 19, 173–184. [Google Scholar] [CrossRef] [Green Version]
  14. Oberhofnerová, E.; Šimůnková, K.; Dvořák, O.; Štěrbová, I.; Hiziroglu, S.; Šedivka, P.; Pánek, M. Comparison of exterior coatings applied to Oak wood as a function of natural and artificial weathering exposure. Coatings 2019, 9, 864. [Google Scholar] [CrossRef] [Green Version]
  15. Ozgenc, O.; Okan, O.T.; Yildiz, U.C.; Deniz, I. Wood surface protection against artificial weathering with vegetable seed oils. Bioresources 2013, 8, 6242–6262. [Google Scholar] [CrossRef] [Green Version]
  16. Nzokou, P.; Kamdem, D.P.; Temiz, A. Effect of accelerated weathering on discoloration and roughness of finished ash wood surfaces in comparison with red oak and hard maple. Prog. Org. Coat. 2011, 71, 350–354. [Google Scholar] [CrossRef]
  17. Dyrness, C.T.; Franklin, J.F. Natural Vegetation of Oregon and Washington; Dyrness, C.T., Ed.; Oregon State University Press: Corvallis, OR, USA, 1988. [Google Scholar]
  18. Xie, Y.; Krause, A.; Militz, H.; Mai, C. Weathering of uncoated and coated wood treated with methylated 1,3-dimethylol-4,5-dihydroxyethyleneurea (mDMDHEU). Eur. J. Wood Wood Prod. 2008, 66, 455–464. [Google Scholar] [CrossRef]
  19. Zhong, Z.; Hiziroglu, S.; Chan, C.T.M. Measurement of the surface roughness of wood based materials used in furniture manufacture. Measurement 2013, 46, 1482–1487. [Google Scholar] [CrossRef]
  20. Kataoka, Y.; Kiguchi, M.; Williams, R.S.; Evans, P.D. Violet light causes photodegradation of wood beyond the zone affected by ultraviolet radiation. Holzforschung 2007, 61, 23–27. [Google Scholar] [CrossRef]
  21. Hon, D.N.S.; Chang, S.T. Surface degradation of wood by ultraviolet light. J. Polym. Sci. Polym. Chem. Ed. 1984, 22, 2227–2241. [Google Scholar] [CrossRef]
  22. Tolvaj, L.; Faix, O. Artificial ageing of wood monitored by DRIFT spectroscopy and CIE L*a*b* color measurements. I. effect of UV light. Holzforschung 1995, 49, 397–404. [Google Scholar] [CrossRef]
  23. Mohebby, B.; Saei, A.M. Effects of geographical directions and climatological parameters on natural weathering of fir wood. Constr. Build. Mater. 2015, 94, 684–690. [Google Scholar] [CrossRef]
  24. Dawson, B.; Singh, A.P.; Kroese, H.W.; Schwitzer, M.A.; Gallagher, S.; Riddiough, S.J.; Wu, S. Enhancing exterior performance of clear coatings through photostabilization of wood. Part 2: Coating and weathering performance. J. Coat. Technol. Res. 2008, 5, 207–219. [Google Scholar] [CrossRef]
  25. Saei, A.M.; Mohebby, B.; Abdeh, M.R. Effects of oleothermal treatment and polydimethylsiloxane (PDMS) coating on natural weathering of beech and fir woods. Maderas. Cienc. Tecnol. 2015, 17, 905–918. [Google Scholar] [CrossRef] [Green Version]
  26. Forest Products Laboratory. Wood Handbook-Wood as an Engineering Material; General Technical Report; Department of Agriculture, Forest Service, Forest Products Laboratory: Madison, WI, USA, 2010; p. 508.
  27. Penn, A. Wanova. MATLAB Central File Exchange. 2021. Available online: https://www.mathworks.com/matlabcentral/fileexchange/61661-wanova (accessed on 27 February 2021).
  28. Trujillo-Ortiz, A. GHtest. MATLAB Central File Exchange. 2021. Available online: https://www.mathworks.com/matlabcentral/fileexchange/3676-ghtest (accessed on 27 February 2021).
  29. Sivrikaya, H.; Hafizoglu, H.; Yasav, A.; Aydemir, D. Natural weathering of oak (Quercus petrae) and chestnut (Castanea sativa) coated with various finishes. Color Res. Appl. 2011, 36, 72–78. [Google Scholar] [CrossRef]
  30. Wood Information Guide V3.9; Accoya: London, UK, 2020.
Figure 1. Coated samples exposed to natural weathering at a 45° angle on a test fence near Corvallis, OR.
Coatings 11 00325 g001
Figure 2. Maximum and minimum temperature and monthly rainfall for the Oregon State University Hyslop Farm during the study.
Coatings 11 00325 g002
Figure 3. Games–Howell pairwise mean differences of color change for each coating during the study for Douglas-fir. Superscripts with the same letter indicate means between intervals that are not significantly different at the p < 0.05 level.
Coatings 11 00325 g003
Figure 4. Cluster results plotted on the ΔL* and Δb* axes. The cluster solution utilizes linkage distances calculated with MANOVA using 18-month ΔL*, Δa*, and Δb* values for Douglas-fir.
Coatings 11 00325 g004
Figure 5. Example of the same Douglas-fir specimen treated with Penofin Verde and exposed outdoors on a test fence near Corvallis, OR for 0, 6, 12, and 18 months (left to right).
Coatings 11 00325 g005
Figure 6. Example of the same Douglas-fir specimen treated with Sansin 2 and exposed outdoors on a test fence near Corvallis, OR for 0, 6, 12, and 18 months (left to right).
Coatings 11 00325 g006
Figure 7. Games–Howell pairwise mean differences of color change for acetylated wood for each coating during the study. Superscripts indicate means between intervals that are not significantly different at the p < 0.05 level.
Coatings 11 00325 g007
Figure 8. Cluster results plotted on the ΔL* and Δb* axes. The cluster solution utilizes linkage distances calculated with MANOVA using 18-month ΔL*, Δa*, and Δb* values for acetylated wood.
Coatings 11 00325 g008
Figure 9. Examples of the same sample of acetylated wood treated with Penofin Verde and exposed for 0, 6, 12, and 18 months near Corvallis, OR (left to right).
Coatings 11 00325 g009
Figure 10. Examples of the same sample of acetylated wood treated with Sansin 3 and exposed for 0, 6, 12, and 18 months near Corvallis, OR (left to right).
Coatings 11 00325 g010
Figure 11. Games–Howell pairwise mean differences of color change for red alder wood for each coating during the study. Superscripts indicate means between intervals that are not significantly different at the p < 0.05 level.
Coatings 11 00325 g011
Figure 12. Cluster results according to linkage distance calculated with MANOVA using 18-month ΔL*, Δa*, and Δb* values for red alder wood.
Coatings 11 00325 g012
Figure 13. Example of the same red alder sample treated with Penofin Verde and exposed outdoors on a test fence near Corvallis, OR for 0, 6, 12, and 18 months (left to right).
Coatings 11 00325 g013
Figure 14. Example of the same red alder sample treated with Valhalla and exposed outdoors on a test fence near Corvallis, OR for 0, 6, 12, and 18 months (left to right).
Coatings 11 00325 g014
Figure 15. Games–Howell pairwise mean differences of color change for western redcedar wood for each coating during the study. Superscripts with the same letter indicate means between intervals that are not significantly different at the p < 0.05 level.
Coatings 11 00325 g015
Figure 16. Cluster results according to linkage distance calculated with MANOVA using 18-month ΔL*, Δa*, and Δb* values for western redcedar wood.
Coatings 11 00325 g016
Figure 17. Example of the same western redcedar sample treated with Penofin Verde and exposed on a test fence near Corvallis, OR for 0, 6, 12, and 18 months (left to right).
Coatings 11 00325 g017
Figure 18. Example of the same western redcedar sample treated with Sansin 2 and exposed on a test fence near Corvallis, OR for 0, 6, 12, and 18 months (left to right).
Coatings 11 00325 g018
Figure 19. Games–Howell pairwise mean differences of color change for ponderosa pine wood for each coating during the study. Superscripts with the same letter indicate means between intervals that are not significantly different at the p < 0.05 level.
Coatings 11 00325 g019
Figure 20. Cluster results according to linkage distances calculated with MANOVA using 18-month ΔL*, Δa*, and Δb* values.
Coatings 11 00325 g020
Figure 21. Example of the same ponderosa pine sample treated with Penofin Verde and exposed on a test fence near Corvallis, OR for 0, 6, 12, and 18 months (left to right).
Coatings 11 00325 g021
Figure 22. Example of the same ponderosa pine sample treated with Sansin 2 and exposed on a test fence near Corvallis, OR for 0, 6, 12, and 18 months.
Coatings 11 00325 g022
Table 1. Coatings that were evaluated for their ability to protect four untreated wood species and acetylated radiata pine in an above-ground field trial.
CompanyCoating CodeCommercial Name
Valhalla Wood Preserv. Ltd.
4586 Highway 6
New Denver, BC V0G 1S1, Canada
VValhalla Wood Preservative Lifetime Wood Treatment
Modern Masters Inc.
9380 San Fernando Rd.,
Sun Valley CA 91352, USA
MMModern Masters Exterior Dead Flat Varnish
OLD MASTERS
P.O. Box 286
Orange City, IA 51041, USA
OMOld Masters Spar Urethane
Rubio Monocoat USA
22111 State Hwy 71W, Ste 301
Spicewood, TX 78669, USA
RMRubio Monocoat Exterior Wood Oil
Timber Pro Coatings Ltd.
12051 Horseshoe Way #140
Richmond BC V7A 4V4, Canada
TPTimber Pro UV Log and Siding Formula (clear)
Performance Coatings Inc.
P.O. Box 1569
Ukiah, CA 95482, USA
PVPenofin Verde
Heritage Natural Finishes
P.O. Box 97
Philomath, OR 97370, USA
HNHeritage Natural Exterior Finish
Forrest echnical Coatings
1011 McKinley Street
Eugene, OR 97402, USA
FLFForrest Log Exterior Finisher (22D800)
FLAMEPROOF HQ
1200 South Lake Street,
Montgomery, IL 60538, USA
FXLFX Lumber Guard XT
The Sansin Corporation
111 MacNab Avenue
Strathroy, ON N7G 4J6, Canada
S1Multicoat:
1-P8475
2-P8476
3-P8476
The Sansin Corporation
111 MacNab Avenue
Strathroy, ON N7G 4J6, Canada
S2Multicoat:
1-P8477
2-P8478
3-P8478
The Sansin Corporation
111 MacNab Avenue
Strathroy, ON N7G 4J6, Canada
S3Multicoat:
1-P8479
2-P8479
Table 2. Games–Howell pairwise mean differences of color change within coatings at 18 months of the study. Letters in superscripts indicate means between treatment groups (species) that are not significantly different at the p < 0.05 level. The highest and lowest values for each species are shown in bold.
Coating CodeSpecies
Douglas-FirAcetylated WoodRed AlderWestern RedcedarPonderosa Pine
V19.4 a17.7 ab13.1a14.7 ab17.6 b
MM24.5 b12.3 a21.2 b24.5 b32.6 c
OM23.3 b8.8 a29.6 b27.6 b24.2 b
RM23.1 a21.8 a29.5 a22.7 a39.1 b
TP31.7 b21.5 a33.0 b31.8 b33.3 b
PV45.6 a47.5 a46.9 a48.4 a49.2 a
HN28.6 ab29.3 ab31.8 b27.3 a27.1 a
FLF20.0 a19.0 a19.2 a20.7 a24.2 a
FXL19.7 a20.8 a17.4 a19.9 a18.5 a
S128.0 b13.6 a18.4 a17.7 a20.3 ab
S28.1 a19.8 c15.1 b9.4 a11.4 ab
S318.2 b6.7 a26.9 c21.4 bc18.0 b
Superscript letters indicate numeric order of means (i.e., “a” indicates the lowest mean, “b”, moderate means, and “c” the highest means).
Table 3. Games–Howell pairwise mean differences of color change for Douglas-fir for each interval of the study. Letters in superscripts indicate means between treatment groups that are not significantly different at the p < 0.05 level.
Code6 Months12 Months18 Months
V10.2 abc16.7 c19.4 b
MM11.4 abcd16.4 bc24.5 bc
OM27.9 df15.1 c23.3 bc
RM18.4 de10.0 b23.1 bc
TP18.7 de15.6 bc31.7 c
PV22.3 def33.9 d45.6 d
HN16.0 b cde21.6 c28.6 c
FLF16.1 b de16.1 c20.0 b
FXL11.6 abcd18.1 c19.7 b
S110.1 ab16.8 bc28.1 c
S218.2 de6.6 a8.2 a
S36.4 a15.2 c18.2 b
Superscript letters indicate numeric order of means (i.e., “a” indicates the lowest mean, “b”, larger means, “c”, larger still means, and so on).
Table 4. Games–Howell pairwise mean differences of color change for acetylated wood during each interval of the study. Letters in superscripts indicate means between treatment groups that are not significantly different at the p < 0.05 level.
Code6 Months12 Months18 Months
V13.7 abcd12.2 a17.7 bcd
MM11.7 a7.2 a12.3 bc
OM13.5 abc10.7 a8.8 ab
RM19.8 abcdef16.4 ab21.8 cd
TP13.5 ab16.6 b21.5 d
PV24.2 abcdefgh32.7 b47.5 e
HN21.6 abcdefg25.6 ab29.3 de
FLF35.1 gh18.0 b19.1 d
FXL14.4 abcde21.4 b20.8 d
S124.5 bfgh17.3 b13.6 bc
S223.0 bdfg18.6 b19.8 d
S39.7 a6.1 a6.7 a
Superscript letters indicate numeric order of means (i.e., “a” indicates the lowest mean, “b”, larger means, “c”, larger still means, and so on).
Table 5. Games–Howell pairwise mean differences of color change for red alder wood during each interval of the study. Letters in superscripts indicate the treatment groups with means that are not significantly different at the p < 0.05 level.
Code6 Months12 Months18 Months
V7.6 a16.8 ab13.1 a
MM13.9 abc24.2 bc21.2 bcd
OM15.7 bc16.2 ab29.6 de
RM17.4 bcd17.4 ab29.5 e
TP11.2 a28.3 c33.1 e
PV28.6 de41.2 d46.9 f
HN16.6 bc27.3 c31.8 e
FLF25.3 de17.7 ab19.2 c
FXL17.3 abcd22.5 c17.5 abc
S121.1 cde14.5 a18.4 bc
S222.6 de15.8 ab15.1 ab
S311.6 ab11.8 a27.0 cde
Superscript letters indicate numeric order of means (i.e., “a” indicates the lowest mean, “b”, larger means, “c”, larger still means, and so on).
Table 6. Games–Howell pairwise mean differences of color change for western redcedar wood during each interval of the study. Letters in superscripts indicate the treatment groups with means that are not significantly different at the p < 0.05 level.
Code6 Months12 Months18 Months
V6.0 a10.6 ab14.7 ab
MM13.4 ab21.8 b24.5 cdefg
OM18.6 bc23.0 abc27.6 cdefg
RM14.6 b15.4 b22.7 bcdef
TP10.8 a25.5 bc31.8 dfg
PV19.2 abc30.6 b48.4 g
HN15.0 b22.5 bc27.3 defg
FLF24.0 c18.9 ab20.7 bcd
FXL12.4 a19.0 b19.9 bc
S121.2 bc13.2 ab17.8 bc
S216.4 b8.5 a9.4 a
S37.8 a17.5 ab21.4 bcde
Superscript letters indicate numeric order of means (i.e., “a” indicates the lowest mean, “b”, larger means, “c”, larger still means, and so on).
Table 7. Games–Howell pairwise mean differences of color change for Douglas-fir for each interval of the study. Letters in superscripts indicate which means between treatment groups that are not significantly different at the p < 0.05 level.
Code6 Months12 Months18 Months
V9.7 ab18.1 c17.6 b
MM9.2 ab27.1 cd32.7 d
OM8.8 ab16.3 bc24.2 bc
RM21.8 cd33.7 d39.1 de
TP21.5 d21.4 c33.3 cd
PV47.5 e41.6 d49.3 e
HN29.3 de20.2 c27.1 c
FLF19.1 d17.5 bc24.2 bc
FXL20.8 d20.5 c18.5 b
S115.6 bc17.1 abc20.3 abc
S219.8 d4.9 a11.4 a
S36.8 a10.5 b18.0 ab
Superscript letters indicate numeric order of means (i.e., “a” indicates the lowest mean, “b”, larger means, “c”, larger still means, and so on).
Publisher’s Note: MDPI stays neutral with regard to jurisdictional claims in published maps and institutional affiliations.

