Article

In-Situ Investigation of the Oxidation Behaviour of Chemical Vapour Deposited Zr(C,N) Hard Coatings Using Synchrotron X-ray Diffraction

1
Christian Doppler Laboratory for Advanced Coated Cutting Tools at the Department of Materials Science, Montanuniversität Leoben, Franz–Josef–Strasse 18, 8700 Leoben, Austria
2
Department of Materials Science, Montanuniversität Leoben, Franz–Josef–Strasse 18, 8700 Leoben, Austria
3
Institute of Materials Research, Helmholtz–Zentrum Geesthacht, Max–Planck–Strasse 1, 21502 Geesthacht, Germany
4
Materials Center Leoben Forschung GmbH, Roseggerstrasse 12, 8700 Leoben, Austria
5
Ceratizit Austria GmbH, Metallwerk–Plansee–Strasse 71, 6600 Reutte, Austria
*
Author to whom correspondence should be addressed.
Coatings 2021, 11(3), 264; https://doi.org/10.3390/coatings11030264
Submission received: 11 January 2021 / Revised: 15 February 2021 / Accepted: 20 February 2021 / Published: 24 February 2021
(This article belongs to the Special Issue Chemical Vapor Deposition (CVD) Coatings)

Abstract

:
The oxidation behaviour of chemical vapour deposited ZrN, ZrC and ZrCN coatings was investigated using in-situ synchrotron X-ray diffraction (XRD). To obtain a precise analysis of the temperature–dependent phase evolution during oxidation, coating powders were annealed in air between 100 °C and 1000 °C. Simultaneously, 2D XRD patterns were recorded in ~2 °C increments, which were subsequently evaluated using parametric Rietveld refinement. The results were correlated with differential scanning calorimetry and thermogravimetric analysis measurements, to further illuminate the oxidation mechanism of each coating system. ZrCN exhibited the highest oxidation onset temperature, followed by ZrC and ZrN. Furthermore, ZrCN was completely oxidised at a temperature of ~720 °C, which was ~50–70 °C higher than for ZrN and ZrC. The in-situ experiments revealed a similar oxidation sequence for all three samples: first, tetragonal and/or cubic (c/t)–ZrO2 is formed, which subsequently transforms into the more stable monoclinic (m)–ZrO2 phase. ZrCN and ZrC showed a higher c/t–ZrO2 fraction than the ZrN sample at 1000 °C. Furthermore, ex-situ Raman and XRD investigations of the oxidised samples revealed the ongoing c/t–ZrO2 → m–ZrO2 phase transformation during cooling.

1. Introduction

Chemical vapour deposited (CVD) protective hard coatings are used in industrial turning and milling applications to improve the performance of cemented carbide cutting tools under extreme conditions. While CVD Ti(C,N) coatings have been intensively investigated and are widely applied [1,2,3,4,5], recent findings indicate advantageous mechanical properties of the CVD Zr(C,N) coating system [6,7,8]. Garcia et al. [6] and El Azhari et al. [7] reported an improved performance of Zr(C,N) under cyclic thermo–mechanical loads due to the better cohesive strength and intrinsic plasticity compared to Ti(C,N).
In addition to good mechanical properties, the oxidation resistance of hard coatings is crucial during machining applications. The oxidation stability of the Zr(C,N) system has been investigated by several authors [9,10,11,12,13,14,15,16,17]. Harrison and Lee [9] reported on the oxidation behaviour of commercially available ZrN powder (Sigma Aldrich, Gillingham, UK), investigated in-situ between room temperature and 750 °C using a laboratory X-ray diffractometer (XRD). They observed the initial formation of substoichiometric ZrN1−x and ZrOxN1−x at 400 °C, as well as the monoclinic ZrO2 (m–ZrO2) phase at 500 °C. Furthermore, sintered bulk ZrN was investigated ex-situ and a decreasing oxidation rate due to the formation of a dense cubic ZrO2 (c–ZrO2) layer above 900 °C was observed. Small amounts of c–ZrO2 and mainly m–ZrO2 were also detected by Krusin–Elbaum and Wittmer in oxidised ZrN thin films, although already at lower temperatures of 475–650 °C compared to 900 °C for bulk materials [12]. Qi et al. [10] investigated the time dependent phase evolution of sputtered ZrN coatings at 650 °C with in-situ XRD and ex-situ TEM. After the initial formation of a tetragonal ZrO2 (t–ZrO2) layer on the coatings surface which proceeded to grow inwards, a martensitic phase transformation from t–ZrO2 to m–ZrO2 in the near surface region was observed. The occurrence of t–ZrO2 was not expected at a temperature of 650 °C, as it is known to be less stable than m–ZrO2 at temperatures below 1170 °C [18]. However, the authors attributed the formation of the t–ZrO2 phase to the smaller activation energy needed for the phase transformation face centered cubic (fcc)–ZrN → t–ZrO2 compared to ZrN → m–ZrO2. The martensitic transformation from t–ZrO2 to m–ZrO2 is accompanied by a volume expansion of ~5 vol.%, which leads to the formation of cracks and pores in the m–ZrO2 layer of the oxide scale, which provide oxygen diffusion paths, further decreasing the oxidation resistance of the ZrN coating.
The oxidation behaviour of ZrC has been investigated in several studies on powder samples [13,14,15,19,20], as well as bulk materials [16,17,21,22,23,24,25,26] and CVD coatings [15]. The oxidation mechanism of this system is generally described by the initial formation of a ZrCxOy phase, followed by the occurrence of amorphous or nanocrystalline ZrO2 [13,14,15,16,25,26,27]. This ZrO2 phase acts as an oxygen diffusion barrier and retards the oxidation process, leading to the precipitation of free carbon. With increasing temperature, ZrO2 crystallises to c–ZrO2 or t–ZrO2; it should be noted that the differentiation between t–ZrO2 and c–ZrO2 is not possible using XRD, as the reflections appear at very similar diffraction angles [26,28]. Analogously to t–ZrO2, c–ZrO2 is unstable at lower temperatures (<1170 °C), however, both phases can be stabilised by the substitution of O2− with C3− ions, creating oxygen ion vacancies [17,29]. As the temperature increases, CO2 starts to form and consequently the C content decreases, leading to the c/t–ZrO2 → m–ZrO2 phase transformation [14,17].
In comparison to ZrN and ZrC, where several studies on the oxidation resistance are available, literature on the oxidation behaviour of ZrCN as well as on the detailed oxidation mechanism of all three coating systems, deposited by CVD, is limited. Since the oxidation kinetics depend on the experimental conditions (e.g., oxygen partial pressure during oxidation), a comparison between these three systems based on previous reports is difficult. Thus, the goals of this study were on the one hand to provide a detailed investigation of the oxidation behaviour and phase evolution of CVD ZrCN and, on the other hand, to compare ZrCN to the more thoroughly investigated ZrN and ZrC by maintaining identical experimental conditions for the oxidation experiments. In order to establish a comprehensive understanding of the oxidation mechanism of CVD Zr(C,N) coatings, in-situ synchrotron X-ray powder diffraction experiments were conducted in ambient air. Subsequent parametric Rietveld refinement of the synchrotron data gave detailed insight into the temperature–dependent phase evolution. Complementary differential scanning calorimetry (DSC) and thermogravimetric analysis (TGA) were correlated with the results of the synchrotron experiments and provided additional insight in the oxidation behaviour. In order to investigate the phase change after the oxidation at 1000 °C, ex-situ Raman and XRD measurements were conducted.

2. Materials and Methods

2.1. Coating Deposition

The ZrN, ZrCN and ZrC coatings investigated in this work were deposited in an industrial scale hot–wall CVD reactor of the SCT600T type (Sucotec, Langenthal, Switzerland). A solid Zr precursor was chlorinated beforehand, using a mixture of HCl and H2. Subsequently, the resulting ZrCl4 precursor was brought to reaction with H2 and N2 in the deposition chamber to synthesise ZrN. In order to deposit ZrCN or ZrC, the N2 precursor was replaced by CH3CN or CH4, respectively. All coatings were deposited at a temperature of 1000 °C, a base pressure of 10 kPa (ZrCN) and 16 kPa (ZrN and ZrC), and a constant deposition time of 260 min. To hinder interdiffusion between substrate and coating, a TiN base layer was grown on the substrate prior to the respective Zr(C,N) layers. The precursors used for the base layer were TiCl4, N2 and H2 and the deposition temperature 1000 °C with a base pressure of 16 kPa. Cemented carbide with a composition of 92 wt.% WC, 6 wt.% Co and 2 wt.% mixed carbides, as well as mild steel foils were used as substrate materials. The mild steel foils were subsequently dissolved in diluted nitric acid and a powder of the coatings was produced.

2.2. Coating Characterisation

The microstructure of the solid coatings on cemented carbide was analysed at room temperature utilizing a D8 Advance X-ray diffractometer (Bruker, Billerica, MA, USA) in grazing incidence geometry. A Göbel mirror was used to collimate the Cu Kα (λ = 1.5418 Å) radiation, which was directed at a 2° incidence angle at the sample. A secondary equatorial Soller collimator with a 0.12° acceptance angle was mounted in front of an energy dispersive Sol–X detector. Diffractograms were recorded with a step size of 0.02° and a counting time of 1.2 s per step. The in-situ synchrotron powder XRD investigations were carried out at the high energy materials science beamline P07 at PETRA III in Hamburg, Germany [30]. A schematic of the experimental setup is shown in Figure 1. The powdered Zr(C,N) coatings were placed in a heatable Pt crucible and heated in air with a heating rate of 10 K/min starting from 100 °C up to 1000 °C, utilizing inductive heating coils. Further details on the experiment can be found in ref. [31]. 2D X-ray diffractograms were recorded every ~2 °C at an exposure time of ~5 s in Debye–Scherrer geometry with a XRD 1621 flat–panel detector (Perkin Elmer, Waltham, MA, USA), resulting in ~600 frames per sample. The energy of the X-ray beam was 103.6 keV, which corresponds to a wavelength of 0.11965 Å.
DSC measurements were conducted in synthetic air using a Setsys Evo 2400 DSC (Setaram, Caluire, France). For the measurements ~20 mg of the powdered samples were filled into Al2O3 crucibles and heated with a heating rate of 10 K/min to 1000 °C. Raman spectroscopy measurements were performed in a LabRAM 300 spectrometer (Horiba Jobin Yvon, Edison, NJ, USA) using 532 nm laser excitation. The powder samples were placed on a glass slide and analysed with a 100× long working distance objective with numerical aperture (NA) = 0.8 (Olympus, Tokyo, Japan). Raman spectra were collected in backscattering geometry using a through–focus configuration and dispersed by a 1800 gr/mm grating.

2.3. Synchrotron Data Evaluation—Parametric Rietveld Refinement

Further processing of the 2D diffraction data was conducted with a custom–made Python script, whereby the Debye–Scherrer rings of each individual frame were azimuthally integrated to obtain a respective 1D diffractogram, resulting in a temperature dependent set of diffraction data for each sample. The subsequent quantitative Rietveld refinement [32] was carried out using the software TOPAS 6, supplied by Bruker. In order to determine the instrumental contributions in the diffractograms, the diffraction pattern of a standard LaB6 powder sample (NIST 660c [33]) was recorded and fitted using the Rietveld method. The so determined instrument function was used for the refinement of the diffraction data sets. A parametric Rietveld refinement approach (as described in ref. [34]) was applied to determine the quantitative phase evolution during oxidation of the Zr(C,N) samples. This approach was chosen since it can reduce the uncertainties of the output quantities (e.g., phase fractions) and helps to avoid false minima during the refinement of large sets of data including sporadic measurement artefacts. Furthermore, this method allows to provide a physical meaningful model to describe the evolution of cell–parameters with temperature, reducing the number of possible solutions, which can also decrease the uncertainty of the results [35]. Hereby, the model is applied to quantities of minor interest in order to gain more precise information about other quantities of interest. Within this oxidation study, a second–order polynomial function of the form:
a ( T ) = a 0 ( 1 + λ 1 T + λ 2 T 2 )
where a 0 is the lattice parameter at room temperature and λ 1 , 2 are fit parameters, was used to describe the evolution of the lattice parameters a (quantities of minor interest) of each individual phase at the temperature T . This polynomial model guarantees smooth variations of the cell volume and the phase fractions (quantities of interest). Within this parametric refinement routine, all patterns are fitted simultaneously. A change of χ 2 of less than 0.001 between successive iteration steps was chosen as criterion of convergence and the quality of the refinement was assessed with the difference curve between the experimental and fitted pattern. The emerging phases were modelled using crystallographic information files (cif), which were obtained from the Crystallography Open Database (COD) [36]. The applied non–oxide phases were ZrN [37], ZrCN [38], ZrC [39] and TiN [40]; the oxide phases were c–ZrO2 [41], t–ZrO2 [42], m–ZrO2 [43] and rutile TiO2 (r–TiO2) [44].

3. Results and Discussion

3.1. As-Deposited Microstructure

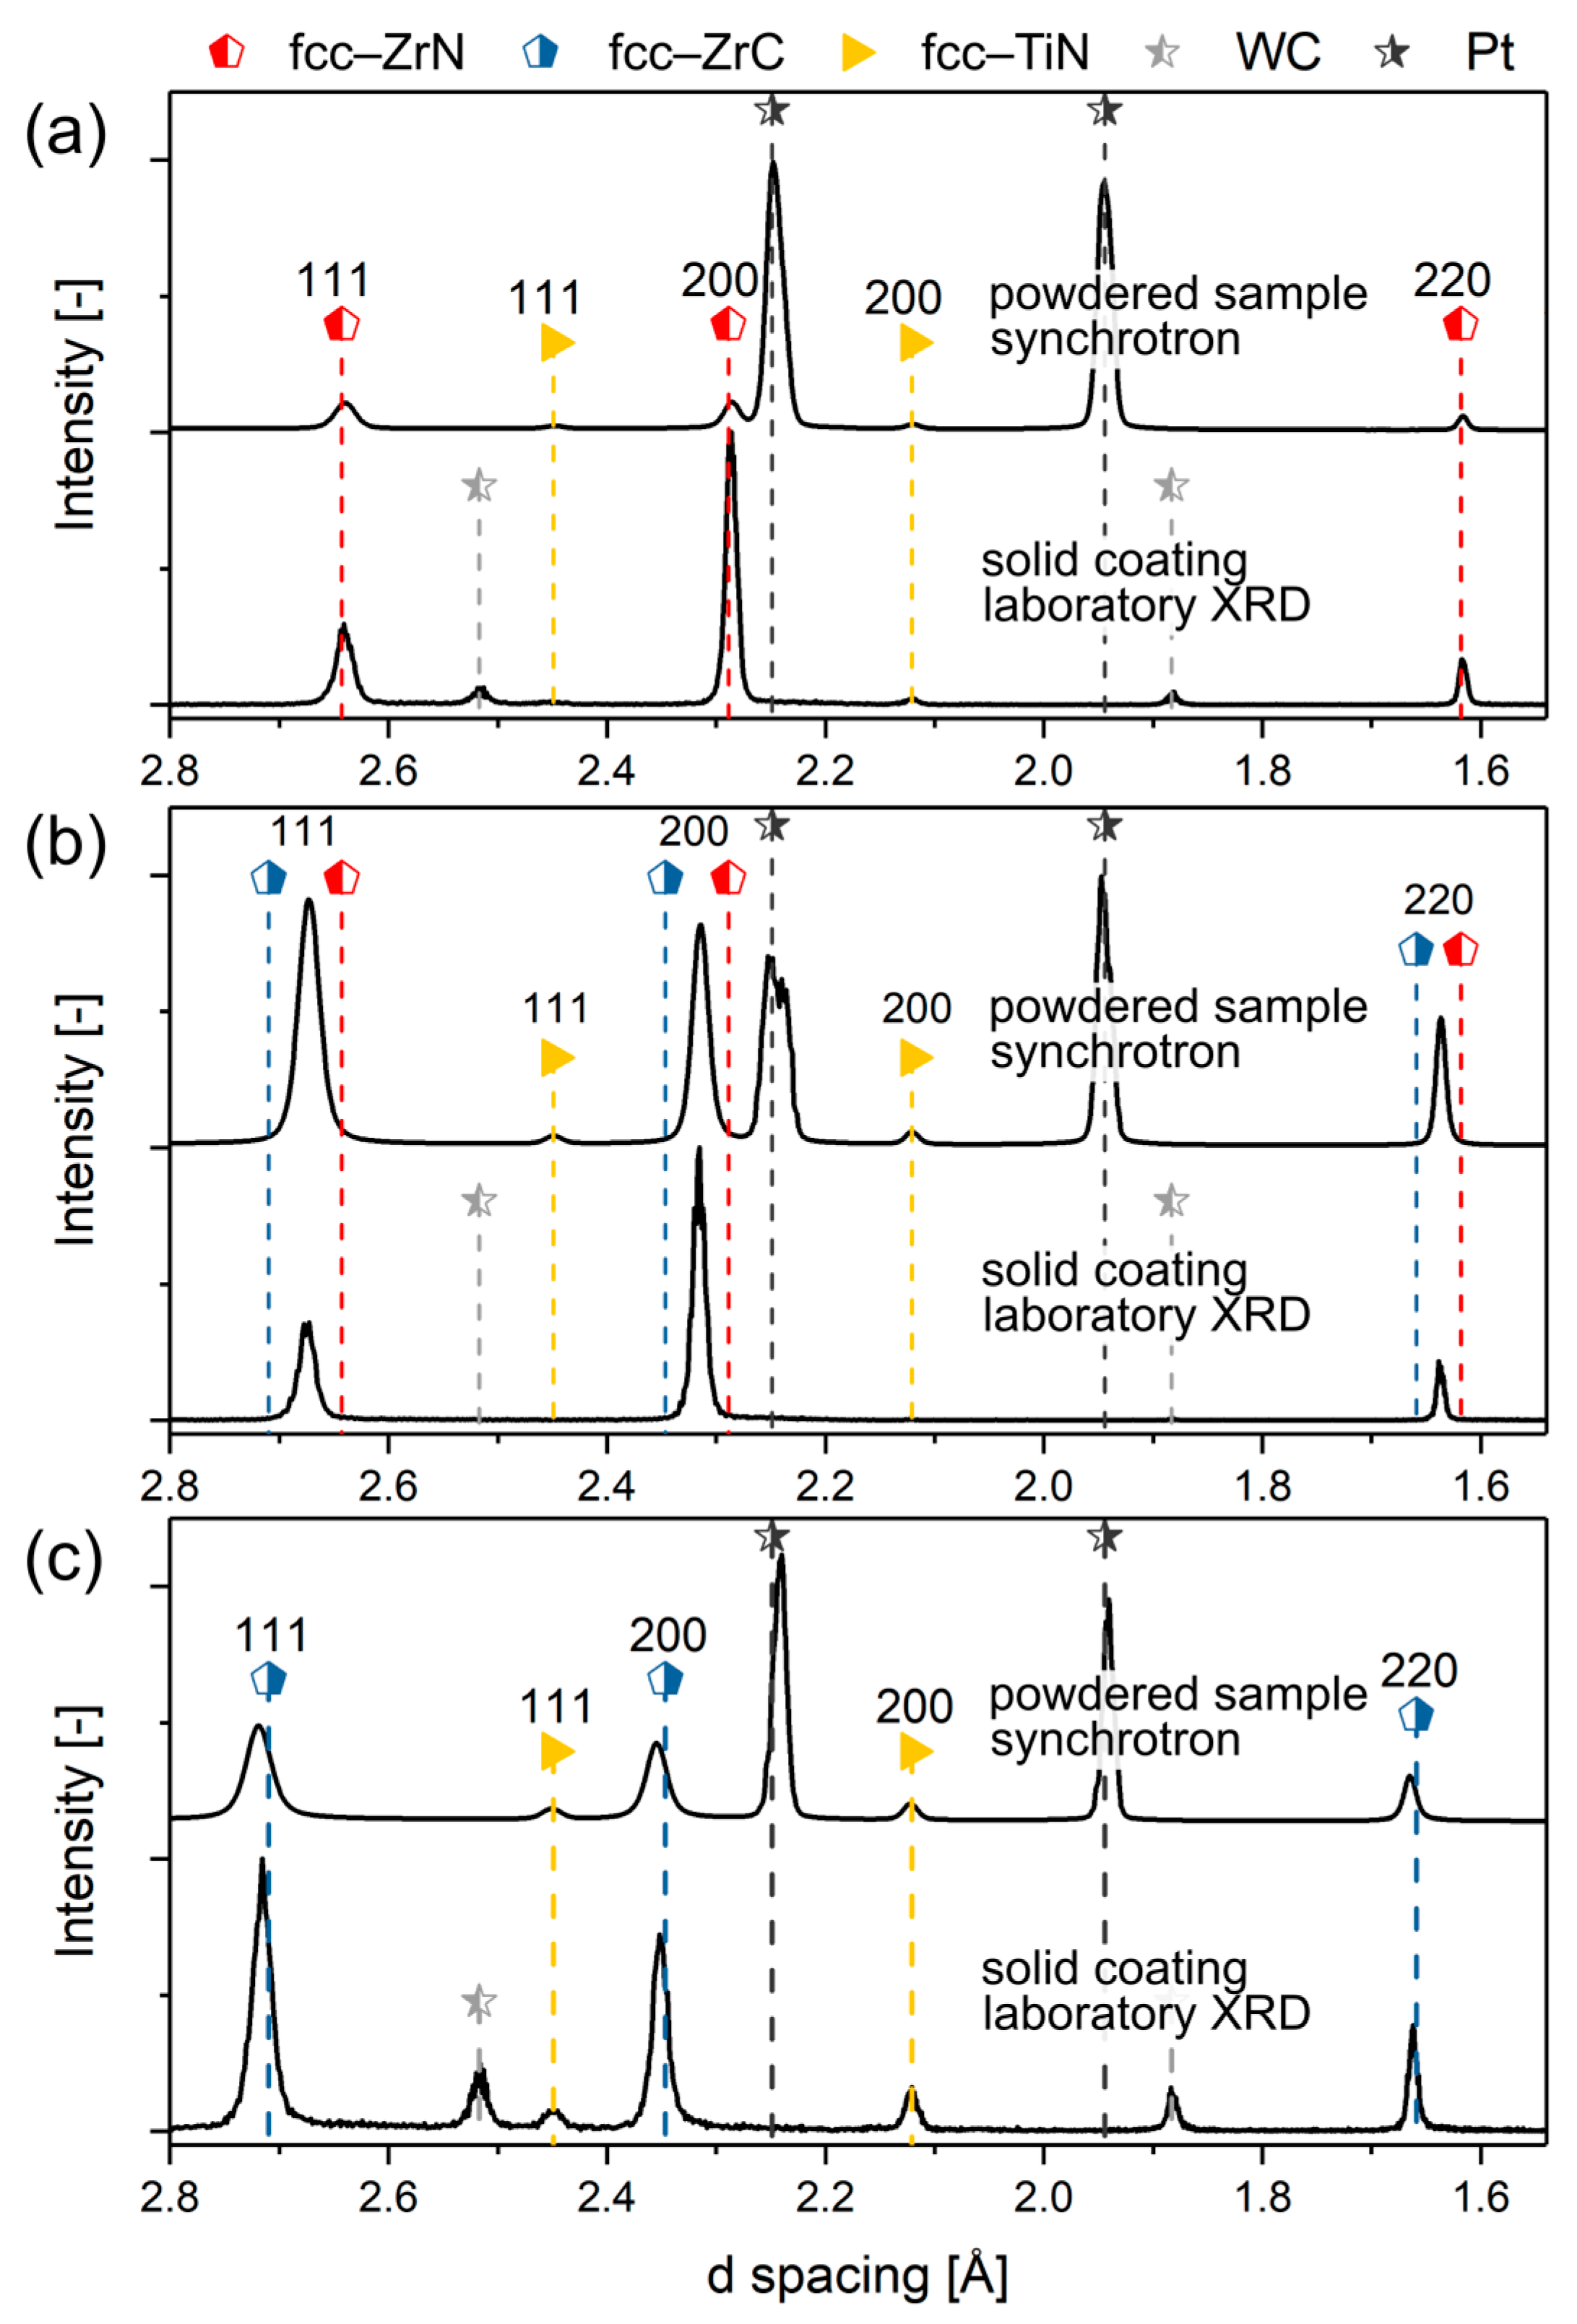
To validate that no significant changes in the phase composition occur during the powder preparation process, X-ray diffractograms of the as–deposited coatings on cemented carbide substrate were recorded on a laboratory XRD and compared to diffractograms of the powdered coatings, measured at the synchrotron radiation facility (see Figure 2). Both patterns were acquired at room temperature. Since the energies of the used X-ray sources were different, the diffractograms are plotted as a function of the d–spacing, enabling a straight forward comparison of the data. The standard peak positions of fcc–ZrN (PDF 00-035-0753 [45]), fcc–ZrC (PDF 00-035-0784 [45]) and fcc–TiN (PDF 00-038-1420 [45]) are indicated as dashed lines and their individual hkl–indices are labelled. Peaks arising from the cemented carbide substrate (WC, solid coatings) and the Pt crucible (Pt, powdered coatings) are also marked. It can be seen that the positions of the diffraction peaks, arising from the face centered cubic (fcc) phases for the ZrN (Figure 2a), ZrCN (Figure 2b) and ZrC (Figure 2c) layer, as well as the TiN base layers, are comparable for the solid coating and the powder, indicating that no significant changes in chemistry occur during the powdering process. Rietveld refinement of the powdered samples revealed stress free lattice parameters of 4.58 ± 0.01 Å and 4.71 ± 0.01 Å for ZrN and ZrC, respectively. These results agree well with the lattice parameters of 4.58 Å and 4.69 Å given by the ICDD cards for stoichiometric ZrN (PDF 00-035-0753 [45]) and ZrC (PDF 00-035-0784 [45]), respectively. ZrCN forms a solid solution and the lattice parameter was determined to be 4.63 ± 0.01 Å, which results in a composition of ZrC0.4N0.6, assuming a Vegard’s like behaviour. A change in the relative peak intensities, arising from different hkl–planes, between solid and powdered coatings is related to a loss of preferred orientation during powdering. This is best observed for the ZrCN solid coating (Figure 2b). The 200 peak shows the highest intensity, whereas in the powdered sample the 111 peak is higher than the 200, as would be expected for an untextured sample.

3.2. In-Situ Monitoring of the Oxidation Behaviour

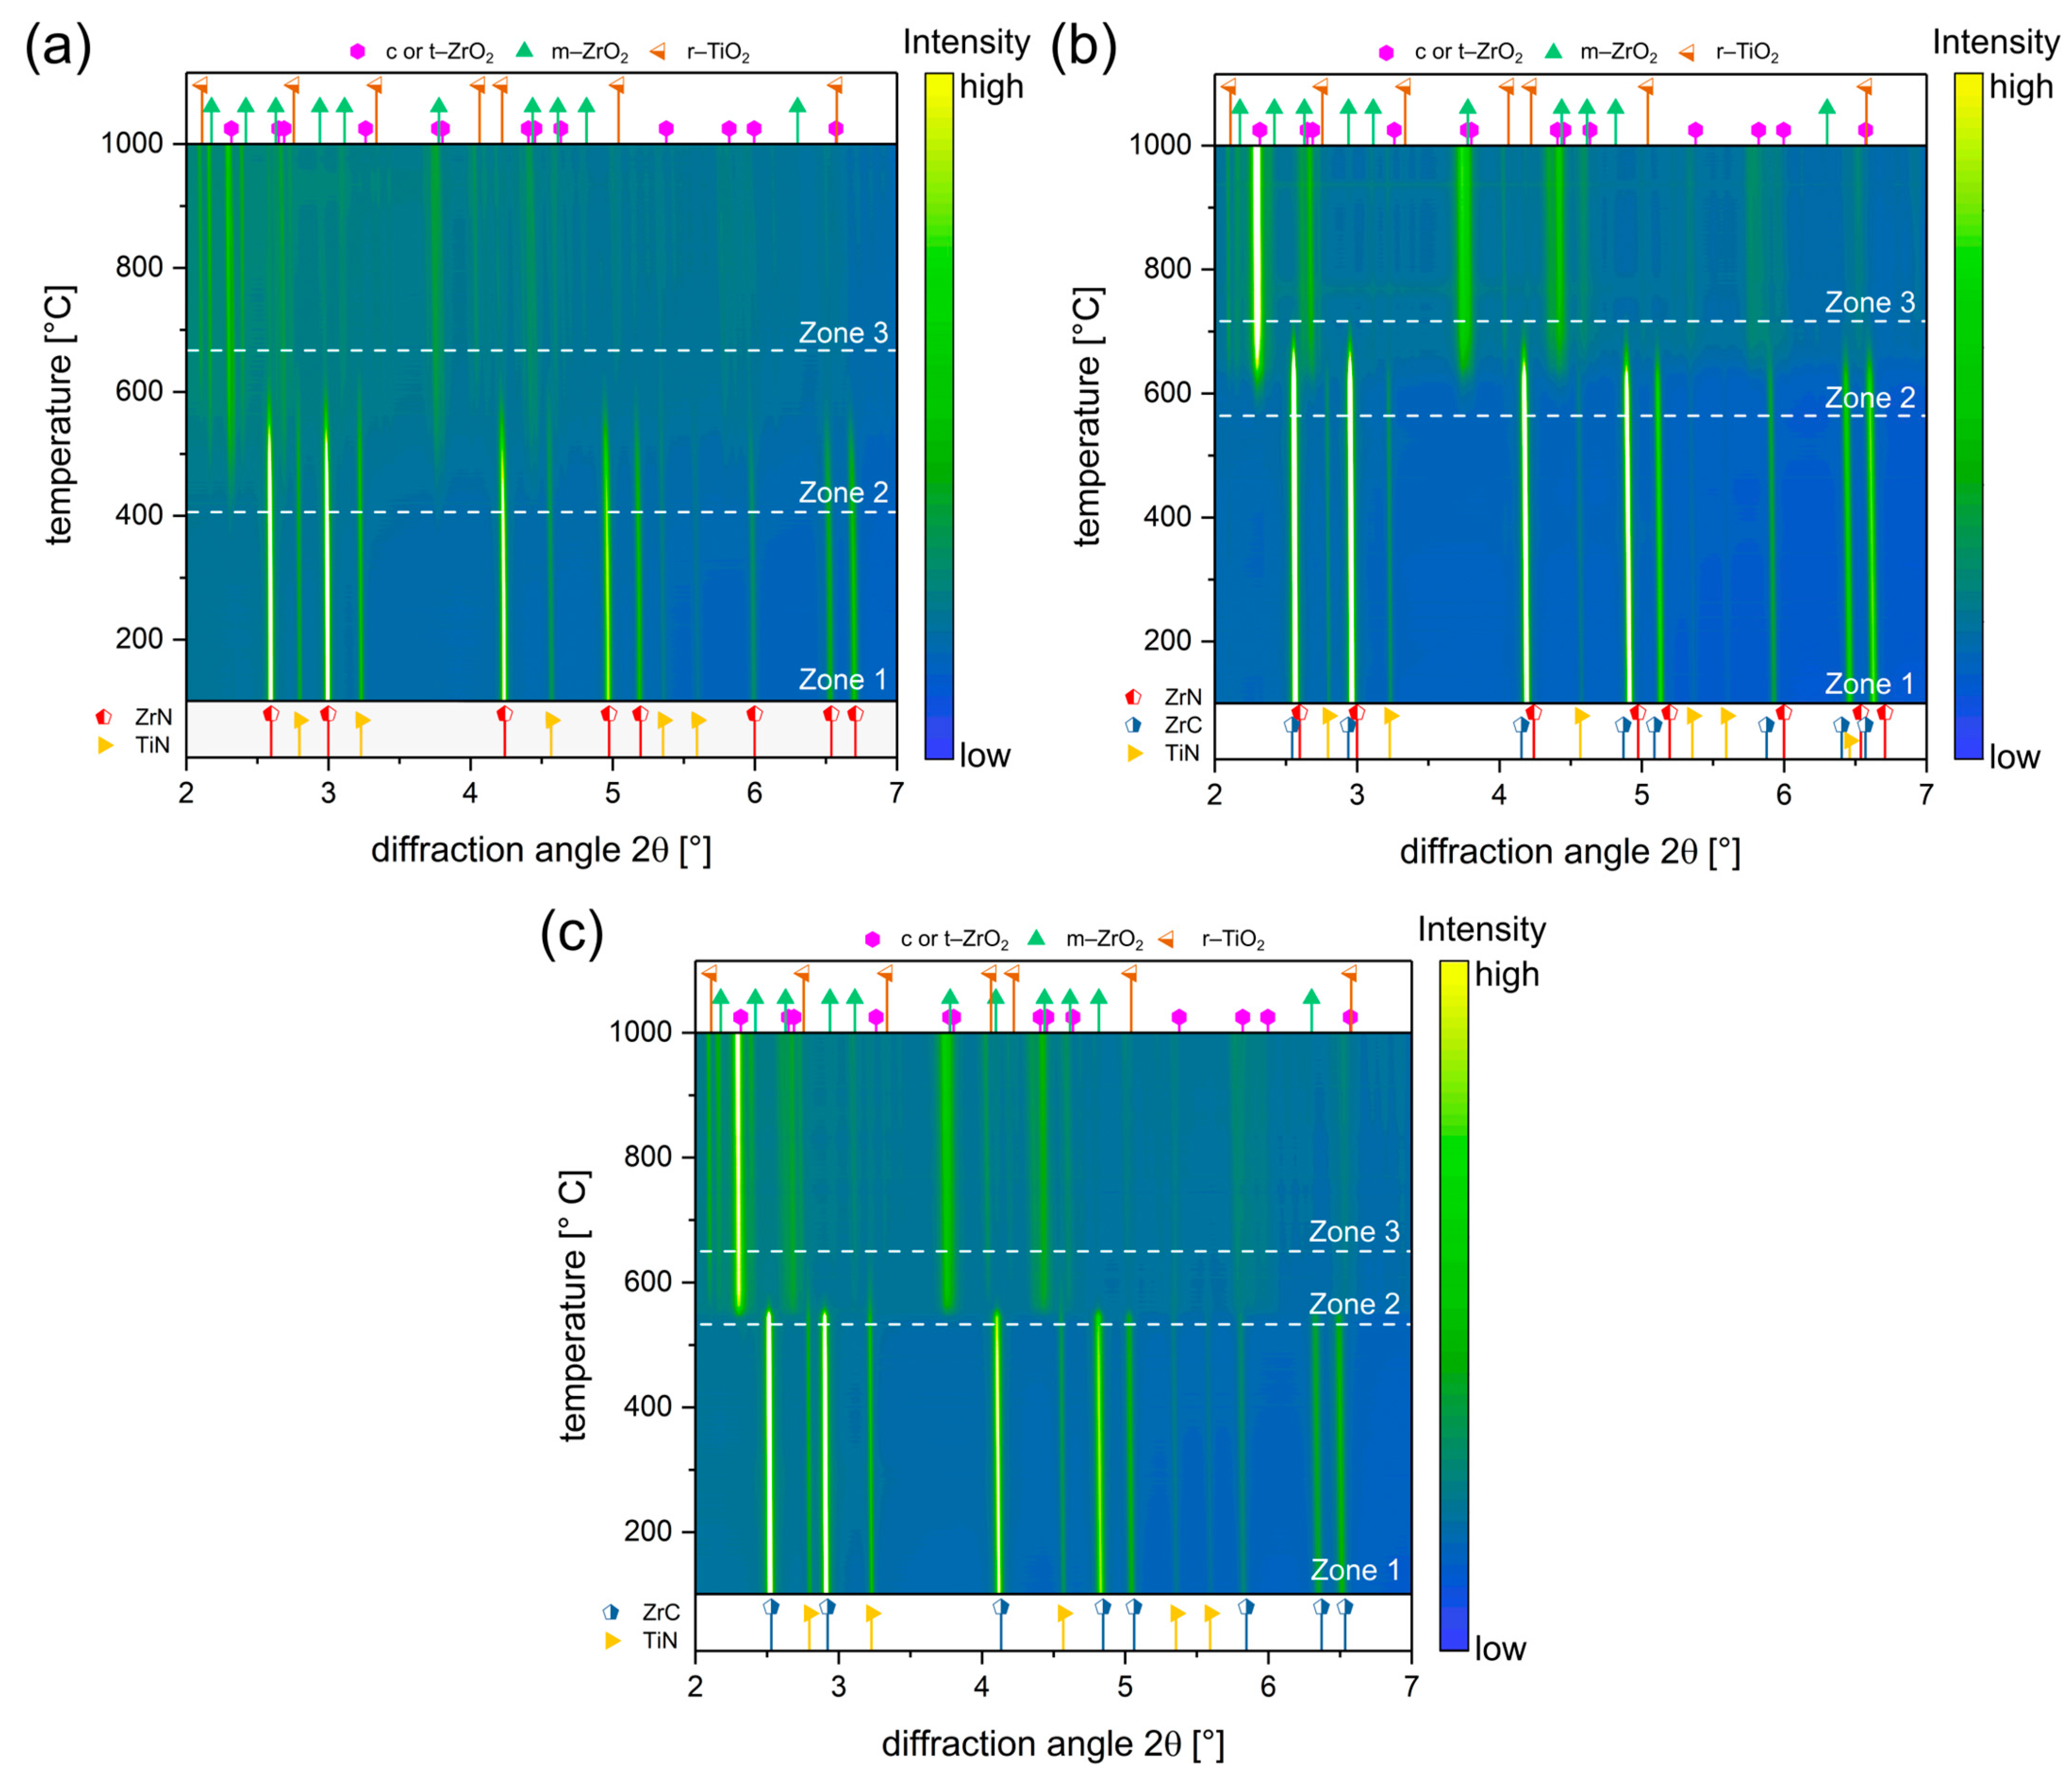
The temperature dependent phase evolution during oxidation is displayed in Figure 3 in 2D contour plots, commonly referred to as phase plots, from 100 °C to 1000 °C for ZrN (Figure 3a), ZrCN (Figure 3b) and ZrC (Figure 3c). Especially for the diffractograms of the powdered ZrN sample at room temperature, it becomes apparent that the peak contributions from the Pt crucible are high compared to the ZrN peaks (see Figure 2a). Thus, the contributions of the Pt crucible were fitted using the Pawley method [46] and subsequently subtracted from the fitted patterns to enhance the visibility of the phase evolution. These modelled fits without the signal from the Pt crucible are displayed in Figure 3. Diffraction peaks arising from the non–oxidised phases (ZrN, ZrCN, ZrC, TiN) are indicated by symbols and dashed lines at the bottom of each phase plot, respectively. Since a clear differentiation between the c–ZrO2 and t–ZrO2 phase is not possible for XRD experiments, the peaks are indicated with one symbol and dashed line at the top of each phase plot, alongside the m–ZrO2 and r–TiO2 phases. In the following, if no separation between the c–ZrO2 and t–ZrO2 can be made, the phase will be referred to as c/t–ZrO2. In all three phase plots a slight shift towards lower diffraction angles can be observed for the ZrN, ZrCN and ZrC phases with increasing temperature, which is related to an increase of the lattice parameter due to thermal expansion. In addition, all three phase plots can be divided into three temperature zones, which are separated by white dashed lines. In Zone 1 of the phase plots, only the fcc–Zr(C,N) phases and the fcc–TiN peaks from the substrate are visible. The oxidation onset marks the beginning of Zone 2, which occurs at ~400 °C for ZrN, followed by ZrC at ~530 °C and ZrCN, which exhibits the highest onset temperature of ~570 °C. For all three samples, the oxidation starts with the emergence of a c/t–ZrO2 phase, followed by the formation of m–ZrO2. Although m–ZrO2 is the stable phase at temperatures below 1170 °C, this phase evolution can be explained by a lower activation energy of Zr(C,N) → c/t–ZrO2 compared to Zr(C,N) → m–ZrO2 [10,18]. The c/t–ZrO2 phase then undergoes a martensitic phase transformation to m–ZrO2, which is accompanied by a volume expansion of ~5% [18,29]. This phase evolution was reported by several authors for the ZrN [10,11,28], as well as for the ZrC system [14,15,21]. However, as it can be seen for all three samples in Figure 3, the c/t–ZrO2 phase prevails in Zone 2 and Zone 3 up to 1000 °C and is not completely transformed to m–ZrO2. This characteristic is attributed to the fact that the c/t–ZrO2 can be stabilised at lower temperatures by a number of different mechanisms, which were discussed in detail by Shukla and Seal [29]. Generally, a decrease of the particle size to the nm range enables the stabilisation of the c/t–ZrO2 phase. For a free–standing single–crystalline particle, the critical size at room temperature above which only m–ZrO2 is formed is in the range of ~10 nm, due to the stabilisation of the c/t–ZrO2 phase by the increased specific surface area at lower particle sizes. However, powdered coatings are more properly represented as an agglomeration of crystallites for which a larger critical grain size of ~33 nm at room temperature is observed [29,47]. This can be explained by two factors. First, in an agglomeration the surface is replaced by an interface with other crystallites which changes the energy state. This energy state is related to the interface free energy and the volume free energy of the crystallite. The contribution of the interfacial free energy increases with decreasing grain size. Due to the fact that the interfacial free energy is lower for the c/t–ZrO2 than the m–ZrO2 phase, the c/t–ZrO2 phase is stabilised below a critical grain size of 33 nm at room temperature [29,47]. Second, hydrostatic stress which can build up in an agglomeration may lead to an increase in the critical grain size. The formation of m–ZrO2 is associated with a volume expansion of ~5%. Thus, already transformed crystallites induce compressive stress in the untransformed c/t–ZrO2 crystallites, consequently stabilizing their crystal structure at larger grain size [29,48]. Additionally, the critical grain size for the c/t–ZrO2 phase stabilisation depends on the temperature. Using eq. 17 from ref. [29], a critical grain size of ~230 nm at 1000 °C can be calculated. A “double–Voigt” approach was applied to estimate the size of coherently diffracting domains, which is assumed to be in the range of the average grain size, of the present c/t–ZrO2 phases for selected patterns in Zone 2 and in Zone 3 (>950 °C). The results were similar for the ZrN, ZrCN and ZrC samples and displayed an average domain size for their corresponding c/t–ZrO2 phases of 8–11 nm in Zone 2 and 16–20 nm in Zone 3. Although these values for the domain size are only rough estimations and should be treated carefully, it can be assumed that the average grain size is sufficiently small (<33 nm) to allow for a c/t–ZrO2 phase stabilisation.
In addition to the ZrO2 phases, also the initial formation of r–TiO2 from the TiN base layer is visible at ~655 °C in the phase plots in Zone 2. This r–TiO2 phase is stable up to 1000 °C. Full oxidation for all samples is obtained at ~650 °C for ZrC, followed by ZrN at ~670 °C and ZrCN at ~720 °C, which is indicated by the dashed line at the beginning of Zone 3. In Figure 3a,b it can be seen that the corresponding TiN phases are not as stable as the ZrN and ZrCN phases, as they vanish at ~650 °C. The TiN phase in Figure 3c also vanishes at ~650 °C, however, the ZrC phase is even less stable and disappears already at ~580 °C. This small temperature range for the oxidation of the ZrC phase of only 50 °C after the initial c/t–ZrO2 formation demonstrates the high rate at which the oxidation of ZrC takes place, in contrast to ZrN, where the oxidation proceeds over a temperature range of ~270 °C. No sudden peak shift of the ZrN, ZrCN and ZrC phases towards higher 2θ angles could be observed with increasing temperature, which would indicate the presence of a substoichiometric ZrNx, ZrCxNy or ZrCx phase due to a possible loss of N or C. The formation of ZrNx, was observed by Harrison and Lee above 400 °C for the oxidation of ZrN powder using in-situ laboratory XRD in static air [9]. Besides the formation of substoichiometric phases, the occurrence of oxynitride (ZrO1−xNx) or oxycarbide (ZrO1−xCx) phases seems plausible and is suggested by some authors, yet, they are rarely experimentally confirmed [9,23]. This circumstance can be explained by their ambiguity with other phases (ZrN, ZrC) or their low present fraction. The occurrence of these phases might be related to a low supply of oxygen, given by the experimental conditions [9,13,14,16,17,25,26,49,50]. For the synchrotron measurements in this work a sufficiently high supply of oxygen to form ZrO2 rather than substoichiometric compounds was guaranteed, as the crucible was completely exposed to ambient air.

3.3. Quantification of the Temperature Dependant Phase Evolution with Parametric Rietveld Refinement

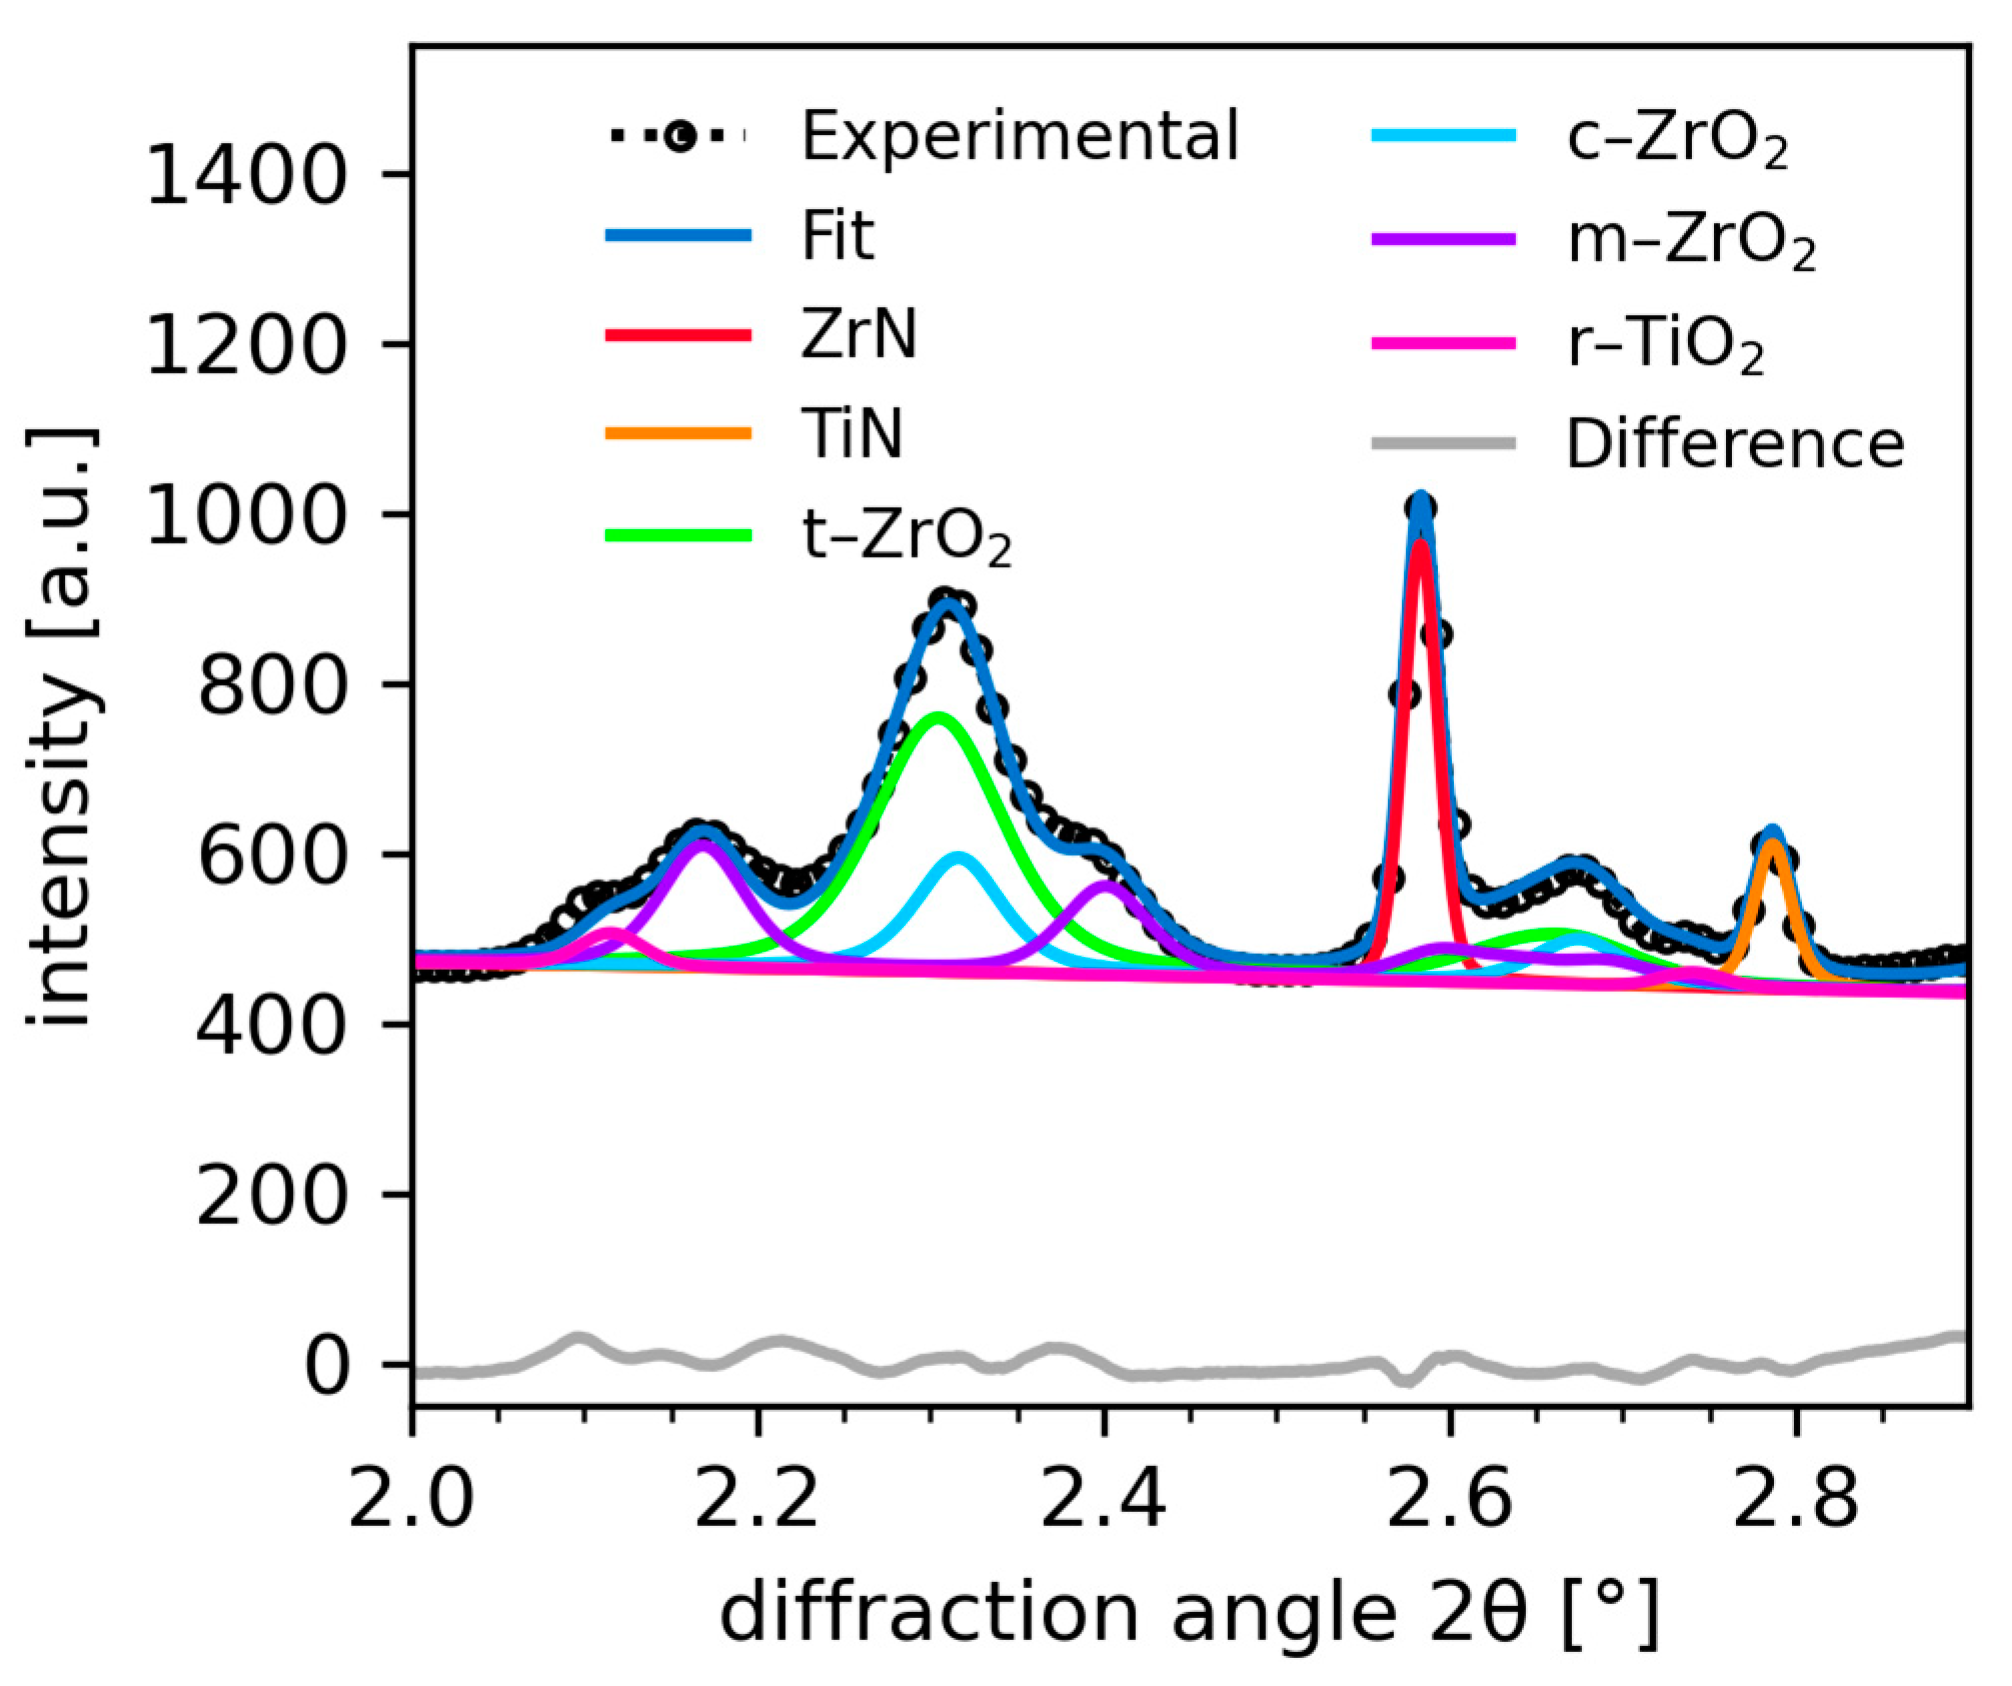
By fitting the in-situ synchrotron data using a parametric Rietveld refinement routine, the phase evolution during the oxidation process can be quantitatively evaluated, which is shown in the following section. A representative example of a refined pattern along with the individual phase contributions is presented in Figure 4. The ZrN sample at a temperature of 577 °C (Zone 2) was chosen as it displays both, nitride and oxide phases in one pattern, since the oxidation is not yet finished at this temperature. The difference curve (grey line) between the measured and fitted pattern is displayed at the bottom and its appearance was used as an indication of a reasonable fit. While the ZrN, TiN, m–ZrO2 and r–TiO2 phases can be clearly distinguished, an overlap of the t–ZrO2 and c–ZrO2 phase is visible. Even though both phases were fitted individually, their resulting weight percentage is presented as sum of both phases in the following section, because of the ambiguity in the differentiation of both phases.
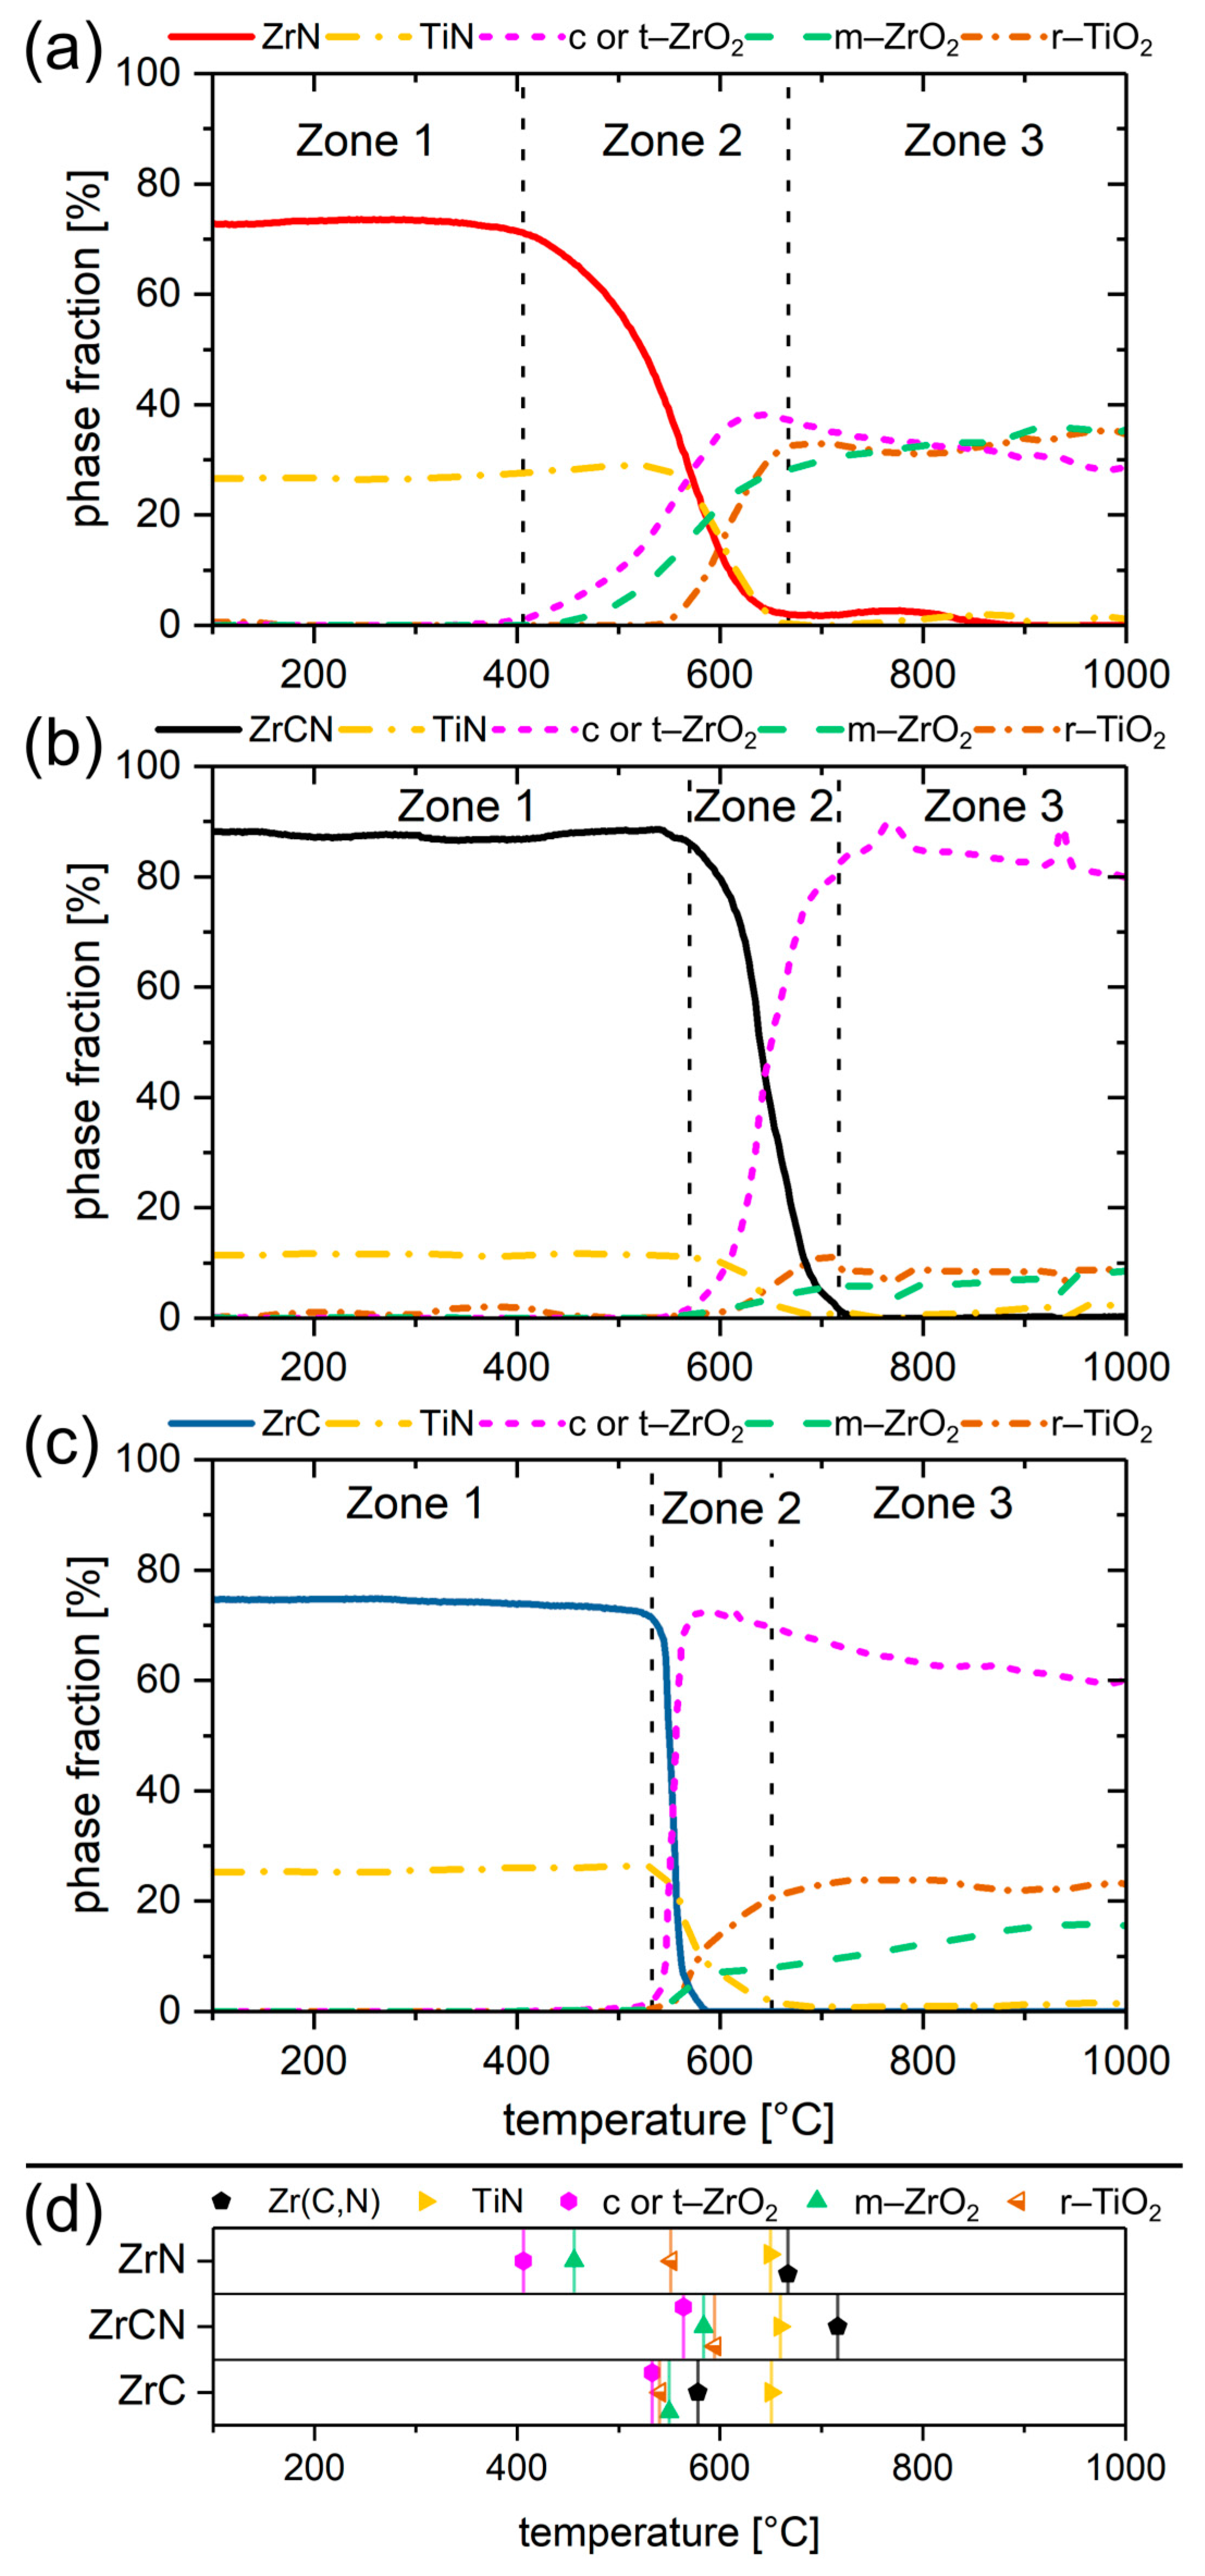
The temperature dependent quantitative phase evolution of the three samples is displayed in Figure 5a (ZrN), Figure 5b (ZrCN) and Figure 5c (ZrC). The error for the phase fractions was <1 wt.% for all phases and temperatures. To facilitate the comparison of the phase evolution of the three samples, the onset and end temperatures of the oxidation are highlighted in Figure 5d. The individual zones are also indicated by dashed lines within Figure 5a–c, corresponding to the zones discussed in Figure 3. In Zone 1, the phase content of the TiN from the base layer is similar for the ZrN (~25 wt.%) and ZrC (~26 wt.%) sample, but lower for the ZrCN (~11 wt.%) sample. This content variation can be related to a difference in the thickness ratio of the Zr(C,N) layers to the TiN, which was evaluated from SEM cross section images (not shown). The ZrCN layer was thicker (~3.5 µm) compared to ZrN (~0.9 µm) and ZrC (~0.9 µm), while the TiN base layer thickness was comparable for all three coatings (~0.5 µm for ZrN, ~0.8 µm for ZrCN and ~0.7 µm for ZrC). The difference in coating thickness is related to the higher reactivity of ZrCN during the deposition process compared to the pure ZrN and ZrC which leads to an overall higher Zr(C,N) phase fraction in the ZrCN sample. For the initial formation of oxide phases, marked with the border to Zone 2, a threshold of >1 wt.% was chosen as the criterion for the onset temperatures. The ZrN sample (Figure 5a) shows a continuous decline of the ZrN phase in Zone 2, with the initial formation of the c/t–ZrO2 phase at ~400 °C. With a slight delay, the m–ZrO2 phase starts to form at ~460 °C and up to ~600 °C the slopes of c/t–ZrO2 and m–ZrO2 are almost equal, indicating that the simultaneous formation of c/t–ZrO2 and successive martensitic phase transformation to the more stable m–ZrO2 phase occur at approximately equal rates. The oxidation of the ZrCN sample (Figure 5b) begins similarly to the ZrN sample with the formation of c/t–ZrO2, but at a different temperature of ~560 °C. However, here the oxidation occurs with a higher rate compared to ZrN. Furthermore, the martensitic phase transformation to m–ZrO2 occurs at a slower rate compared to ZrN, resulting in a maximum phase fraction of only <6 wt.% m–ZrO2 at the end of Zone 2 for ZrCN compared to ~28 wt.% m–ZrO2 for ZrN. An even higher formation rate is observed for the ZrC → c/t–ZrO2 phase transition in Zone 2 of Figure 5c. Within 50 °C, starting with the formation of c/t–ZrO2 at ~530 °C and ending with the disappearance of ZrC at ~580 °C, the ZrC phase is completely oxidised and mainly c/t–ZrO2 is formed (72 wt.% at 580 °C) with minor contributions of 6 wt.% m–ZrO2. At the end of Zone 3 of the ZrN sample, the content of m–ZrO2 is higher (36 wt.%) than the c/t–ZrO2 content (29 wt.%). In contrast to the ZrN sample, the major oxide modification of the oxidised ZrCN and ZrC samples is c/t–ZrO2. ZrCN exhibited 80 wt.% c/t–ZrO2 and 8 wt.% m–ZrO2 at 1000 °C and ZrC contained 60 wt.% c/t–ZrO2 and 16 wt.% m–ZrO2 at the same temperature. The higher c/t–ZrO2 phase fraction in the C containing samples might be related to small amounts of residual amorphous C, stabilising the c/t–ZrO2 phase and thus inhibiting the formation of m–ZrO2 [13,14,17,26]. This c/t–ZrO2 phase stabilisation is expected to be beneficial in solid coatings, as the c/t–ZrO2 → m–ZrO2 martensitic phase transformation is accompanied by a ~5% volume increase in the oxide scale resulting in the formation of microcracks. These cracks provide oxygen diffusion paths through the oxide scale towards the still intact Zr(C,N) regions, thus reducing the coatings oxidation resistance [10,51].
TiN starts to oxidise at ~540–550 °C in the ZrN and ZrC sample and at ~595 °C in the ZrCN sample, as highlighted by the onset of r–TiO2 formation in Figure 5d. This is in good agreement with literature, where the oxidation onset temperature for TiN is reported to lie between 550 °C and 600 °C [52,53,54]. Since the TiN base layers were synthesised under the same deposition conditions, it is expected that the onset temperature is equal for all three sample. The observed deviation of the TiN oxidation onset in the ZrCN sample compared to the ZrN and ZrC sample is related to the lower relative phase fraction of TiN powder in the ZrCN sample, as the intensity of the diffraction peaks and thus the evaluated wt.% is influenced by the amount of TiN powder present in the sample. A sensible Rietveld refinement relies on the intensity of the diffraction peak and thus the low amounts of r–TiO2 might not be fitted reasonably, shifting the onset of oxidation to higher temperatures. If the onset of oxidation for TiN is considered to lie between 540–550 °C for all samples, ZrCN shows a slightly higher oxidation onset temperature with ~570 °C compared to TiN, while ZrN and ZrC have a lower onset temperature of ~400 °C and ~530 °C, respectively.

3.4. Influence of Carbon on the Oxidation Onset Temperature

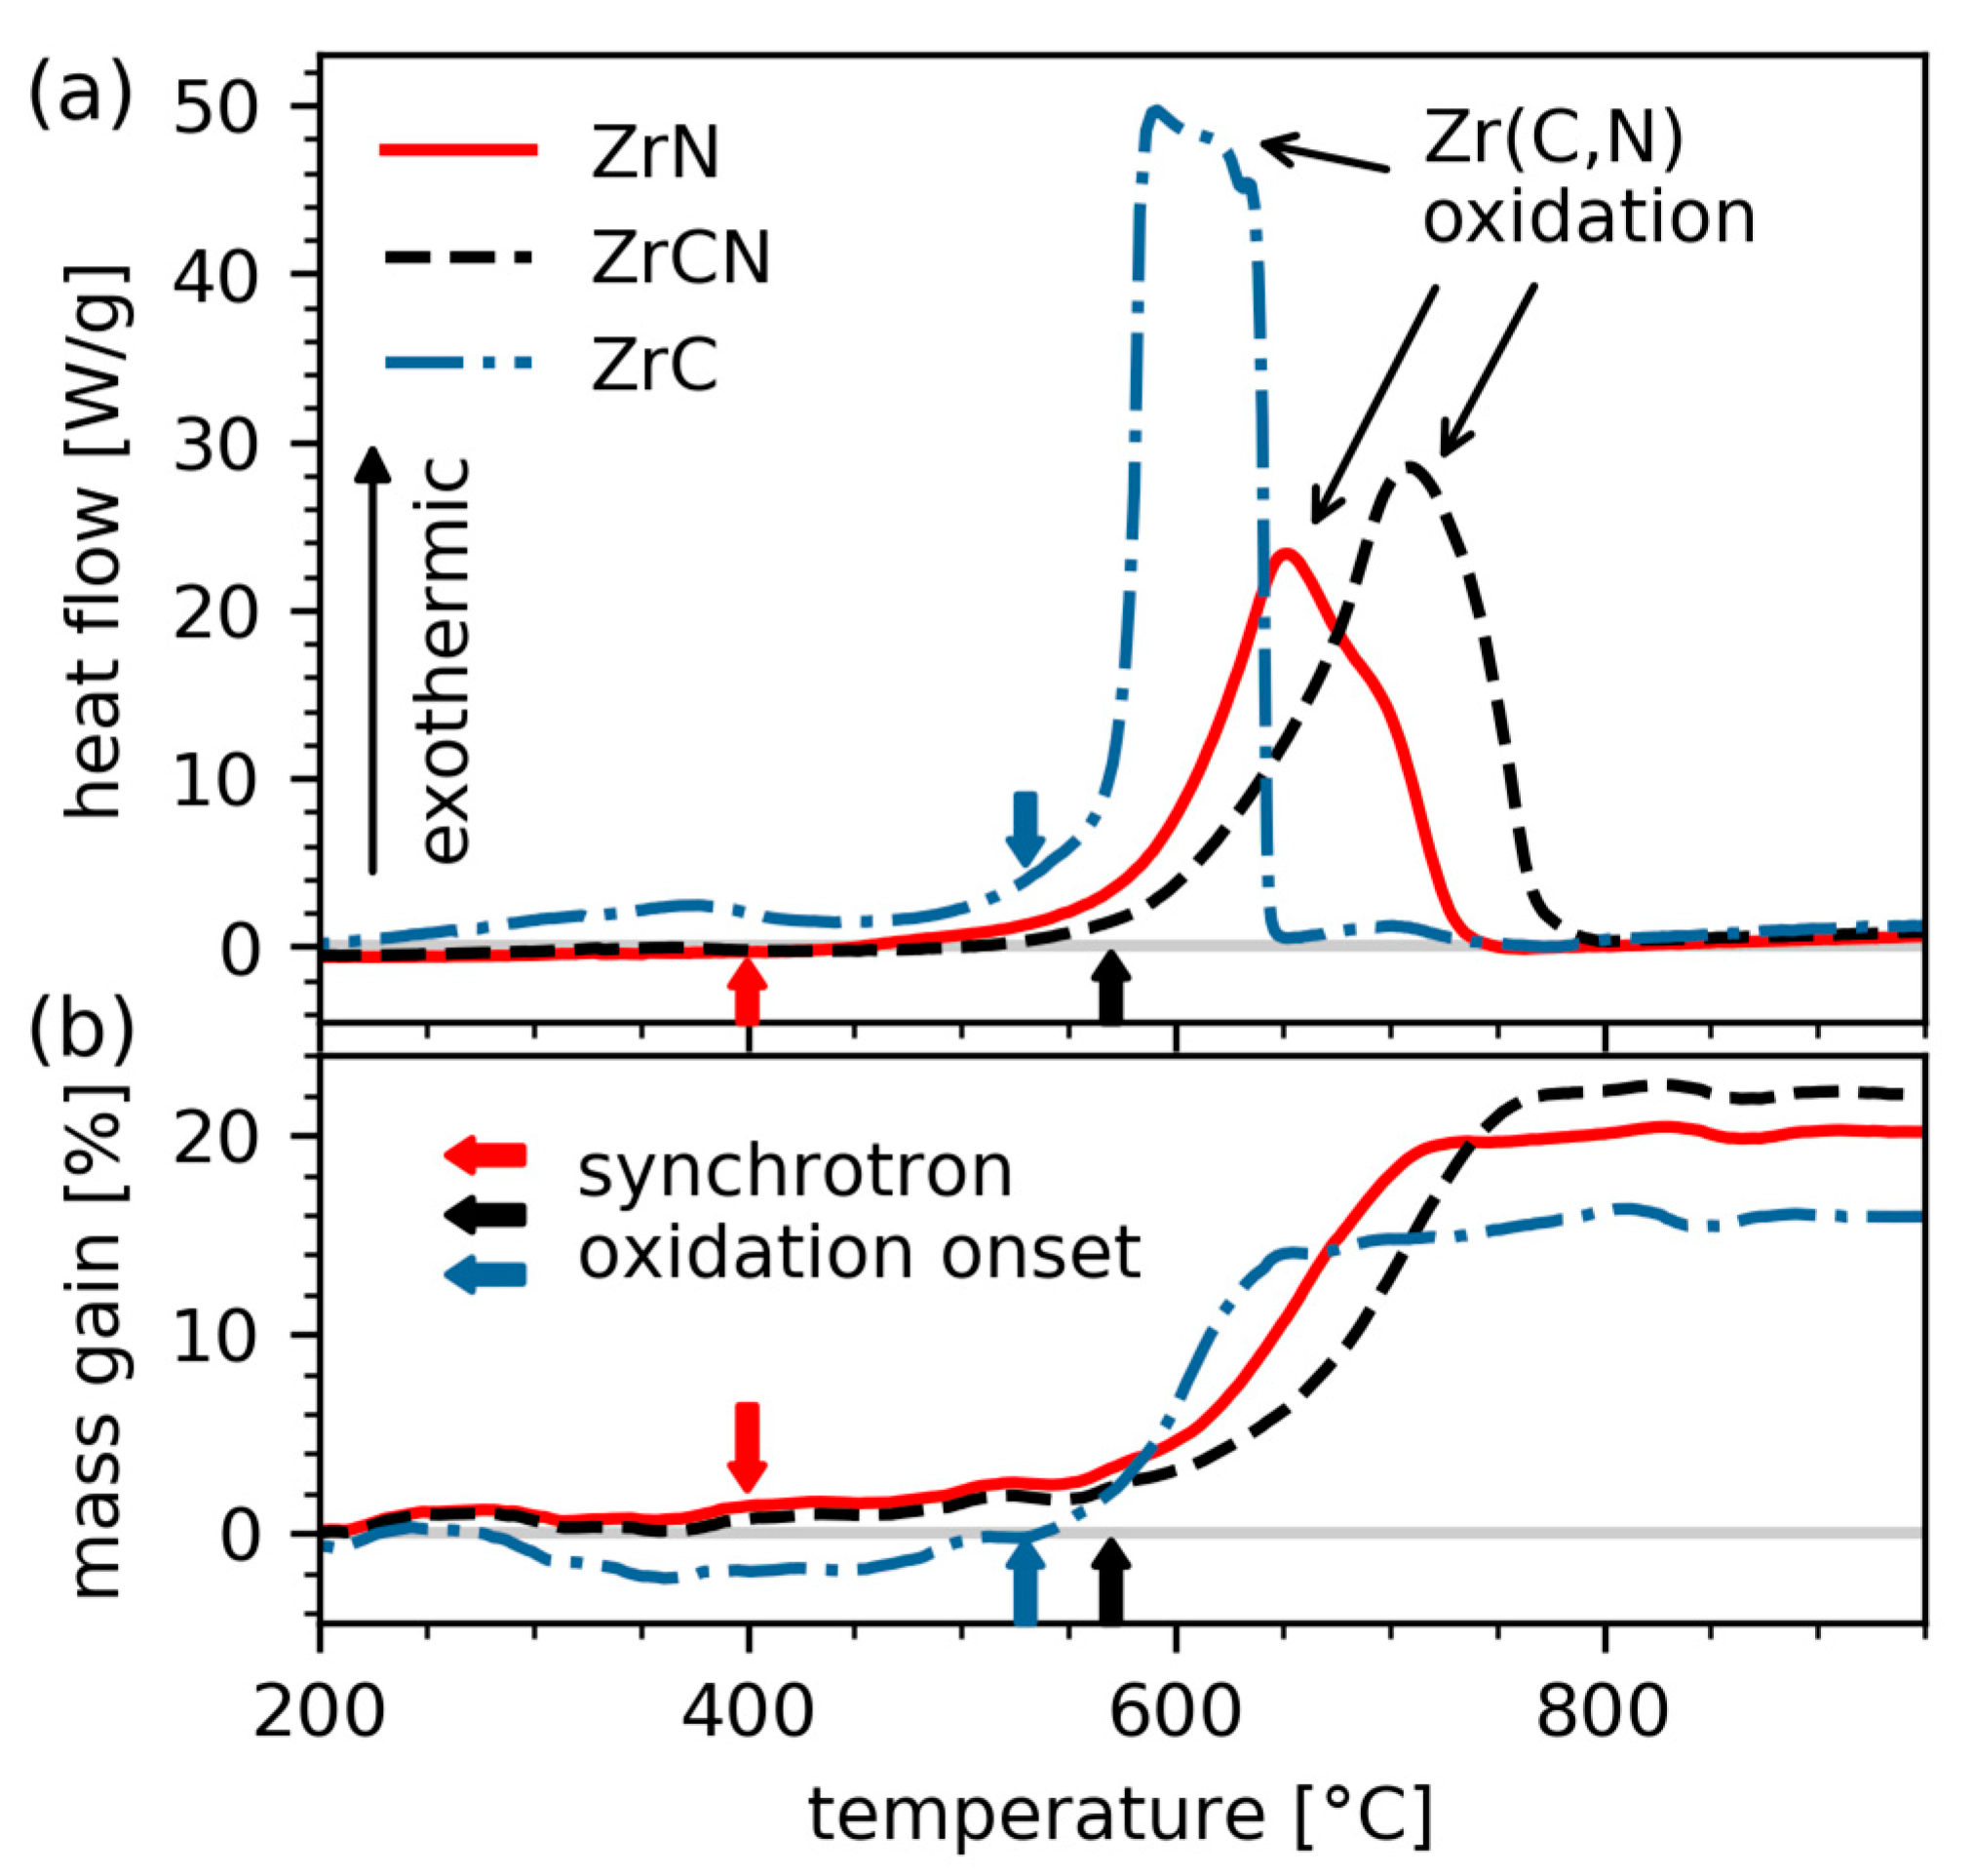
DSC and TGA investigations are shown in Figure 6a,b, respectively. The oxidation onset temperatures, determined by the synchrotron measurements and parametric Rietveld refinement, are indicated by the arrows in colours corresponding to the respective Zr(C,N) samples. As an exothermic change in the heat flow and a mass gain indicate the beginning of the oxidation process, the ZrN, ZrCN and ZrC oxidation onset temperature matches quite well with the onset determined by the in-situ synchrotron experiments. The minor changes in the heat flow of the ZrCN and ZrC sample at temperatures below the oxidation onset observed in the synchrotron measurements might be due to the formation of amorphous phases. One has to keep in mind that the results of the synchrotron measurements are based on the evolution of crystalline phases and that amorphous ZrO2 and free C might be formed at lower temperatures, as observed by several authors [13,14,15,16,25,26,27]. At these lower temperatures, the provided oxygen is mainly used for the formation of amorphous ZrO2 rather than CO2, since the combustion of C is expected to take place at temperatures >600 °C [13,14,19,25]. As the temperature increases, the amorphous ZrO2 forms c/t–ZrO2 which was detected in the in-situ synchrotron experiments (see Figure 4b,c). The DSC signal of the ZrC sample shows a broad peak at ~600 °C to 630 °C. This broad peak can be attributed to two consecutive reactions that take place during the ZrC oxidation at slightly different temperatures. The first reaction at ~600 °C can be related to the oxidation of ZrC and the reaction at ~620 °C arises due to the combustion of the retained C, which was also observed in [19]. Compared to ZrC, no distinct DSC peak related to the formation of CO2 is observable in the ZrCN sample. This can be explained by the higher oxidation temperature (>600 °C) for the ZrCN sample, allowing for the subsequent formation of CO2 from the newly formed C. Additionally, less C will be formed at temperatures <600 °C due to the higher oxidation onset and the lower C content of ZrCN compared to ZrC. The maximum of the exothermic peaks in the heat flow signal are observed at ~650 °C, ~710 °C and ~600 °C for ZrN, ZrCN and ZrC, respectively. This is in excellent agreement with the maximum content of the c/t–ZrO2 phase observed in the phase evolution and the end of the oxidation process (Figure 5), where the transformation rate is the highest. In the heat flow signal of the ZrN sample, a shoulder at ~700 °C superimposes the oxidation peak. This shoulder might be related to r–TiO2 formation from the TiN base layer, as the r–TiO2 content also shows a maximum in the phase evolution at ~700 °C. The heat flow signal of the ZrC sample also exhibits a minor peak at ~700 °C. As the ZrC oxidation process is already finished at this temperature, this observation further corroborates the assumption that this peak is indeed related to the base layer oxidation. In the ZrCN the contributions of the TiN base layer to the DSC and TGA signal seem to be superimposed by the ZrCN oxidation possibly explaining the asymmetric ZrCN peak.

3.5. Ex-Situ Raman and XRD Investigations

The final phase composition after cooling down from the oxidation process was investigated ex-situ with Raman spectroscopy and XRD. The characteristic Raman bands of m–ZrO2 and t–ZrO2 [55,56,57], as well as r–TiO2 [58] are indicated as dashed lines in Figure 7a and the diffraction peaks of m–ZrO2 (PDF 00-065-0687 [45]), c/t–ZrO2 (PDF 00-049-1642, PDF 01-072-7115 [45]) and r–TiO2 (PDF 01-070-7347 [45]) are highlighted in Figure 7b. The Raman spectra and XRD patterns are in good agreement. Both, the oxidised ZrN and ZrCN samples exhibit mainly the m–ZrO2 phase with minor traces of t–ZrO2, whereas the ZrC sample shows a higher t–ZrO2 contribution in the Raman spectrum and higher c/t–ZrO2 in the XRD. While the r–TiO2 peaks, arising from the oxidation of the TiN base layer, exhibit a low intensity and can be clearly distinguished from the ZrO2 peaks in the XRD, the r–TiO2 bands in the Raman spectra show a high intensity, partially superimposing the ZrO2 bands. Especially the F2g–mode at ~600 cm−1 of c–ZrO2 is superimposed by the A1g contribution of r–TiO2 at ~610 cm−1 [56,59]. Due to this overlap and the high intensity of r–TiO2, an unambiguous identification of the c–ZrO2 phase in the Raman spectra is not possible. Thus, a clear distinction between the c–ZrO2 and t–ZrO2 phase was also not possible with Raman spectroscopy. In order to investigate the effect of cooling the samples from the final oxidation temperature of 1000 °C to room temperature on the phase composition, a quantitative Rietveld refinement of the ex-situ XRD data was performed. The results are compared to those of the Rietveld refinement of the in-situ measurement at 1000 °C in Figure 7c. All three samples show an increase of the m–ZrO2 phase and a decrease of c/t–ZrO2 after cooling, as would be expected from the ongoing martensitic phase transformation during the cooling process, since the m–ZrO2 phase is energetically more stable than c/t–ZrO2 at temperatures below 1170 °C [18]. While ZrCN shows the largest increase of m–ZrO2 during cooling, the smallest increase is observed for ZrN, which is related to the already high m–ZrO2 fraction in ZrN at 1000 °C compared to ZrCN. ZrC exhibits a moderate m–ZrO2 increase, with a slightly lower m–ZrO2 phase fraction at room temperature compared to the ZrCN sample. This might indicate a higher c/t–ZrO2 phase stabilisation in ZrC compared to ZrCN and ZrN. One possible explanation could be that the c/t–ZrO2 grain size might be smaller in the ZrC sample compared to ZrCN and ZrN, which would lead to a c/t–ZrO2 phase stabilisation [29,47]. Another reason for the stabilisation might be related to a higher amount of residual C in the ZrC sample compared to ZrCN and ZrN, which would also result in a c/t–ZrO2 phase stabilisation. The Raman measurements suggest a higher contribution of the G–band, which is related to the sp2 (graphitelike) bonds of C [60], in the ZrC sample compared to ZrN and ZrCN. However, these C contributions in the Raman spectrum are small and superimposed by a fluorescent background and are therefore not shown in Figure 7a. Most probably a combination of these stabilisation effects occurs in the ZrC sample, which cannot be clearly differentiated.

4. Conclusions

Within this work, the oxidation behaviour of powdered ZrN, ZrCN and ZrC coatings, grown by chemical vapour deposition, was investigated. In-situ synchrotron X-ray diffraction (XRD) and successive evaluation of the obtained diffraction data by parametric Rietveld refinement gave insight into the phase evolution during oxidation between 100 °C and 1000 °C. ZrCN exhibited the highest oxidation onset temperature at ~570 °C, followed by ZrC with ~530 °C and ZrN, which showed the lowest oxidation onset at ~400 °C. Furthermore, the ZrCN coating was only completely oxidised at a temperature of ~720 °C, resulting in a better oxidation resistance compared to the ZrN and ZrC coating, which were already entirely oxidised at ~670 °C and ~650 °C, respectively. Parametric Rietveld refinement revealed a similar oxidation mechanism for all three coating systems: after the loss of N or C from the Zr(C,N) lattice and the uptake of O, cubic and/or tetragonal c/t–ZrO2 phases are formed initially. c/t–ZrO2 then transformed to the monoclinic m–ZrO2 phase, which is usually more stable at the investigated temperatures. ZrCN and ZrC showed the highest c/t–ZrO2 phase fractions, indicating that these phases were stabilised in these samples. This stabilisation effect might be related to residual C and/or a smaller grain size in the ZrCN and ZrC samples. In order to assess phase changes during cooling from 1000 °C to room temperature, previously oxidised samples were studied ex-situ by Raman spectroscopy and XRD, which revealed a major increase of the m–ZrO2 phase compared to the in-situ synchrotron measurement at 1000 °C for all three samples, indicating an ongoing martensitic phase transformation during cooling. Summarizing, the present work gives insight into the phase evolution during oxidation of ZrN, ZrCN and ZrC coatings, highlighting the higher oxidation resistance of the lesser investigated ZrCN compared to ZrN and ZrC.

Author Contributions

Conceptualization, F.F.; methodology, F.F., M.T., C.S., A.S., N.S. (Norbert Schell), and M.D.; software, F.F.; validation, F.F., M.T., C.S., and M.D.; formal analysis, F.F.; investigation, F.F., M.T., C.S., and M.D.; resources, A.S., N.S. (Norbert Schell), M.D., and C.C.; writing—original draft preparation, F.F.; writing—review and editing, M.T., C.S., and N.S. (Nina Schalk); visualization, F.F.; supervision, M.T. and N.S. (Nina Schalk); project administration, N.S. (Nina Schalk); funding acquisition, C.C. and N.S. (Nina Schalk) All authors have read and agreed to the published version of the manuscript.

Funding

We acknowledge DESY (Hamburg, Germany), a member of the Helmholtz Association HGF, for the provision of experimental facilities. Parts of this research were carried out at PETRA III using the high energy materials science beamline P07 (proposal no.: I–20180959 EC). The research leading to this result has been supported by the project CALIPSOplus under the Grant Agreement 730872 from the EU Framework Programme for Research and Innovation HORIZON 2020. The financial support by the Austrian Federal Ministry for Digital and Economic Affairs and the National Foundation for Research, Technology and Development is gratefully acknowledged. The authors gratefully acknowledge the financial support under the scope of the COMET program within the K2 Center “Integrated Computational Material, Process and Product Engineering (IC–MPPE)” (Project No 859480). This program is supported by the Austrian Federal Ministries for Transport, Innovation and Technology (BMVIT) and for Digital and Economic Affairs (BMDW), represented by the Austrian research funding association (FFG), and the federal states of Styria, Upper Austria and Tyrol.

Institutional Review Board Statement

Not applicable.

Informed Consent Statement

Not applicable.

Data Availability Statement

The data presented in this study are available on request from the corresponding author. The data are not publicly available due to the large amount of data created at the synchrotron facility.

Acknowledgments

The authors want to thank Bernhard Sartory (Materials Center Leoben Forschung GmbH) for the SEM investigations.

Conflicts of Interest

The authors declare no conflict of interest.

References

  1. Sundgren, J.E. Structure and properties of TiN coatings. Thin Solid Films 1985, 128, 21–44. [Google Scholar] [CrossRef]
  2. Rebenne, H.E.; Bhat, D.G. Review of CVD TiN coatings for wear-resistant applications: Deposition processes, properties and performance. Surf. Coat. Technol. 1994, 63, 1–13. [Google Scholar] [CrossRef]
  3. Holzschuh, H. Deposition of Ti–B–N (single and multilayer) and Zr–B–N coatings by chemical vapor deposition techniques on cutting tools. Thin Solid Films 2004, 469–470, 92–98. [Google Scholar] [CrossRef]
  4. Wagner, J.; Mitterer, C.; Penoy, M.; Michotte, C.; Wallgram, W.; Kathrein, M. The effect of deposition temperature on microstructure and properties of thermal CVD TiN coatings. Int. J. Refract. Met. Hard Mater. 2008, 26, 120–126. [Google Scholar] [CrossRef]
  5. Kainz, C.; Schalk, N.; Tkadletz, M.; Winkler, M.; Czettl, C. Microstructure, mechanical and thermo-physical properties of CVD TiCxN1−x coatings on cemented carbide substrates grown with C2H6 as C feeding precursor. Surf. Coat. Technol. 2020. [Google Scholar] [CrossRef]
  6. Garcia, J.; Moreno, M.F.; Östby, J.; Persson, J.; Pinto, H.C. Design of coated cemented carbides with improved comb crack resistance. In Proceedings of the 19th Plansee Seminar, Reutte, Tirol, Austria, 29 May–2 June 2017; pp. 1–8. [Google Scholar]
  7. El Azhari, I.; Garcia, J.; Zamanzade, M.; Soldera, F.; Pauly, C.; Llanes, L.; Mücklich, F. Investigations on micro-mechanical properties of polycrystalline Ti(C,N) and Zr(C,N) coatings. Acta Mater. 2018, 149, 364–376. [Google Scholar] [CrossRef] [Green Version]
  8. El Azhari, I.; Barrirero, J.; García, J.; Soldera, F.; Llanes, L.; Mücklich, F. Atom Probe Tomography investigations on grain boundary segregation in polycrystalline Ti(C,N) and Zr(C,N) CVD coatings. Scr. Mater. 2019, 162, 335–340. [Google Scholar] [CrossRef] [Green Version]
  9. Harrison, R.W.; Lee, W.E. Mechanism and kinetics of oxidation of ZrN ceramics. J. Am. Ceram. Soc. 2015, 98, 2205–2213. [Google Scholar] [CrossRef] [Green Version]
  10. Qi, Z.B.; Wu, Z.T.; Liang, H.F.; Zhang, D.F.; Wang, J.H.; Wang, Z.C. In Situ and Ex Situ studies of microstructure evolution during high-temperature oxidation of ZrN hard coating. Scr. Mater. 2015, 97, 9–12. [Google Scholar] [CrossRef]
  11. Gao, Z.; Chen, Y.; Kulczyk-Malecka, J.; Kelly, P.; Zeng, Y.; Zhang, X.; Li, C.; Liu, H.; Rohbeck, N.; Xiao, P. Comparison of the oxidation behavior of a zirconium nitride coating in water vapor and air at high temperature. Corros. Sci. 2018, 138, 242–251. [Google Scholar] [CrossRef]
  12. Krusin-Elbaum, L.; Wittmer, M. Oxidation kinetics of ZrN thin films. Thin Solid Films 1983, 107, 111–116. [Google Scholar] [CrossRef]
  13. Shimada, S.; Ishil, T. Oxidation kinetics of Zirconium Carbide at relatively low temperatures. J. Am. Ceram. Soc. 1990, 73, 2804–2808. [Google Scholar] [CrossRef]
  14. Rao, G.A.R.; Venugopal, V. Kinetics and mechanism of the oxidation of ZrC. J. Alloys Compd. 1994, 206, 237–242. [Google Scholar] [CrossRef]
  15. Tamura, K.; Ogawa, T.; Fukuda, K. The oxidation behavior of ZrC coating and powder studied by laser Raman spectroscopy and X-ray diffraction. J. Nucl. Mater. 1990, 175, 266–269. [Google Scholar] [CrossRef]
  16. Shimada, S.; Inagaki, M.; Suzuki, M. Microstructural observation of the ZrC/ZrO2 interface formed by oxidation of ZrC. J. Mater. Res. 1996, 11, 2594–2597. [Google Scholar] [CrossRef]
  17. Harrison, R.W.; Lee, W.E. Processing and properties of ZrC, ZrN and ZrCN ceramics: A review. Adv. Appl. Ceram. 2015, 115, 294–307. [Google Scholar] [CrossRef] [Green Version]
  18. Kingery, W.D.; Bowen, H.K.; Uhlmann, D.R. Introduction to Ceramics, 2nd ed; Wiley: New York, NY, USA, 1976; ISBN 0471478601. [Google Scholar]
  19. Shimada, S. A thermoanalytical study on the oxidation of ZrC and HfC powders with formation of carbon. Solid State Ion. 2002, 149, 319–326. [Google Scholar] [CrossRef]
  20. Shevchenko, A.S.; Lyutikov, R.A.; Andrievskii, R.A.; Terekhova, V.A. Oxidation of zirconium and niobium carbides. Sov. Powder Metall. Met. Ceram. 1980, 19, 48–52. [Google Scholar] [CrossRef]
  21. Shimada, S.; Nishisako, M.; Inagaki, M.; Yamamoto, K. Formation and microstructure of Carbon-containing oxide scales by oxidation of single crystals of Zirconium Carbide. J. Am. Ceram. Soc. 1995, 78, 41–48. [Google Scholar] [CrossRef]
  22. Shimada, S. Interfacial reaction on oxidation of carbides with formation of carbon. Solid State Ion. 2001, 141–142, 99–104. [Google Scholar] [CrossRef]
  23. Voitovich, R.F.; Pugach, E.A. High-temperature oxidation of ZrC and HfC. Sov. Powder Metall. Met. Ceram. 1973, 12, 916–921. [Google Scholar] [CrossRef]
  24. Jackson, H.F.; Lee, W.E. Properties and Characteristics of ZrC; Konings, R.J.M., Ed.; Elsevier Inc.: Oxford, UK, 2012; ISBN 9780080560335. [Google Scholar]
  25. Katoh, Y.; Vasudevamurthy, G.; Nozawa, T.; Snead, L.L. Properties of Zirconium Carbide for nuclear fuel applications. J. Nucl. Mater. 2013, 441, 718–742. [Google Scholar] [CrossRef]
  26. Gasparrini, C.; Chater, R.J.; Horlait, D.; Vandeperre, L.; Lee, W.E. Zirconium carbide oxidation: Kinetics and oxygen diffusion through the intermediate layer. J. Am. Ceram. Soc. 2018, 101, 2638–2652. [Google Scholar] [CrossRef] [Green Version]
  27. Gasparrini, C.; Podor, R.; Horlait, D.; Chater, R.; Lee, W.E. Zirconium Carbide oxidation: Maltese cross formation and interface characterization. Oxid. Met. 2017, 88, 509–519. [Google Scholar] [CrossRef]
  28. Huang, J.H.; Kuo, K.L.; Yu, G.P. Oxidation behavior and corrosion resistance of vacuum annealed ZrN-coated stainless steel. Surf. Coat. Technol. 2019, 358, 308–319. [Google Scholar] [CrossRef]
  29. Shukla, S.; Seal, S. Mechanisms of room temperature metastable tetragonal phase stabilisation in Zirconia. Int. Mater. Rev. 2005, 50, 45–64. [Google Scholar] [CrossRef]
  30. Schell, N.; King, A.; Beckmann, F.; Ruhnau, H.U.; Kirchhof, R.; Kiehn, R.; Müller, M.; Schreyer, A. The High Energy Materials Science Beamline (HEMS) at PETRA III. AIP Conf. Proc. 2010, 1234, 391–394. [Google Scholar] [CrossRef]
  31. Saringer, C.; Tkadletz, M.; Stark, A.; Schell, N.; Czettl, C.; Schalk, N. In-situ investigation of the oxidation behavior of metastable CVD Ti1−xAlxN using a novel combination of synchrotron radiation XRD and DSC. Surf. Coat. Technol. 2019, 374, 617–624. [Google Scholar] [CrossRef]
  32. Baerlocher, C.; Cheetham, A.K.; David, W.I.F.; de Keijser, T.H.; Delhez, R.; Hill, R.J.; Izumi, F.; Jorgensen, J.D.; Langford, J.I.; Louër, D.; et al. The Rietveld Method; Young, R.A., Ed.; Oxford University Press: Oxford, UK, 1993; Volume 1, ISBN 9780198559122. [Google Scholar]
  33. NIST 660c Certificate. Available online: https://www-s.nist.gov/srmors/view_detail.cfm?srm=660c (accessed on 25 August 2020).
  34. Stinton, G.W.; Evans, J.S.O. Parametric Rietveld refinement. J. Appl. Crystallogr. 2007, 40, 87–95. [Google Scholar] [CrossRef] [PubMed] [Green Version]
  35. Dinnebier, R.E.; Leineweber, A.; Evans, J.S.O. Rietveld Refinement: Practical Powder Diffraction Pattern Analysis Using TOPAS; Walter de Gruyter GmbH & Co KG: Berlin, Germany; Boston, MA, USA, 2018; ISBN 3110461382. [Google Scholar]
  36. Crystallography Open Database. Available online: http://www.crystallography.net (accessed on 1 April 2019).
  37. Crystallography Open Database. COD-ID 1538058. Available online: http://www.crystallography.net/cod/1538058.html (accessed on 1 April 2019).
  38. Crystallography Open Database. COD-ID 1539496. Available online: http://www.crystallography.net/cod/1539496.html (accessed on 1 April 2019).
  39. Crystallography Open Database. COD-ID 1011322. Available online: http://www.crystallography.net/cod/1011322.html (accessed on 1 April 2019).
  40. Crystallography Open Database. COD-ID 1011099. Available online: http://www.crystallography.net/cod/1011099.html (accessed on 1 April 2019).
  41. Crystallography Open Database. COD-ID 1521753. Available online: http://www.crystallography.net/cod/1521753.html (accessed on 1 April 2019).
  42. Crystallography Open Database. COD-ID 1525705. Available online: http://www.crystallography.net/cod/1525705.html (accessed on 1 April 2019).
  43. Crystallography Open Database. COD-ID 2108450. Available online: http://www.crystallography.net/cod/2108450.html (accessed on 1 April 2019).
  44. Crystallography Open Database. COD-ID 9004141. Available online: http://www.crystallography.net/cod/9004141.html (accessed on 1 April 2019).
  45. Gates-Rector, S.; Blanton, T. The Powder Diffraction File: A quality materials characterization database. Powder Diffr. 2019, 34, 352–360. [Google Scholar] [CrossRef] [Green Version]
  46. Pawley, G.S. Unit-cell refinement from powder diffraction scans. J. Appl. Crystallogr. 1981, 14, 357–361. [Google Scholar] [CrossRef]
  47. Garvie, R.C. The occurrence of metastable tetragonal zirconia as a crystallite size effect. J. Phys. Chem. 1965, 69, 1238–1243. [Google Scholar] [CrossRef]
  48. Kanno, Y. Stability of metastable tetragonal ZrO2 in compound powders and nucleation arguments. J. Mater. Sci. 1990, 25, 1987–1990. [Google Scholar] [CrossRef]
  49. Reddy, G.L.N.; Ramana, J.V.; Kumar, S.; Kumar, S.V.; Raju, V.S. Investigations on the oxidation of zirconium nitride films in air by nuclear reaction analysis and backscattering spectrometry. Appl. Surf. Sci. 2007, 253, 7230–7237. [Google Scholar] [CrossRef]
  50. Gendre, M.; Maître, A.; Trolliard, G. Synthesis of zirconium oxycarbide (ZrCxOy) powders: Influence of stoichiometry on densification kinetics during spark plasma sintering and on mechanical properties. J. Eur. Ceram. Soc. 2011, 31, 2377–2385. [Google Scholar] [CrossRef]
  51. Garces, H.F.; Senturk, B.S.; Padture, N.P. In situ Raman spectroscopy studies of high-temperature degradation of thermal barrier coatings by molten silicate deposits. Scr. Mater. 2014, 76, 29–32. [Google Scholar] [CrossRef]
  52. Münz, W. Titanium aluminum nitride films: A new alternative to TiN coatings. J. Vac. Sci. Technol. Vac. Surf. Film. 1986, 4, 2717–2725. [Google Scholar] [CrossRef]
  53. Fateh, N.; Fontalvo, G.A.; Gassner, G.; Mitterer, C. Influence of high-temperature oxide formation on the tribological behaviour of TiN and VN coatings. Wear 2007, 262, 1152–1158. [Google Scholar] [CrossRef]
  54. Chen, L.; Paulitsch, J.; Du, Y.; Mayrhofer, P.H. Thermal stability and oxidation resistance of Ti-Al-N coatings. Surf. Coat. Technol. 2012, 206, 2954–2960. [Google Scholar] [CrossRef] [Green Version]
  55. Muñoz Tabares, J.A.; Anglada, M.J. Quantitative analysis of monoclinic phase in 3Y-TZP by Raman pectroscopy. J. Am. Ceram. Soc. 2010, 93, 1790–1795. [Google Scholar] [CrossRef]
  56. Gilman, J.J.; Galvanov, B.A.; Kindrachuk, V.M.; Zhang, L.C.; Cheong, W.C.D.; Ackland, G.J.; Levitas, V.I.; Fischer-Cripps, A.C.; Bhushan, B.; Xiaodong, L.; et al. High-Pressure Surface Science and Engineering, 1st ed.; Gogotsi, Y., Domnich, V., Eds.; Routledge: New York, NY, USA, 2004; ISBN 9780750308816. [Google Scholar]
  57. Naumenko, A.P.; Berezovska, N.I.; Biliy, M.M.; Shevchenko, O.V. Vibrational analysis and Raman spectra of tetragonal Zirconia. Phys. Chem. Solid State 2008, 9, 121–125. [Google Scholar]
  58. Rutile TiO2 Raman Peaks. Available online: https://rruff.info/rutile/display=default/R110109 (accessed on 2 November 2020).
  59. Krishnamurti, D. The Raman spectrum of rutile. Proc. Indian Acad. Sci. Sect. A 1962, 55, 290–299. [Google Scholar] [CrossRef]
  60. Ferrari, A.C.; Robertson, J. Interpretation of Raman spectra of disordered and amorphous carbon. Phys. Rev. B 2000, 61, 14095. [Google Scholar] [CrossRef] [Green Version]
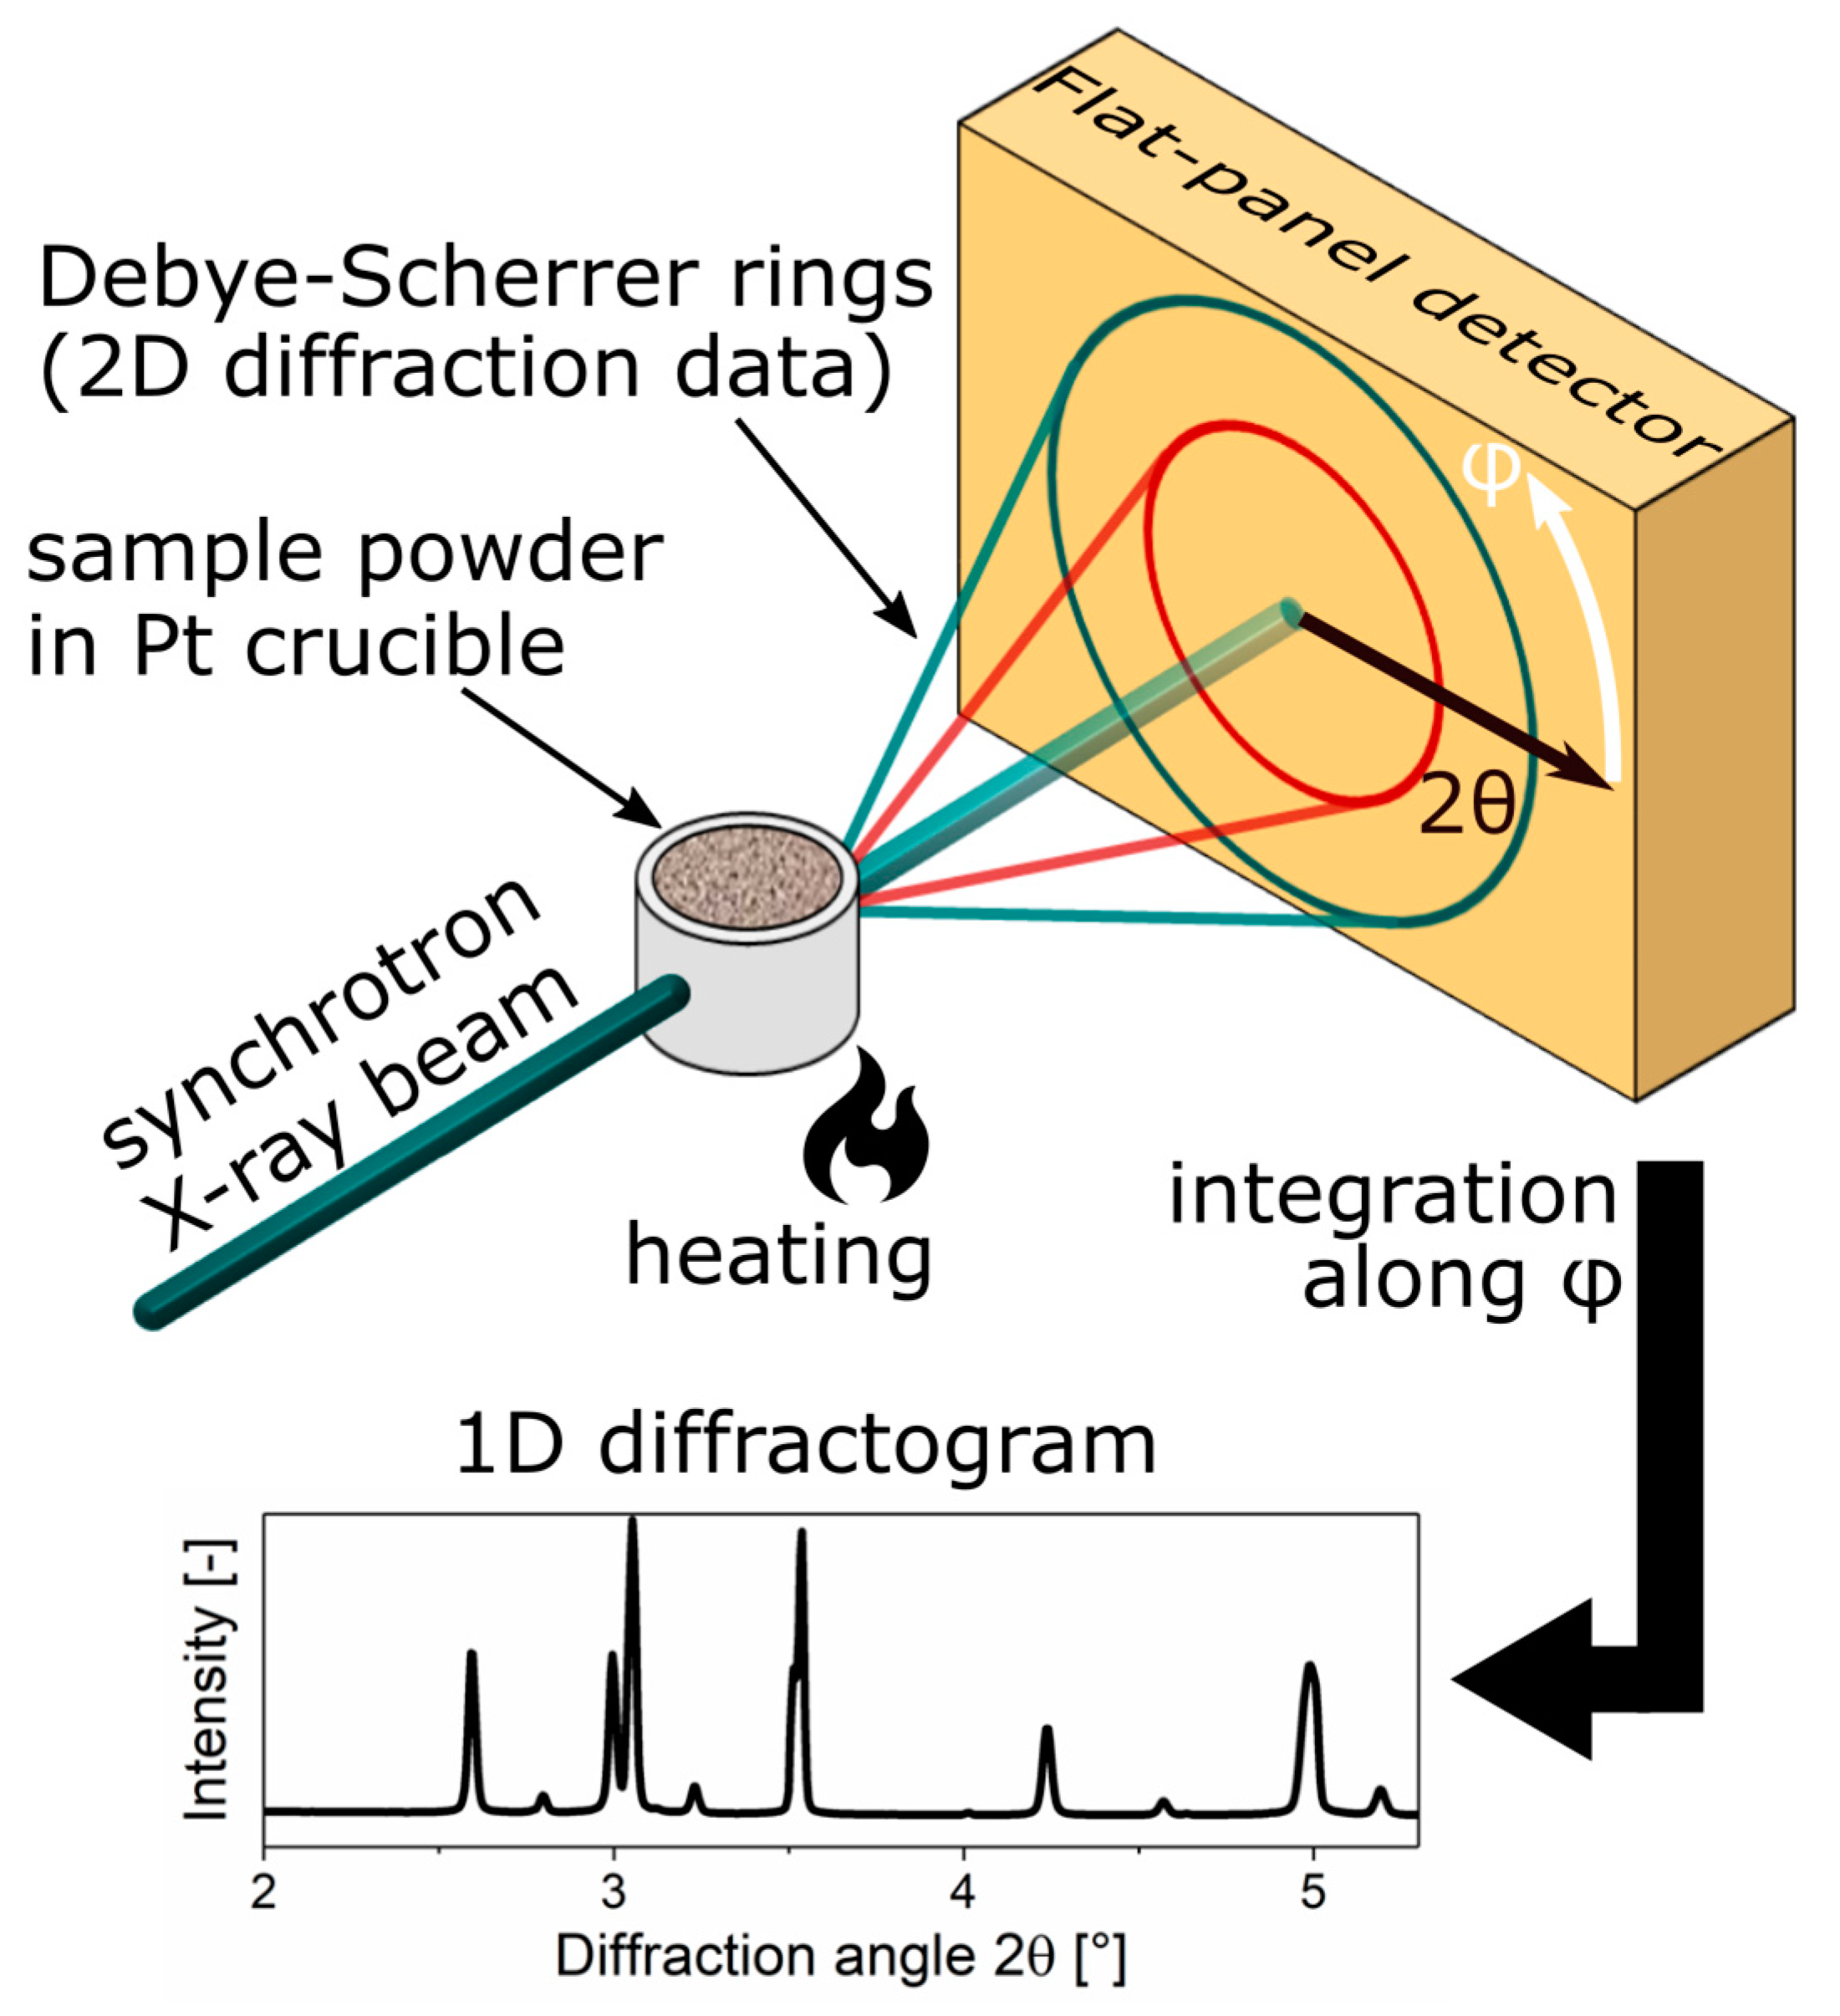
Figure 1. Schematic view of the in-situ powder X-ray diffraction (XRD) experimental setup in Debye-Scherrer geometry at the synchrotron beam line. External heating was applied via inductive heating coils. By azimuthal integration (along φ) of the Debye-Scherrer rings (2D diffraction data), 1D diffractograms were obtained.
Coatings 11 00264 g001
Figure 2. Comparison of the X-ray diffractograms of the solid coatings (laboratory XRD in grazing incidence geometry with 2° incidence angle) and the powdered coatings (synchrotron radiation facility, Debye-Scherrer geometry) for the (a) ZrN, (b) ZrCN, (c) ZrC samples. The patterns were recorded at room temperature.
Coatings 11 00264 g002
Figure 3. Phase plots of the modelled in-situ powder XRD data as a function of the oxidation temperature for the (a) ZrN, (b) ZrCN and (c) ZrC sample. The intensity of the diffraction data is colour coded.
Coatings 11 00264 g003
Figure 4. Rietveld refinement of the ZrN sample at 577 °C. The fits of the nitride and oxide phases, as well as the measured pattern, the fit and the difference curve between the measured pattern and the fit are displayed in different colours.
Coatings 11 00264 g004
Figure 5. Quantitative phase evolution as a function of the oxidation temperature for (a) ZrN, (b) ZrCN and (c) ZrC, obtained by parametric Rietveld refinement. (d) The oxidation onset temperatures of the oxide phases (c or t–ZrO2, m–ZrO2 and r–TiO2), as well as the temperature of full oxidation of the Zr(C,N) and TiN phases for the ZrN, ZrCN and ZrC sample, respectively.
Coatings 11 00264 g005
Figure 6. (a) Heat flow of the Zr(C,N) samples and (b) mass gain from the thermogravimetric analysis as a function of the oxidation temperature. The arrows indicate the oxidation onset temperatures as determined by the in-situ synchrotron powder diffraction experiments.
Coatings 11 00264 g006
Figure 7. (a) Ex-situ Raman spectra and (b) ex-situ X-ray diffractograms of the ZrN, ZrCN and ZrC powdered samples oxidised at 1000 °C. (c) Phase fraction of the ZrN, ZrCN and ZrC samples oxidised at 1000 °C, measured ex-situ using a laboratory XRD at room temperature and in-situ at the synchrotron facility at 1000 °C.
Coatings 11 00264 g007
Publisher’s Note: MDPI stays neutral with regard to jurisdictional claims in published maps and institutional affiliations.