Article

Optical Evidence for the Assembly of Sensors Based on Reduced Graphene Oxide and Polydiphenylamine for the Detection of Epidermal Growth Factor Receptor

1
National Institute of Materials Physics, Laboratory of Optical Processes in Nanostructured Materials, Atomistilor Street 405A, P.O. Box MG-7, Magurele, 077125 Bucharest, Romania
2
Pro-Vitam Ltd., Muncitorilor Street 16, 520032 Sfantu Gheorghe, Romania
*
Author to whom correspondence should be addressed.
Coatings 2021, 11(2), 258; https://doi.org/10.3390/coatings11020258
Submission received: 6 January 2021 / Revised: 4 February 2021 / Accepted: 19 February 2021 / Published: 23 February 2021
(This article belongs to the Special Issue Surface Chemical Modification)

Abstract

:
Using Raman scattering and FTIR spectroscopy, new optical evidence for the assembly of sensors based on reduced graphene oxide (RGO) and polydiphenylamine (PDPA) for the electrochemical detection of the epidermal growth factor receptor (EGFR) are reported. The assembly process of the RGO sheets electrochemical functionalized with PDPA involves the chemical adsorption of 1,4-phenylene diisothiocyanate (PDITC), followed by an incubation with protein G in phosphate buffer (PB) solution and after that the interaction with EGFR antibodies solution. Taking into account the changes reported by Raman scattering and FTIR spectroscopy, a chemical mechanism of the assembling process for this sensor is proposed. The preliminary testing of the electrochemical activity of the sensors based on RGO and PDPA was reported by cyclic voltammetry.

1. Introduction

The epidermal growth factor receptor (EGFR) is a biomarker often used for many tumors in various diseases such as breast cancer, gliomas, laryngeal cancers, carcinoma, and so on [1,2]. Different methods were developed for the detection of EGFR, the most used being immunohistochemistry [3,4], enzyme-linked immunosorbent assay (ELISA), [5] and Western blotting [6]. The main platforms used until now for the EGFR detection were lab-on-chip sensors [7], biochips-based on microfluids [8], Au nanoparticles which show surface plasmon resonance [9] and label-free electrochemical immunosensors [10]. In comparison with this progress, a new platform based on reduced graphene oxide (RGO) electrochemical functionalized with polydiphenylamine (PDPA) is proposed to be used for the EGFR detection in this work. These platforms are considered more attractive in comparison with the Au nanoparticles or Au plate, as a consequence of the fact that it is no longer necessary to interact with cysteamine in order to generate new amine-type bonds that would later allow interaction with 1,4-phenylene diisothiocyanate (PDITC). An example which supports this is the case of the RGO sheets electrochemically functionalized with poly(5-amino-1-naphtol) [11]. Despite the greater progress made concerning the assembly of immunosensors for EGFR detection, the information concerning the optical evidence of the stages of assembling these platforms is missing. In order to overcome this limitation, in this work, we report several optical studies carried out using Raman scattering and FTIR spectroscopy concerning the assembly of RGO sheets electrochemically functionalized with PDPA in order to be used in the future for the electrochemical detection of EGFR. In this work, a short characterization of these platforms is shown by cyclic voltammetry. Our results open up new perspectives for highly reproducible platforms for clinical screening of cancer tumors.

2. Materials and Methods

The main chemical compounds used in this study were: diphenylamine (DPA), H4SiW12O40 xH2O, HCl, graphite, dimethylformamide (DMF), ethanol, protein G, PDITC, EGFR antibody, EGFR antigen, ethanolamine, Tween 80, Na2HPO4, and NaH2PO4, all purchased from Sigma-Aldrich (St. Louis, MO, USA). Screen-printed carbon electrodes (SPCE) modified with RGO (SPCE-RGO) were purchased from Methrohm DropSens (Herisau, Switzerland). The configuration of SPCE-RGO consists of: (i) a working electrode, which in our case corresponds to the RGO sheets deposited onto carbon electrode; (ii) a counter electrode from carbon; and (iii) reference electrode from Ag, which in fact is a pseudoreference electrode that shows a shift in potential of −131 mV in comparison with the classical reference electrode Ag/AgCl. Electrochemical functionalization of SPCE-RGO was carried out according to Ref. [12]. Briefly, this involved using a semi-aqueous solution of 2 × 10⁻² M DPA and 1 M HCl in DMF:H2O = 1:1 (volumetric ratio) in the presence of 5 × 10⁻³ M H4SiW12O40. The electrochemical functionalization of SPCE-RGO with PDPA doped with the H4SiW12O40 heteropolyanions was carried out by cyclic voltammetry, in the potential range of +100 to +960 mV vs. SCE. After recording 20 cyclic voltammograms onto the SPCE-RGO surface, a platform of the type SPCE-RGO covalently functionalized with PDPA doped with the H4SiW12O40 heteropolyanions (SPCE-RGO/PDPA) was produced. The cyclic voltammograms were stopped at +960 mV vs. SCE.
The assembling process of the RGO sheets electrochemically functionalized with PDPA for the electrochemical detection of EGFR was carried out in four steps. In the first step, the interaction of the SPCE-RGO/PDPA platform with 0.5, 1, 2, and 4 mg mL−1 PDITC in the ethanol for 20 min was carried out in order to obtain SPCE-RGO/PDPA modified with PDITC (SPCE-RGO/PDPA-PDITC). To eliminate the excess PDITC, the SPCE-RGO/PDPA-PDITC platform was washed four times with 5 mL PB solution with a pH equal to 7.4. In the second step, the SPCE-RGO/PDPA-PDITC platform was incubated with 15 µg mL−1 protein G in PB solution with a pH equal to 8.5, for 1 h. In order to remove the unbound protein G on the SPCE-RGO/PDPA-PDITC-G platform, a rinse with 0.1% Tween in PB solution with the same pH (10 mL) was performed. In the third step, the deactivation of the thiocyanate groups of the SPCE-RGO/PDPA-PDITC-G platform was carried out by their immersion in a solution of ethanolamine (0.1 M), for 30 min, and then washed with the PB solution with a pH of 8.5. In the fourth step, the SPCE-RGO/PDPA-PDITC-G platform interacted with a solution of EGFR antibodies (15 µg mL−1) in the PB solution with a pH equal to 8.5. After 45 min., the SPCE-RGO/PDPA-PDITC-G-EGFR antibody platform was stored at a temperature of 4 °C and then incubated with 1 µg mL−1 EGFR antigen solution with a pH equal to 7.4 for 1 h. Before testing the SPCE-RGO/PDPA-PDITC-G-EGFR antibodies/EGFR platforms in the presence of the [Fe(CN6]3−/[Fe(CN)6]4− solution, a rinse of these with PB solution (10 mL, pH 7.4) was performed.
The electrochemical functionalization of SPCE-RGO with PDPA, as well as the testing of the SPCE-RGO/PDPA-PDITC-G-EGFR antibodies/EGFR platforms in the presence of the [Fe(CN6]3−/[Fe(CN)6]4− sample, were recorded with a potentiostat/galvanostat Voltalab 80 model, purchased from Radiometer Analytical (Lyon, France).
The Raman spectra of the SPCE-RGO functionalized with PDPA platform and its evolution during the assembling process were recorded with a Raman spectrophotometer, T64000 model, from Horiba Jobin Yvon (Edison, NJ, USA), which was endowed with an Ar laser (excitation wavelength of 514 nm). Complementary studies were performed with a FT Raman spectrophotometer, MultiRam model, from Bruker (Billerica, MA, USA), which was endowed with a YAG:Nd laser (excitation wavelength of 1064 nm). In the case of all Raman spectra, a baseline operation was applied.
The infrared (IR) spectra of the SPCE-RGO functionalized with PDPA platform and its evolution during the assembling process were recorded with a FTIR spectrophotometer, Carry 600 series, from Agilent (Santa Clara, CA, USA).

3. Results and Discussion

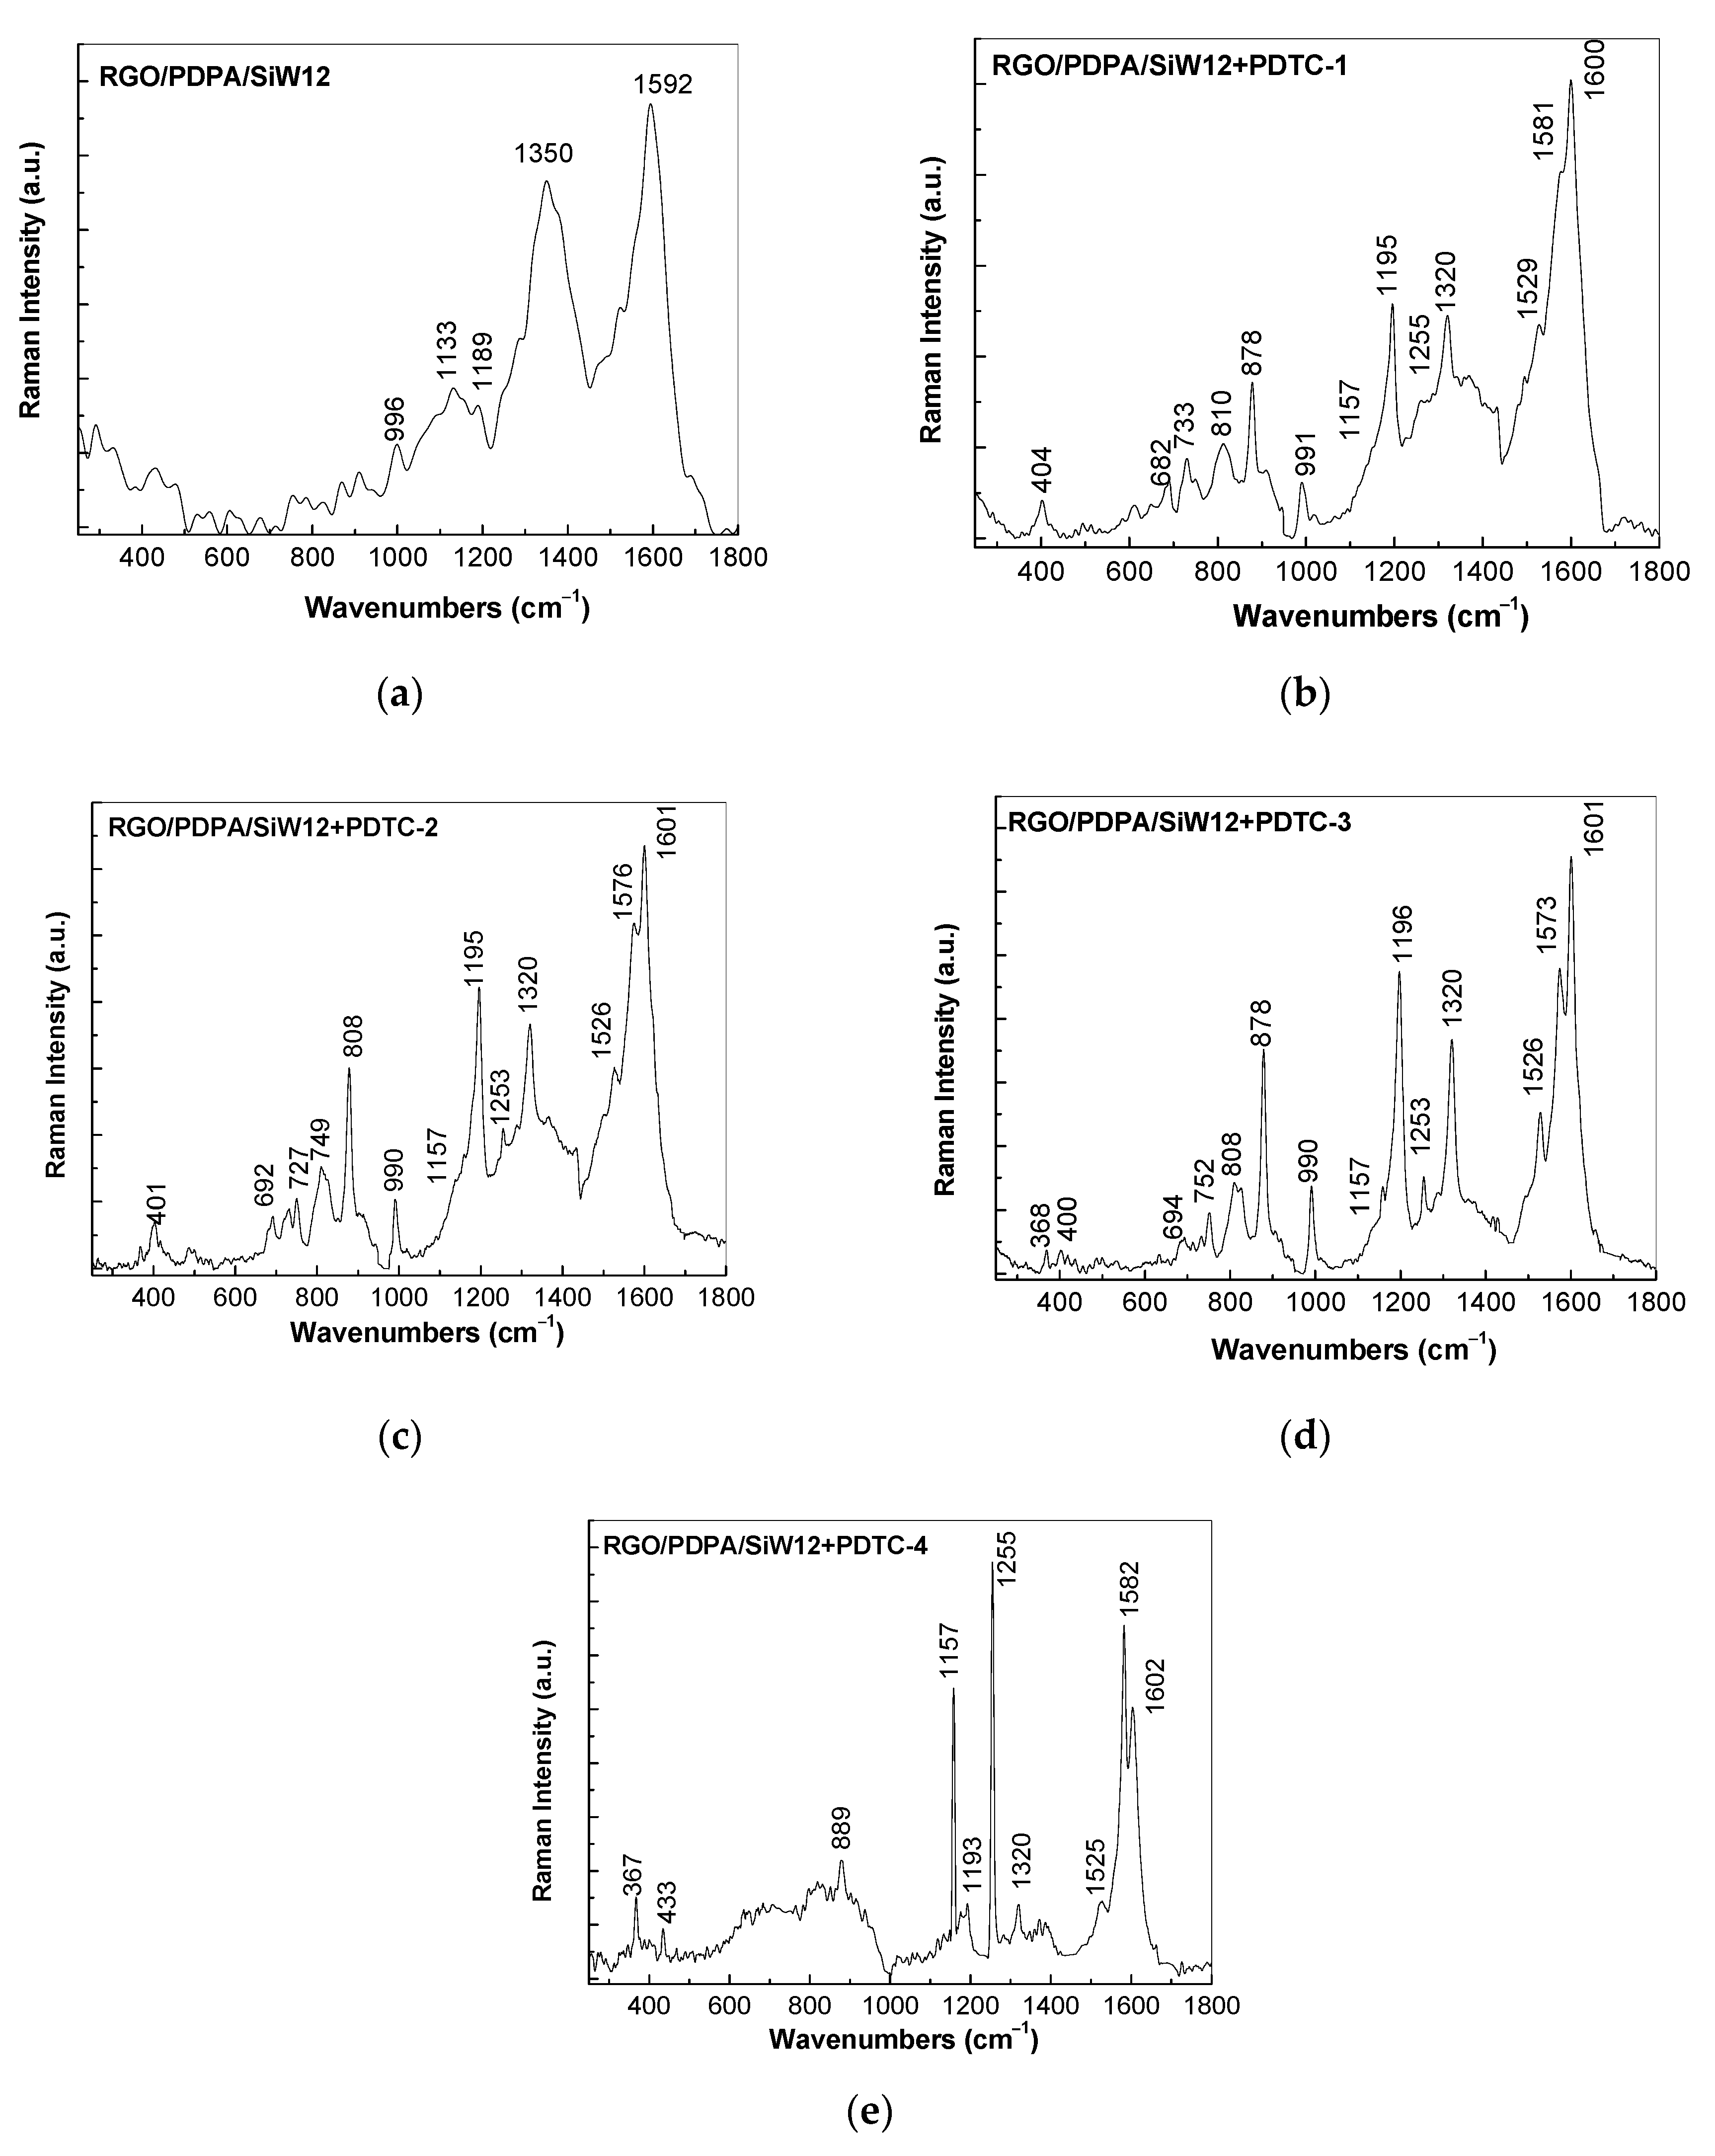
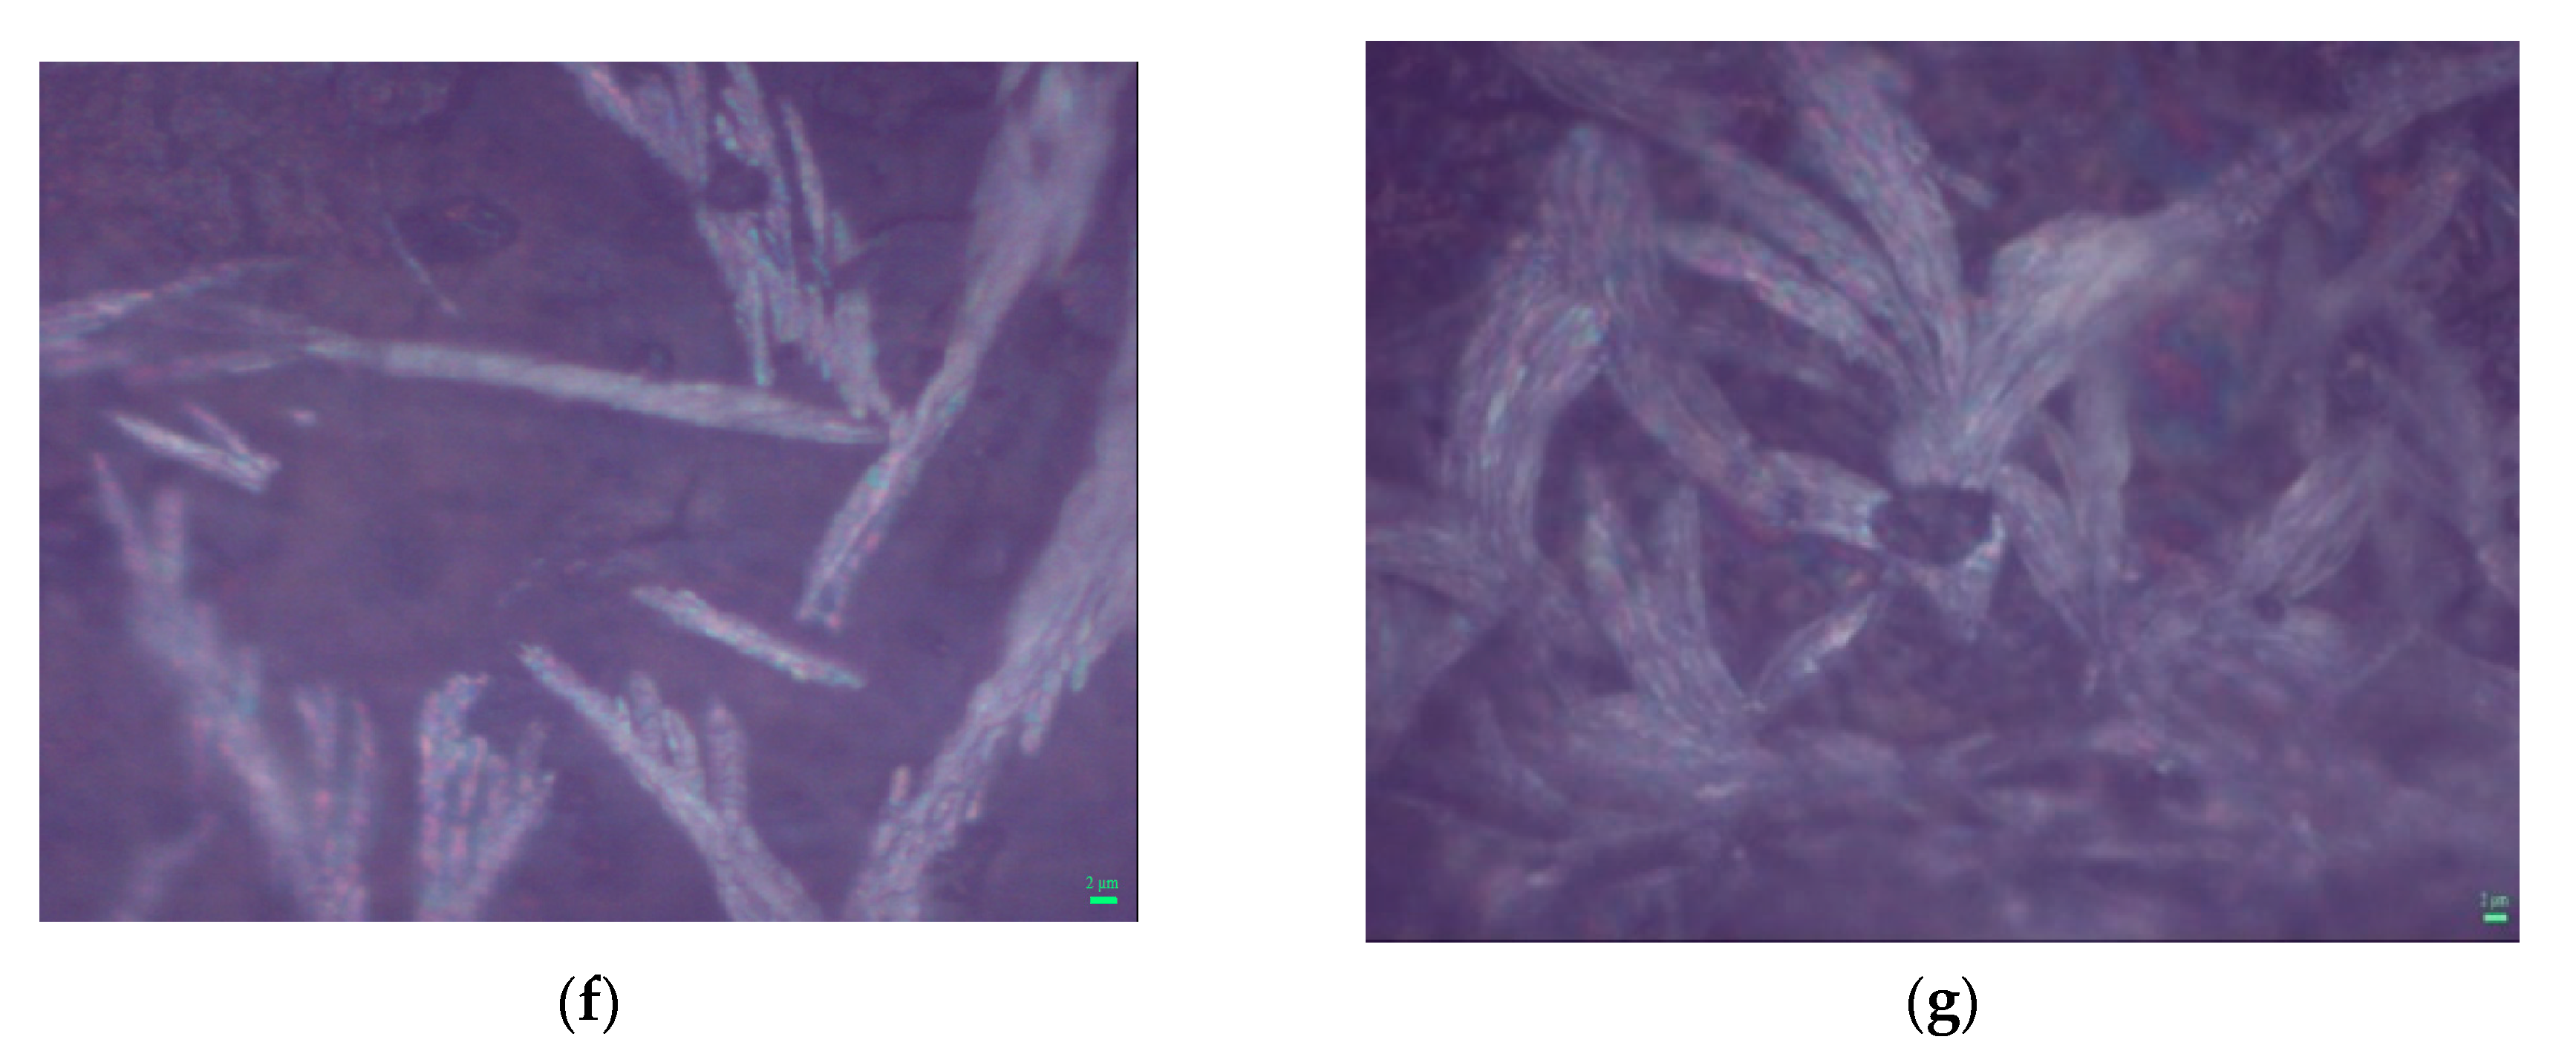
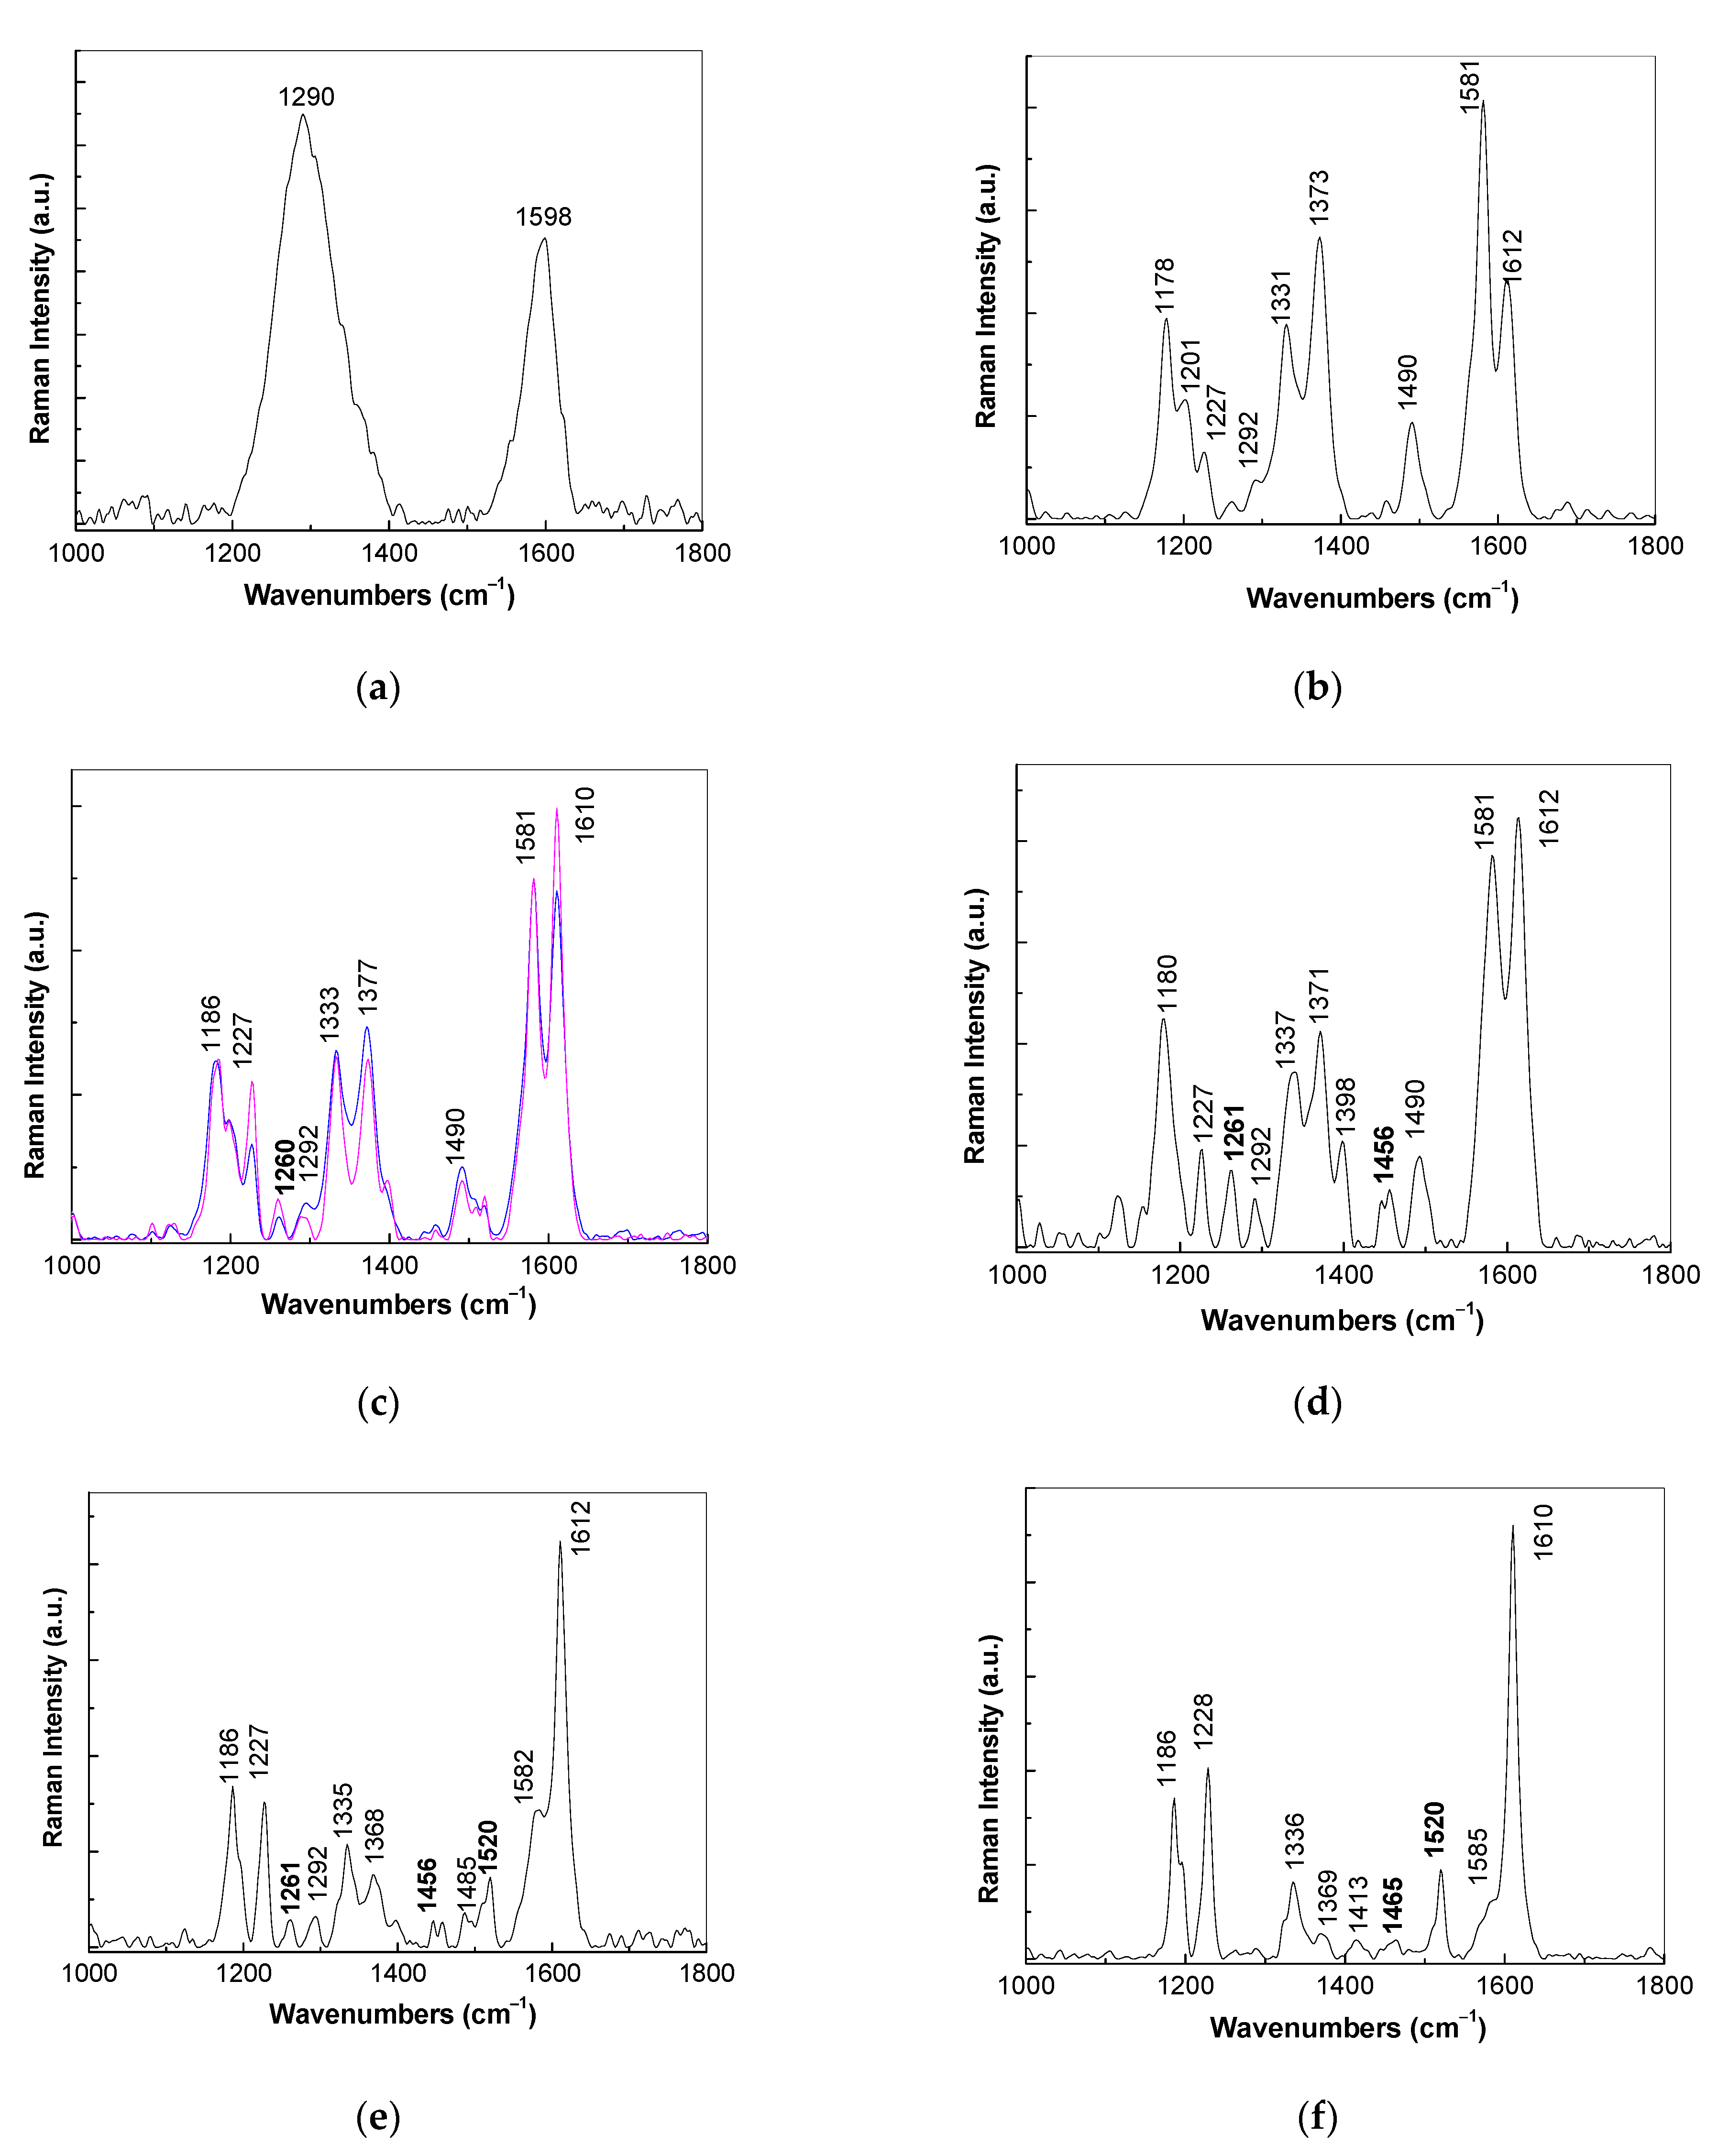
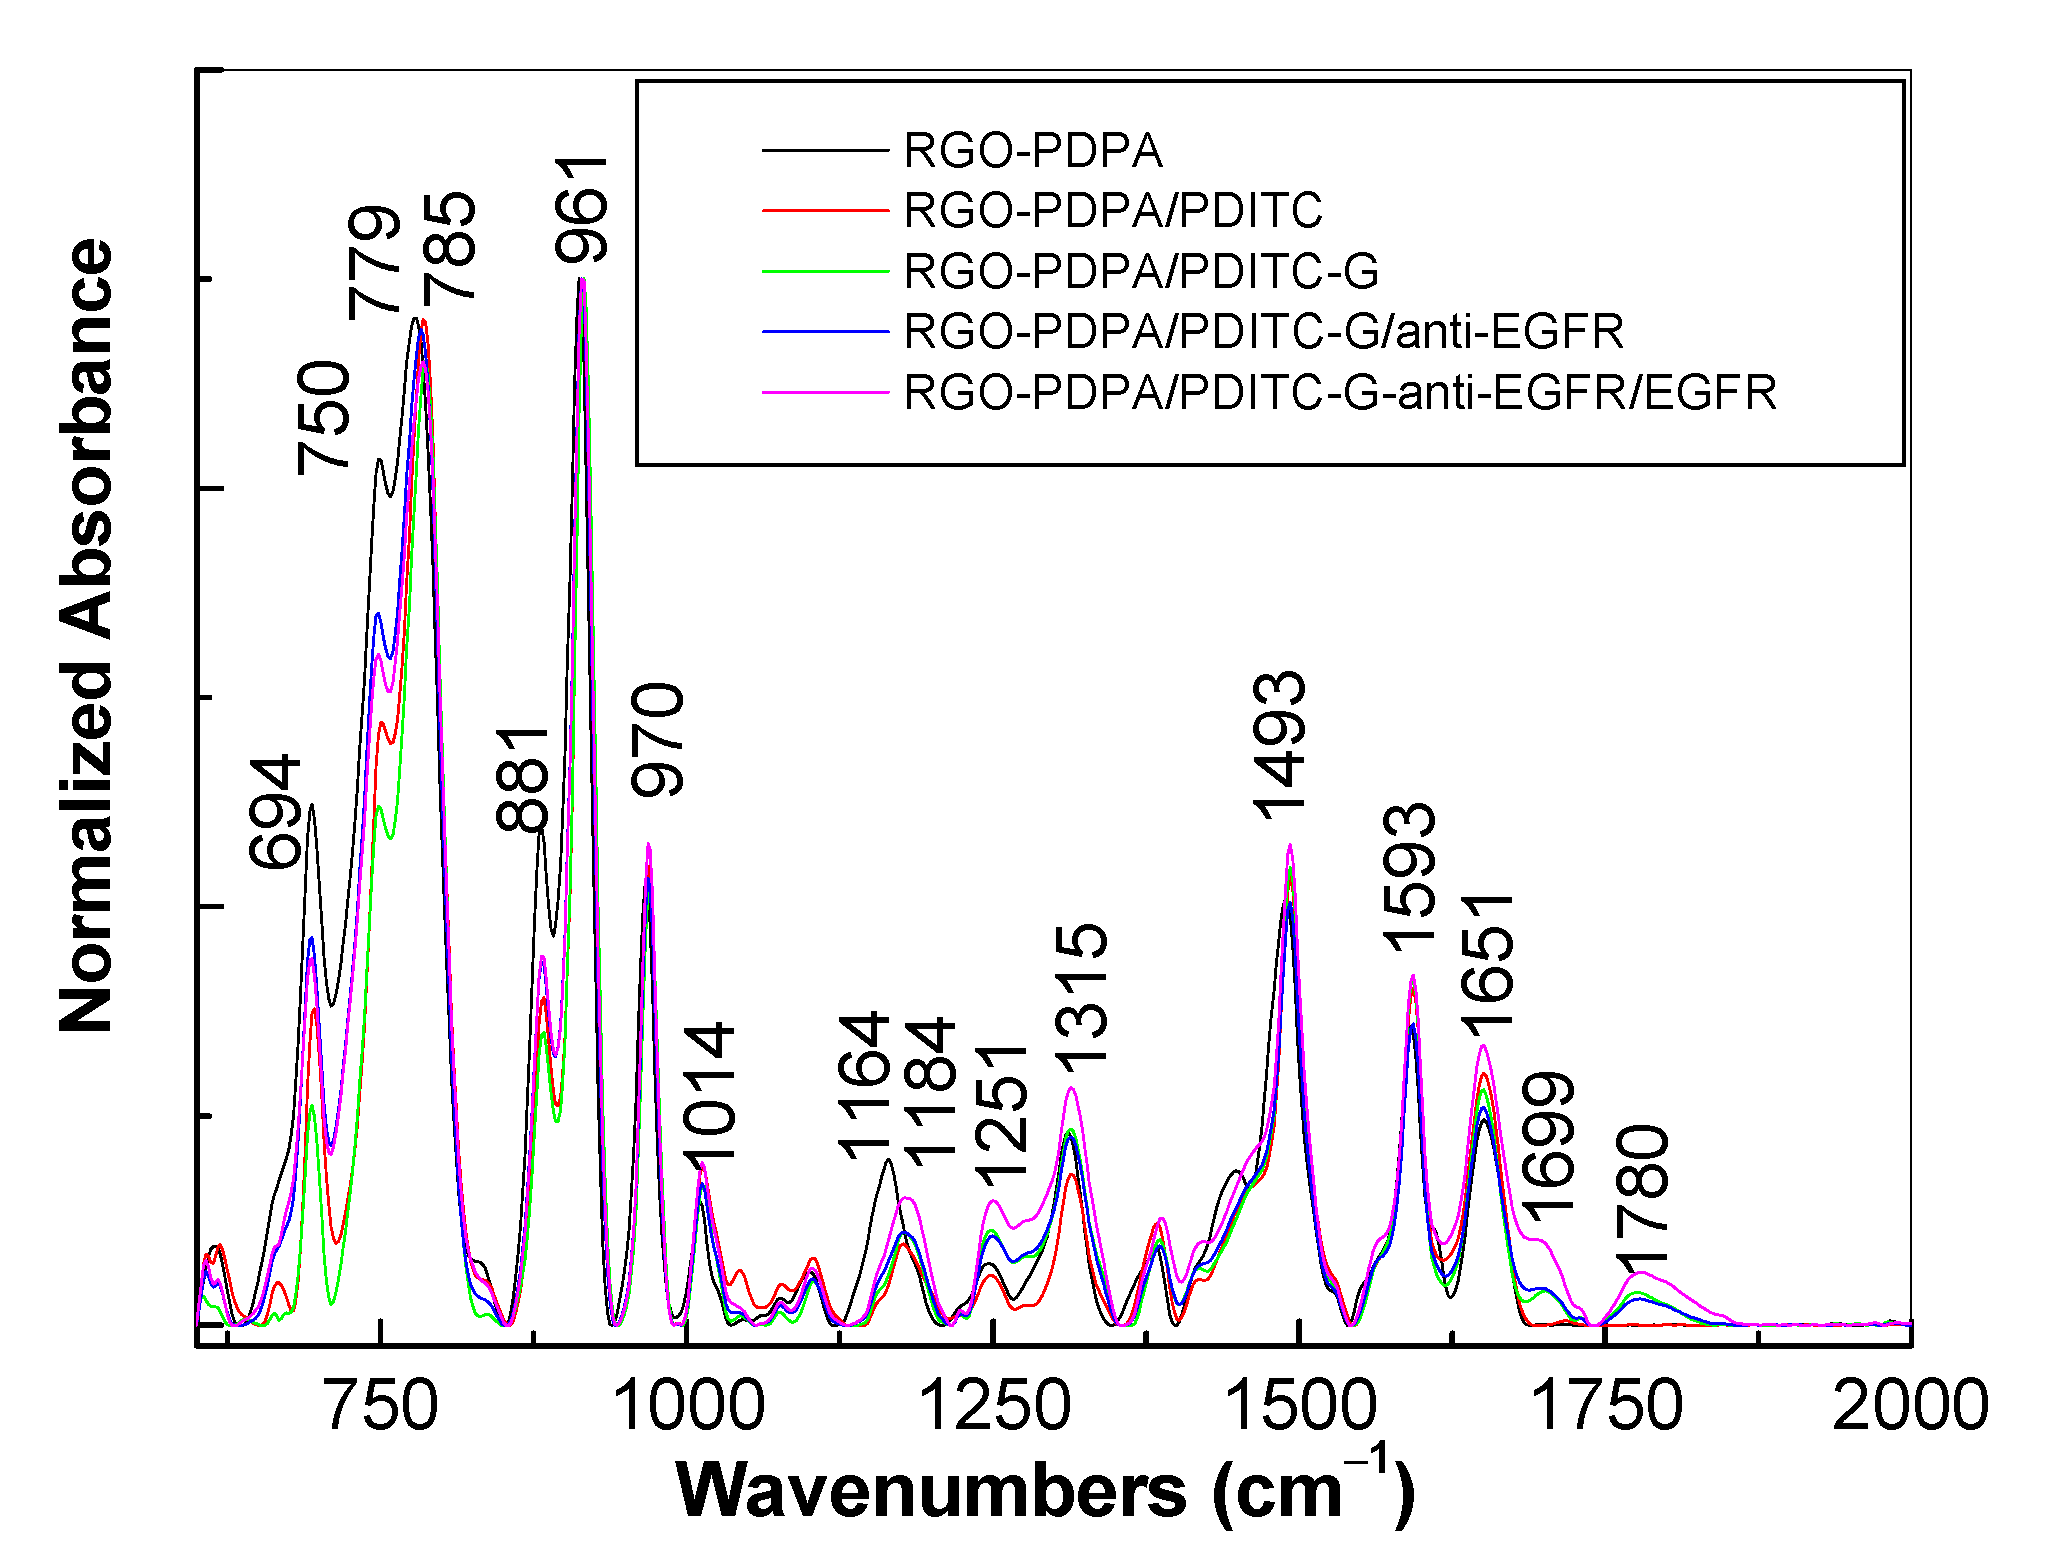
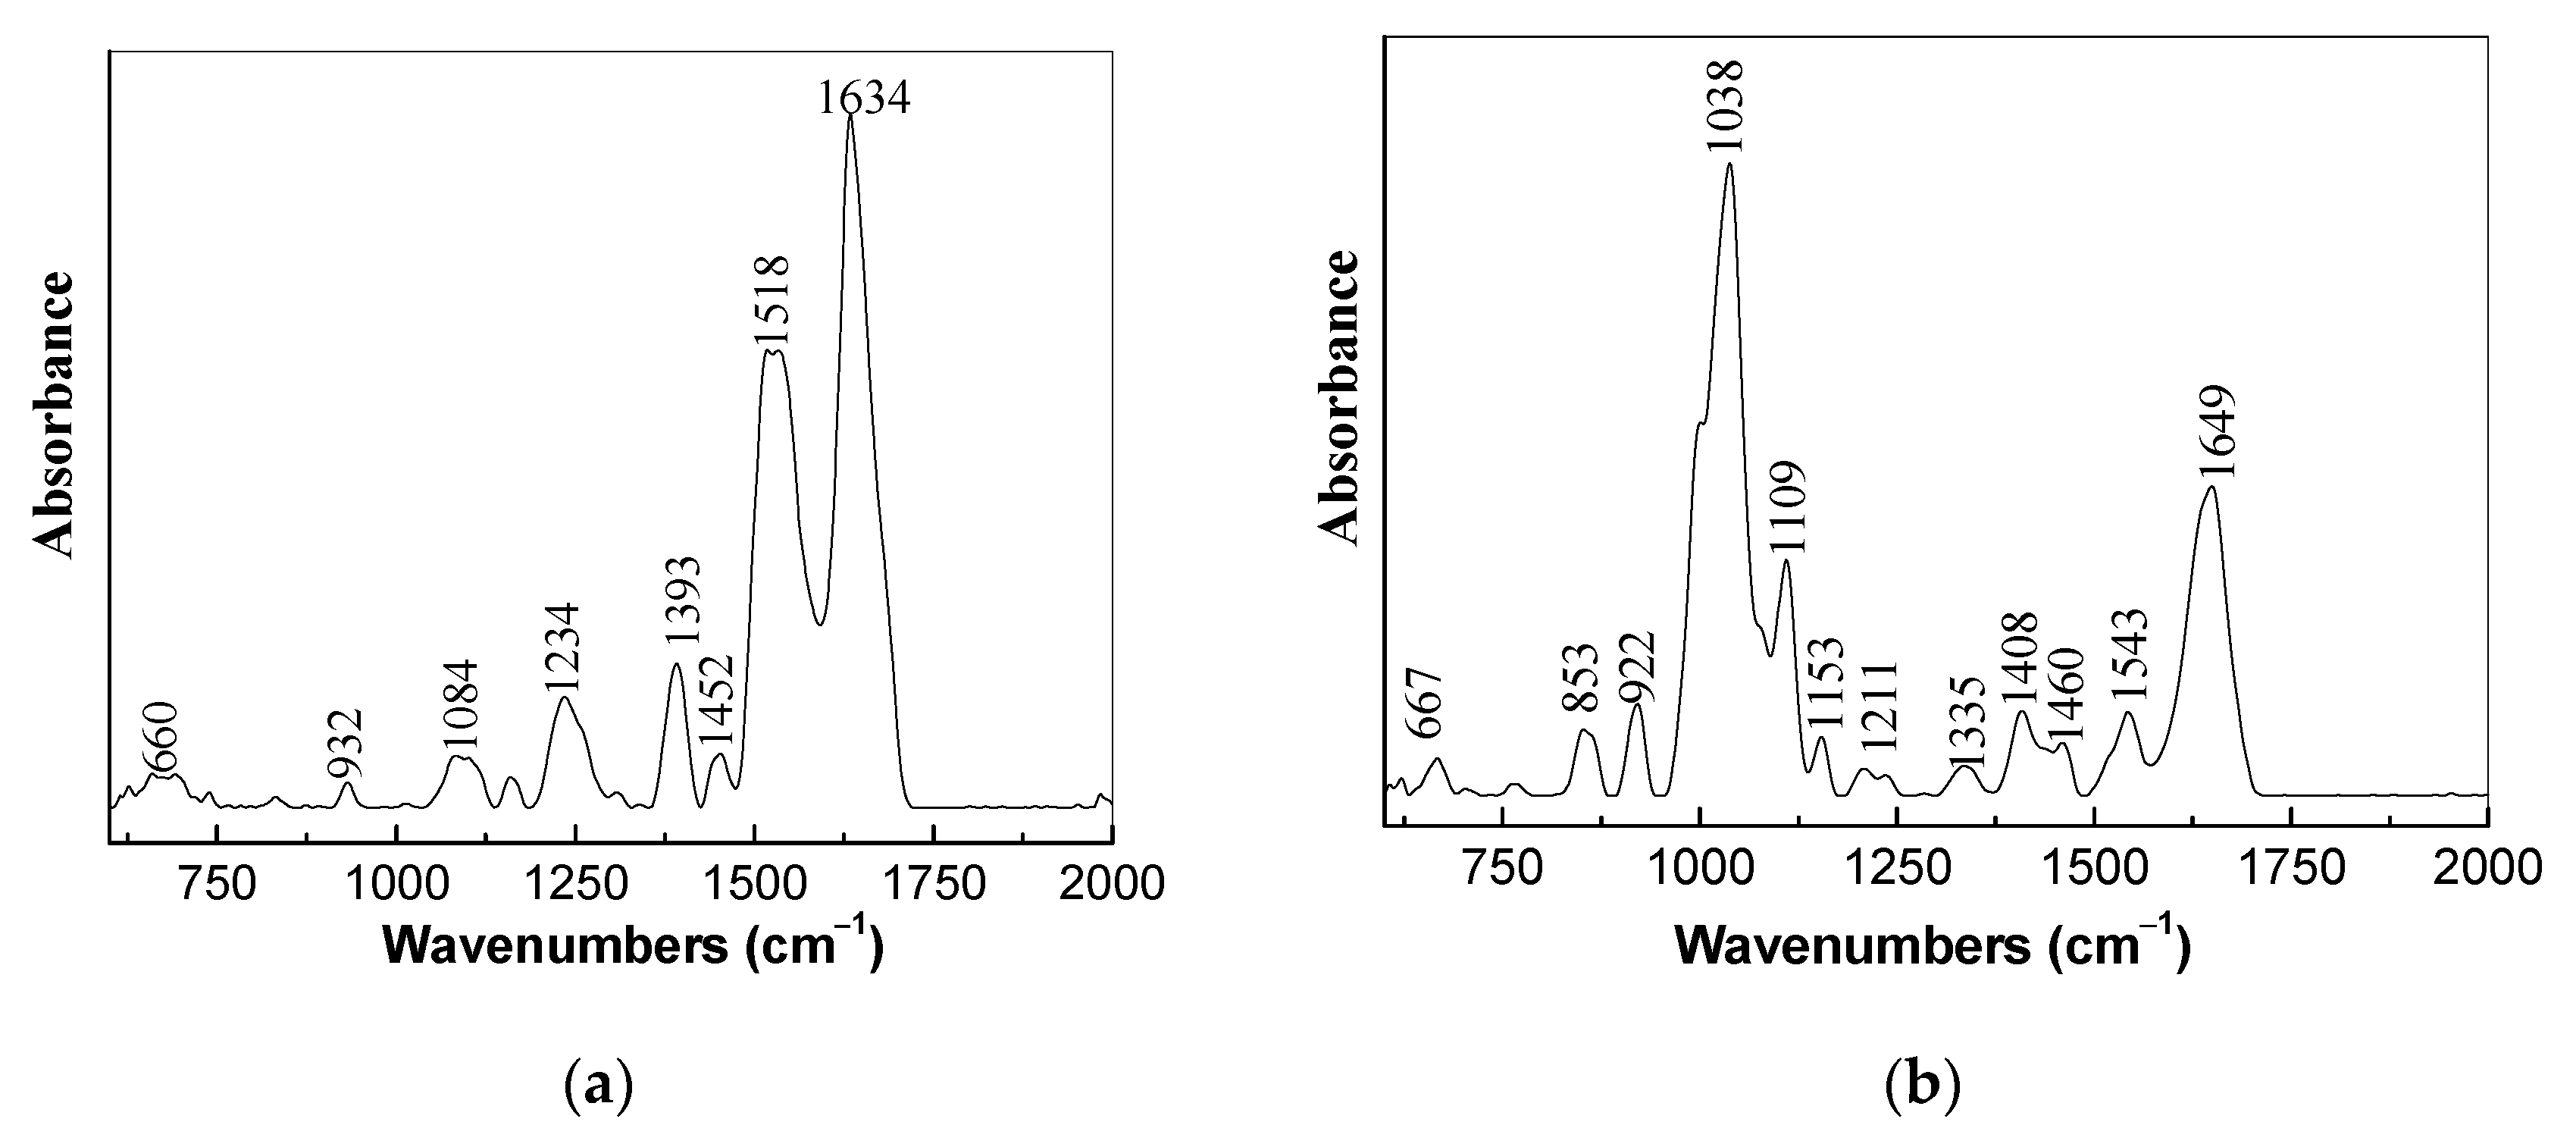
3.1. Optical Evidences by Raman Scattering and FTIR Spectroscopy Studies Concerning the Assembling of the Sensorial Platforms for EGFR Detection

Figure 1a shows the Raman spectrum of the SPCE-RGO/PDPA platform, which is characterized by two intense bands with the maximum at 1592 and 1350 cm−1 that are accompanied of other two Raman lines of low intensity at 1176, 1133, and 996 cm−1.
As shown in our previous article [13], the RGO Raman spectrum at an excitation wavelength of 514 nm is characterized by two lines at 1349 and 1573 cm−1, these being assigned to the graphitic lattice defects and E2g in-plane phonon in the Brillouin zone G point [14]. According to our previous studies, the main Raman lines of PDPA in a doped state were reported to be localized at 1176, 1342, 1367, 1492, 1585, and 1613 cm−1, these being assigned to the vibrational modes C–H bending in the benzene ring, C–N in the N,N’-diphenyl benzidine radical cation, C=N stretching, C–C stretching in the quinoid ring + C–C stretching in the benzene ring, and C–C stretching in benzene ring + C–H bending in benzene ring, respectively [15,16]. The Raman line at 1592 cm−1 in Figure 1a, confirms the presence of PDPA on the RGO sheet’s surface. The Raman line at 996 cm−1 (Figure 1a) belongs to the vibrational modes of W=O in the H4SiW12O40 [17]. The up-shift of the Raman line assigned to the C–H bending vibrational mode in the benzene rings of the polymer from 1176 to 1189 cm−1 can be explained if we accept that a covalent functionalization process of the RGO sheets with conjugated polymer takes place, when the steric hindrance effects are induced in the PDPA macromolecular chain. A puzzling fact is the presence of the Raman line at 1133 cm−1 (Figure 1a), which is located not far from the Raman line from 1150 cm−1 assigned to the vibrational mode of C–H in-plane bending of the polymers having triphenylamine as repeating units [18]. The Raman spectrum of PDITC, at the excitation wavelength of 514 nm, shows lines with peaks at 1157, 1257, 1583, and 1603 cm−1, attributed to the vibrational modes of the C–S bending, C–H in the benzene ring + C–C stretching + C–N stretching, C=C+C–C stretching in the benzene ring, and C–C stretching + C–H bending in the benzene ring, respectively [19,20,21,22,23]. The interaction of the SPCE-RGO/PDPA with the PDITC solutions with increasing concentration leads to the following changes in the Raman spectra of Figure 1: (i) an up-shift of the Raman lines from 1592 and 1189 cm−1 to 1601 and 1196 cm−1, respectively; (ii) a down-shift of the Raman line from 1350 to 1320 cm−1; (iii) as the PDITC concentration increases from 0.5 to 4 mg mL−1, a change in the values between the Raman lines peaked at 1157 and 1195–1196 cm−1, respectively, (I1157/I1193–1196) as well as those at 1255 and 1320 cm−1 (I1255/I1320) vary from 0.26 and 0.41 (Figure 1b) to 4.27 and 5 (Figure 1e), respectively. These changes indicate a chemical interaction of SPCE-RGO/PDPA with PDITC, which, according to Figure 1f,g, involve the appearance of one-dimensional structures.
Similar vibrational changes are seen in the Raman spectra recorded at the excitation wavelength of 1064 nm (Figure 2).
In this last case, we observe that:
(a) the Raman lines of the RGO sheets peaked at 1290 and 1598 cm−1, with the ratio between the intensities of the two bands being equal to 1.42 (Figure 2a);
(b) after the recording of 20 cyclic voltammograms onto the SPCE-RGO surface, the SPCE-RGO/PDPA platform is characterized by the intense Raman lines peaking at 1178, 1331, 1373, 1490, 1581, and 1612 cm−1 belonging to PDPA doped with the H4SiW12O40 heteropolyanions and two Raman lines of low intensity at 1227 and 1292 cm−1 belonging to the vibrational mode of the C–N stretching of PDPA and the D band of the RGO sheets (Figure 2b);
(c) the interaction of the SPCE-RGO/PDPA platform with PDITC leads to: (c1) a gradual increase in the intensity of the Raman lines peaked at 1227 and 1610 cm−1 simultaneously with an up-shift of the Raman line from 1178 to 1186 cm−1, (c2) the change in the ratio between the intensities of the Raman lines at 1178–1186 and 1227 cm−1 (I1178–1186/I1227) from 3.19 (Figure 2b) to 1.14 (magenta curve in Figure 2c) as well as those at 1581 and 1612–1610 cm−1 (I1581/I1612–1610) from 1.75 (Figure 2b) to 0.84 (magenta curve in Figure 2c), and (c3) the appearance of the Raman line at 1260 cm−1; all these changes indicate a chemical adsorption of PDITC on the surface of the SPCE-RGO/PDPA platform, which will be labeled in the following as the SPCE-RGO/PDPA-PDITC platform;
(d) the interaction of the SPCE-RGO/PDPA-PDITC platform with protein G induces in the Raman spectrum shown in Figure 2d the appearance of a new line at 1456 cm−1 simultaneously with an up-shift of the Raman line assigned to the vibrational mode of C–N in the N,N’-diphenyl benzidine radical cation, from 1331 to 1337 cm−1;
(e) the interaction of the SPCE-RGO/PDPA-PDITC-G platform with the EGFR antibodies highlights an increase in the intensity of the Raman line at 1227 cm−1 and a decrease in the intensity of the Raman lines situated in the spectral range 1300–1400 cm−1, and a change in the ratio between the Raman lines at 1582 and 1612 cm−1 (I1582/I1612) of 0.34 (Figure 2e); in addition, these interactions induce an increase in the relative intensity of the Raman line localized in the spectral range 1000–1200 cm−1 from 0.51 (Figure 2c) to 0.6 (Figure 2d) and 1.17 (Figure 2e) and a down-shift of the Raman line from 1490 cm−1 (Figure 2b,c) to 1485 cm−1 (Figure 2e); and
(f) after the incubation of the SPCE-RGO/PDPA-PDITC-G-EGFR antibody platform with EGFR antigen, an additional decrease in the intensity of the Raman lines localized in the spectral range 1300–1400 cm−1 accompanied by an increase in the intensity of the Raman line at 1520 cm−1, as well as a change in the I1582/I1612 ratio at 2.74 and the appearance of a new Raman line at 1465 cm−1, occur (Figure 2f).
The new Raman lines reported in Figure 2 peaking at 1260, 1456, 1465, and 1520 cm−1 belong to PDITC, protein G, EGFR antibodies, and EGFR, as shown in the Raman spectra recorded at the excitation wavelength of 1064 (Figure 3).
In this context, we note that: (i) down-shift of the Raman line from 1490 cm−1 (Figure 2b,c) to 1485 cm−1 (Figure 2e) can be explained, taking into account both the presence of Raman line of protein G at 1456 cm−1 (Figure 3b) and its chemical interaction with the SPCE-RGO/PDPA-PDITC; and (ii) new Raman line of EGFR at 1465 cm−1, assigned to the vibrational mode of the CH2 scissoring [24] (Figure 2f), confirms a chemical adsorption of a part the EGFR antibodies and EGFR antigen onto the SPCE-RGO/PDPA-PDITC-G platform surface. This can be explained by an incomplete deactivation of the thiocyanate groups due to steric effects induced by the presence of protein G on the surface. The remaining thiocyanate groups can anchor to the surface the anti-EGFR antibodies that get non-covalently attached to protein G, and similarly the EGFR antigen that gets caught by the anti-EGFR antibodies.
Additional information is obtained by FTIR spectroscopy, as shown in Figure 4. The main IR bands of the SPCE-RGO/PDPA platform peak at 694, 750, 779, 881, 916, 970, 1014, 1164, 1251, 1315, 1493, 1593, and 1651 cm−1, being assigned to the following vibrational modes: inter-ring deformation, ring deformation, W–Oc–W (octahedral edge-sharing), C–H in-plane bending of the quinoid ring (Q), W–Ob–W (octahedral corner-sharing), W–Od (terminal), Si–Oa, C–H bending in the benzene ring (B) + quinoid ring (Q), radical cation structure, Caromatic–N stretching, C–C stretching + C–H bending, C–C stretching, and –NH+=Q=Q=NH+–, respectively [19,25,26,27]. The interaction of the SPCE-RGO/PDPA platform with PDITC, protein G, EGFR antibodies, and EGFR antigen induces in Figure 4 the following changes: (i) a decrease in the absorbance of the IR bands at 694 and 750 cm−1; (ii) an up-shift of IR band from 1164 to 1184 cm−1; (iii) a gradual increase in the absorbance of the IR bands at 1251, 1315, 1593, and 1651 cm−1; and (iv) the appearance of two IR bands with maxima at 1699 and 1780 cm−1, both assigned to the C=O vibrational mode whose absorbance gradually increases as the platform interacts with protein G, EGFR antibodies, and EGFR antigen.
According to Figure 5, the IR spectrum of protein G is dominated by two IR bands at 1518 and 1634 cm−1, which were assigned to the vibrational modes C–C + C–H and C=C, respectively [28]. Other IR bands of low absorbance are remarked in Figure 5a, at 1084, 1234, and 1393 cm−1 that were attributed to the vibrational modes of bonds CH, COH and COO, respectively [28]. In the case of the EGFR antibodies, the IR bands localized at 1038–1109 and 1649 cm−1 (Figure 5b) were assigned to the vibrational mode C–O + C–H and C=O [28]. All these vibrational changes can be explained by taking into account the chemical mechanism of the assembling of these platforms shown in Scheme 1.

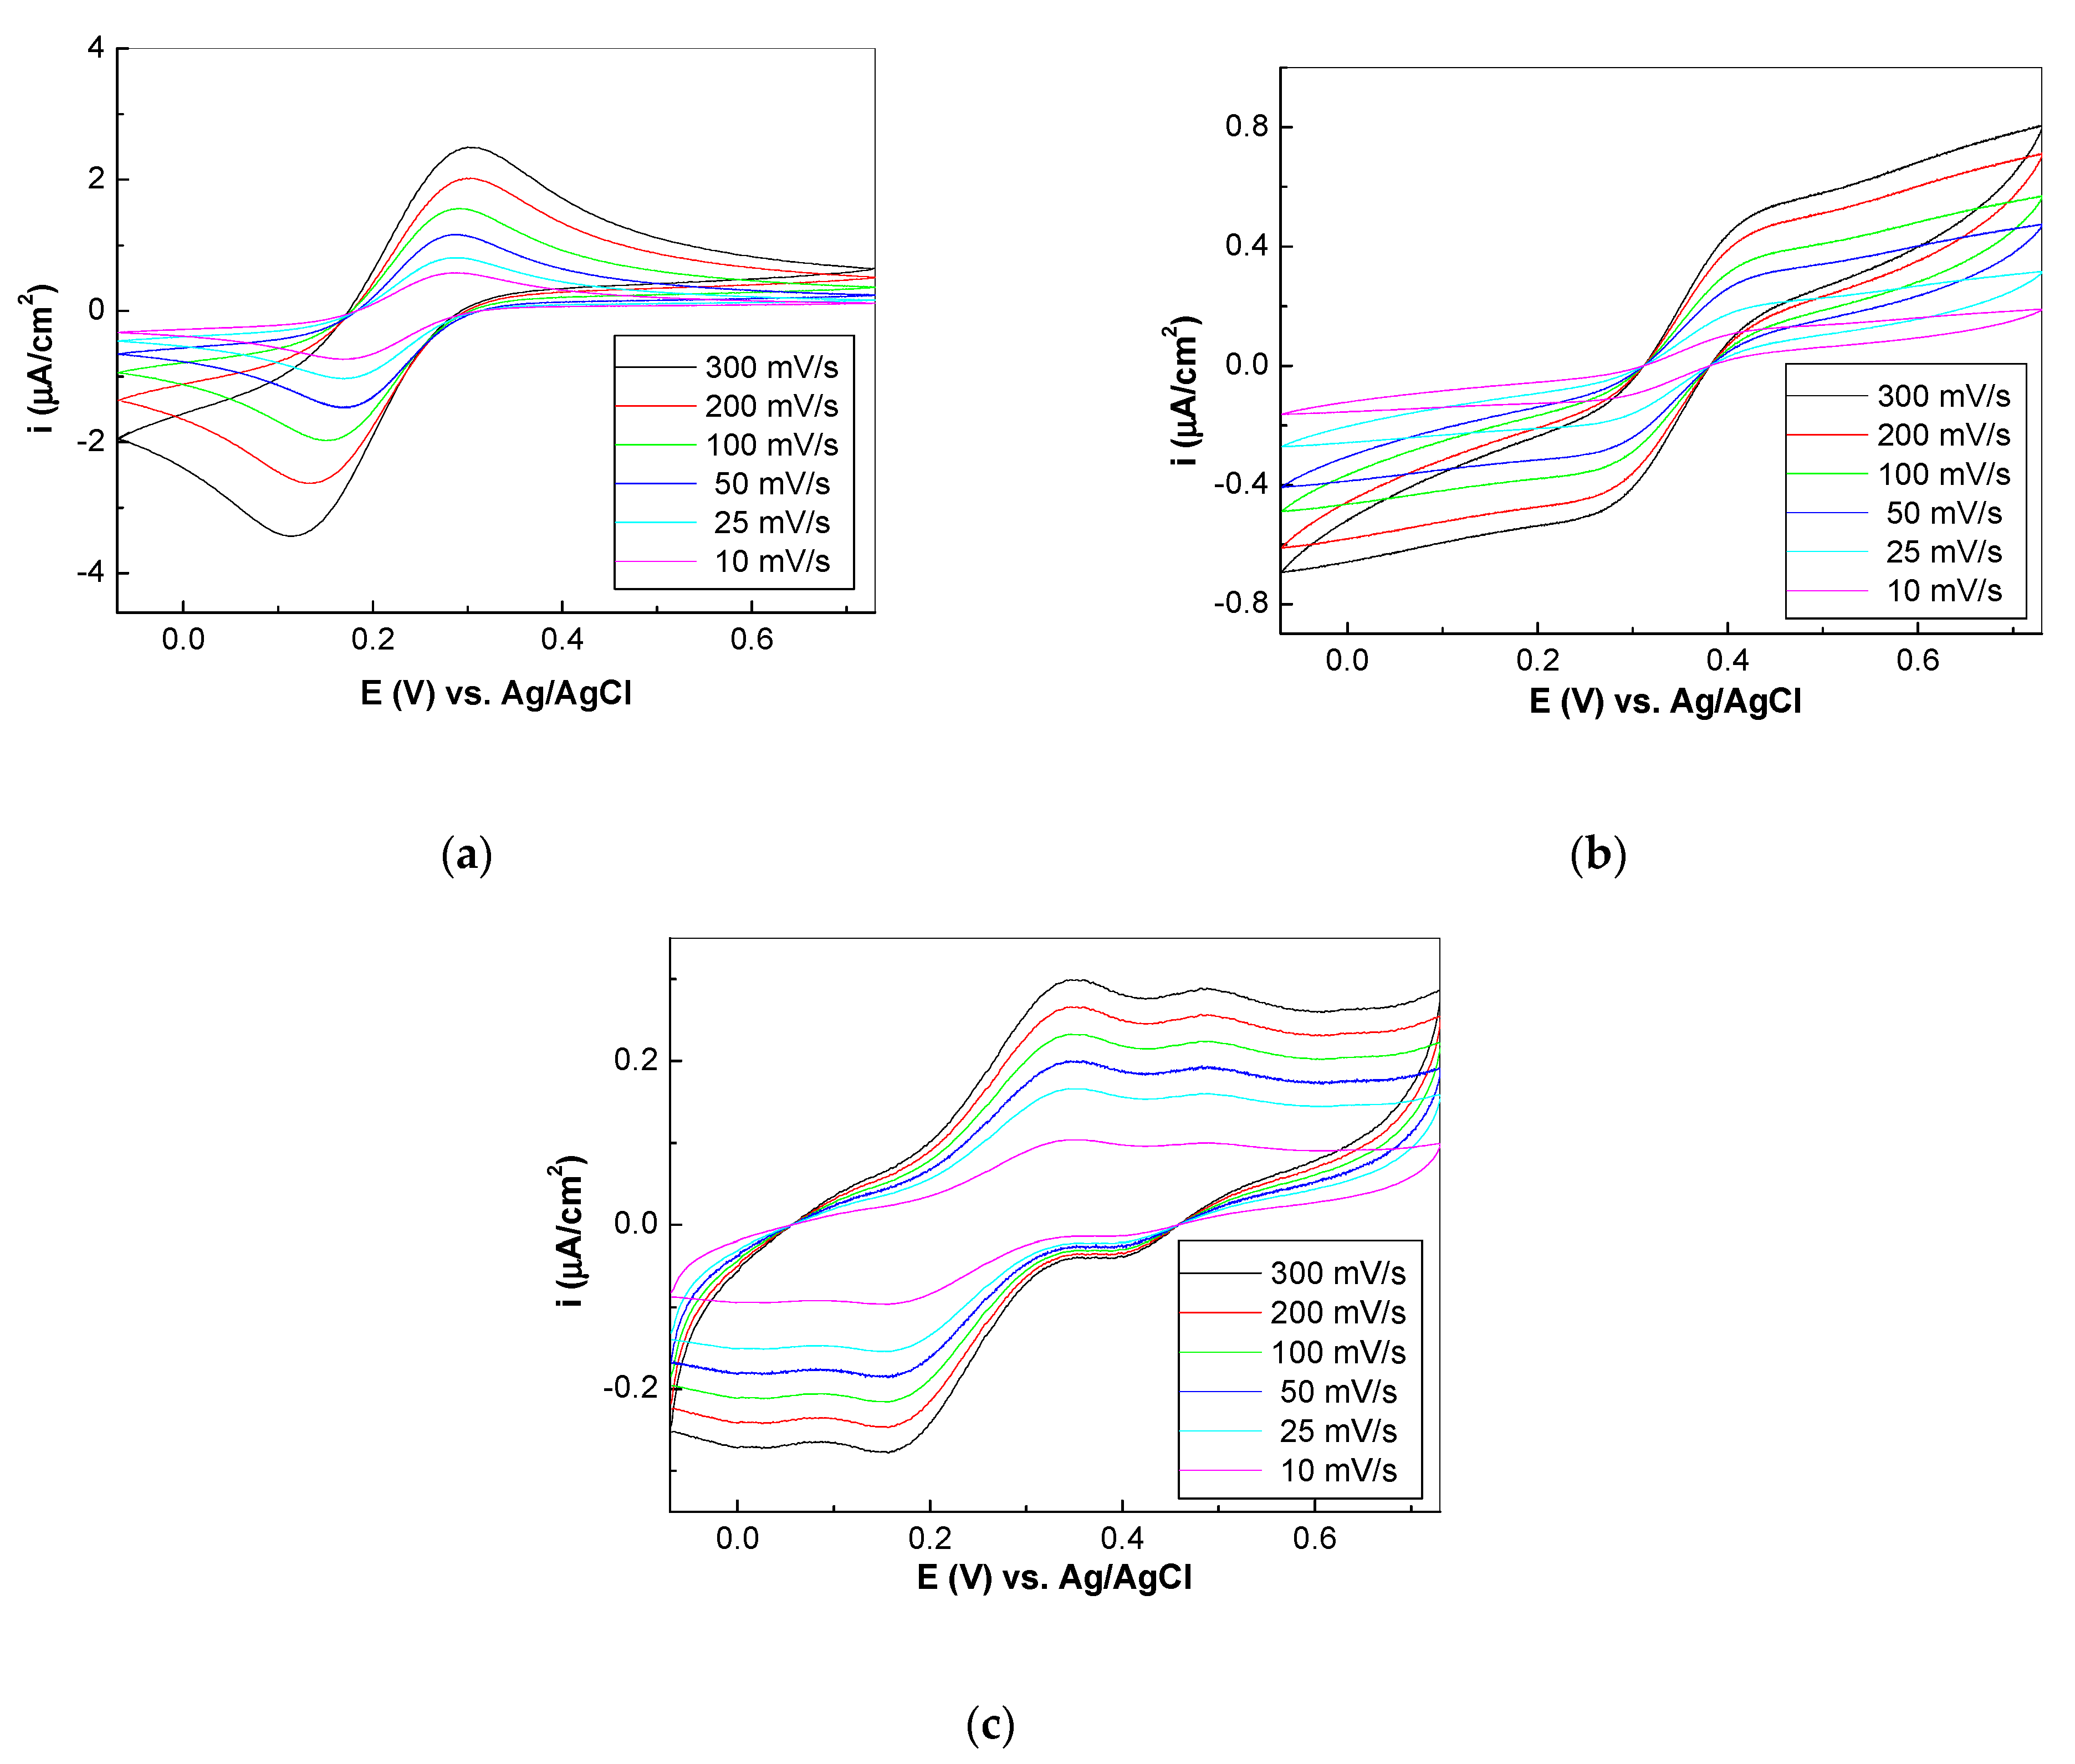
3.2. The Electrochemical Properties of the Platforms SPCE-RGO/PDPA-PDITC-G-EGFR Antibodies-EGFR

Figure 6a–c show the fifth cyclic voltammogram of the Au electrode, SPCE-RGO and SPCE-RGO/PDPA-PDITC-G-anti-EGFR/EGFR in 5 mM K3[Fe(CN)6]/K4[Fe(CN)6] solution, depending on the scan rate. The main changes in the potential of the anodic and cathodic peaks as well as their current densities are summarized in Table 1.
In the case of Au electrode, the ratio between current densities of the anodic and cathodic peaks is different from one. In the case of the electrodes SPCE-RGO, SPCE-RGO/PDPA-PDITC-G-anti-EGFR/EGFR, the values of the ratio between current densities of the anodic and cathodic peaks is ~1. Regardless of the electrode type, i.e., Au, SPCE-RGO, and SPCE-RGO/PDPA-PDITC-G-anti-EGFR/EGFR, the potential of separation of the anodic and cathodic peaks has a difference of 56.5/n, where n corresponds to the number of electrodes involved in the electrochemical process. These results indicate that at the electrode–electrolyte interface, an irreversible process occurs.
This process must to be understood by the electrostatic interaction between the positively charged amine entities of the SPCE-RGO/PDPA-PDITC-G-EGFR antibodies/EGFR platform and negative charges of [Fe(CN)6]3−/4−.

4. Conclusions

In this work, new optical evidence of the assembly process of sensors based on RGO sheets functionalized with PDPA in a doped state are reported by Raman scattering and FTIR spectroscopy. Our results allow us to conclude that:
i.
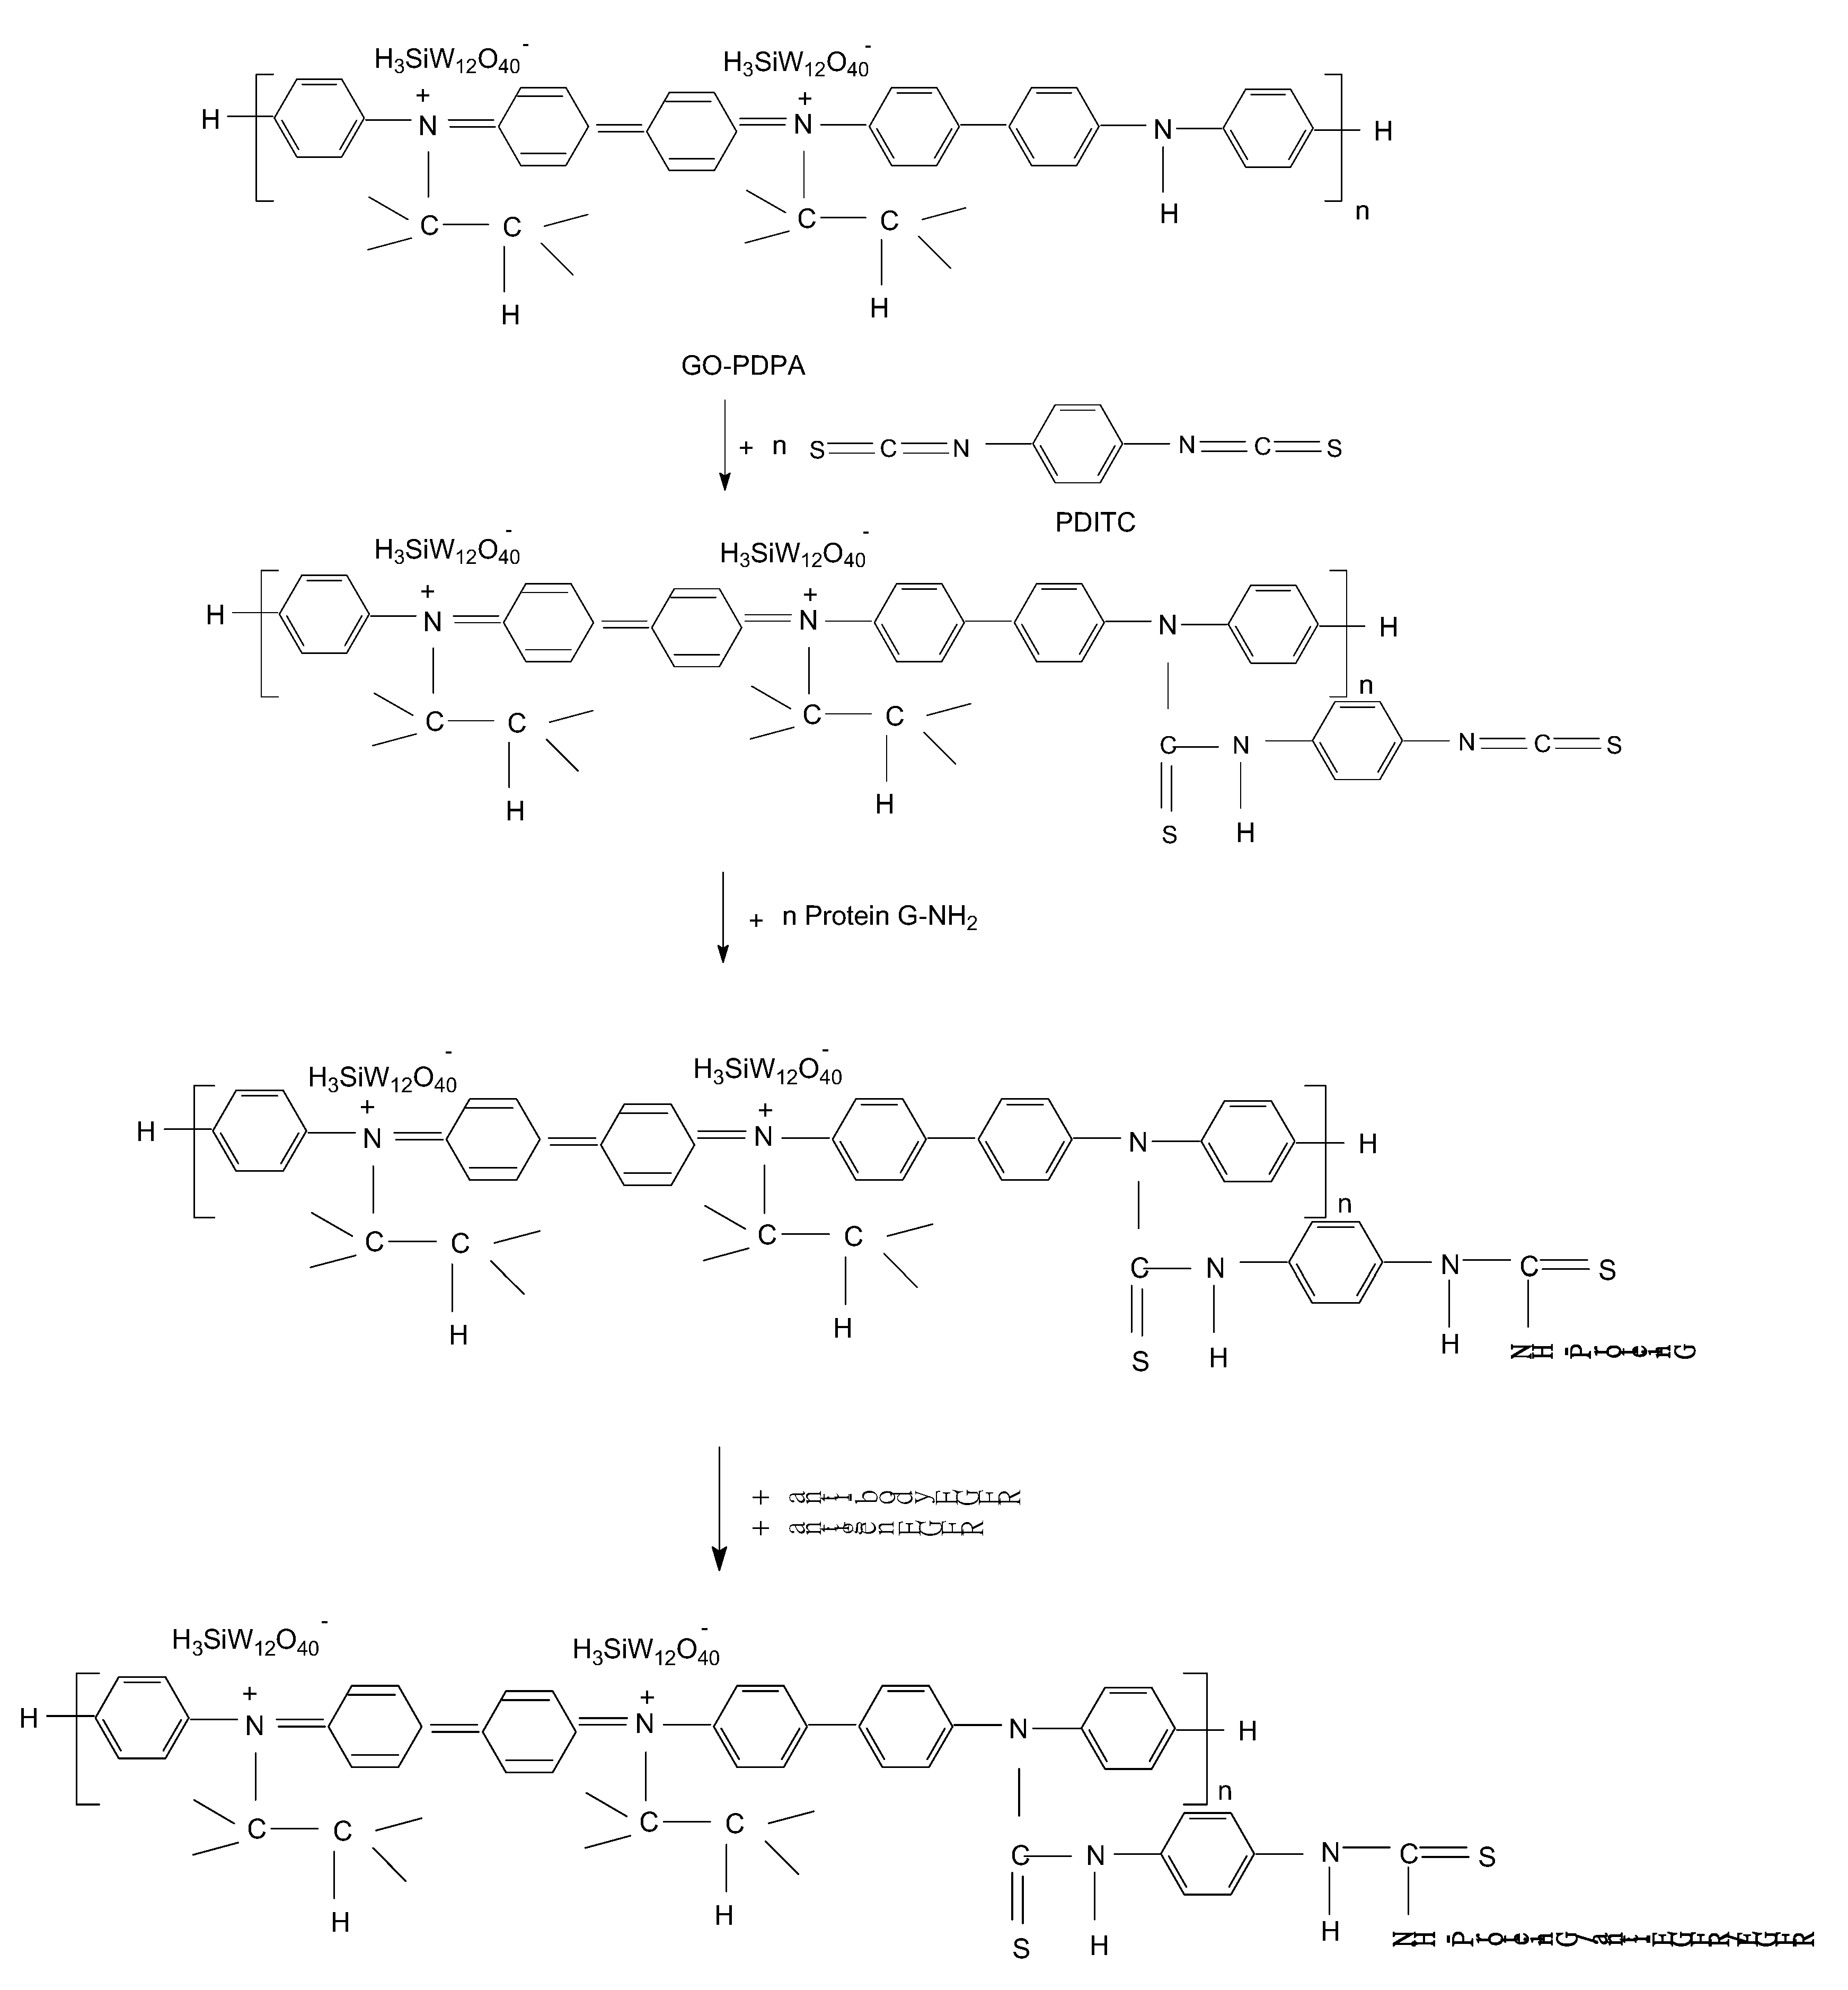
the interaction of the SPCE-RGO /PDPA platform with PDITC leads to a covalent functionalization of this platform, evidenced by an up-shift of the Raman line, from 1176 to 1189 cm−1, and the appearance of a new Raman line at 1133 cm−1;
ii.
the successive interactions of the SPCE-RGO/PDPA-PDITC with protein G, EGFR antibodies, and EGFR were highlighted by (a) new Raman lines at 1260, 1456, 1465, and 1520 cm−1 belonging to PDITC, protein G, EGFR antibodies, and EGFR, respectively, and (b) the IR spectra by the appearance of new IR bands at 1699 and 1780 cm−1; and
iii.
at the interface of the SPCE-RGO/PDPA-PDITC-G-EGFR antibodies/EGFR platform with K3[Fe(CN)6]/K4[Fe(CN)6] solution in PB with a pH equal to 7.4, the irreversible processes were reported.

Author Contributions

Conceptualization, M.B. and S.N.F.; investigation, M.B. and M.D.; writing—original draft preparation, M.B. and S.N.F.; writing—review and editing, M.B.; supervision, M.B. All authors have read and agreed to the published version of the manuscript.

Funding

This work was funded in the framework of a project co-funded by the European Regional Development Fund under the Competitiveness Operational Program 2014-2020 entitled “Physicochemical analysis, nanostructured materials and devices for applications in the pharmaceutical field and medical in Romania”, financing contract no. 58/05.09.2016 signed between the National Institute of Materials Physics and the National Authority for Scientific Research and Innovation as an Intermediate Body, on behalf of the Ministry of European Funds as Managing Authority for Operational Program Competitiveness (POC), sub-contract of type D, no. 2570/29.11.2017, between the National Institute of Materials Physics and Pro-Vitam Ltd.

Institutional Review Board Statement

Not applicable.

Informed Consent Statement

Not applicable.

Data Availability Statement

Samples of the SPCE-RGO /PDPA platforms are available from the authors.

Conflicts of Interest

The authors declare no conflict of interest. The funders had no role in the design of the study; in the collection, analyses, or interpretation of data; in the writing of the manuscript, or in the decision to publish the results.

References

  1. Nicholson, R.; Gee, J.; Harper, M. EGFR and cancer prognosis. Eur. J. Cancer 2001, 37, 9–15. [Google Scholar] [CrossRef]
  2. Arteaga, C.L. Epidermal growth factor receptor dependence in human tumors: More than just expression? Oncologist 2002, 7, 31–39. [Google Scholar] [CrossRef] [PubMed]
  3. Hirsch, F.R.; Dziadziuszko, R.; Thatcher, N.; Mann, H.; Wartkins, C.; Parums, D.V.; Speake, G.; Holloway, B.; Bunn, P.A.; Franklin, W.A. Epidermal growth factor receptor immunohistochemistry: Comparison of antibodies and cutoff points to predict benefit from gefitinib in a phase 3 placebo-controlled study in advanced non-small-cell lung cancer. Cancer 2008, 112, 1114–1121. [Google Scholar] [CrossRef] [Green Version]
  4. Buffet, W.; Geboes, K.P.; Dehertogh, G. EGFR-immunohistochemistry in colorectal cancer and non-small cell lung cancer: Comparison of 3 commercially available EGFR-antibodies. Acta Gastroenterol. Belg. 2008, 71, 213–218. [Google Scholar] [PubMed]
  5. Thariat, J.; Etienne-Grimaldi, M.C.; Grall, D.; Bensadoun, R.J.; Cayre, A.; Penault-Llorca, F.; Verracini, L.; Francoual, M.; Formento, J.L.; Dassonville, O.; et al. Epidermal growth factor receptor protein detection in head and neck cancer patients: A many-faceted picture. Clin. Cancer Res. 2012, 18, 1313–1322. [Google Scholar] [CrossRef] [Green Version]
  6. Pfeiffer, P.; Nexo, E.; Bentzen, S.M.; Clausen, P.P.; Andersen, K.W.; Rose, C.D. Enzyme-linked immunosorbent assay of epidermal growth factor receptor in lung cancer: Comparisons with immunohistochemistry, clinicopathological features and prognosis. Br. J. Cancer 1998, 78, 96–99. [Google Scholar] [CrossRef] [PubMed]
  7. Weigum, S.E.; Floriano, P.N.; Redding, P.N.; Yeh, S.W.; Westbrook, S.D.; McGuff, S.; Lin, H.; Miller, A.; Vllarreal, F.R.; Rowan, F.; et al. Nano-bio-chip sensor platform for examination of oral exfoliative cytology. Cancer Prev. Res. 2010, 3, 518–528. [Google Scholar] [CrossRef] [PubMed] [Green Version]
  8. Weigum, S.E.; Floriano, P.N.; Christodoulides, N.; McDevitt, J.T. Cell-based sensor for analysis of EGFR biomarker expression in oral cancer. Lab Chip 2007, 7, 995–1003. [Google Scholar] [CrossRef]
  9. El-Sayed, I.H.; Huang, X.; El-Sayed, M.A. Surface plasmon resonance scattering and absorption of anti-egfr antibody conjugated gold nanoparticles in cancer diagnostics: Applications in oral cancer. Nano Lett. 2005, 5, 829–834. [Google Scholar] [CrossRef]
  10. Vasudev, A.; Kaushik, A.; Bhansali, S. Electrochemical immunosensor for label free epidermal growth factor receptor (EGFR) detection. Biosens. Bioelectron. 2013, 39, 300–305. [Google Scholar] [CrossRef]
  11. Baibarac, M.; Daescu, M.; Socol, M.; Bartha, C.; Negrila, C.; Fejer, S.N. Influence of reduced graphene oxide on the electropolymerization of 5-amino-1-naphthol and the interaction of 1,4-phenylene diisothiocyanate with the poly(5-amino-1-naphtol)/reduced graphene oxide composite. Polymers 2020, 12, 1299. [Google Scholar] [CrossRef]
  12. Baibarac, M.; Stroe, M.; Fejer, S.N. Vibrational and photoluminescence properties of polydiphenylamine doped with silicotungstic acid heteropolyanions and their composites with reduced graphene oxide. J. Mol. Struct. 2019, 1184, 25–35. [Google Scholar] [CrossRef]
  13. Smaranda, I.; Benito, A.M.; Maser, W.K.; Baltog, I.; Baibarac, M. Electrochemical grafting of reduced graphene oxide with polydiphenylamine doped with heteropolyanions and its optical properties. J. Phys. Chem. C 2014, 118, 25704–25717. [Google Scholar] [CrossRef]
  14. Malard, L.M.; Pimenta, M.A.; Dresselhaus, G.; Dresselhaus, M.S. Raman spectroscopy in graphene. Phys. Rep. 2009, 473, 51–87. [Google Scholar] [CrossRef]
  15. Guo, Y.; Li, K.; Yu, X.; Clark, J.H. Mesoporous H3PW12O40-silica composite: Efficient and reusable solid acid catalyst for the synthesis of diphenolic acid from levulinic acid. Appl. Catal. B Environ. 2008, 81, 182–191. [Google Scholar] [CrossRef]
  16. Baibarac, M.; Baltog, I.; Lefrant, S.; Gómez-Romero, P. Polydiphenylamine/carbon nanotube composites for applications in rechargeable lithium batteries. Mater. Sci. Eng. B 2011, 176, 110–120. [Google Scholar] [CrossRef]
  17. Legagneux, N.; Basset, J.M.; Thomas, A.; Lefebvre, F.; Goguet, A.; Sa, J.; Hardacre, C. Characterization of silica-supported dodecatungstic heteropolyacids as a function of their dihydroxylation temperature. Dalton Trans. 2009, 12, 2235–2240. [Google Scholar]
  18. Kvarnström, C.; Petr, A.; Damlin, P.; Lindfors, T.; Ivaska, A.; Dunsch, L. Raman and FTIR spectroscopic characterization of electrochemically synthesized poly(triphenylamine), PTPA. J. Solid State Electrochem. 2002, 6, 505–512. [Google Scholar] [CrossRef]
  19. Quillard, S.; Louarn, G.; Lefrant, S.; MacDiarmid, A.G. Vibrational analysis of polyaniline—a comparative study of leucoemeraldine, emeraldine and pernigranilien bases. Phys. Rev. B 1994, 50, 12496–12508. [Google Scholar] [CrossRef] [PubMed]
  20. Janik, I.; Carmichael, I.; Tripathi, G. Transient Raman spectra, structure and thermochemistry of the thiocyanate dimer radical anion in water. J. Chem. Phys. 2017, 146, 214305. [Google Scholar] [CrossRef] [Green Version]
  21. Moritz, A. Infra-red and Raman spectra of methyl thiocyanate and methyl-d3 thiocyanate. Spectrochim. Acta 1966, 22, 1021–1028. [Google Scholar] [CrossRef]
  22. Hill, W.; Wehling, B. Potential- and pH-dependent surface-enhanced Raman scattering of p-mercapto aniline on silver and gold substrates. J. Phys. Chem. 1993, 97, 9451–9455. [Google Scholar] [CrossRef]
  23. Wang, P.; Li, H.; Cui, C.; Jiang, J. In situ surface-enhanced Raman spectroscopy study of thiocyanate ions adsorbed on silver nanoparticles under high pressure. Chem. Phys. 2019, 516, 1–5. [Google Scholar] [CrossRef]
  24. Zhang, T.; Qin, Y.; Tan, T.; Lv, Y. Targeted live cell raman imaging and visualization of cancer biomarkers with thermal-stimuli responsive imprinted nanoprobes. Part. Part. Syst. Charact. 2018, 35, 1800390. [Google Scholar] [CrossRef]
  25. Sui, C.; Li, C.; Guo, X.; Cheng, T.; Gao, Y.; Zhou, G.; Gong, J.; Du, J. Facile synthesis of silver nanoparticles-modified PVA/H4SiW12O40 nanofibers-based electrospinning to enhance photocatalytic activity. Appl. Surf. Sci. 2012, 258, 7105–7111. [Google Scholar] [CrossRef]
  26. Raj, M.R.; Anandan, S.; Zhou, M.; AshokKumar, M. A facile one-step synthesis of hollow polydiphenylamine. Int. J. Polym. Mater. 2013, 62, 23–27. [Google Scholar] [CrossRef]
  27. De Santana, H.; Dias, F. Characterization and properties of polydiphenylamine electrochemically modified by iodide species. Mater. Chem. Phys. 2003, 82, 882–886. [Google Scholar] [CrossRef]
  28. Barth, A. Infrared spectroscopy of proteins. Biochim. et Biophys. Acta (BBA) Bioenerg. 2007, 1767, 1073–1101. [Google Scholar] [CrossRef] [PubMed] [Green Version]
Figure 1. The Raman spectrum of the screen-printed carbon electrodes modified with reduced graphene oxide and polydiphenylamine (SPCE-RGO/PDPA) platform before (a) and after the interaction with the 1,4-phenylene diisothiocyanate (PDITC) solution in ethanol (1 mL) with a concentration equal to 0.5 (b), 1 (c), 2 (d), and 4 mg mL−1 (e). (f,g) show the optical images of the platform SPCE-RGO/PDPA after the interaction with the PDITC solution having the concentration equal to 0.5 and 4 mg mL−1. All spectra are recorded at the excitation wavelength of 514 nm.
Coatings 11 00258 g001aCoatings 11 00258 g001b
Figure 2. The Raman spectra of SPCE-RGO (a), SPCE-RGO/PDPA (b), SPCE-RGO/PDPA interacted with 2 (blue curve) and 4 mg mL−1 (magenta curve) PDITC in ethanol (c), and after the interaction of SPCE-RGO/PDPA/PDITC with protein G (d), anti-epidermal growth factor receptor (EGFR) (e) and EGFR (f).
Coatings 11 00258 g002
Figure 3. The Raman spectra of PDITC (a), protein G (b), anti-EGFR (c), and EGFR (d).
Coatings 11 00258 g003aCoatings 11 00258 g003b
Figure 4. The IR spectrum of the SPCE-RGO/PDPA platform before (black curve) and after the successive interaction with the PDITC solution in C2H5OH (1 mL) with a concentration equal to 4 mg mL−1 (red curve), protein G (green curve), anti-EGFR (blue curve), and EGR (magenta curve).
Coatings 11 00258 g004
Figure 5. The IR spectrum of the protein G (a) and EGFR antibody (b).
Coatings 11 00258 g005
Scheme 1. The interaction of SPCE-RGO/PDPA with PDITC followed of the chemical interaction with protein G, EGFR antibodies, and EGFR.
Coatings 11 00258 sch001
Figure 6. Cyclic voltammograms of the electrodes of Au (a), SPCE-RGO (b), SPCE-RGO/PDPA-PDITC-G-anti-EGFR/EGFR (c), with 5 mM K3[Fe(CN)6]/K4[Fe(CN)6] solution in 0.1 M PB with pH = 7.4. Cyclic voltammograms were recorded with scan rates equal to 300 (black curve), 200 (red curve), 100 (green curve), 50 (blue curve), 25 (cyan curve) and 10 mV s−1 (magenta curve).
Coatings 11 00258 g006
Table 1. The potential of the anodic and cathodic peaks (Epa, Epc) as well as current densities (ipa, ipc) of the cyclic voltammograms as depending on the scan rate (v) of the following electrodes: Au, SPCE-RGO, SPCE-RGO/PDPA-PDITC-G-anti-EGFR/EGFR. ΔE = EpaEpc corresponds to the potential of separation of the anodic and cathodic peaks.
Electrodev
(mV s−1)
Epa
(mV)
Epc
(mV)
ΔE
(mV)
ipa
(µA cm−2)
ipc
(µA cm−2)
ipa/ipc
03003001141862.493.430.72
2002951311642.012.630.76
1002841441401.551.970.78
502831671161.161.470.79
252811661150.811.030.79
102831681150.580.740.78
SPCE-RGO3004352581770.520.501.04
2004282541740.450.451
1004212581630.350.441.03
504172641530.280.290.96
254162701460.190.191
104102791310.110.111
SPCE-RGO/PDPA-PDITC-G-anti-EGFR/ EGFR3003451471980.30.281.07
2003431481950.260.251.04
1003411501910.230.211.09
503381521860.190.181.06
253341551790.160.151.07
103301601700.100.091.11
Publisher’s Note: MDPI stays neutral with regard to jurisdictional claims in published maps and institutional affiliations.

