Article

Dissimilar Friction Stir Lap Welding of Al to Mg: Characteristic Signal, Microstructure and Mechanical Properties

1
School of Mechanical Engineering, Anyang Institute of Technology, Anyang 455000, China
2
School of Materials Science and Engineering, Henan Polytechnic University, Jiaozuo 454000, China
3
Anyang Key Laboratory of Advanced Aeronautical Materials and Processing Technology, Anyang Institute of Technology, Anyang 455000, China
*
Author to whom correspondence should be addressed.
Coatings 2021, 11(1), 19; https://doi.org/10.3390/coatings11010019
Submission received: 19 November 2020 / Revised: 23 December 2020 / Accepted: 23 December 2020 / Published: 25 December 2020
(This article belongs to the Special Issue Development of Friction Stir Welding and Processing)

Abstract

:
The spindle characteristic signal (forces and vibrations) at different friction stir lap welding (FSLW) parameters were studied. The result indicated that the spindle force and vibration have different trends with the change of welding parameters. For further study, the spindle dynamic performance evaluation model by means of the Technique for Order Preference by Similarity to the Ideal Solution (TOPSIS method) was established. The model was used to calculate the relative approach degree B under different welding process parameters. The correlation between the characteristic signal and the joint properties was obtained. The model was validated by mechanical performance testing and microscopic observation. The results showed that the model evaluations were consistent with the experimental results.

1. Introduction

Restrictions on environmental protection, energy conservation, and emission reductions have become increasingly stringent in the automobile manufacturing industry. As an important means of energy savings and emission reduction for automobiles, weight reduction is receiving more and more attention from countries all over the world. Aluminum and magnesium alloys are widely used in the automotive industry as ideal lightweight materials due to their high damping capacities, high specific strengths, low weights, and excellent formability properties [1,2]. However, the greatest challenge for joining dissimilar materials of aluminum and magnesium alloys is the formation of intermetallic compound (IMC) phases in the welded joint of the two alloys. Intermetallic compounds can easily lead to cracks in the welds [3,4]. Researchers have attempted to join dissimilar aluminum/magnesium alloys using brazing [5], diffusion welding [6], ultrasonic welding [7], laser welding [8], resistance welding [9], and arc welding [10], but each of these methods is associated with unique problems. As a new solid phase joining technique, friction stir lap welding (FSLW) is a kind of welding form derived from friction stir welding (FSW), which can effectively suppress the generation of IMCs because the welding heat input is low during the welding process, so the base material only undergoes plastic flow and does not melt under the effect of the tool. Furthermore, with the help of the high strain rate and large deformation during FSLW, the distribution of IMC is effectively improved, making FSLW the ideal joining technique for these two light alloy materials.
The weld formation during FSW is divided into surface formation and cross-sectional formation. The surface form directly affects the performance of the FSW weld [11]. To date, researchers have performed a large amount of useful work to investigate the influence mechanism of the welding process parameters, such as the welding and rotation speeds, on the formation of the weld [12,13,14,15,16,17,18,19,20,21]. Zhang et al. [14] obtained defect-free joints during the FSW of dissimilar AM60 Al/AZ31 Mg metals by adjusting the welding process parameters. Huang et al. [15] used a friction stir welding method to join the AA2024-T4 plates with drastically different thickness and investigated the influence of pin length on joint features and mechanical properties. Li [16] prepared FSW samples of dissimilar metal butt welds of AZ91Mg/A383 Al at ν = 40 mm/min and ω = 700–1500 rpm. This showed that the surface quality of weld would reduce at too high or low rotation speed. In the FSW welding process, a solid joint of the dissimilar metals is formed by the action of a tool driven by the high-speed rotation of the mechanical spindle. Some scholars have analyzed the quality of the formed FSW welds from the perspective of the spindle performance [22,23,24]. Forcellese et al. [22] researched the FSW butt joint of the same material, AZ31 Mg, and observed the changes of the axial force of the spindle during the welding process. This indicated that as the axial force increased, the heat input to the weld increased, the fluidity of the weld material increased, and the smoothness of the weld surface improved. Boccarusso et al. [23] studied the effects of the axial and lateral forces of the spindle on the surface morphology of the weld. The results indicated that the axial force on the spindle played the dominant role in the formation of the weld, but an increase in the lateral force of the spindle could reduce the stability of the material flowed inside the weld and lead to surface defects and roughness. Chen et al. [24] suggested that when the spindle force was too small, the joint could not form an effective connection, but when the axial force on the spindle was too large, the material in the weld would be extruded outward and caused surface flash defects. A smooth, defect-free weld surface could be formed only when the spindle force was an appropriate value. Collectively, all of these studies had addressed the effects of the welding parameters on the weld formation or the influence of the spindle force alone on the weld formation, but some outstanding issues remain. For example, the internal relationship between the spindle dynamic performance (force and vibration) and welding process parameters and the influence of the spindle dynamic performance on microstructures and properties of dissimilar aluminum/magnesium friction stir lap welding have yet to be investigated.
Therefore, this paper focused on magnesium and aluminum alloys as the research objects. The goal of the study was to comprehensively evaluate the dynamic performance of the spindle using the Technique for Order Preference by Similarity to the Ideal Solution (TOPSIS) [25,26] method and to investigate the correlation between the characteristic signal and the joint properties. To study the effects of the welding process parameters (rotational speed ω and welding speed v) on the spindle dynamic performance (three-way force and vibration), in the present work, the different parameter conditions were constructed and made use of a three-component force measuring system and vibration instrumentation. The results of the investigation provide a theoretical foundation and scientific basis for applications of the FSLW joining of dissimilar aluminum and magnesium materials in the automobile industry.

2. Materials and Methods

In this study, the FSLW welding tests were carried out using a 2 mm-thick 1060 aluminum plate and a 3 mm-thick AZ31B magnesium plate. The dimensions of the plates were 200 mm × 150 mm, and the chemical compositions are shown in Table 1. Prior to welding, the dust and greasy dirt on the surface of the aluminum and magnesium plates were removed with sandpaper and alcohol. All the specimens were constructed on an HT-JM16 × 8/1 one-dimensional gantry friction stir welding machine (Aerospace Engineering Equipment Co., Ltd., Suzhou, China) with the aluminum plate on top and the magnesium plate at the bottom. To ensure an effective joint between the aluminum and magnesium plates, a tool of pin diameter size 4 mm and shoulder diameter size 14 mm, was chosen. In the welding process, the tool rotated in a counterclockwise direction and maintained a 2.5° angle and a 0.2 mm shoulder plunge depth. Welding parameters were set as separately at ω = 1000, 1500, and 2000 rpm and ν = 30, 50, and 70 mm/min. In addition, to study the effect of the dynamic performance of the spindle on microstructures and properties of the joint, the real-time changes of the three forces and the vibrations of the spindle were monitored separately during the welding process using a Kistler 9257B three-component cutting force system (Kistler Instruments Co., Ltd., Wintertour, Switzerland) and DH5922D vibration instrumentation (Jiangsu Donghua Testing Technology Co., Ltd., Taizhou, China) (Figure 1a). The three-way acceleration sensor of 1A314E was used; the X, Y and Z direction sensitivity was 104.2, 100.1 and 99.3 mV/g, respectively. The frequency range was 0.5–7000 Hz. To examine the macroscopic characteristics of the weld, a cross section of the weld was extracted from the middle position and, after polishing, examined under a Zeiss Axiovert 200MAT stereo microscope and a Zeiss Lab A1 microscope (Zeiss, Jena, Germany). A micro-hardness tester (FM-810, Future-tech, Kawasaki, Japan) was used to test the cross-sectional micro-hardness of the joint, with a load of 100 gf and a loading time of 15 s. The tensile specimens were taken from 5 cm away from the start of the joint with a size of 190 mm × 40 mm (as shown in Figure 1b), and the joint tensile shear force was measured using a microcomputer-controlled electronic universal testing machine (WDW-20, Changchun Kexin Test Instrument Co., Ltd., Changchun, China) at a quasi-static loading speed of 0.5 mm/min.
The evaluation of the dynamic performance of a spindle is a comprehensive, quantitative, and multi-factor ranking problem. The dynamic performance of the spindle relies on many factors, therefore we chose a set of parameters with the best dynamic performance of the spindle from multiple datasets, compared and analyzed the influencing factors, and comprehensively optimized and ranked them. Table 2 shows the experimentally obtained data from the tests. The influencing factors included two layers, and the hierarchical analysis of the six influencing factors are shown in Figure 2.
To build the model, the following assumptions were made: (i) except for the nine sets of welding process parameters given, all other welding conditions were identical; (ii) the three factors considered in the selection of the optimal parameters were determined by multiple tests and based on relevant data. Their effects on the dynamic performance of the spindle were in the following order: vibrations and three forces [27].

3. Results and Discussion

3.1. Three Forces

In the FSLW process, the interaction between the spindle and the specimen during the forming process of the weld may be divided into four phases: the plunging stage (I), dwelling stage (II), welding stage (III), and pulling-out stage (IV) [22]. The spindle experiences different forces in different phases. For example, the time dependence of the three forces on the spindle under the FSLW welding parameter of 1500 rpm and 70 mm/min are shown in Figure 3. From Figure 3, it can be seen that the red, blue and yellow line represent the Fx, Fy and Fz, respectively.
During the plunging stage (Stage I), the tool started to rotate and was pressed down until it plunged into the parent material to the specified depth. In this stage, the tool continued to be pressed into the yet-to-be-softened metal material, and the axial force (Fz) increased sharply with time [28], while the lateral force (Fx) and the feed force (Fy) increased slightly. Forcellese et al. [22] claimed that the axial force quickly risen owing to the strength of the deforming material to the pin penetration that prevailed on the softening due to the heat generated by the stirring action of the rotating pin.
After reaching the predetermined downward force, the tool rotated in place in the dwelling stage (Stage II). The friction between the rotating tool and the base material continuously generated heat that flowed into the base material and caused it to reach a thermoplastic state. This ensured an effective joint in the initial weld along the weld advancing direction. As the base material continued to soften and the dwell time of the spindle continued to lengthen, Fz showed a significant decreasing trend, as shown in Figure 3. Gao et. al. [29] pronounced that the axial force decreased sharply in the dwelling stage because the heat generation by shoulder–workpiece friction produced more plasticized material. Moreover, Fx and Fy also decreased slightly.
In the welding stage (Stage III), the tool was moving from the region of high material softening to the region of low material softening. All three forces on the spindle increased substantially [23], and their increases were in the order of Fz > Fy > Fx. After this short period of transition, the welding entered a more stable state, where the stability of Fx was the best, and its change with time could be ignored. Fy was in the range of 1400 ± 300 N, and Fz fluctuated in the range of 5000 ± 1000 N.
During the pulling-out stage (Stage IV), the tool stopped advancing while maintaining a constant rotational speed and pulled away from the weld surface, leaving a keyhole on the surface of the plate. During this stage, the contact area between the tool and the plate decreased continuously, and the three forces on the spindle continued to decay until the tool was completely pulling out the surface of the plate and all three forces decreased to zero.
Based on the above analysis of the entire welding process, it was found that in Stage I, II, and IV, the spindle acted on the plate for a brief period and the three forces fluctuated over a wide range. These two characteristics greatly increased the difficulty analyzing of the relationship between the rotation speed, the welding speed, and the three forces on the spindle, and they also lowered the accuracy of the analysis significantly. For this reason, the time dependence of the axial force in Stage III was used to analyze the variation trends of the welding process parameters as a function of the axial force.
An orthogonal test was designed for the welding process parameters using ω = 1000, 1500, and 2000 rpm and ν = 30, 50 and 70 mm/min. Figure 4 shows the time dependence of the three forces for the FSLW welding of aluminum and magnesium under nine sets of welding process parameters.
The results in Figure 4 show that after the stirring spindle entered the stable feeding phase, the axial force first increased and then decreased. As the welding process parameters changed, the curves for the three forces also changed accordingly. With the stirring spindle rotating at ω = 1000, 1500, and 2000 rpm, the stability of the three forces decreased, and the range of fluctuations increased as the welding speed increased, such as the curve fluctuation in Figure 4a being smaller than that in Figure 4b,c. At v = 30, 50, and 70 mm/min, the three forces fluctuated more frequently as the rotation speed increased. For Fx, the fluctuation was larger in Figure 4a–c than that in Figure 4 d–i. The increase in the three-way force of the spindle was more frequent. At the same time, due to the increase in the rotation speed, the heat input to the weld joint increased, the plasticization of the metal increased [30,31], and the range of fluctuations of the three forces became even smaller during the welding process.
In the study of the relationship between the rotational speed, the welding speed, and the three forces on the spindle, the three forces were fitted to a normal distribution. The fitting equation for the normal distribution is shown in Equation (1), the original data were determined by calculating the action time of axis force in force-time curve by MATLAB, and the fitting results are shown in Figure 5. The three forces basically followed a normal distribution, therefore the average values (μ) of the fitted curves were used to represent the three forces in the analysis of the relationship between the three forces, the rotational speed and the welding speed:
F ( X ) = 1 2 π σ e ( x μ ) 2 2 σ 2
where μ and σ represent the mean value and standard deviation, respectively.
To investigate the effect of the rotation and welding speeds on the three forces on the spindle, a response surface mathematical model with the rotational and welding speeds as independent variables and Fx, Fy and Fz as dependent variables was used, according to the center combination method in the Design Expert 12.0 software. The reliability of the model was verified based on the accuracy of the model [32,33]. To facilitate the design of the model, the independent variables were assigned encoded parameter values. The actual and encoded values are shown in Table 3. Two factors, three-level central composite design matrix were selected to minimizing experimental conditions. The upper and lower limits of each parameter are coded as 1 and −1, respectively. The coded values for the intermediate (0) level were the rest of parameters. A total of nine experiments were required in this central composite design experimental design. The independent variable parameter matrix and the experimental results of the response values are shown in Table 4.
For this test, a mathematical model was established using a second-order fitting equation, as shown in Equation (2):
Y i = b 0 + b i x i + b i j x i x j + b i i x i 2 + ε ( i = 1 , 2 , , n )
where xi and xj denote the independent variables, b0 is a constant term, bij represents the interaction coefficients of the two input variables, bii is the second-order effect of parameters xi, ε is a random error, and Yi is the value of the response function. In this experiment, the two factors and three response equations can be expressed as [32]:
{ F x = a 0 + a 1 × ω + a 2 × ν + a 3 × ω × ν + a 4 × ω 2 + a 5 × ν 2 F y = b 0 + b 1 × ω + b 2 × ν + b 3 × ω × ν + b 4 × ω 2 + b 5 × ν 2 F z = c 0 + c 1 × ω + c 2 × ν + c 3 × ω × ν + c 4 × ω 2 + c 5 × ν 2
Calculations using the Design Expert 12.0 software yielded the following response equations of the three forces:
{ F x = 321.82 + 19.83 × ω + 14.68 × ν 8.46 × ω × ν 1.24 × ω 2 + 4.81 × ν 2 F y = 1056 + 2.68 × ω + 236.73 × ν 161.26 × ω × ν 184.29 × ω 2 1.44 × ν 2 F z = 3825 + 86.83 × ω + 890.17 × ν 220 × ω × ν 1146.5 × ω 2 + 328.5 × ν 2
Using the ANOVA module of the Design Expert 12.0 software, the accuracy of the response surface model was tested. In the analysis of variance process, the values of P and F reflect the reliability of the model. The greater the values of F, the smaller the values of P were, and the higher the reliability of the model was. Generally, a P value less than 0.05 indicates that the model is significant, and a P value greater than 0.1 shows that the model is poor and cannot be used reliably. The results in Table 5 show that the Fz response surface model and the v, ω, and v2 terms were all highly significant. In addition, the closer the coefficient of determination, R2, between the actually measured value of the response surface function and the predicted value of the model was to 1, the better the fit was between the predicted and experimental values. In the Fz model, R2 was as high as 0.98, which indicated a high degree of fitting between the predicted and experimental values. Figure 6 shows the correlation graphs of experimental and predicted values. From Figure 6, it was found that the predicted and experimental values of the response surface function were evenly distributed on both sides of the 45° inclined line, indicating that the response surface models of Fx, Fy and Fz had high fitting accuracy and the models were applicable.
Figure 7 shows the response surface plots for the rotational speed, welding speed to the forces Fx, Fy and Fz. Figure 7a shows that the variation trend of Fx was clearly different from those of Fy and Fz. When ω = 1000 rpm and v = 30 mm/min, Fx exhibited the minimum value. As the rotational and welding speed increased, Fx increased and assumed the maximum value when ω = 2000 rpm and v = 70 mm/min. On the XY horizontal plane of the response surface plot, the contour line for Fx was approximately a circular arc. This indicated that the rotational speed and the welding speed interacted very weakly with Fx and had only an overlaying effect. Furthermore, over the entire variation range of the fitted parameters, Fx fluctuated in the range of 300–360 N, and the welding process parameters had little effect on the changes of the Fx values [34]. Similarly, the Fy also obtained a minimum at ω = 1000 rpm and v = 30, and the interaction dropped sharply as it approached 1000 rpm and 30 mm/min. In Figure 7b, the rotational and welding speeds had an interacting effect on Fy [35]. For a given rotational speed, as the welding speed increased, Fy increased. For a given welding speed, when the rotational speed increased, Fy first increased and then decreased, with the maximum occurring at approximately ω = 1500 rpm and v = 70 mm/min. As shown in Figure 7c, Fz was approximately symmetric about the horizontal plane of ω = 1500 rpm. At v = 30 mm/min, Fz decreased sharply as the rotational speed approached 1000 and 2000 rpm, reaching a maximum at ω = 1500 rpm and v = 70 mm/min. On the XY horizontal plane, the contour had an elliptical shape, and the interaction of the rotation and welding speeds with Fz was quite significant. Under this interaction, Fz changed minimally for ω = 1300–1700 rpm and v = 40–60 mm/min. Residual plots are shown in Figure 7d–f, which indicate that the fitting accuracy of all experimental date was up to 97%, and the experimental analysis was dependable.

3.2. Vibration

FSLW spindle vibrations usually have an adverse effect on welding, and its degree of influence was often related to the vibration acceleration at high rotation speed. Therefore, the vibration acceleration was used to study the vibrations. Figure 8 shows the frequency spectrum of Z vibration acceleration of the spindle with different welding parameters. From Figure 8, it can be seen that the Z direction vibration acceleration frequency spectrum changed slightly under different welding speed when the rotational speed was fixed (Figure 8b,d,e). However, when the welding speed was constant, the Z direction vibration acceleration frequency spectrum changed significantly with different rotational speeds (Figure 8a–c). This proves that the rotational speed has a great influence on the vibration of spindle. In order to compare the vibration acceleration of different welding speeds and rotational speeds, the vibration acceleration data was calculated by DHDAS dynamic signal test and analysis software. The mean value of vibration acceleration is shown in Figure 9.
As shown in Figure 9, under the welding processing, the vibration acceleration of three direction was slight when ω = 1000 rpm, and v = 30 mm/min. When welding speed v = 30 and 50 mm/min, as the welding speed and rotational speed increased, the vibration acceleration of three direction increased. However, when welding speed v = 70 mm/min, the vibration acceleration of ω = 1000 and ω = 1500 rpm was larger and it decreased sharply in the X and Y directions when ω = 2000 rpm (Figure 8a,b). In Figure 8c, when rotational speed v = 70 mm/min, the vibration acceleration of Z direction decreased with the increase in rotational speed.

3.3. Spindle Dynamic Performance Evaluation Model

3.3.1. Consistent Processing of Indices

Consistent processing of the indices can effectively avoid irrational evaluation results, because the various indices had different orders of magnitude. The linear proportional transformation method can effectively retain the size relationships and ratios of the indices before and after the change. Hence, to be as realistic as possible and eliminate the differences between the indices, the linear proportional transformation method was used to transform indices on an extremely large scale.
The two factors, i.e., the forces and vibrations, each have their own standards. In the present parametric study, the three forces possessed extremely large indices: the greater the force, the better the performance was. For vibrations, the indices were small: the smaller they were, the better the performance of the spindle was. For convenience, the reciprocals of the vibration were used and converted into very large indices for the calculation. The linear proportional transformation method was used to standardize the indices by letting:
x i j * = x i j max   x i j ( max   x i j 0 , 1 i 9 , 1 j 6 )
The evaluation matrix was obtained as follows:
R = [ 0.852031 0.607137 0.434995 0.37037 0.333333 3.466667 0.857995 0.664688 0.514547 1 1 1 0.929849 0.939144 0.832757 0.073529 0.031646 0.181185 0.880432 0.620811 0.663276 0.196078 0.072464 0.409449 0.915933 0.775357 0.791658 0.185185 0.090909 0.5 0.971315 1 1 0.0625 0.025641 0.258706 0.968475 0.592863 0.493795 0.212766 0.065789 0.481481 0.959387 0.681367 0.548525 0.175439 0.042373 0.203125 1 0.694515 0.575788 0.16129 0.060241 0.311377 ]
All subsequent calculations of the data were based on the evaluation matrix R.

3.3.2. Establishing Hierarchical Structure Map

Based on the known evaluation indices, it was determined that there were four layers: object layer O, criterion layer C, sub-criterion layer D, and program layer P. An analytic hierarchy process diagram, as shown in Figure 10, was established. The first layer, object layer O, was for the evaluation of the FSLW spindle dynamic performance. The second layer, criterion layer C, had the two first-level indices—the three forces and vibration—to evaluate the dynamic performance of the FSLW spindle. The third layer, sub-criterion layer D, had second-level indices (six indices including Fx, Fy and others) for evaluating the dynamic performance of the FSLW spindle. The fourth layer contained the nine sets of weld process parameters studied herein.

3.3.3. Determining the Weight Vector

According to assumption (ii) above, as shown in Table 6, a 1–9 scale aij was used to measure the relative importance of any two criterion layers Ci and Cj to the object layer O.
If the influence of three-dimensional force and vibration on target layer is the same in criterion layer C, then criterion layer C and target layer O are both assigned values of 0.5. In other words, the normalized weight of criterion layer C to target layer O is as follows:
w ( 2 ) = ( 0.5 , 0.5 ) T
The hierarchical structure included two parts: the criterion layer and the sub-criterion layer. Therefore, according to Table 6, a pairwise comparison matrix A1 for D1, D2 and D3 with respect to C1 was firstly constructed and then the relative weight vector w1(3) was calculated. The position weight was set to 0 for factors in the sub-criterion layer that had no effect on C1. Thus, the relative weight vectors w1(3) of six factors with respect to C1 were constructed. Similarly, the relative weight vectors w2(3) of each factor with respect to C2 may be constructed using the same method.
Then, a pairwise comparison matrix of the sub-criterion layer with respect to the criterion layers C1 and C2 were constructed: A 1 = [ 1 1 / 3 1 / 5 3 1 1 / 3 5 3 1 ] , and A 2 = [ 1 1 / 3 1 / 5 3 1 1 / 3 5 3 1 ] , respectively.
Using the sum method, the maximum feature root of each matrix was calculated and the corresponding normalized feature vector:
λ 1 = 3.0387 , λ 2 = 3.0387
w 1 ( 3 ) = ( 0.1062 , 0.2605 , 0.6333 ) T , w 2 ( 3 ) = ( 0.1062 , 0.2605 , 0.6333 ) T .
All layers passed the consistency test.
The weights for factors at positions that had no influence on C1 in the sub-criterion layer were set to 0. Thus, this obtained the relative weight vectors w1(3) of the six factors with respect to C1. Similarly, the relative weight vectors w2(3) of each factor with respect to C2 was obtained using the same method. The relative weight vectors of the sub-criterion layers for the factors of the criterion layer were as follows:
w 1 ( 3 ) = ( 0.1062 , 0.2605 , 0.6333 , 0 , 0 , 0 ) T ,
w 2 ( 3 ) = ( 0 , 0 , 0 , 0.1062 , 0.2605 , 0.6333 ) T .
The matrix formed by the column vectors of the relative weight vector of the sub-criterion layer with respect to the factors of the criterion layer was as follows:
W ( 3 ) = ( w 1 ( 3 ) , w 2 ( 3 ) ) = [ 0.1062 0 0.2605 0 0.6333 0 0 0.1062 0 0.2605 0 0.6333 ]
The combined weight of the sub-criterion layer D with respect to the object layer O was w ( 3 ) = W ( 3 ) w ( 2 ) = ( 0.0531 , 0.1303 , 0.3167 , 0.0531 , 0.1303 , 0.3167 ) T .
Based on the combined weight vector, with respect to the dynamic performance of the spindle, a weight of 0.0531 was assigned to Fx, a weight of 0.1303 was assigned to Fy, and a weight of 0.3167 was assigned to Fz. The weight of the spindle vibration was the same with the forces.
The comprehensive weight of the sub criterion layer D to the dynamic performance of the spindle passes the combination consistency test.
Therefore, the third layer passed the combination consistency test. The combined weight of the six factors for their effect on the dynamic performance of the spindle was w ( 3 ) = ( 0.0531 , 0.1303 , 0.3167 , 0.0531 , 0.1303 , 0.3167 ) T

3.3.4. Comprehensive Evaluation Using TOPSIS Method

The combined weighting, based on the evaluation matrix R and the parameters on the performance of the spindle, was as follows:
z i j = w j y i j ( i = 1 , 2 , , 9 ; j = 1 , 2 , , 6 )
Use Equation (6), a weighted evaluation matrix was constructed as follows:
R = [ 0.0452 0.0791 0.1377 0.0197 0.0434 1.0977 0.0456 0.0866 0.1629 0.0531 0.1303 0.3166 0.0494 0.1223 0.2637 0.0039 0.0041 0.0574 0.0468 0.0809 0.2100 0.0104 0.0094 0.1297 0.0486 0.1010 0.2507 0.0098 0.0118 0.1583 0.0516 0.1303 0.3167 0.0033 0.0033 0.0819 0.0514 0.0772 0.1564 0.0113 0.0086 0.1525 0.0509 0.0887 0.1737 0.0093 0.0055 0.0643 0.0531 0.0905 0.1823 0.0086 0.0078 0.0986 ]
A positive ideal solution Z* (z1*, z2*,…, z6*) and a negative ideal solution Z (z1, z2,…, z6) were determined as follows:
Z * = ( 0.0531 , 0.1303 , 0.3166 , 0.0531 , 0.1303 , 1.0977 ) ,
Z = ( 0.0452 , 0.0772 , 0.1377 , 0.0033 , 0.0033 , 0.0574 ) .
The distances from each parameter to the positive and negative ideal solutions were calculated as follows:
d i * = j = 1 m ( z i j z j * ) 2 , d i = j = 1 m ( z i j z j ) 2 , ( i = 1 , 2 , , 9 )
The positive and negative ideal solutions were:
d * = ( 0.3582 , 0.9860 , 1.2803 , 1.2939 , 1.2008 , 1.1940 , 1.3237 , 1.3885 , 1.3402 ) ,
d = ( 1.0986 , 0.4708 , 0.1766 , 0.1629 , 0.2561 , 0.2628 , 0.1331 , 0.0683 , 0.1167 ) .
The relative approach degree B of each parameter to the ideal spindle performance was calculated from C i + = d i d i * + d i , ( i = 1 , 2 , , 9 ) , as follows:
B = ( 0.7541 , 0.3232 , 0.1212 , 0.1118 , 0.1758 , 0.1804 , 0.0914 , 0.0469 , 0.0801 ) .
Based on the relative approach degree B, the spindle performance for each parameter was ranked in order of merit as follows: P1 > P2 > P6 > P5 > P3 > P4 > P7 > P9 > P8.

4. Model Verification

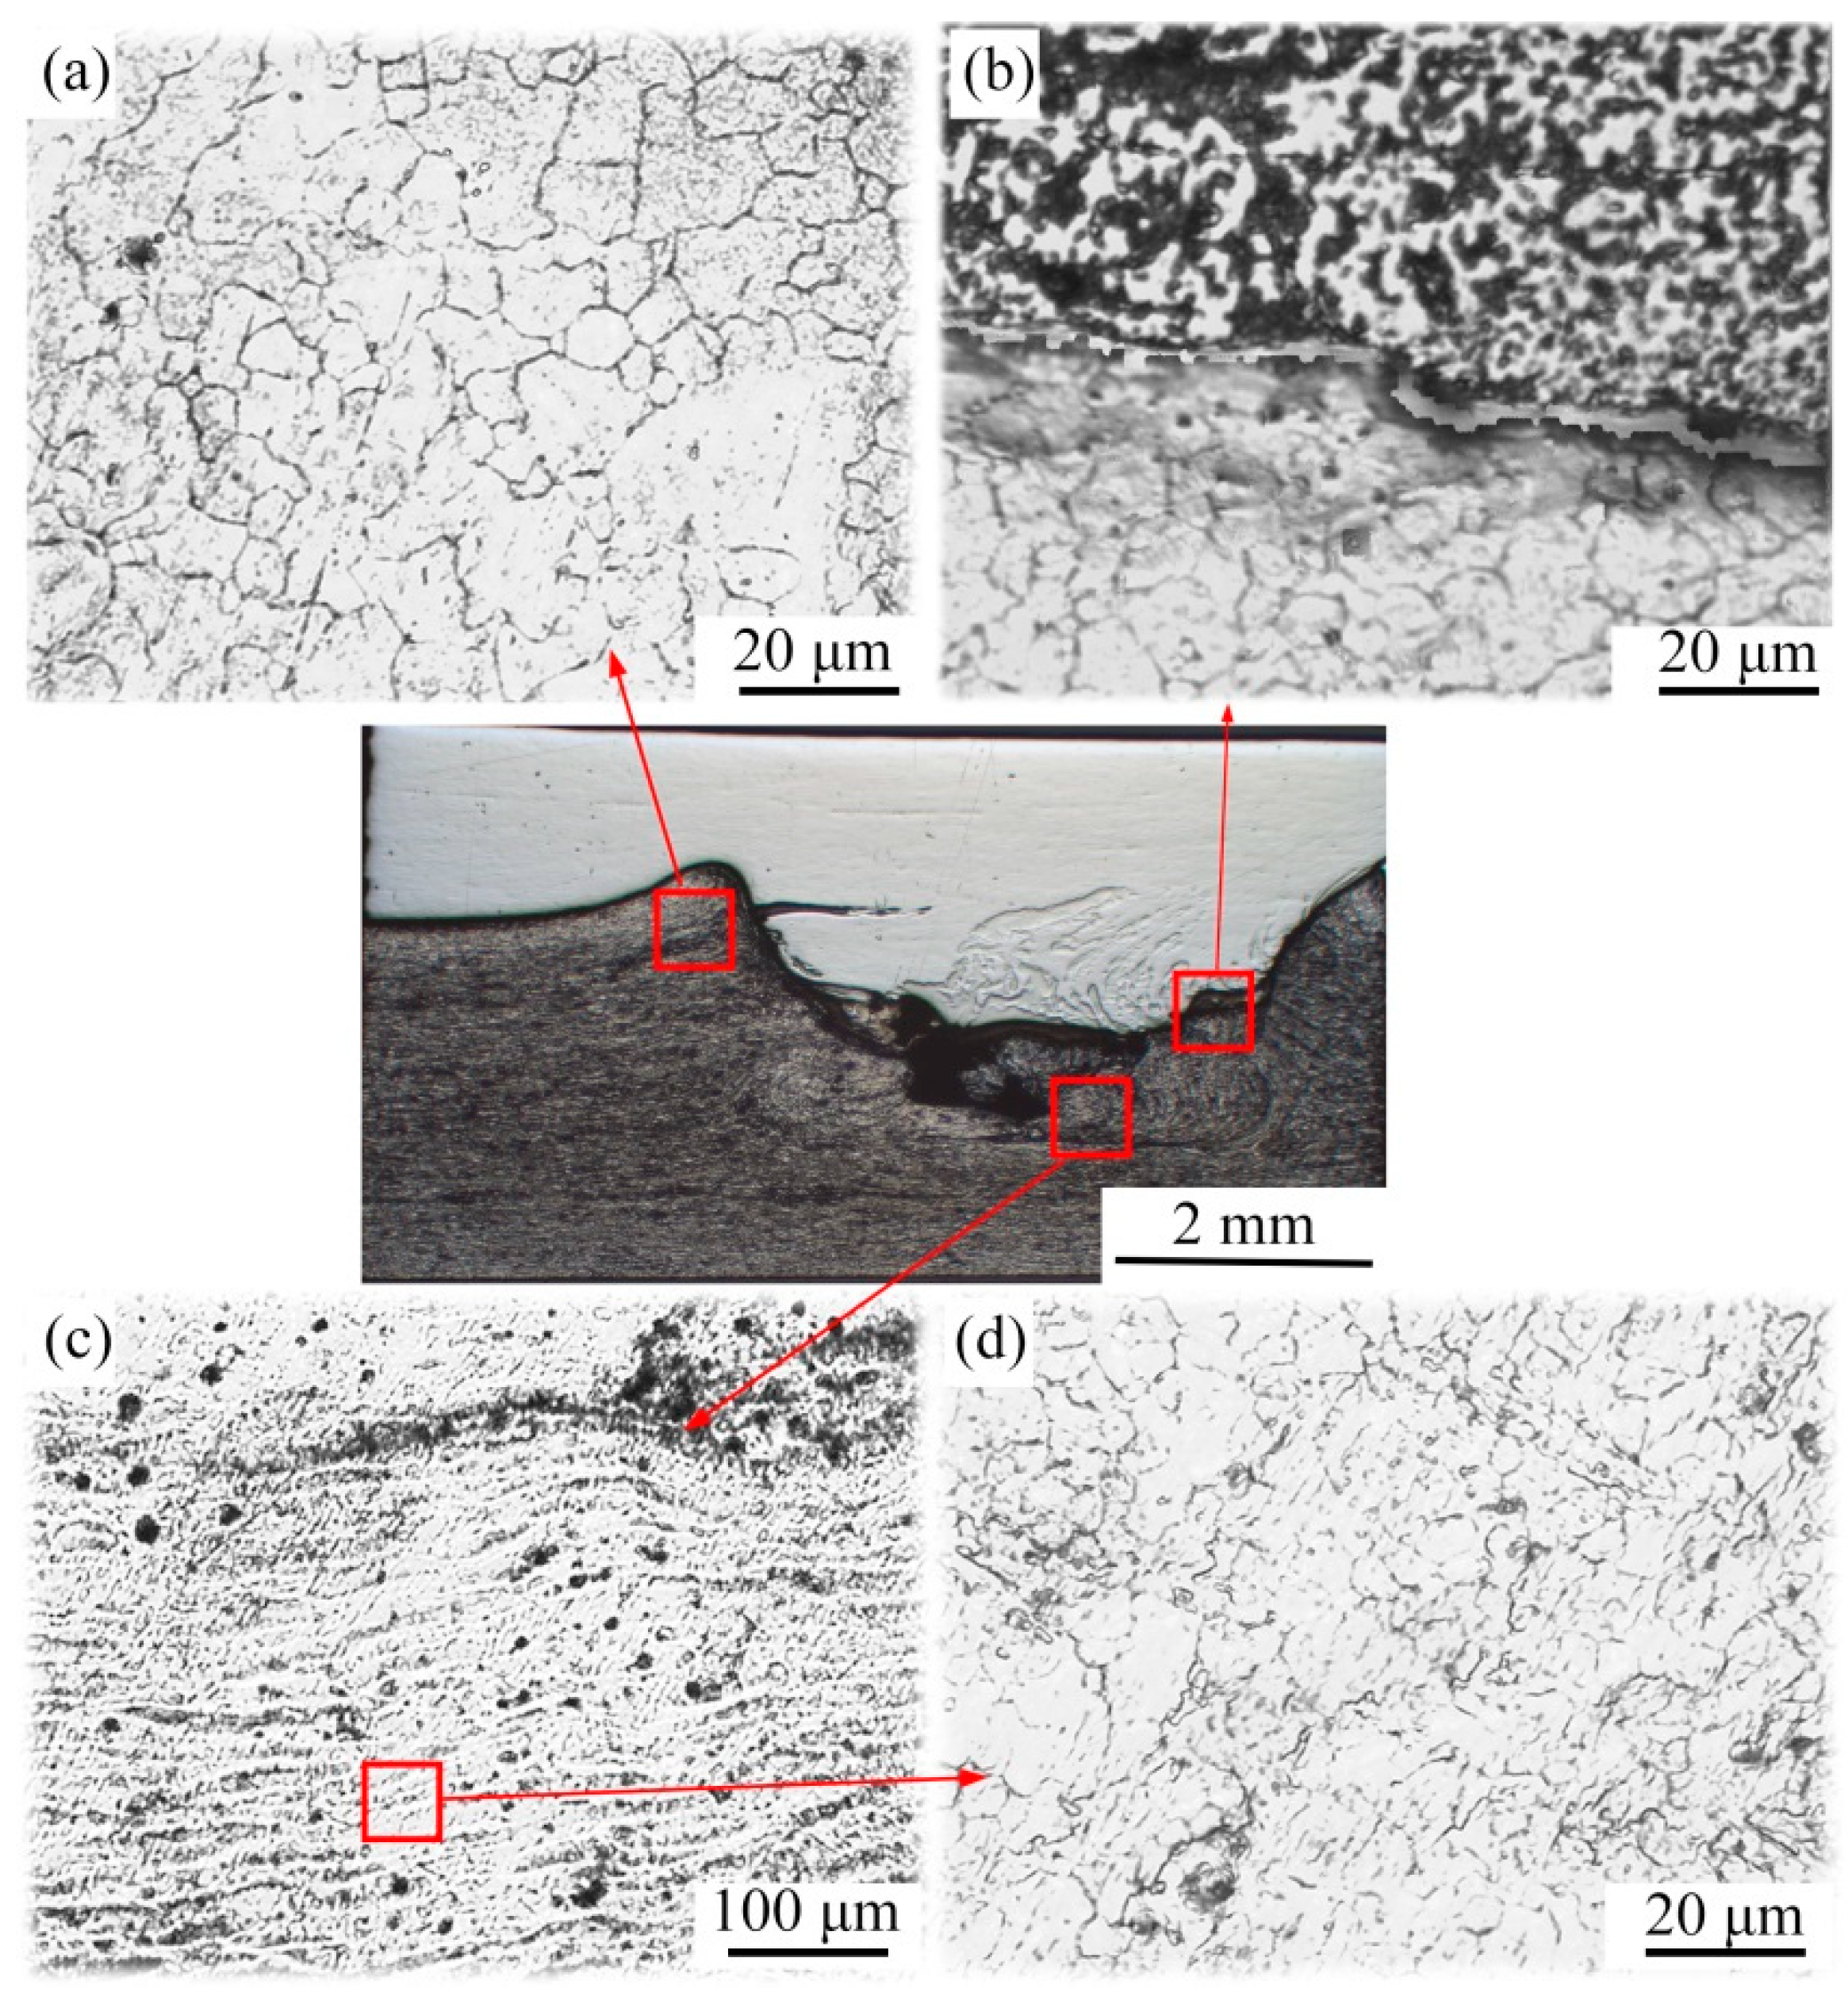
4.1. Microstructures

The microstructure of P1 and P7 are shown in Figure 11 and Figure 12, respectively. From Figure 11a and Figure 12a, coarse grains can be observed in the Mg sheet. Figure 11b and Figure 12b show the interface of the Al and Mg sheets. Islands of a globular phase were observed at the boundary in the stirring zone with similar morphologies to IMCs and base materials, which has been discussed by Mohammadi [36]. In the stirring zone, a “swirl zone” can be observed from Figure 11c and Figure 12c, which shows that the materials are well mixed. The magnified views of a small region in Figure 11c and Figure 12c are shown in Figure 11d and Figure 12d, where this stirring zone indicated that grain size decreases significantly after recrystallization. However, from Figure 12b, a thick IMC layer at the weld interfaces, and a hook defect appear in macrostructure of Figure 12 can also be observed. It is clear that the higher heat input causes a more severe formation of intermetallic compounds. The presence of intermetallic compounds and hooks can reduce the mechanical properties of the joint.

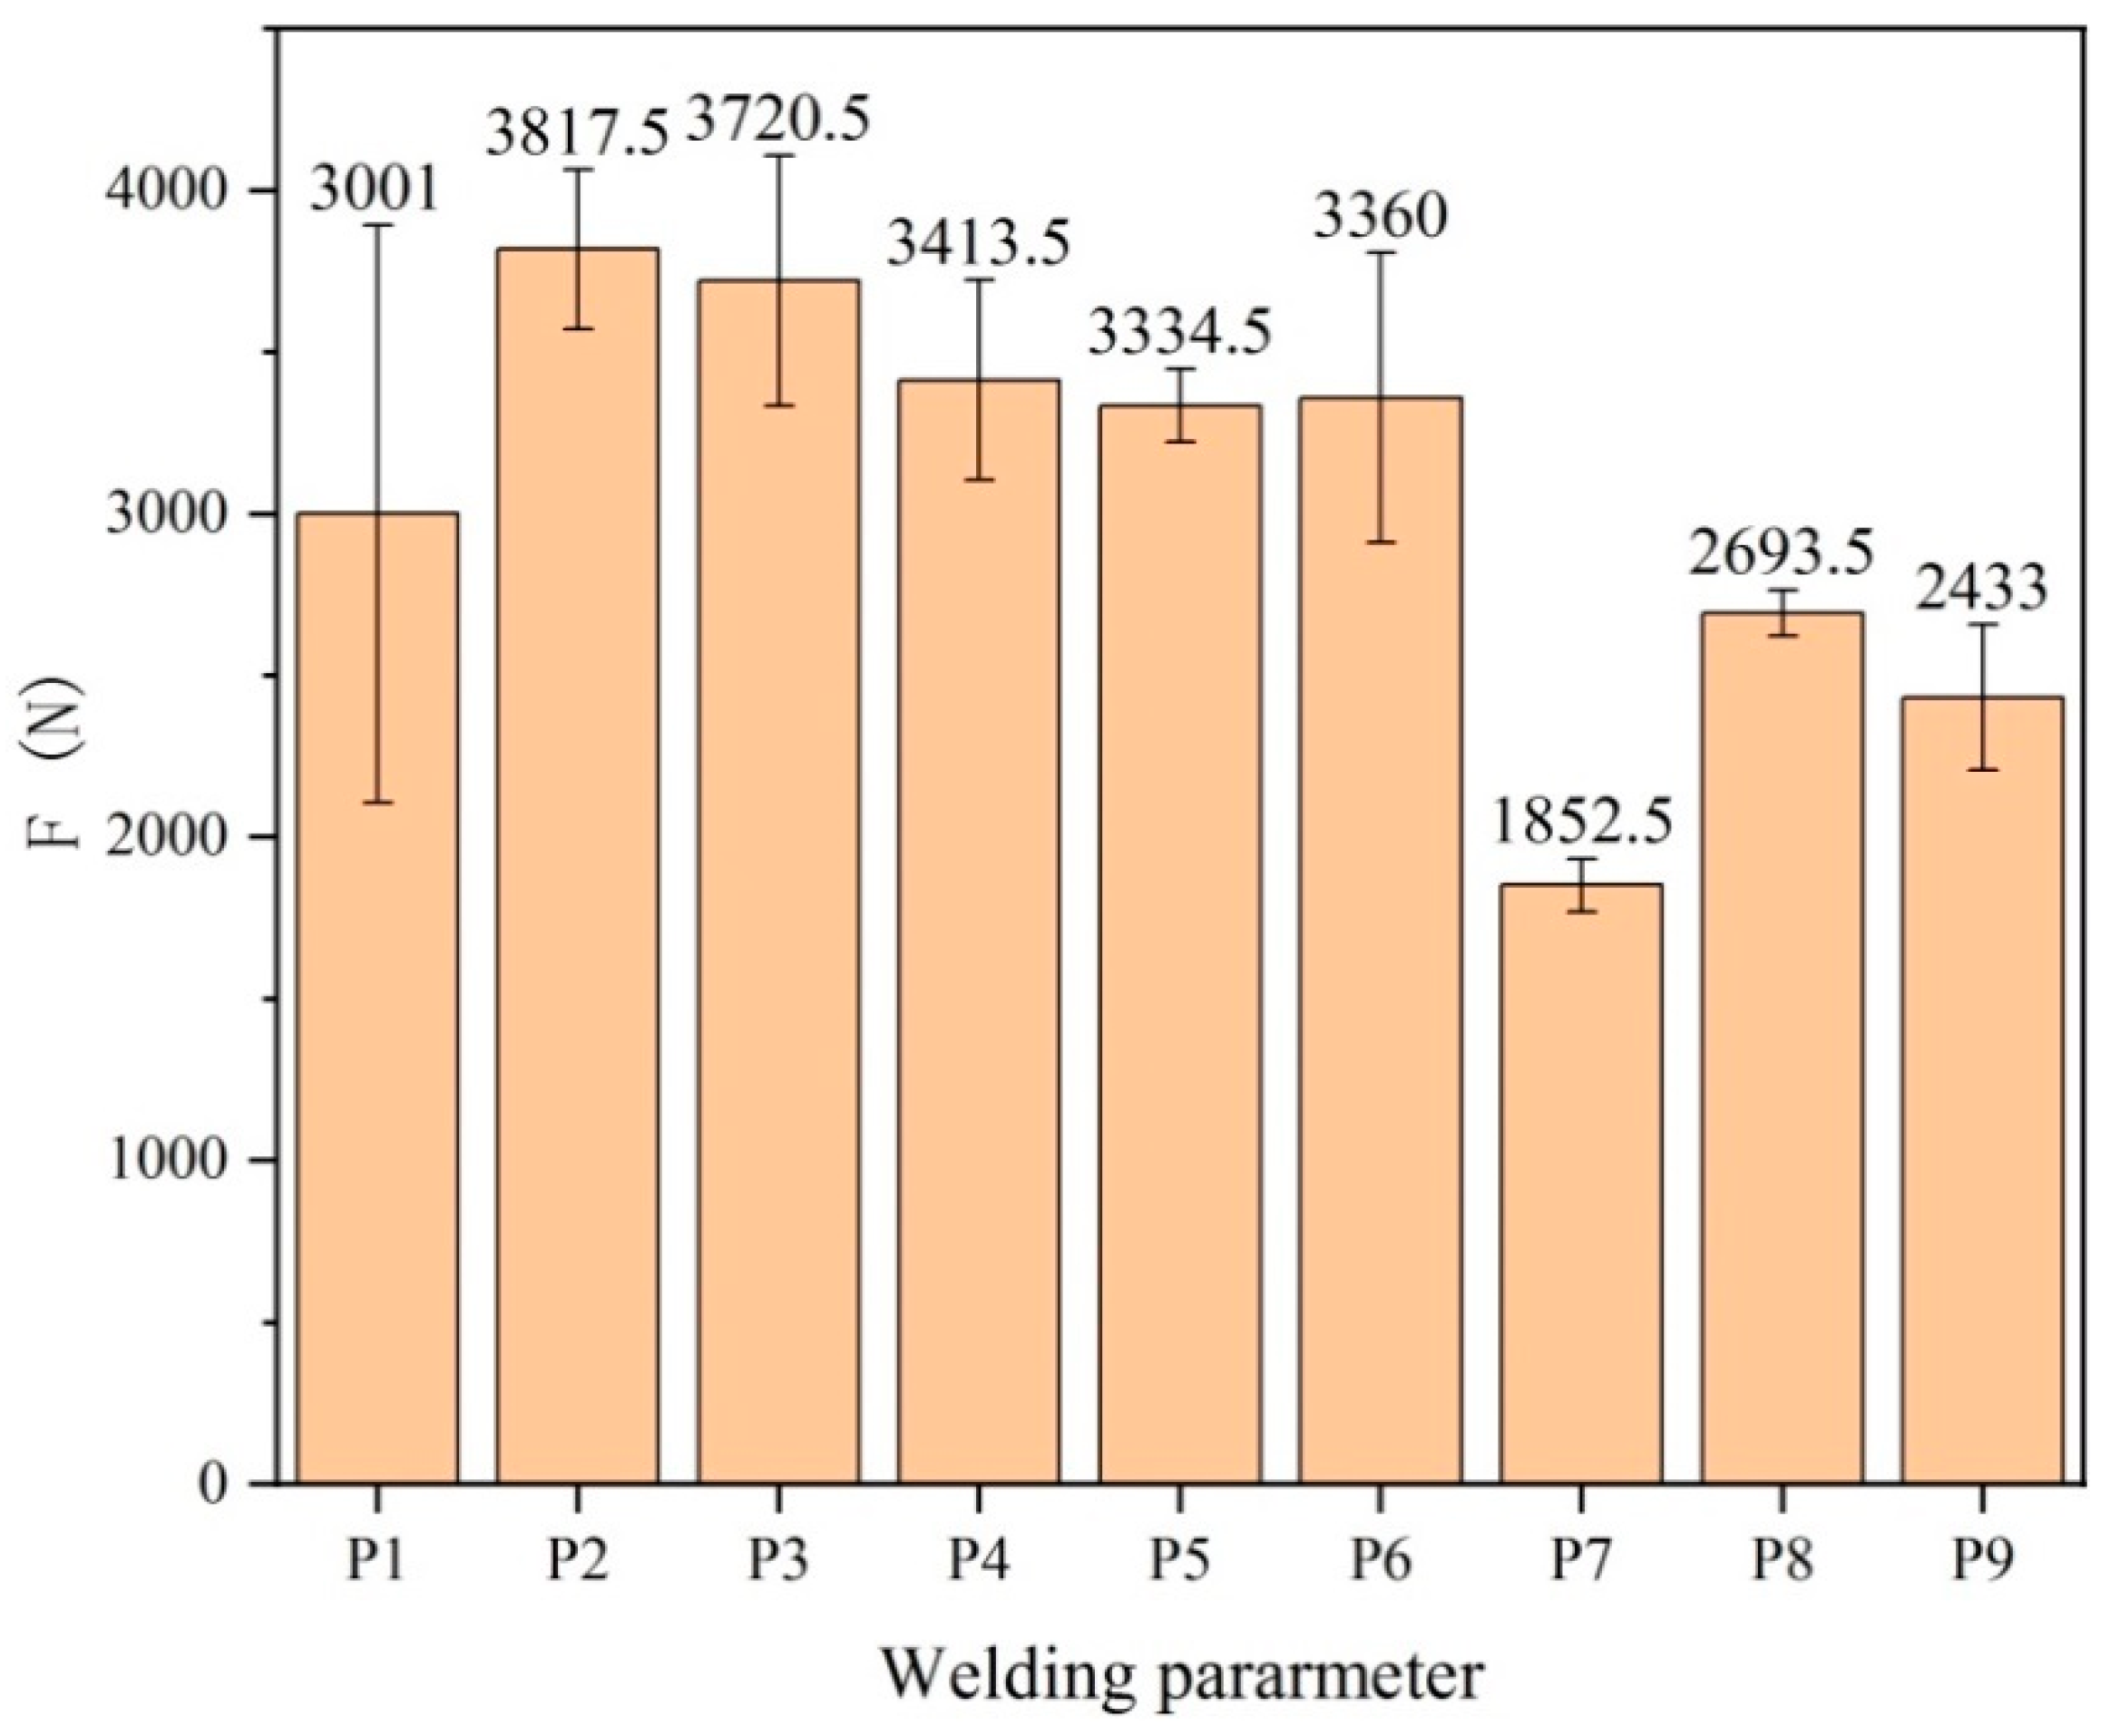
4.2. Micro-Hardness and Tension-Shear Strengths

The micro-hardness of different spindle dynamic properties on welding joints are shown in Figure 13. These results show that the hardness values of Al sheet are limited to 30 HV, and the Mg sheet is limited to 50 HV. A hardness peak appears at the welding center, and it decrease with the increase in distance from the nugget which can be connected with the formation of IMCs in the nugget [37]. In P5 and P7, there is a lower micro-hardness in the welding center than that in nugget zone on both Al and Mg sides. It indicates that the Al sheet was extruded into a nugget.
Figure 14 shows the tensile-shear strengths of different parameter. For welds produced at 1000 and 1500 rpm, the average failure load, more than 3000 N, was obtained for FSLW produced under 30, 50 and 70 mm/min. In comparison, the average failure load of ~2693.5 N was observed using a travel speed of 2000 rpm and the welding speeds of 30, 50 and 70 mm/min. When the rotation speed was fixed as 1000 and 2000 rpm, respectively, the mechanical properties of the joint first increased and then decreased with the increased welding speed. However, the mechanical properties of the joint slightly changed when the rotation speed was fixed as 1500 rpm. Based on the tensile-shear forces F, the mechanical property for each parameter was ranked in order of merit as follows: P2 > P3 > P4 > P6 > P5 > P1 > P8 > P9 > P7.
The correlation coefficient was an indicator of the degree of correlation between two variables. Its value was used to represent correlations between two variables. The absolute value of correlation coefficient was above 0.8, which indicated that the two variables had a strong correlation [38]. On the contrary, if the correlation coefficient is close to 0, there was no correlation between the two variables. In the present work, combined with the above analysis the two variables (the relative approach degree B and the tensile-shear forces F) were as follows:
B = ( P 1 , P 2 , P 6 , P 5 , P 3 , P 4 , P 7 , P 9 , P 8 ) , F = ( P 2 , P 3 , P 4 , P 6 , P 5 , P 1 , P 8 , P 9 , P 7 )
Therefore, we used the CORREL function to calculate the Pearson correlation coefficient between two measurement variables. The CORREL function is as follows [34]:
ρ B , F = C o v ( B , F ) δ B δ F
where ρ B , F is the correlation coefficient, C o v ( B , F ) is the covariance, and δ B and δ F are the standard deviation. According to Equation (8), the correlation coefficient ρ B , F was 0.81. This showed that B and F had a strong correlation. In the present work, P1, P2 and P3 represent low rotational speeds, P4, P5 and P6 represent medium rotational speeds, and P7, P8 and P9 represent high rotational speeds. On the whole, the mechanical properties of the joint at low and medium rotational speeds exceeded 3000 N, higher than that at high rotational speeds. The reason for the results may be related to the phenomenon of resonance. The spindle resonates when the rotation speed is 2000 rpm. Furthermore, at high rotational speeds, the worst case is the P7. The main reason for this result is related to excessive welding heat input. It is worth noting that the evaluation model is consistent with the experimental results.

5. Conclusions

  • Based on the Design Expert 12.0 software, the continuous variation process of Fx, Fy and Fz with the change of the welding process parameters (ω = 1000–2000 rpm and v = 30–50 mm/min) were successfully predicted. The results showed that Fz was influenced most strongly by the welding parameters, and the effects of the welding parameters on the three forces were in the order of Fz > Fy > Fx. In the vicinity of 1000 rpm and 30 mm/min, all three forces on the spindle showed a trend of rapid decrease, which could be the reason for the great variation in the mechanical properties.
  • When ω = 1000–2000 rpm, the vibration acceleration of three directions increased as the welding speed and rotational speed increased while v = 30 and 50 mm/min. The vibration acceleration of ω = 1000 and 1500 rpm was larger than ω = 2000 rpm in the direction of X, Y, and the vibration acceleration decreased with the rotational speed increase when ω = 2000 rpm in the direction of Z.
  • Based on TOPSIS, a dynamic performance evaluation model for the FSLW spindle was established. The quality of the weld was estimated based on the relative approach degree B of the spindle dynamic performance relative to the ideal performance. The influence of the spindle dynamic performance on the quality of the weld was evaluated comprehensively and verified experimentally. Within a reasonable range of welding processing parameters, the evaluation model was found to be consistent with the experimental results.

Author Contributions

Conceptualization, Y.Z. (Yadong Zhao); investigation, Y.L., Y.Z. (Yangming Zhang) and Z.W.; methodology, Y.L.; software, Y.Z. (Yafang Zhai); supervision, X.G.; validation, Y.Z. and Z.W.; formal analysis, H.C.; data curation, H.Z. and Y.Z.; writing—review and editing, X.G. and S.W. All authors have read and agreed to the published version of the manuscript.

Funding

This work was supported by the Henan Science and Technology Planning Program (182102210019), the Postdoctoral Innovation Practice Base Start-Up Fund of the Anyang Institute of Technology (BHJ2019005), and Training plan for young key teachers in colleges and universities of Henan province (2020GGJS236).

Institutional Review Board Statement

Not applicable.

Informed Consent Statement

Not applicable.

Data Availability Statement

Data sharing is not applicable to this article.

Conflicts of Interest

The authors declare no conflict of interest.

References

  1. Türe, Y.; Türe, C. An assessment of using Aluminum and Magnesium on CO2 emission in European passenger cars. J. Clean. Prod. 2020, 247, 119–120. [Google Scholar] [CrossRef]
  2. Ferreira, V.; Merchán, M.; Egizabal, P.; de Cortázar, M.G.; Irazustabarrena, A. Technical and environmental evaluation of a new high performance material based on magnesium alloy reinforced with submicrometre-sized TiC particles to develop automotive lightweight components and make transport sector more sustainable. J. Mater. Res. Technol. 2019, 8, 2549–2564. [Google Scholar] [CrossRef]
  3. Xiong, X.; Yang, Y.; Li, J.; Li, M.; Peng, J. Research on the microstructure and properties of a multi-pass friction stir processed 6061Al coating for AZ31 Mg alloy. J. Magnes. Alloy. 2019, 7, 696–706. [Google Scholar] [CrossRef]
  4. Mohammadi, J.; Behnamian, Y.; Mostafaei, A.; Gerlich, A.P. Tool geometry, rotation and travel speeds effects on the properties of dissimilar magnesium/aluminum friction stir welded lap joints. Mater. Des. 2015, 75, 95–112. [Google Scholar] [CrossRef]
  5. Yang, T.; Wang, K.; Zhang, D.; Huang, J. Contact-reaction brazing of an AZ31 magnesium/3003 aluminum alloy using a silver-copper-zinc interlayer. J. Mater. Process. Technol. 2017, 249, 531–537. [Google Scholar] [CrossRef]
  6. Azizi, A.; Alimardan, H. Effect of welding temperature and duration on properties of 7075 Al to AZ31B Mg diffusion bonded joint. Trans. Nonferr. Met. Soc. China 2016, 26, 85–92. [Google Scholar] [CrossRef]
  7. Gu, X.; Sui, C.; Liu, J.; Li, D.; Meng, Z. Microstructure and mechanical properties of Mg/Al joints welded by ultrasonic spot welding with Zn interlayer. Mater. Des. 2019, 181, 103–108. [Google Scholar] [CrossRef]
  8. Wei, H.L.; Elmer, J.W.; Debroy, T. Crystal growth during keyhole mode laser welding. Acta Mater. 2017, 133, 10–20. [Google Scholar] [CrossRef]
  9. Zhang, Y.; Luo, Z.; Li, Y.; Liu, Z.; Huang, Z. Microstructure characterization and tensile properties of Mg/Al dissimilar joints manufactured by thermo-compensated resistance spot welding with Zn interlayer. Mater. Des. 2015, 75, 166–173. [Google Scholar] [CrossRef]
  10. Yu, H.; Xu, Y.; Lv, N.; Chen, H.; Chen, S. Arc spectral processing technique with its application to wire feed monitoring in Al–Mg alloy pulsed gas tungsten arc welding. J. Mater. Process. Technol. 2013, 213, 707–716. [Google Scholar] [CrossRef]
  11. Zhao, Y.; Luo, Y.; Zhang, Z.; Zhang, H.; Guo, X. Fractal Dimension Characterization of Joint Surface Morphology on Dissimilar Friction Stir Lap Welding of Al/Mg. Materials 2019, 12, 3941. [Google Scholar] [CrossRef] [PubMed] [Green Version]
  12. Meng, X.; Huang, Y.; Cao, J.; Shen, J.; Santos, J.F.D. Recent progress on control strategies for inherent issues in friction stir welding. Prog. Mater. Sci. 2020, 115, 100706. [Google Scholar] [CrossRef]
  13. Heidarzadeh, A.; Mironov, S.; Kaibyshev, R.; Çam, G.; Simar, A. Friction stir welding/processing of metals and alloys: A comprehensive review on microstructural evolution. Prog. Mater. Sci. 2020, 100752. [Google Scholar] [CrossRef]
  14. Zhang, J.; Huang, G.; Liu, S.; Xie, Y.; Wang, G. Microstructure evolution and mechanical properties of friction stir welded dissimilar joints of as-extruded AM60 and AZ31 alloys. Mater. Sci. Eng. A 2019, 759, 479–489. [Google Scholar] [CrossRef]
  15. Zhang, Y.; Huang, Y.; Meng, X.; Li, J.; Xie, Y. Friction stir lap welding of AA2024-T4 with drastically different thickness. Int. J. Adv. Manuf. Technol. 2020, 106, 3683–3691. [Google Scholar] [CrossRef]
  16. Li, P.; You, G.; Wen, H.; Guo, W.; Tong, X. Friction stir welding between the high-pressure die casting of AZ91 magnesium alloy and A383 aluminum alloy. J. Mater. Process. Technol. 2019, 264, 55–63. [Google Scholar] [CrossRef]
  17. Mehta, K.P.; Carlone, P.; Astarita, A.; Scherillo, F.; Rubino, F. Conventional and cooling assisted friction stir welding of AA6061 and AZ31B alloys. Mater. Sci. Eng. A 2019, 759, 252–261. [Google Scholar] [CrossRef]
  18. Cao, X.; Jahazi, M. Effect of tool rotational speed and probe length on lap joint quality of a friction stir welded magnesium alloy. Mater. Des. 2011, 32, 1–11. [Google Scholar] [CrossRef]
  19. Meng, X.; Jin, Y.; Ji, S.; Yan, D. Improving friction stir weldability of Al/Mg alloys via ultrasonically diminishing pin adhesion. J. Mater. Sci. Technol. 2018, 34, 1817–1822. [Google Scholar] [CrossRef]
  20. Sahu, P.K.; Vasudevan, N.P.; Das, B.; Pal, S. Assessment of self-reacting bobbin tool friction stir welding for joining AZ31 magnesium alloy at inert gas environment. J. Magnes. Alloy. 2019, 7, 661–671. [Google Scholar] [CrossRef]
  21. Md, S.; Birru, A.K. Mechanical and metallurgical properties of friction stir welded dissimilar joints of AZ91 magnesium alloy and AA 6082-T6 aluminium alloy. J. Magnes. Alloys 2019, 7, 264–271. [Google Scholar] [CrossRef]
  22. Forcellese, A.; Martarelli, M.; Simoncini, M. Effect of process parameters on vertical forces and temperatures developed during friction stir welding of magnesium alloys. Int. J. Adv. Manuf. Technol. 2016, 85, 595–604. [Google Scholar] [CrossRef]
  23. Boccarusso, L.; Astarita, A.; Carlone, P.; Scherillo, F.; Rubino, F. Dissimilar friction stir lap welding of AA 6082—Mg AZ31: Force analysis and microstructure evolution. J. Manuf. Process. 2019, 44, 376–388. [Google Scholar] [CrossRef]
  24. Chen, S.; Zhang, J.; Wang, D.; Wang, J.; Li, R. Study on Low Axial Load Friction Stir Lap Joining of 6061-T6 and Zinc-Coated Steel. Metall. Mater. Trans. A 2019, 50, 4642–4651. [Google Scholar] [CrossRef]
  25. Shojaeefard, M.; Akbari, M.; Asadi, P. Multi objective optimization of friction stir welding parameters using FEM and neural network. Int. J. Precis. Eng. Manuf. 2014, 15, 2351–2356. [Google Scholar] [CrossRef]
  26. Shojaeefard, M.; Behnagh, R.; Akbari, M.; Givi, M.; Farhani, F. Modelling and pareto optimization of mechanical properties of friction stir welded AA7075/AA5083 butt joints using neural network and particle swarm algorithm. Mater. Des. 2013, 44, 190–198. [Google Scholar] [CrossRef]
  27. Urbikaina, G.; Olverab, D.; Lacallea, L.N.L.; Elías-Zúñigab, A. Spindle speed variation technique in turning operations: Modeling and real implementation. J. Sound Vib. 2016, 383, 384–396. [Google Scholar] [CrossRef]
  28. Chen, D.; Li, J.; Zhao, H.; Tan, Z.; Xiong, J. Effect of Submillimeter Variation in Plunge Depth on Microstructure and Mechanical Properties of FSLW 2A12 Aluminum Alloy Joints. Acta Metall. Sin. Engl. Lett. 2020, 33, 165–171. [Google Scholar] [CrossRef] [Green Version]
  29. Gao, S.; Wu, C.; Padhy, G. Effect of leading ultrasonic vibrations on the welding forces of friction stir lap welding. Int. J. Adv. Manuf. Technol. 2019, 104, 3181–3189. [Google Scholar] [CrossRef]
  30. Tan, S.; Zheng, F.; Chen, J.; Han, J.; Wu, Y. Effects of process parameters on microstructure and mechanical properties of friction stir lap linear welded 6061 aluminum alloy to NZ30K magnesium alloy. J. Magnes. Alloy. 2017, 5, 56–63. [Google Scholar] [CrossRef]
  31. Rao, H.M.; Jordon, J.B.; Barkey, M.E.; Guo, Y.B.; Su, X. Influence of structural integrity on fatigue behavior of friction stir spot welded AZ31 Mg alloy. Mater. Sci. Eng. A 2013, 564, 369–380. [Google Scholar] [CrossRef]
  32. Rajakumar, S.; Razalrose, A.; Balasubramanian, V. Friction stir welding of AZ61A magnesium alloy. Int. J. Adv. Manuf. Technol. 2013, 68, 277–292. [Google Scholar] [CrossRef]
  33. Liu, H.; Zhao, Y.; Hu, Y.; Chen, S.; Lin, Z. Microstructural characteristics and mechanical properties of friction stir lap welding joint of Alclad 7B04-T74 aluminum alloy. Int. J. Adv. Manuf. Technol. 2015, 78, 1415–1425. [Google Scholar] [CrossRef]
  34. Shanavas, S.; Dhas, J.E.R. Parametric optimization of friction stir welding parameters of marine grade aluminium alloy using response surface methodology. Trans. Nonferr. Met. Soc. China 2017, 27, 2334–2344. [Google Scholar] [CrossRef]
  35. Kadaganchi, R.; Gankidi, M.R.; Gokhale, H. Optimization of process parameters of aluminum alloy AA 2014-T6 friction stir welds by response surface methodology. Def. Technol. 2015, 11, 209–219. [Google Scholar] [CrossRef] [Green Version]
  36. Mohammadi, J.; Behnamian, Y.; Mostafaei, A.; Izadi, H.; Saeid, T. Friction stir welding joint of dissimilar materials between AZ31B magnesium and 6061 aluminum alloys: Microstructure studies and mechanical characterizations. Mater. Charact. 2015, 101, 189–207. [Google Scholar] [CrossRef]
  37. Abdollahzadeh, A.; Shokuhfar, A.; Cabrera, J.M.; Zhilyaev, A.P.; Omidvar, H. In-situ nanocomposite in friction stir welding of 6061-T6 aluminum alloy to AZ31 magnesium alloy. J. Mater. Process. Technol. 2019, 263, 296–307. [Google Scholar] [CrossRef]
  38. Yang, C. Correlation coefficient evaluation for the fuzzy interval data. J. Bus. Res. 2016, 69, 2138–2144. [Google Scholar] [CrossRef]
Figure 1. (a) Friction stir lap welding (FSLW) equipment. (b) Tensile shear testing and metallographic samples.
Coatings 11 00019 g001
Figure 2. Spindle dynamic performance evaluation model using the Technique for Order Preference by Similarity to the Ideal Solution (TOPSIS).
Coatings 11 00019 g002
Figure 3. Schematic diagram of the time curves of the three forces on the spindle and the locations of the different phases under the condition of 1500 rpm and 70 mm/min.
Coatings 11 00019 g003
Figure 4. The three directional forces during the FSLW process stage. (a) 1000 rpm, 30 mm/min; (b) 1000 rpm, 50 mm/min; (c) 1000 rpm, 70 mm/min; (d) 1500 rpm, 30 mm/min; (e) 1500 rpm, 50 mm/min; (f) 1500 rpm, 70 mm/min; (g) 2000 rpm, 30 mm/min; (h) 2000 rpm, 50 mm/min; (i) 2000 rpm, 70 mm/min.
Coatings 11 00019 g004
Figure 5. Normal distribution curve fitting of the forces when ω = 2000 rpm and ν = 30 mm/min: (a) Fx, (b) Fy and (c) Fz.
Coatings 11 00019 g005
Figure 6. Correlation graphs of experimental and predicted values: (a) Fx, (b) Fy, and (c) Fz.
Coatings 11 00019 g006
Figure 7. Response surface of welding process parameters and the three forces of the spindle: (a) Fx, (b) Fy, and (c) Fz; Residual plots: (d) Fx, (e) Fy, and (f) Fz.
Coatings 11 00019 g007
Figure 8. Vibration acceleration frequency spectra in the direction of Z. (a) 1000 rpm, 50 mm/min; (b) 1500 rpm, 50 mm/min; (c) 2000 rpm, 50 mm/min; (d) 1500 rpm, 30 mm/min; (e) 1500 rpm, 70 mm/min.
Coatings 11 00019 g008
Figure 9. The mean value of vibration acceleration in the three directions: (a) X-direction, (b) Y-direction, and (c) Z-direction.
Coatings 11 00019 g009
Figure 10. An analytic hierarchy process diagram.
Coatings 11 00019 g010
Figure 11. Transverse cross-sections of different areas (ad) in the Al–Mg interface (P1).
Coatings 11 00019 g011
Figure 12. Transverse cross-sections of different areas (ad) in the Al–Mg interface (P7).
Coatings 11 00019 g012
Figure 13. Cross-sectional appearance and micro-hardness of the joint: (a,d) P1, (b,e) P5, and (c,f) P7.
Coatings 11 00019 g013
Figure 14. Tensile-shear forces of the joint.
Coatings 11 00019 g014
Table 1. Chemical composition of 1060 Al and AZ31B Mg (wt.%).
MaterialsAlMgZnCuMnSiBeFe
1060 Al99.60.030.050.050.030.250.10.35
AZ31B Mg3.1995.450.810.050.330.020.10.005
Table 2. Dynamic performance of spindle under different welding parameters.
Parameter Codingω (rpm)ν (mm/min)Forces (N)Vibration Acceleration (m/s2)
FxFyFzaxayaz
1100030300808.121380.0270.0150.015
2100050302.1884.725290.010.0050.052
3100070327.4125040930.1360.1580.287
4150030310826.332600.0510.0690.127
5150050322.5103238910.0540.0550.104
6150070342133149150.160.1950.201
7200030341789.124270.0470.0760.108
8200050337.8906.926960.0570.1180.256
9200070352.1924.428300.0620.0830.167
Table 3. Important factors and their levels.
FactorCoding Level
−101
ω (rpm)100015002000
v (mm/min)305070
Table 4. Test results of matrix independent variables and their response values.
No.ω (rpm)v (mm/min)Fx (N)Fy (N)Fz (N)
100322.510323891
20−1310826.33260
31−1341789.12427
4−10302.1884.72529
500322.510323891
610337.8906.92696
7−11327.412504093
80134213314915
911352.1924.43830
Table 5. ANOVA test results.
SourceSum of SquaresdfMean SquareF Valuep-Value Prob > F
Model5,524,00051,105,00078.350.0022Significant
ω24,809.12124,809.121.760.2767-
v2,607,00012,607,000184.880.0009-
ωv86,610.53186,610.536.140.0894-
ω22,483,00012,483,000176.060.0009-
v2203,8001203,80014.450.0320-
Residual42,306.67314,102.22---
Lack of Fit42,306.67221,153.33---
Pure Error011,105,000---
Cor Total5,567,0008 ---
Table 6. Meaning of aij scale.
aij ScaleFactor Ci is ___ factor Cj
1Equally important to
3Slightly more important than
5More important than
7Much more important than
9Extremely more important than
2, 4, 6, 8The intermediate value between two adjacent judgments of
Publisher’s Note: MDPI stays neutral with regard to jurisdictional claims in published maps and institutional affiliations.

