1. Introduction
The drawbacks of oil-based or synthetic polymers have shifted the interest to biopolymer films and coatings with similar properties from a sustainable point of view in the paper industry. The promising potential of biopolymer films and coatings has been well documented due to their competitiveness, sustainability, and enhanced technical advantages [
1,
2]. Biopolymers are obtained or derived from renewable resources, and they can deliver numerous environmental advantages, such as biocompatibility, biodegradability, nontoxicity, and enhanced recyclability, compared to traditional synthetic polymers [
3]. Several biopolymers have been commonly utilized as paper and paperboard coating materials, such as starch, cellulose and its derivatives, chitosan and alginates, polyesters (PHA), and polylactic acid (PLA) [
1,
4]. Recently, nanocellulose materials have gained great attention as a potential material for coating applications [
5]. Among the major advantages, the ability to provide an excellent oxygen barrier property and coating layer-induced enhancement of paper strength have been very attractive [
6,
7]. However, the complex rheological behavior of bio-based materials causes challenges in paper coating process applications. The high viscosity, high shear thinning, thixotropy, and viscoelasticity of bio-based materials are the key rheological parameters that pose processing difficulties with existing coating machineries, even though these parameters are responsible for the surface properties of the coated material [
8,
9].
The use of short-dwell coater (SDC) is one of the most recent advances in lightweight coated (LWC) paper production [
10]. However, when bio-based materials are used as coating colors, these types of coaters exhibit a major technical drawback. The flow in the coating chamber of the pond, upstream of the metering blade, contains vortices or recirculating eddies, which lead to nonuniformities in the coat weight and wet streaks or striations in several ways [
11]. Unsteady flow or rapidly fluctuating vortices induce solid concentration gradients due to centrifugal forces and consequently result in unevenness in flow dynamics across the machine. It is most likely that these vortices can entrap small air bubbles that build up to larger air inclusions in the coating color, which will eventually accumulate in the core region of the eddies. Then, the unsteady flow can transfer these air inclusions into the blade gap and adversely affect the coating quality [
12].
Rheological effects of bio-based materials play a major role in determining the resultant thickness and uniformity of the coating film. Generally, the elastic behavior of the material increases the normal stresses under the blade, while shear-thinning influences the distribution of flow and pressure. For instance, Greener and Middleman [
13] reported the impact of selected constitutive models on coating thickness, which was used to define non-Newtonian fluid rheology. Their findings have shown that the choice of models describing the coating material is crucial for accurate analysis of viscoelasticity behavior on coating fluid flow. Investigations on the effects of non-Newtonian fluid rheology on coating thickness and flow patterns reported by Sullivan and Middleman [
14] and Sullivan et al. [
15] were in close agreement with results indicated by Greener and Middleman [
13]. The shear thinning of inelastic materials (carboxymethyl cellulose (CMC)) resulted in an increase in coating thickness compared to the Newtonian fluid. However, when polyacrylamide was incorporated into CMC, elasticity was induced, resulting in reduced coating thickness.
Strenger et al. [
16] studied a constant-viscosity fluid with elasticity (Boger fluid) and showed there was little dependence of the blade geometry such as blade tip angle and thickness on the coating film thickness. However, the elastic behavior of the Boger fluid resulted in a shrinking of the blade gap, which was induced by the ribbing effect due to the presence of normal forces. Furthermore, Olsson [
17] and Olsson and Isaksson [
18] revealed that for viscoelastic fluids, the overall force acting on a stationary blade is lower compared to the Newtonian fluids due to the decreased normal force at the downstream distance. Viscoelastic fluids often appear to plug up the flow at the entrance to the blade nip tube, causing counterrotating vortices to form at the boundary layer on the blade’s inside face. However, Hsu et al. [
19] reported contradictory results showing the normal forces increased sharply with elasticity. The difference in the reported results were mainly due to the different constitutive equations that were considered to describe the rheology of the coating material. Therefore, accurate representation of viscoelasticity using an appropriate constitutive equation is crucial to reconcile with simulation results. Various authors have utilized different model to describe the viscoelasticity of fluid. For instance, K-BKZ [
20], Rolie-Poly [
21], Carreau’s three-parameter [
14], Oldroyd-B [
17], and Giesekus [
17,
21] models are the common constitutive models used to describe the rheology of polymeric coating materials.
Computational fluid dynamics (CFD) simulations can serve as a prominent tool to investigate coating processes and to understand key issues that will lead to better process development [
22]. However, numerical simulations of the short-dwell coating (SDC) process have so far been mainly based on the pigment-type coating color, and viscoelastic effects have not been considered [
23,
24,
25]. However, even with low solid content, cellulose derivative suspensions exhibit strong viscoelastic and high shear-thinning effects [
26,
27]. Viscoelasticity can have a significant impact on the flow characteristics of SDC ponds. Among the remarkable flow features of viscoelastic fluids worth emphasizing are the vortex formation and vortex enhancement mechanisms [
28,
29]. These elastic flow instabilities can create nonuniformities in the velocity and pressure profiles in the cross direction and hence affect the coating thickness and its quality [
30,
31].
In this study, using rheological data reported by Lu and coworkers [
26], four different models were applied to a cellulose derivative suspension in a generalized SDC adapted from currently existing equipment in the paper coating industry. In model 1, a constant viscosity (i.e., Newtonian fluid) was adopted, while in model 2, inelastic shear-thinning behavior was studied through the implementation of the Carreau model. The viscoelastic effects were investigated using Oldroyd-B in model 3 and the Giesekus constitutive equations in model 4. The viscoelastic models were qualitatively validated through a contraction flow problem. ANSYS FLUENT 19.3 was used as the computational platform for this investigation, whereas the viscoelastic models were incorporated through user-defined functions (UDFs).
3. Results and Discussion
Flow in axisymmetric 12:1 contraction channel was used as the test case to validate the viscoelastic models against the numerical results reported by Oliveira et al. [
29].
Figure 5 shows a magnified view of the refined and uniform computational grid near the contraction plane. For the characterization of viscoelastic fluid flow, the Deborah number
De, (defined as
De = (
λU2)/
H2) was used, where
U2 and
H2 are the average velocity and the height in the downstream channel, respectively. For the viscoelastic models, two relaxation time constants, i.e., 3 × 10
−3 and 3 × 10
−5 s, were used to calculate the Deborah number
De = 200 and
De = 2, respectively.
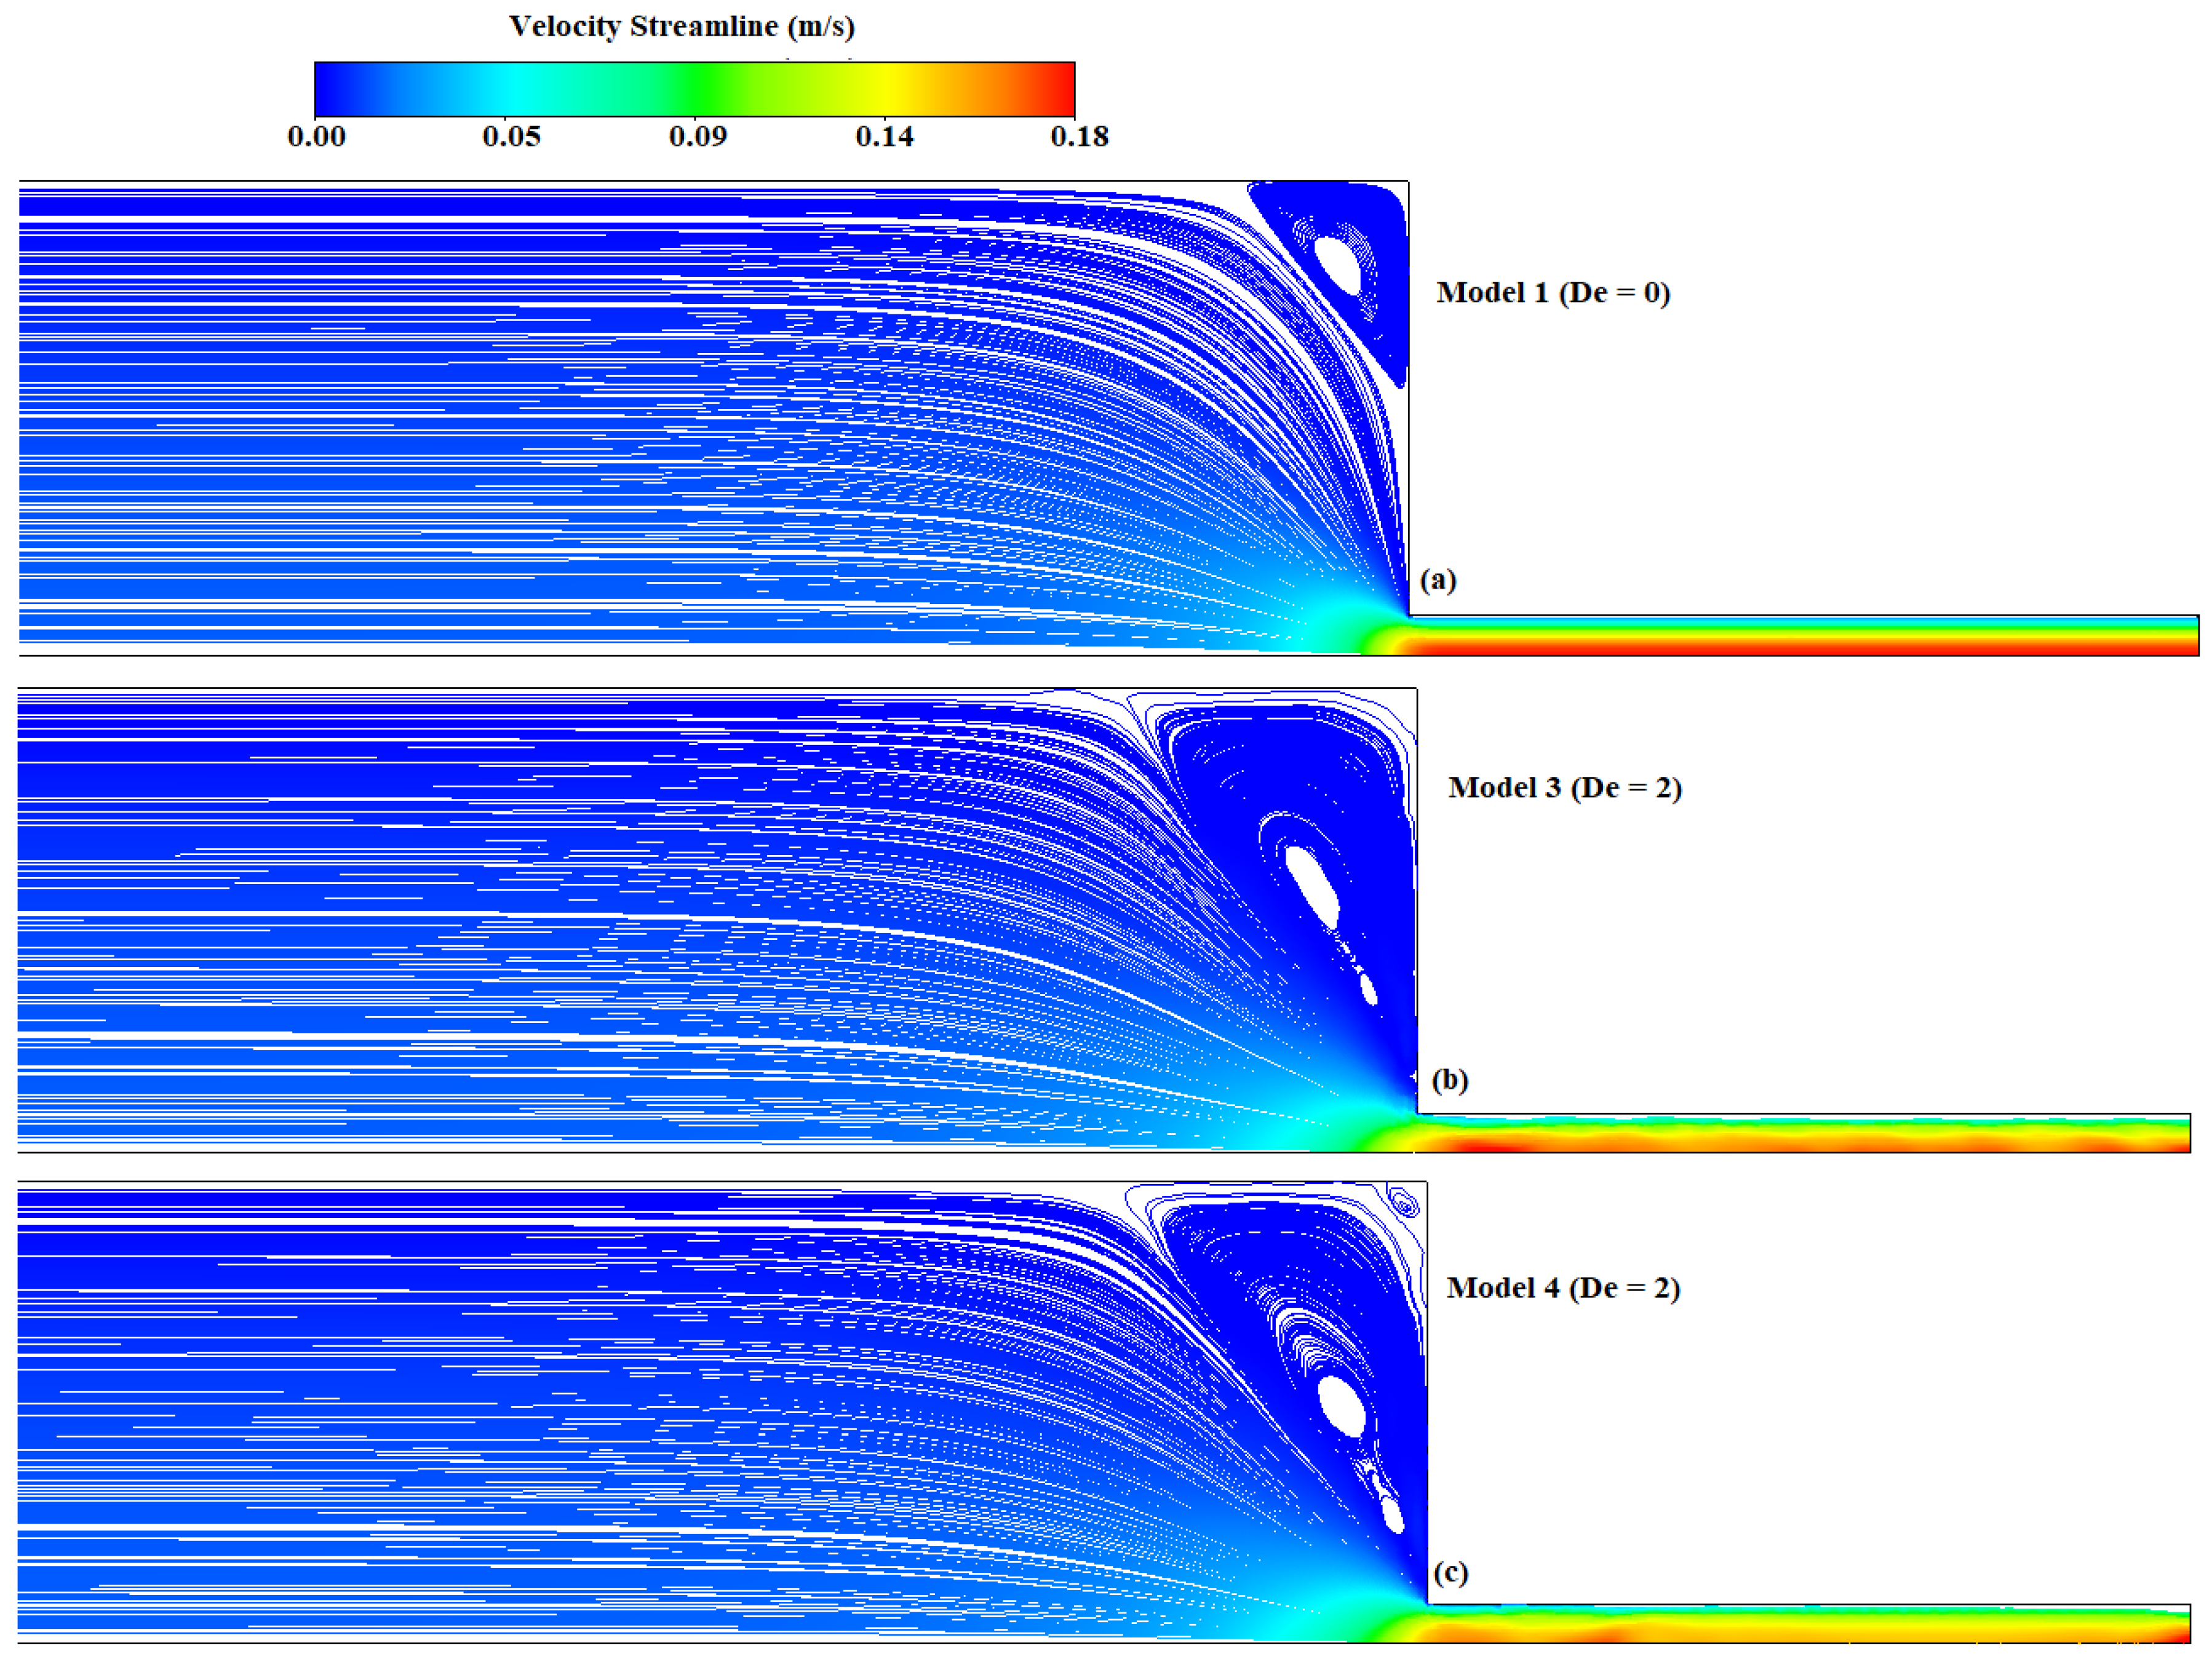
In
Figure 6, the results obtained for the Newtonian model (model 1) (
De = 0), constant viscosity, Oldroyd-B model (model 3) (
De = 2), and the shear-thinning Giesekus model (model 4) (
De = 2) are presented in terms of the magnitude of velocity contour plots. By a qualitative comparison with the numerical results reported by Oliveira et al. [
29], vortex enhancement was observed for the viscoelastic models due to the combination of shear-rate-dependent viscous and elastic effects (
Figure 6b,c). A higher Deborah number was studied for the SDC (discussed in the following sections), which was geometrically similar to the contraction design except for the fact that the base boundary was not stationary. A detailed discussion of the viscoelastic and Newtonian fluid flow through contraction channels is well documented elsewhere [
40].
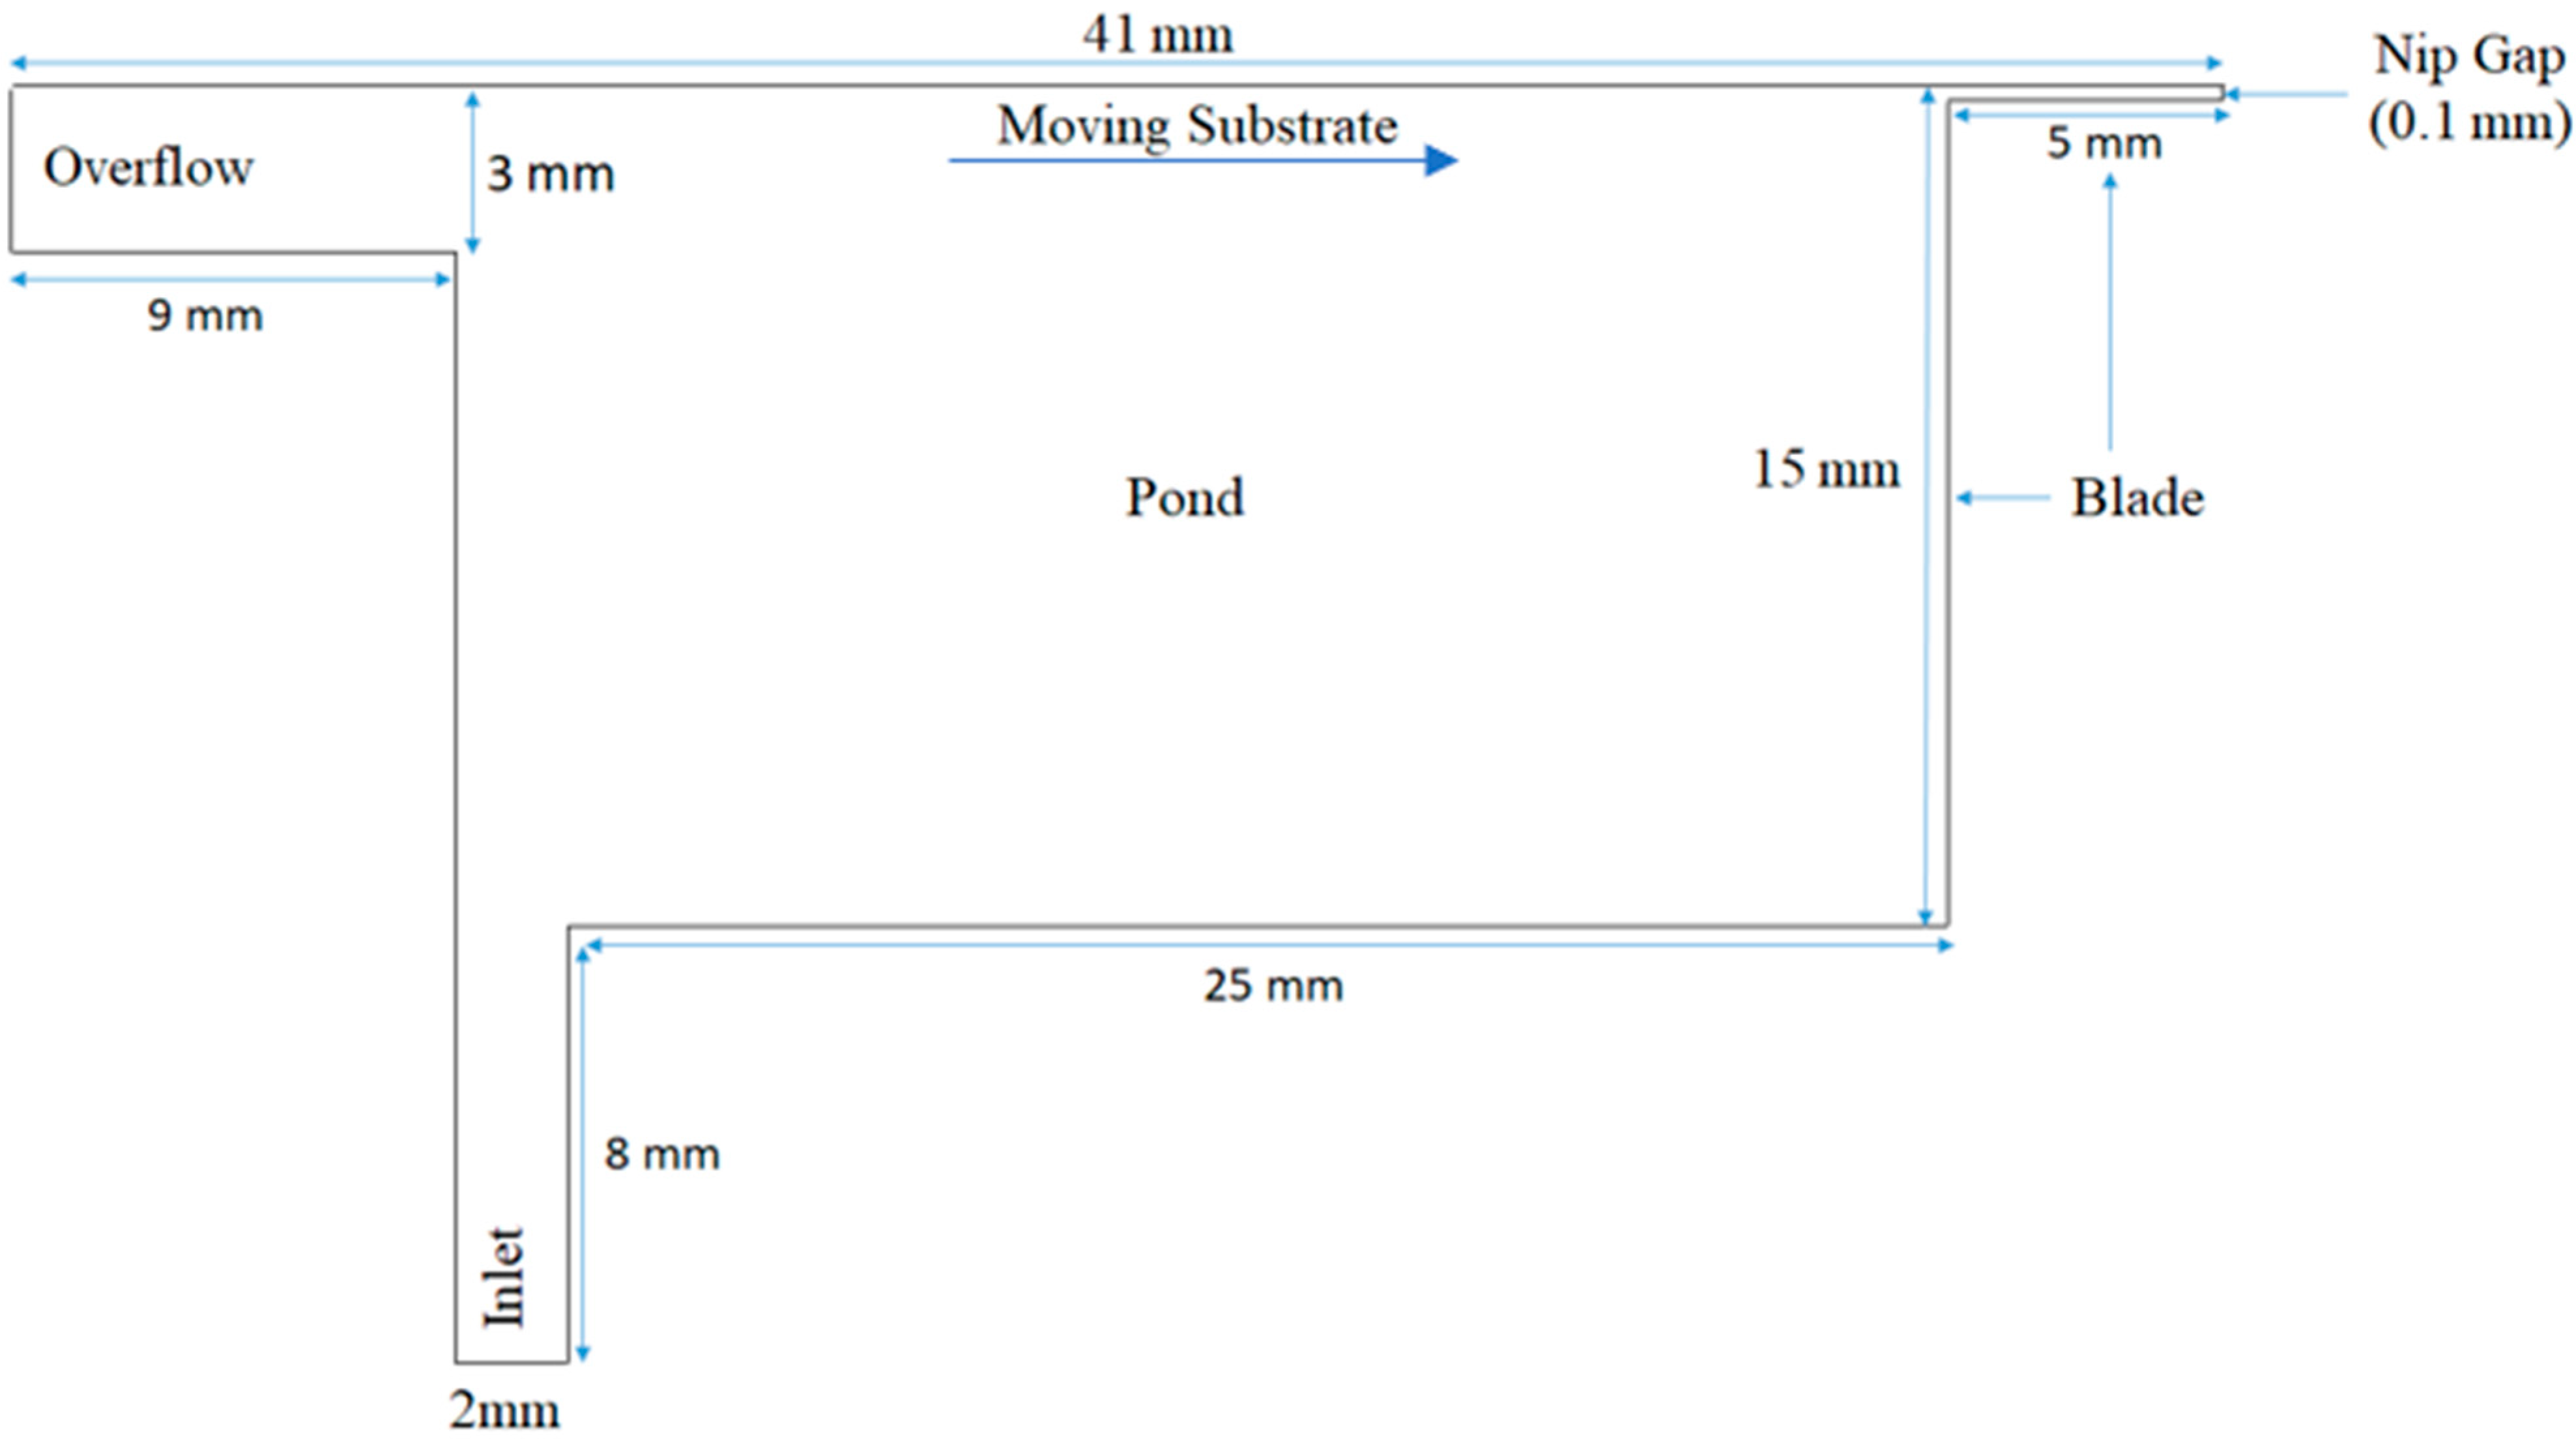
Table 2 lists the experimental data reported by Lu et al. [
26], which was used to compare the four adapted models in a generalized SDC (
Figure 1). The comparison was performed to investigate the effects of viscoelasticity on the flow pattern developed in the pond of the coater. In model 1, the color was assumed to be Newtonian with a constant dynamic viscosity of 300 mPas. Model 2 considered the non-Newtonian flow phenomena taking into account the inelastic shear-thinning character of the color. The so-called Boger fluid [
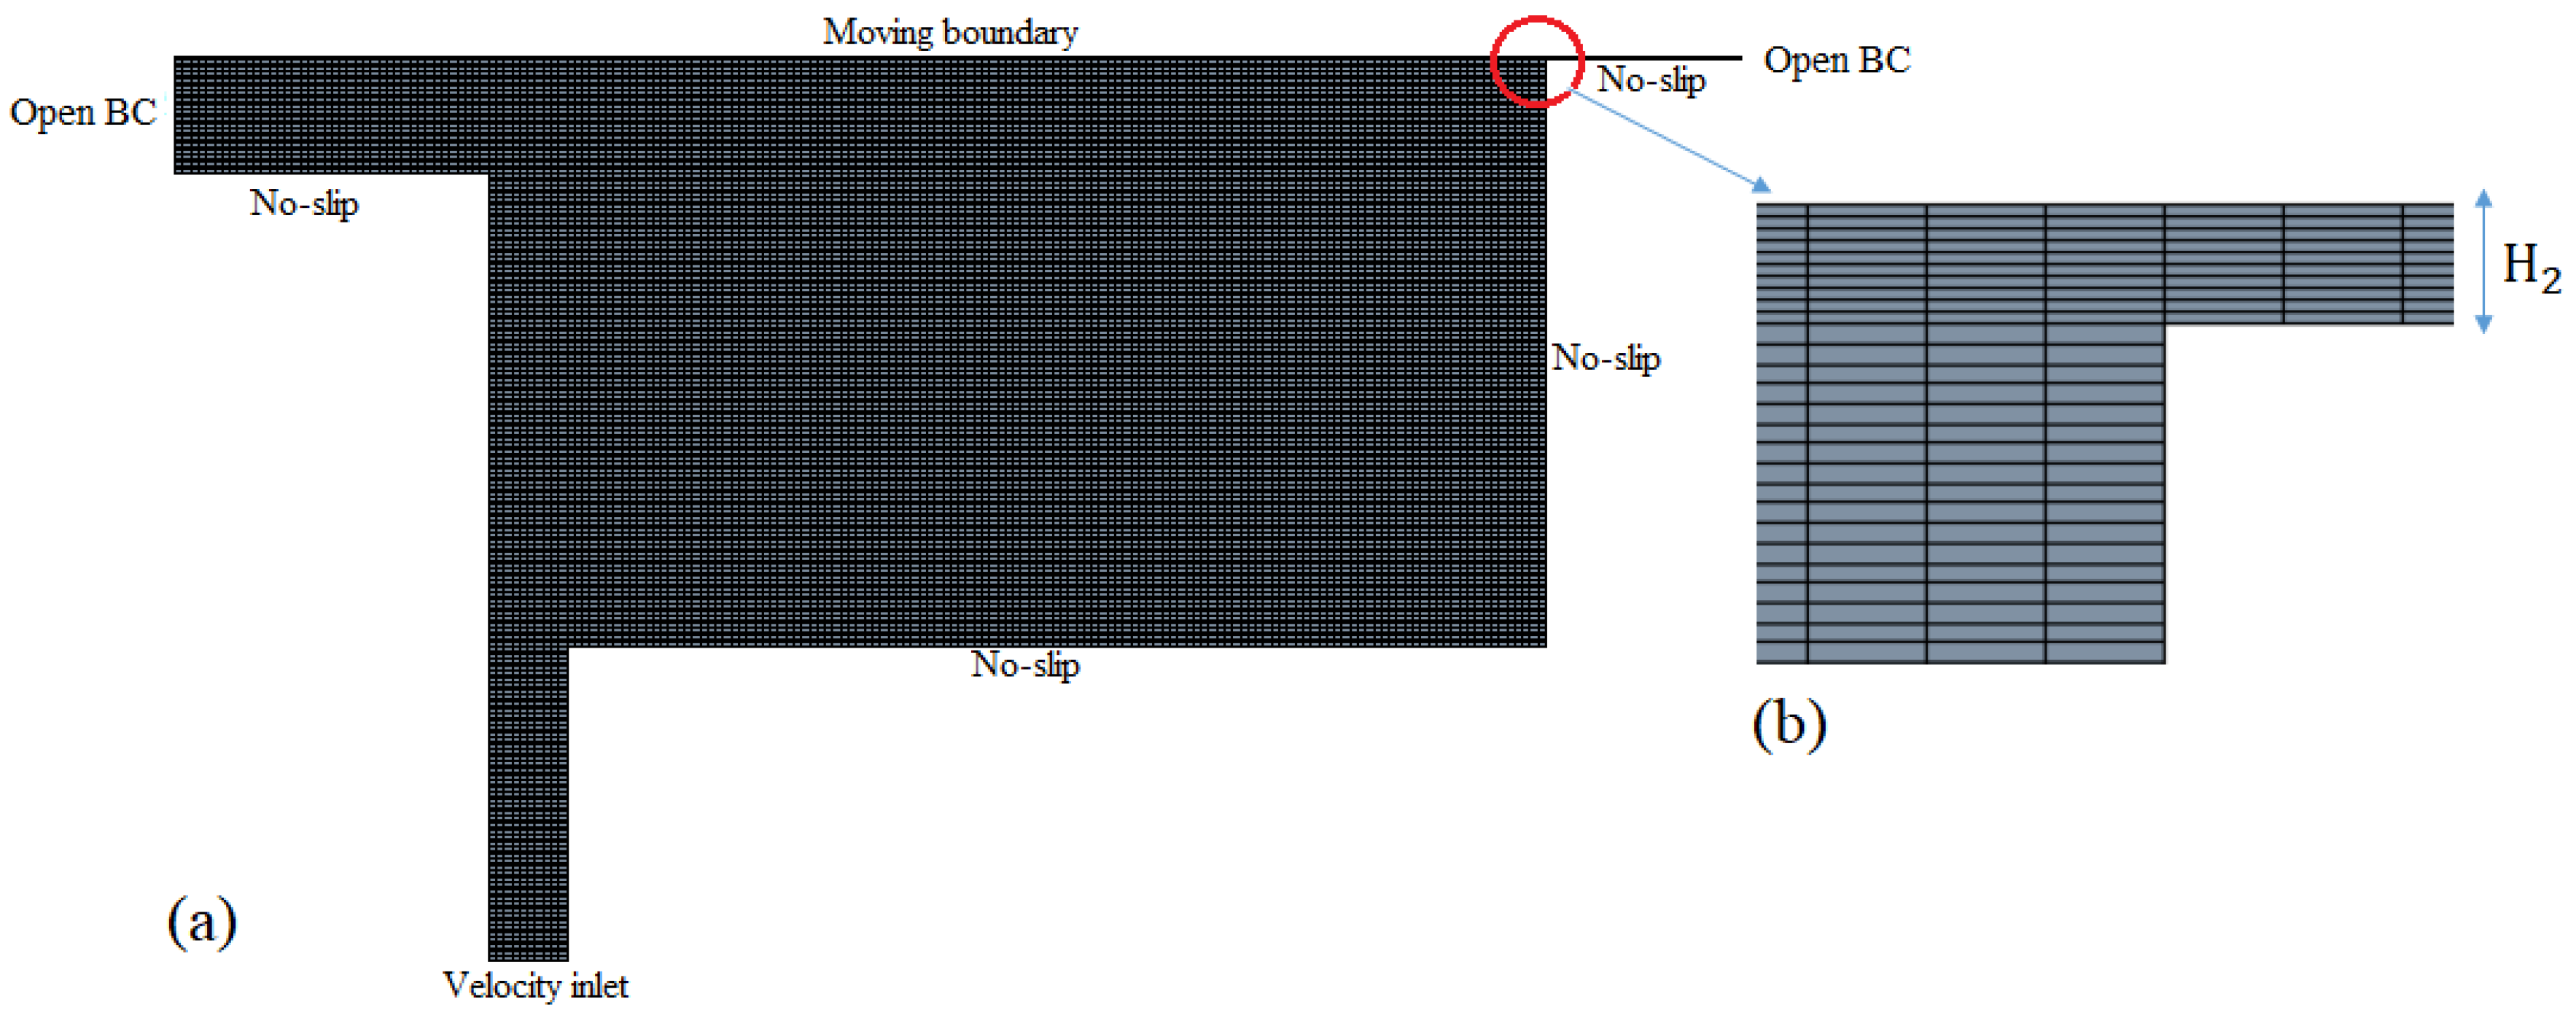
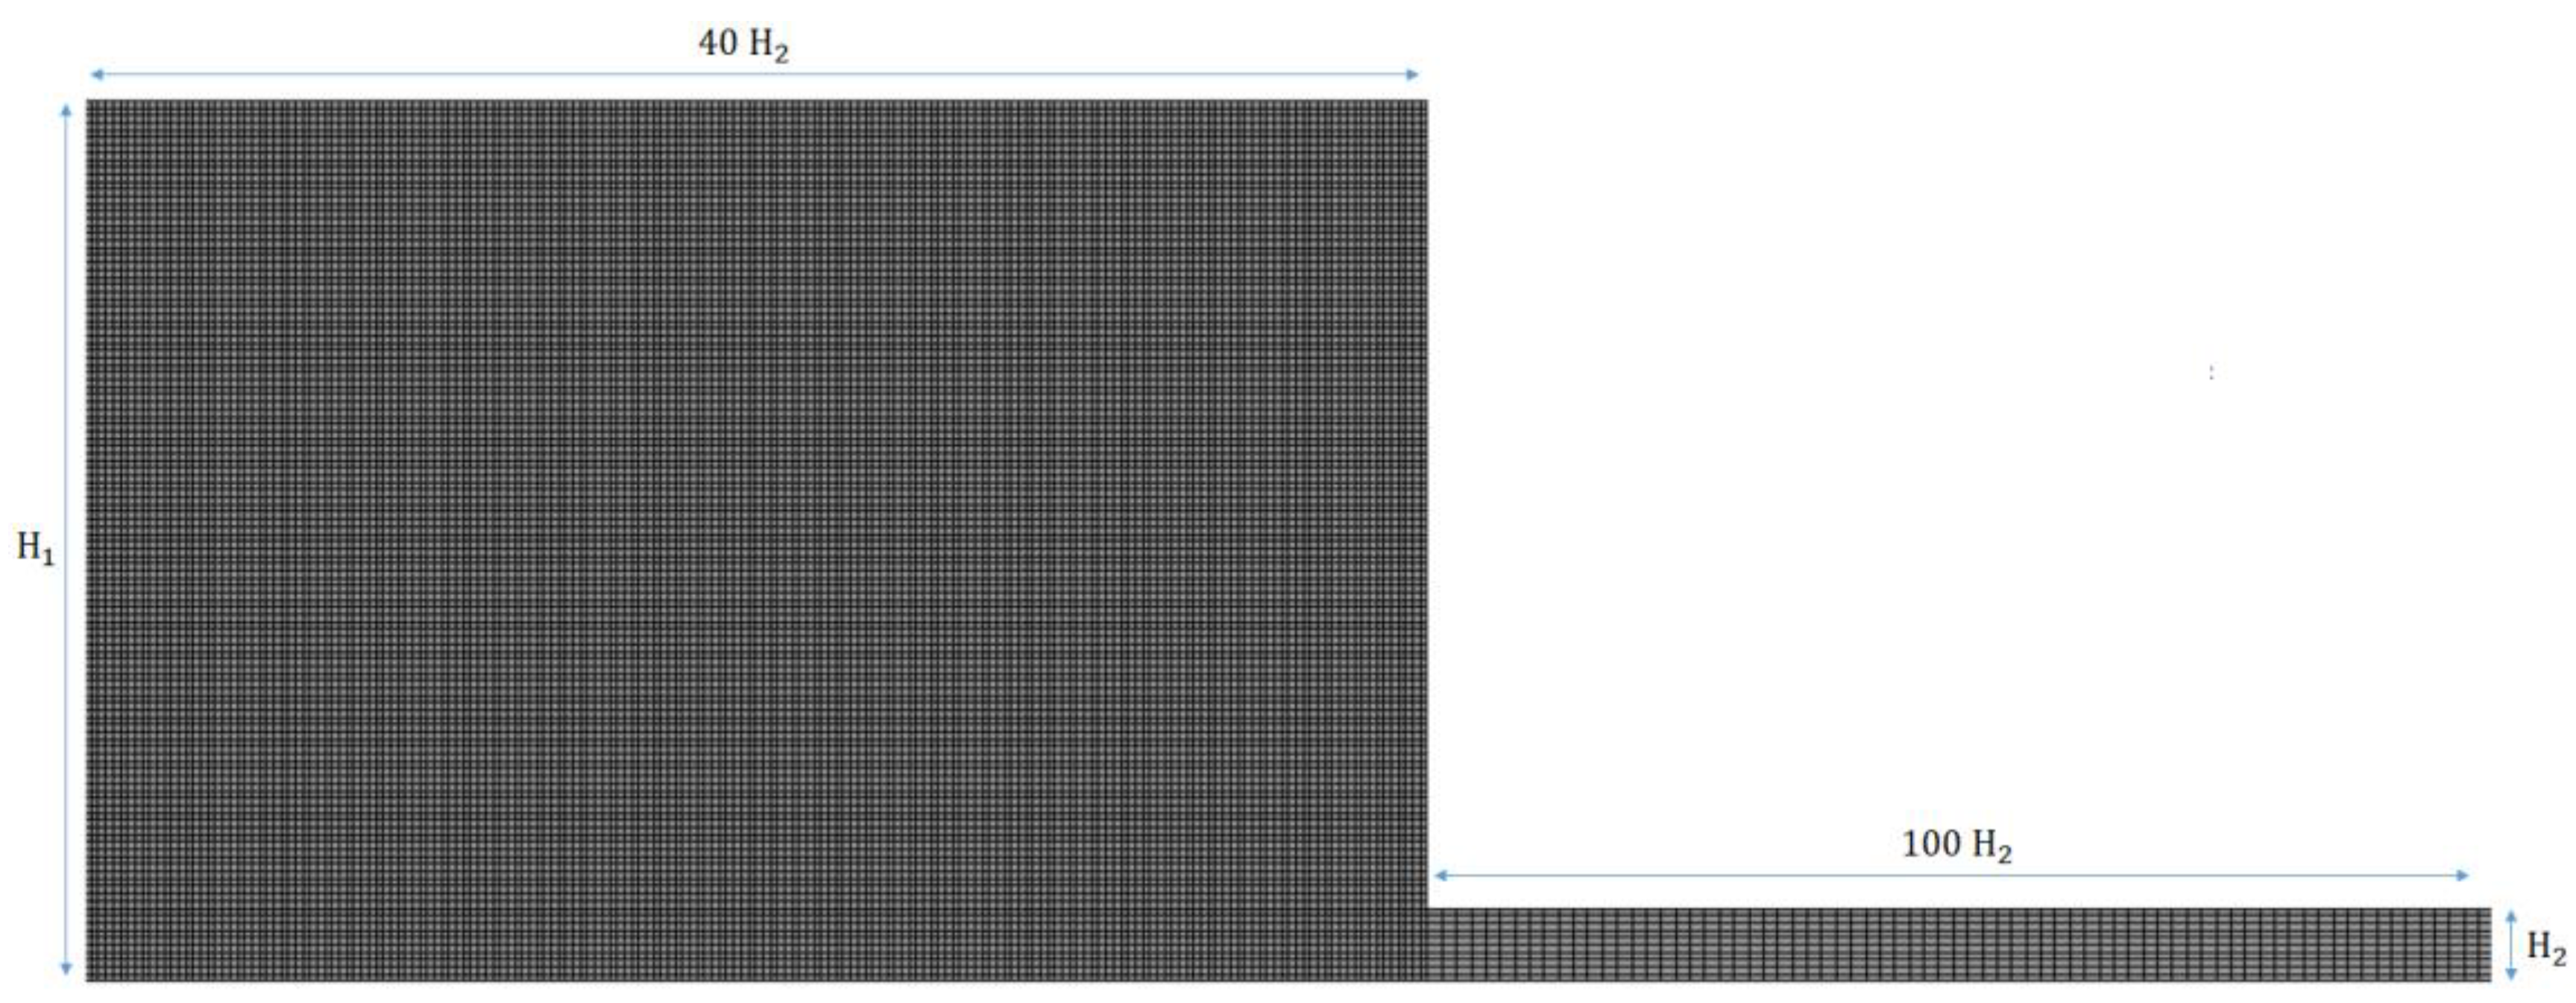
41] was assumed in model 3, in which the viscosity of the color remained nearly constant but with highly elastic rheological behavior of the fluid. Finally, the flow behavior in model 4 was determined by the interaction between the shear-rate-dependent viscosity, fluid inertia, and fluid elasticity. All simulations were conducted on the mesh grid shown in
Figure 2. Here, the height of the narrow channel was considered in the Deborah number to characterize the viscoelastic fluid flow. The modeling parameters for all the cases are given in
Table 2. The density of the suspension was calculated by Equation (10) [
42]:
where
C is the volume concentration of cellulose nanocrystals (CNC) in the suspension,
ρs is the density of the solvent, and
ρp is the density of CNC.
The simulation results are presented in terms of velocity streamlines, distribution of strain rates, pressures, and stresses for the flow field.
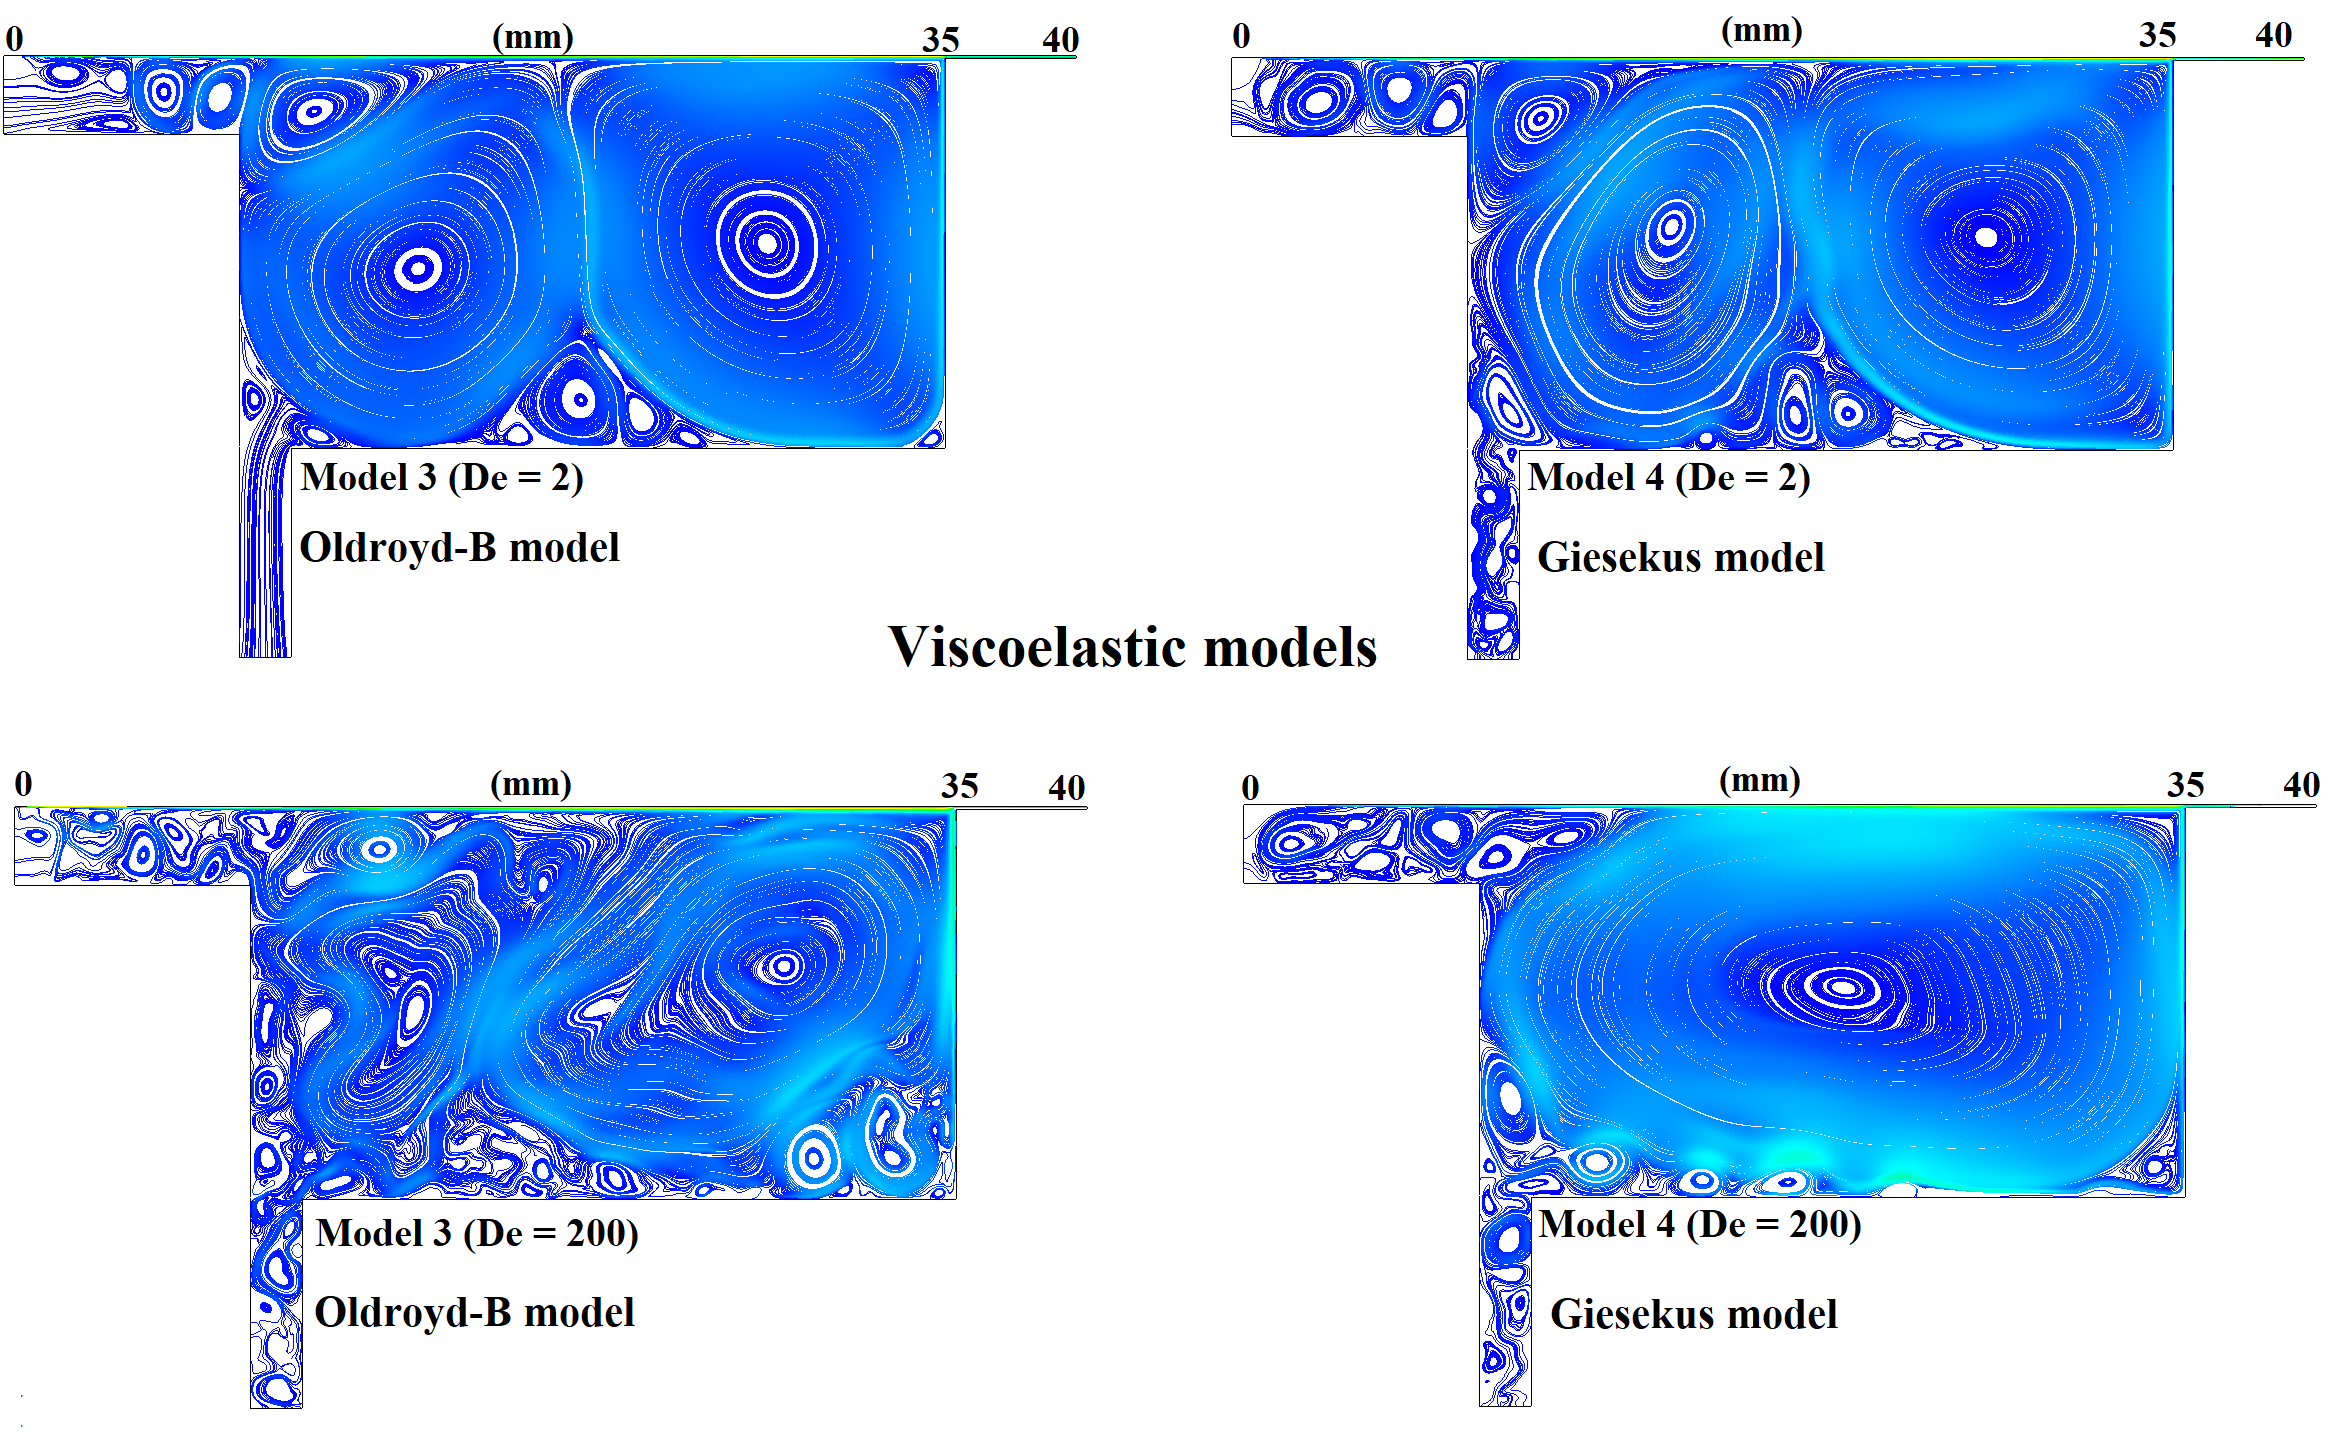
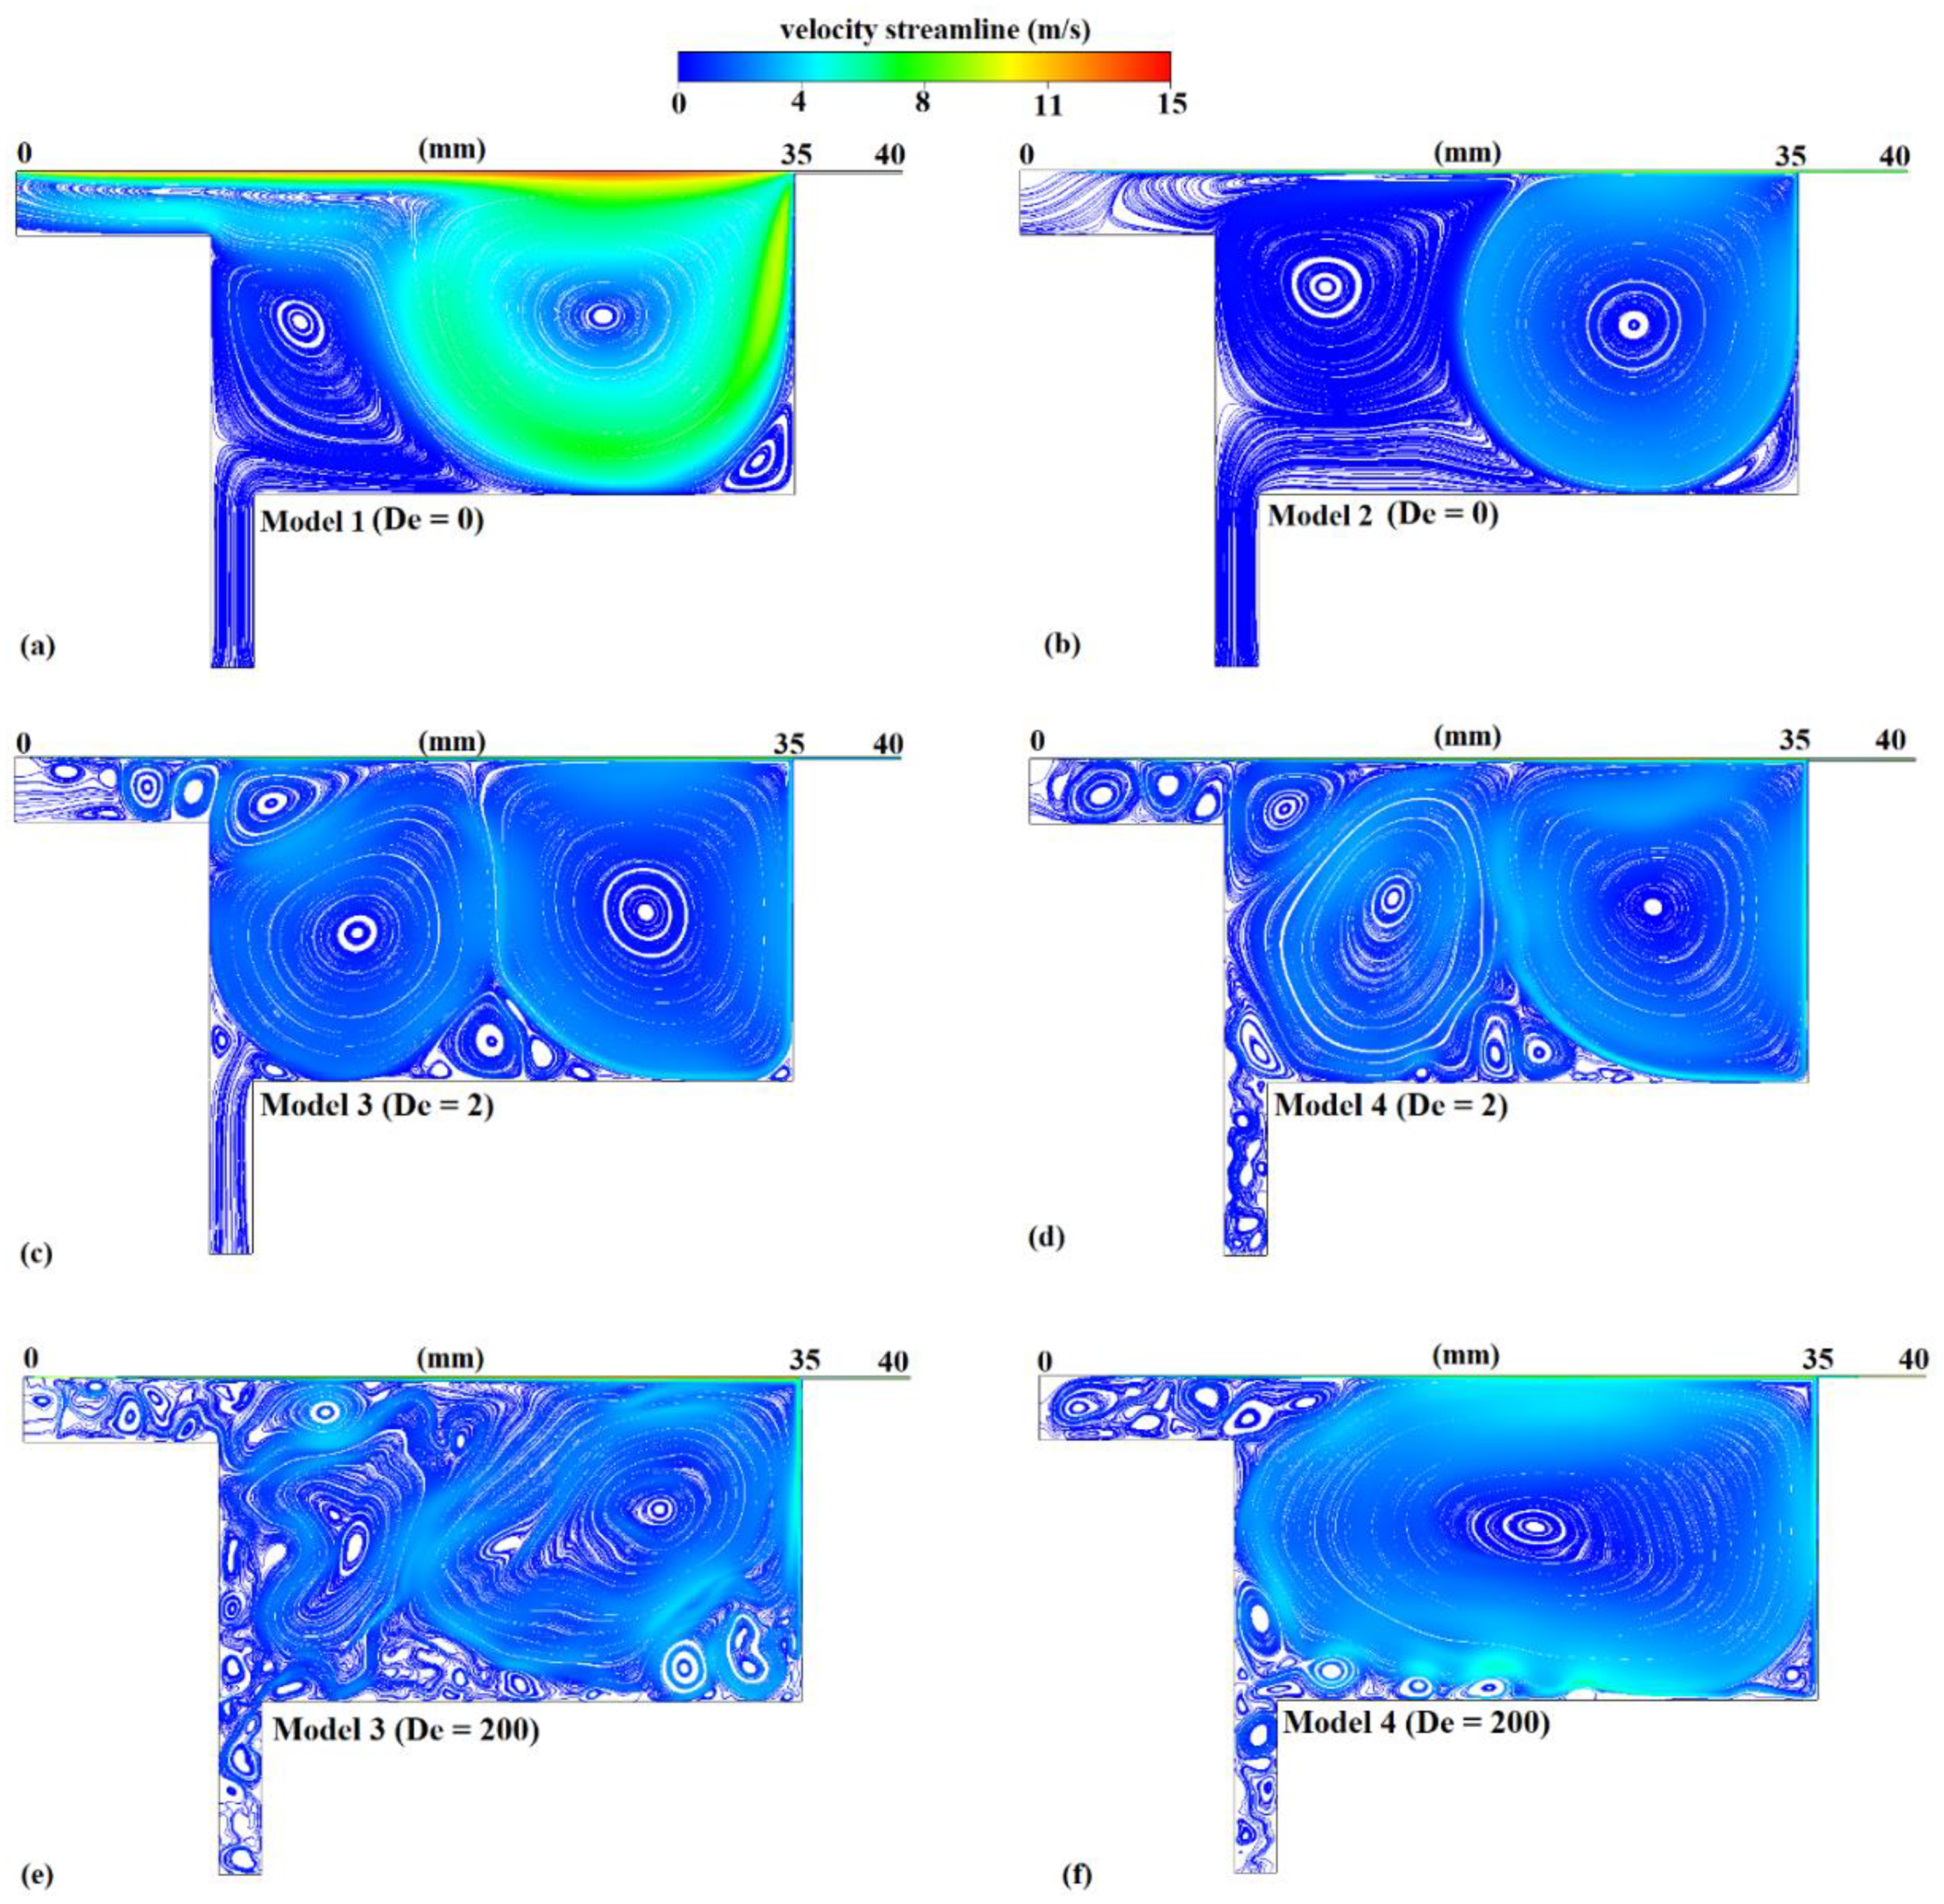
Figure 7 shows a comparison of the velocity streamlines for models 1–4.
Figure 7e,f shows the velocity streamlines for models 3 and 4 at a higher Deborah number (
De = 200), respectively, which was controlled through the material relaxation time. The velocity streamlines of the Newtonian case (model 1,
Figure 7a) revealed the formation of a large primary vortex at the vicinity of the nip, a secondary slow-moving vortex just above the inlet, and a smaller scale vortex in the right corner of the pond. It is worth noting that the velocity distribution in the pond was highly nonuniform in model 1 as the primary vortex presented significantly higher velocity magnitudes than the secondary vortex. Such unevenness in the velocity field can cause significant undesirable pressure fluctuations on the paper surface resulting from the large strain rate, and consequently stress variability, in the flow domain (
Figure 8a). This presents a major drawback for this type of design because it is indicating that even Newtonian coating colors can result in significant hydrodynamic instabilities, which can subsequently affect the force distribution on the coated surface. Somewhat similar behavior was noted in model 2 (
Figure 7b); however, the shear-thinning behavior of the fluid resulted in lifting the secondary vortex toward the moving boundary. Besides, the decrease in the fluid viscosity due to the shear-thinning action significantly relaxed the strain rate in the flow field (
Figure 8b), resulting in lower stress variability in the domain and more even pressure distribution over the coated surface. Moreover, although the primary vortex sizes remained at comparable levels, model 2 presented a more uniform velocity distribution compared to model 1. This would result in a different velocity distribution, and consequently stress and force development, over the coated surface and within the pond. Even though the low flow index
made the coating color more of shear thinning, further vortex development in this model was mainly due to low infinite-shear viscosity
μ∞.
A structured mesh was required to be registered in the complete domain to ensure numerical accuracy and to facilitate the convergence of the solution.
Figure 7c,d shows the velocity streamlines as predicted by the Oldroyd-B (model 3) and Giesekus (model 4) models at Deborah number 2, respectively. The two viscoelastic models presented similar hydrodynamic behavior in terms of vortex formation and size in the main pond; however, the elastic instabilities caused flow destabilization at the overflow region resembling turbulent motion. Model 4 displayed additional flow destabilization at the inlet channel due to the shear-thinning action of the Giesekus model, resulting in a combination of higher effective Re phenomena coupled with induced elastic instabilities. The velocity distribution in the domain was similar for both models; however, the shear-thinning action of model 4 caused noticeable strain rate gradients within the vortex regions that were not present in model 3 (
Figure 8c,d). Although the resulting decrease in the viscosity for model 4 could dampen the shear stress variability in the domain, it could trigger additional secondary vortex formation that would extend toward the domain’s inlet. Models 3 and 4 presented significant differences in the secondary flow development patterns at Deborah number 200, as depicted in
Figure 7e,f. In model 3, the elastic instabilities triggered extreme flow structure destabilization in the main pond due to the high elasticity of the flow. The flow structure became highly asymmetric with intense strain rate gradients (
Figure 8c) within the vortex regions that caused increased secondary vortex formation in the entirety of the pond. The absence of shear-thinning action gave rise to increased stress differences dominated by the high elastic phenomena. At a
De = 200, model 3 also presented flow instabilities at the inlet region. In model 4, significant vortex enhancement was observed at the main pond region with several small vortices propagating from the inlet region due to the combined effects of elasticity, shear thinning, and high Deborah number in this type of cavity-shaped design [
43]. The shear-thinning action presented in model 4 resulted in lower strain rate gradients (
Figure 8f) and consequently stress differences within the main pond area. Secondary small-scale vortex formation was primarily observed in the near-wall region and extended to the flow inlet of the domain.
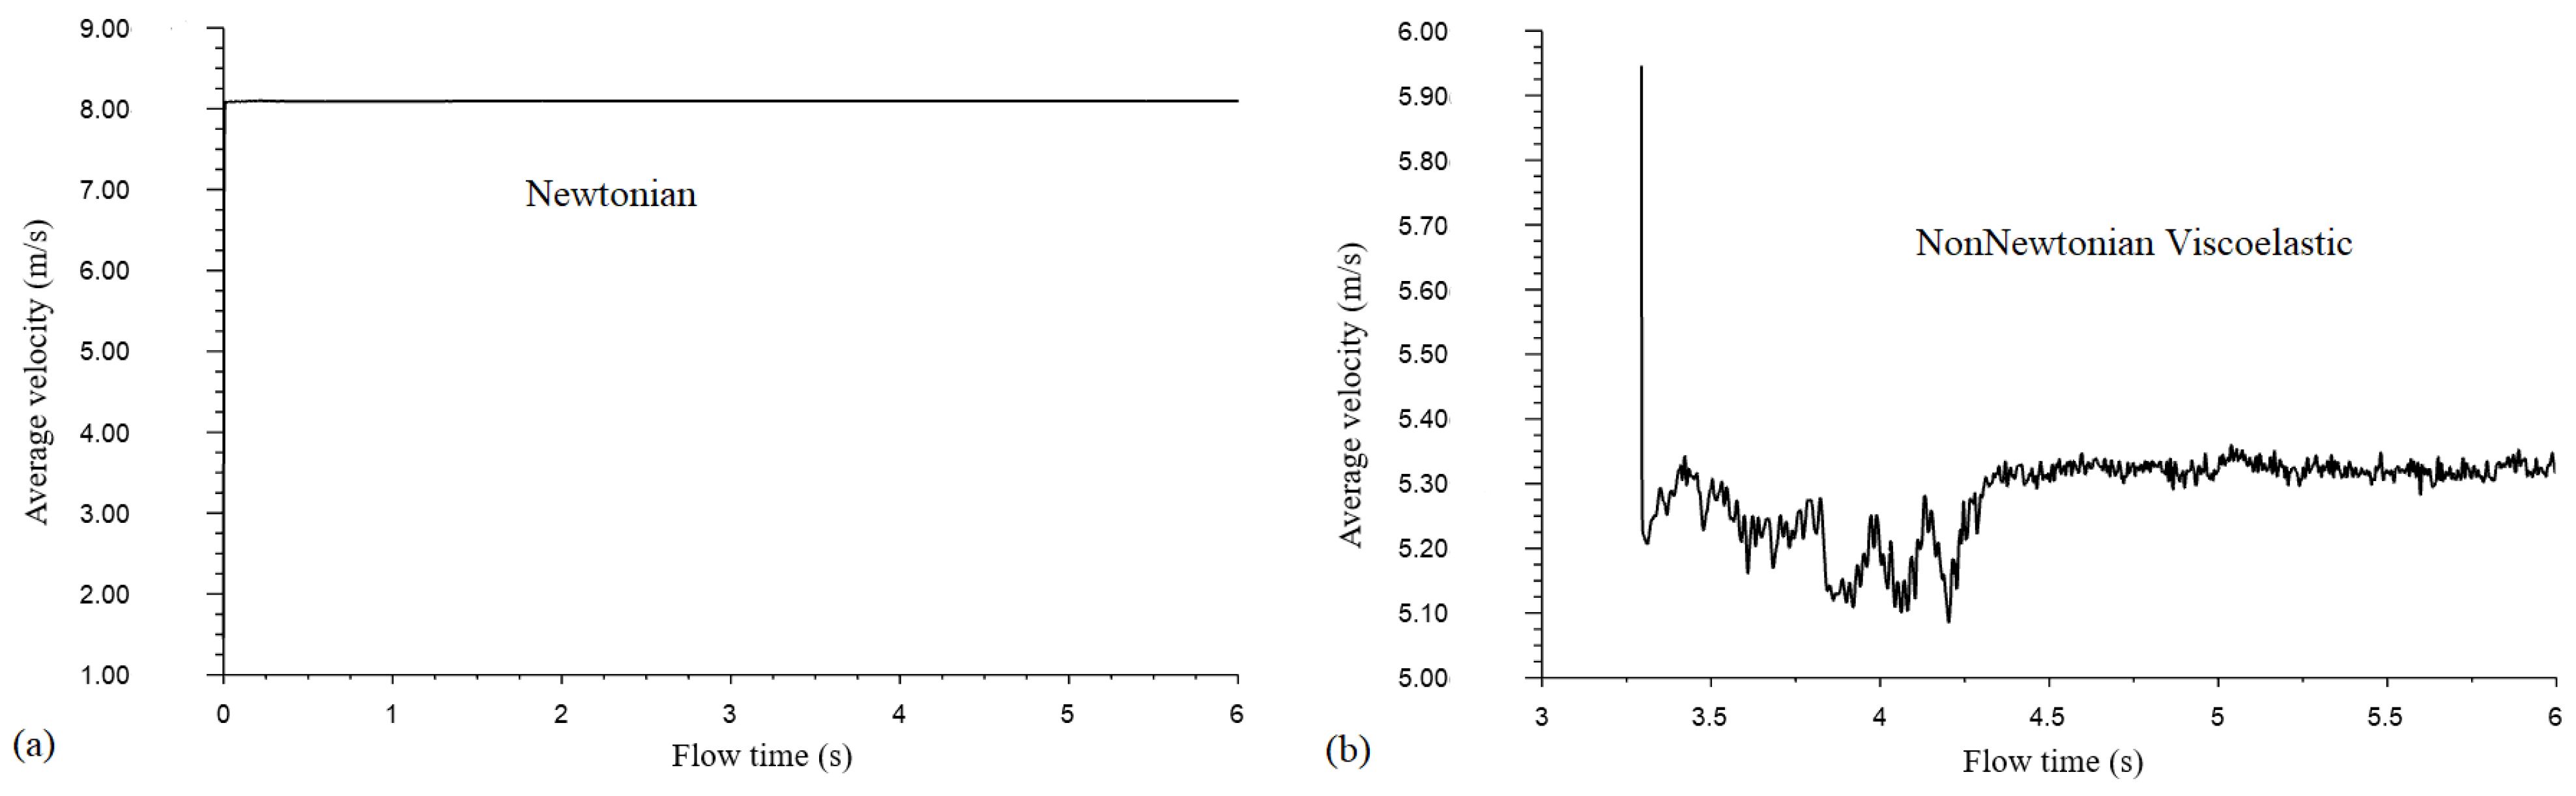
All simulations were conducted for a period of 6 s, which was much longer than the flow relaxation times with time steps of 10
−5 to 10
−7 depending on the Deborah number. Because an implicit formulation was used for the time integration, the values of time steps were varied based on the convergence test, namely, the residual sum and point monitoring. Note that the flow patterns in
Figure 7 correspond to a flow time of 6 s; beyond this time, the flow pattern changed to its early times, revealing a periodic flow.
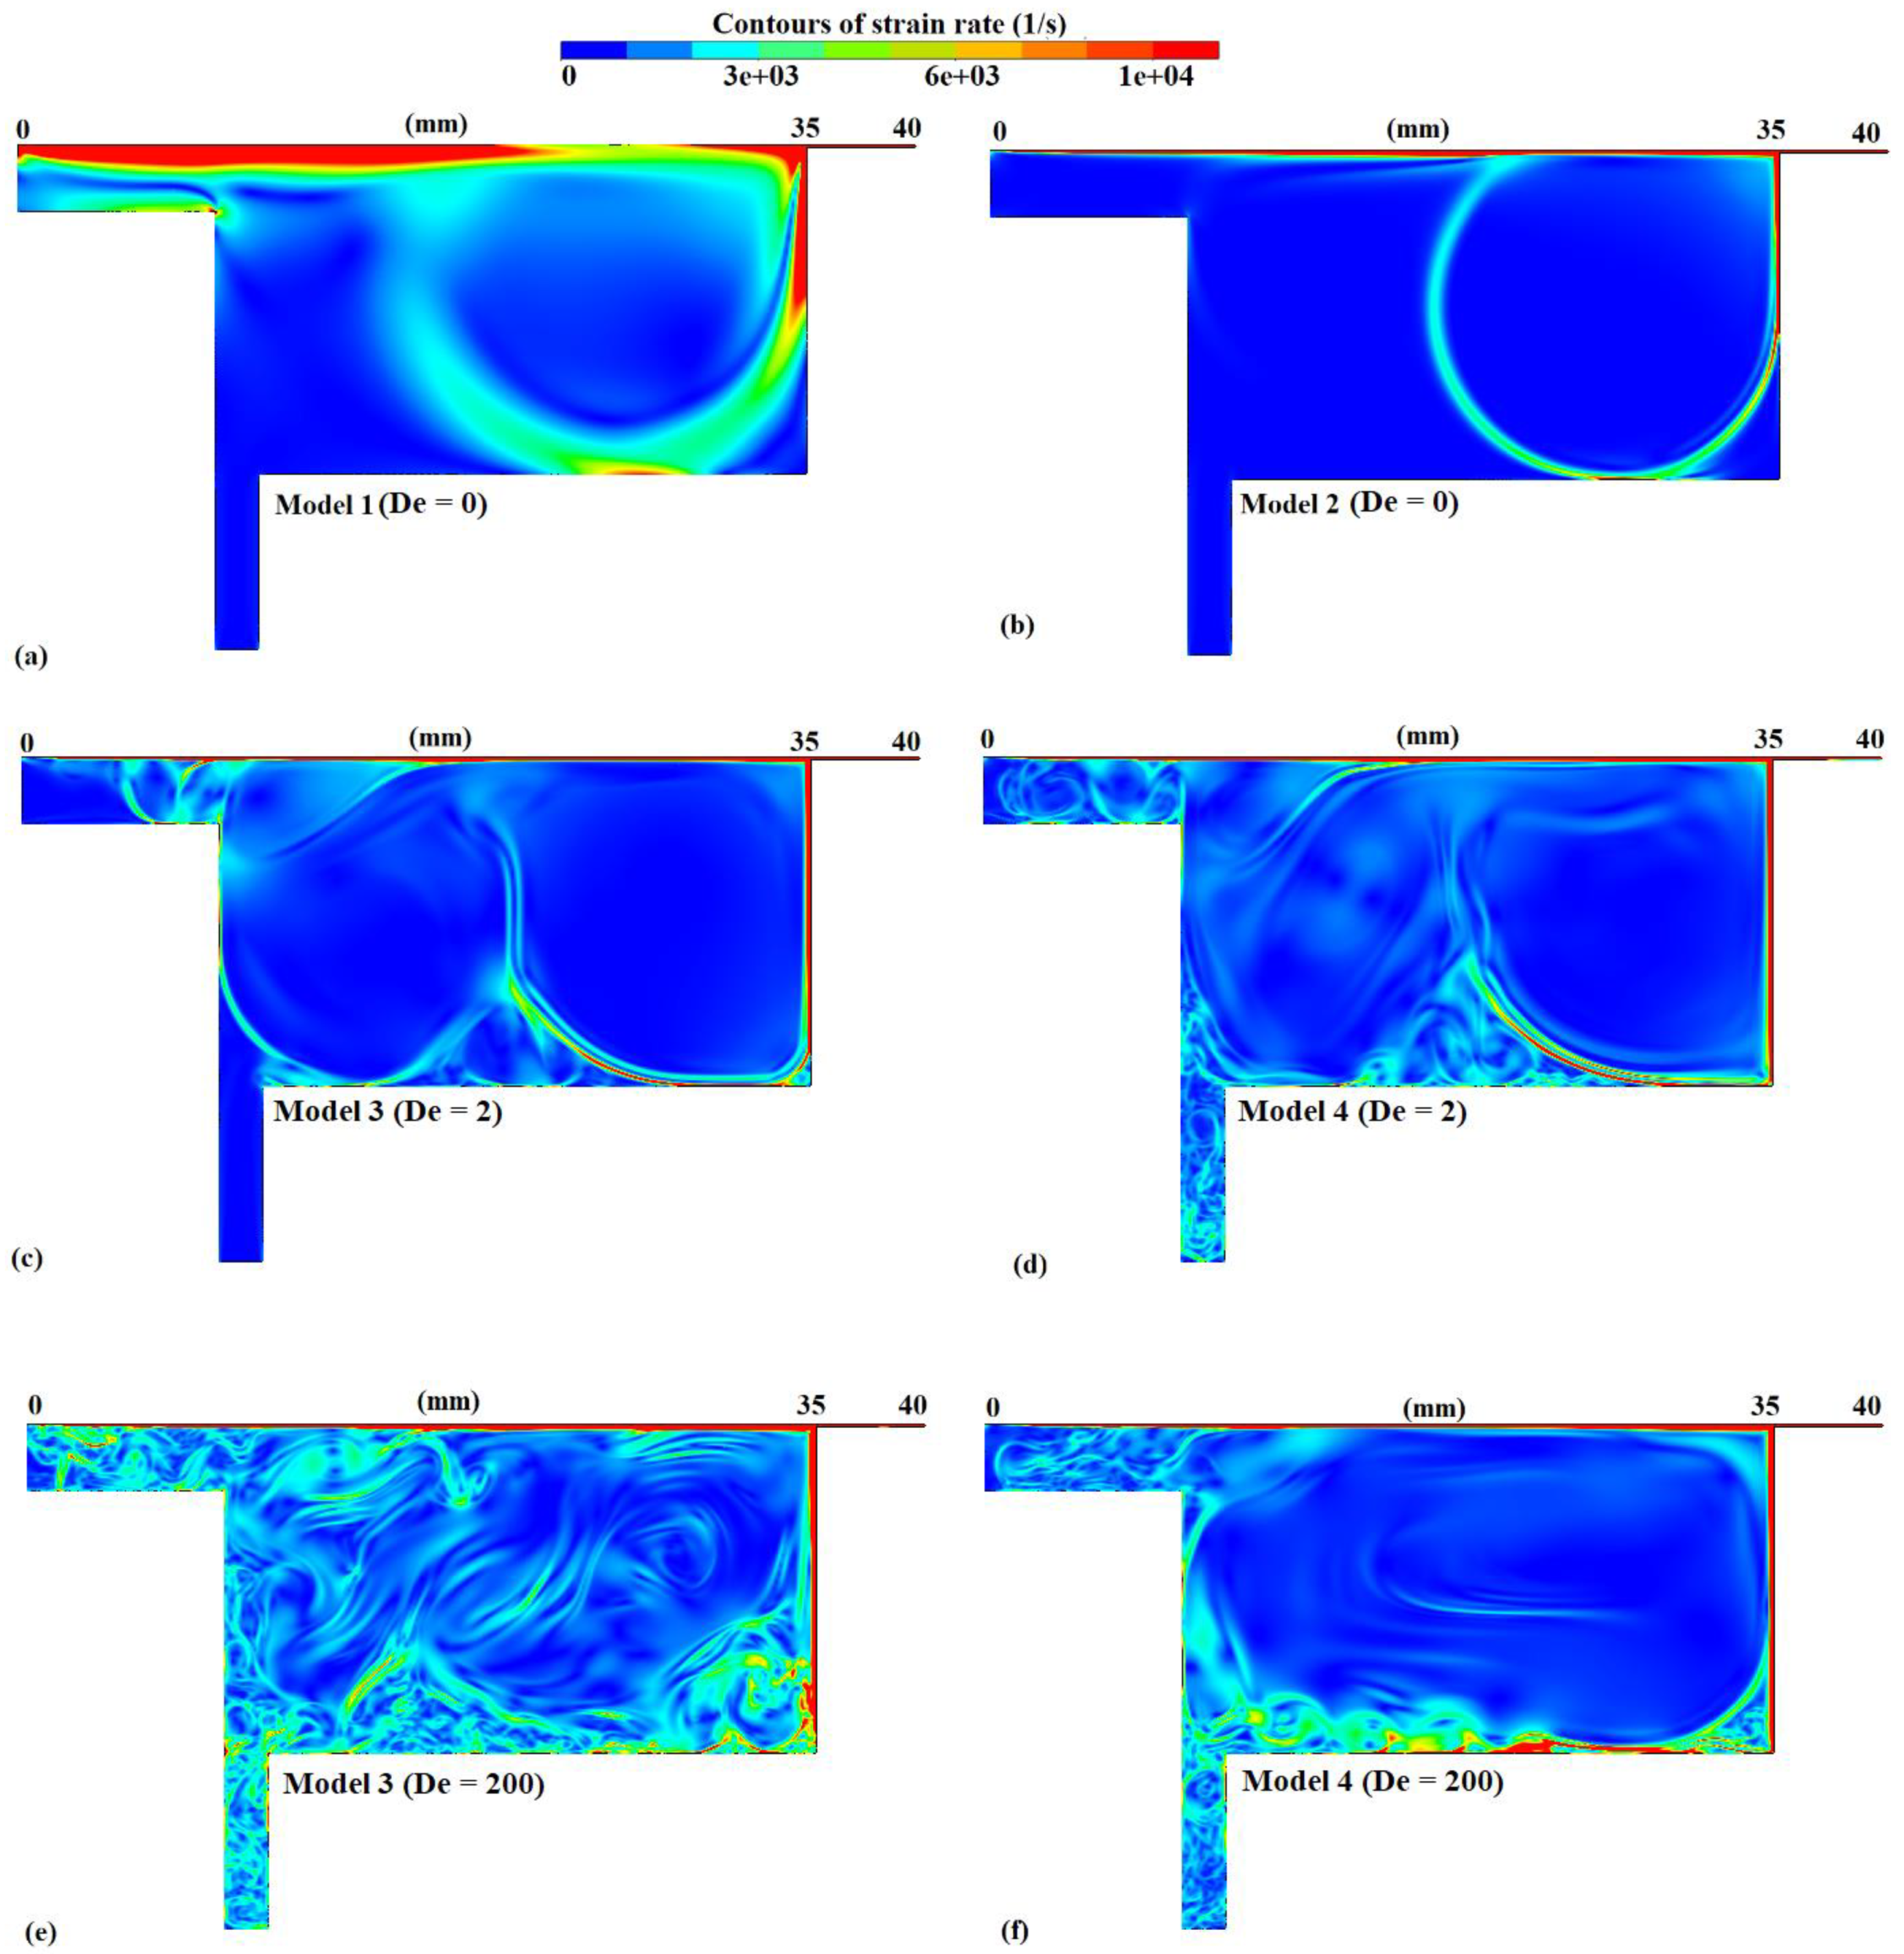
In a similar way to
Figure 7,
Figure 8 shows the strain rate distribution in the pond for the four different models as well as for two different Deborah numbers for models 3 and 4. As a general observation, it can be seen that the strain rates were significantly higher for all models near the wall regions, near the vortex interface regions, and at the moving boundary (i.e., the surface of the paper). This is an anticipated outcome as higher velocity gradients, and subsequently higher shear rates, are usually expected in those regions.
Figure 7c–f and
Figure 8c–f indicate that the viscoelastic flow patterns can be time-dependent and possibly result in significantly variable stress distribution along the moving coated surfaces. The influence of the rheological character of the fluid on pressure and stress distribution along the paper can have a substantial effect on the color coating quality (i.e., uniformity) and thickness as well as the deformation of the paper and the positioning of the blade during the coating process. In general, a nonuniform distribution of forces on the paper causes undesirable impacts on the transport of the coating color onto the paper medium. Moreover, the reduction of the corresponding magnitude of forces will have a major and direct impact on the thickness of the coating layer itself.
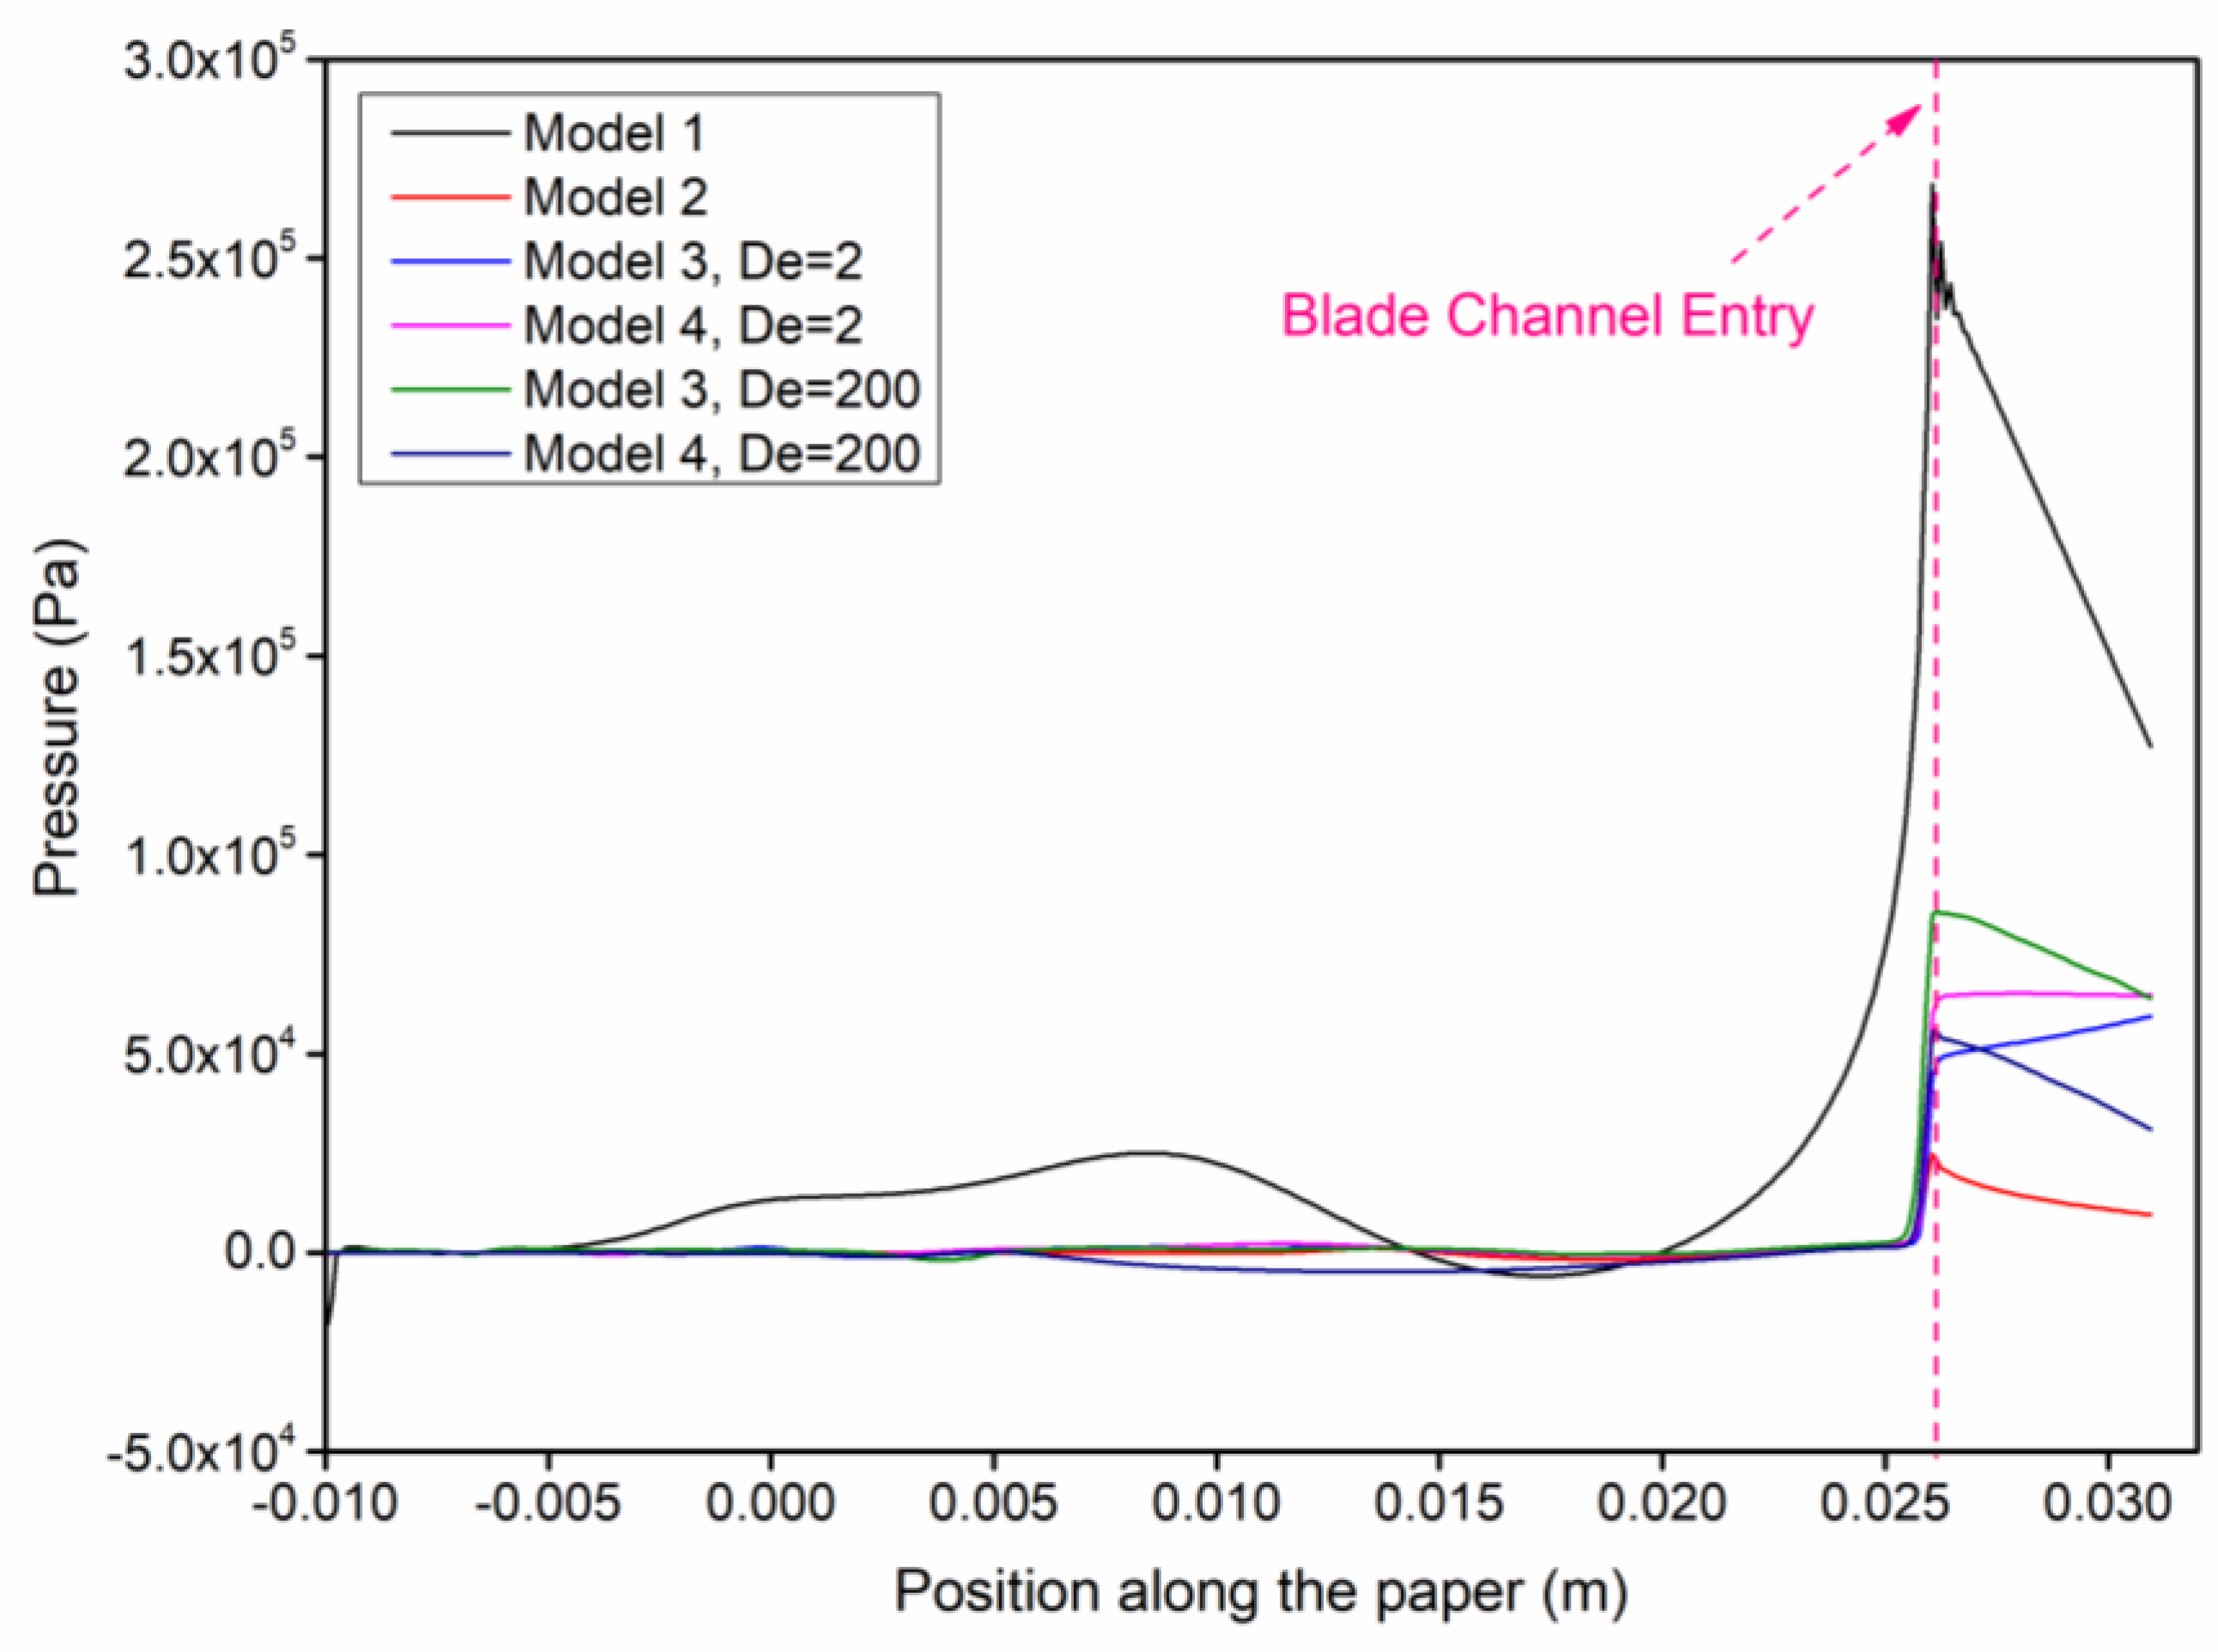
Figure 9 shows the variation of the pressure distribution acting along the surface of the paper. The area indicated as “blade channel entry” corresponds to the portion of the paper over the blade, as shown in
Figure 1.
From
Figure 9, it can be seen that pressure nonuniformity was present in all cases with models 1 and 4 (at
De = 200) defining the range of the highest magnitudes along the total length of the paper. The viscoelastic cases exhibited a high degree of dependency on Deborah number, displaying a significant shift in the corresponding curves for Deborah numbers (
De = 2) and (
De = 200), which was attributed to the increased flow instability present in the bulk of the pond. However, the shifting trends were different between models 3 and 4. For
De = 2, model 3 showed an increasing trend due to the elastic phenomena in the blade channel region, whereas in model 4, the pressure profile was flat, which was associated to the combined effects of elasticity and shear thinning (see model 2 for pure shear-thinning behavior). For
De = 200, both models 3 and 4 followed a similar pattern, although the shear-thinning action in model 4 tended to relax the pressure build-up at the blade channel region.
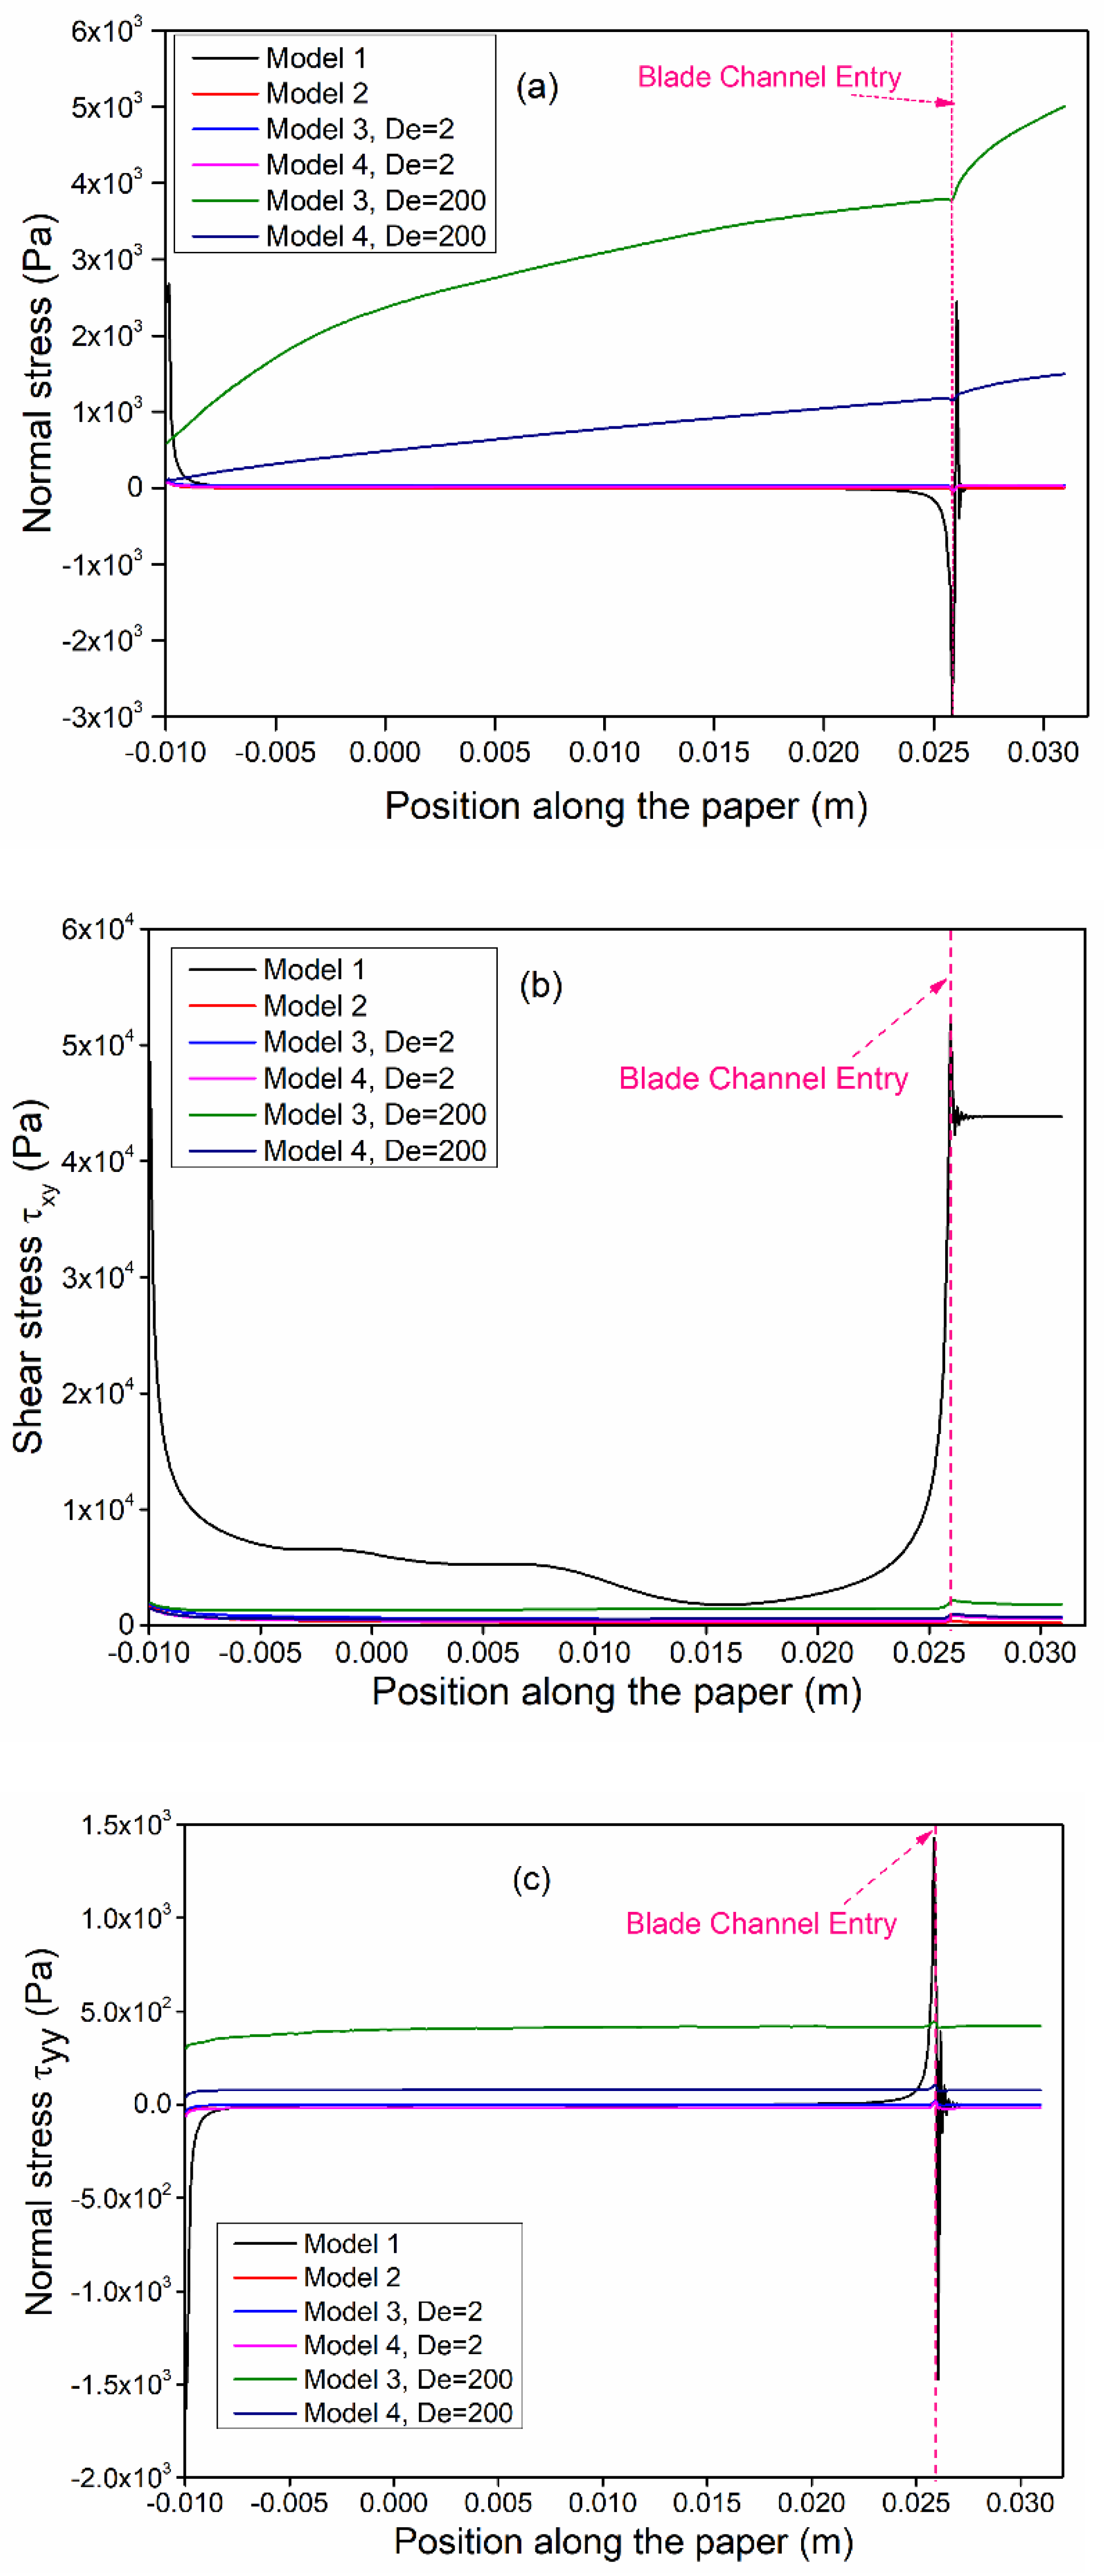
Figure 10 shows the variation of various components of the stress tensor along the surface of the paper. The area indicated as “blade channel entry” corresponds to the portion of the paper over the blade, as shown in
Figure 1.
A holistic view on the stress development along the surface of the paper allows a better understanding of the fluid–paper interaction and gives a better impression of how the coating’s hydrodynamic behavior in the pond can affect the forces and their variability that are acting on the coated surface. Given the high Deborah number of the flow (De = 200), one would expect that the elastic phenomena will also play an important role in the stress distribution in models 3 and 4. Thus, it is vital to understand the stress pattern formation/development along the surface of the paper over the pond area and the blade channel as well.
Figure 10a shows the first normal stress difference distribution along the surface of the paper. It can be observed that both models 1 and 4 (at
De = 2) completely overlapped, with very small fluctuation in the x-normal stress component. Model 3 showed a significant variability at
De = 200, indicative of the highly elastic behavior of the fluid, considering that the shear-thinning phenomena were not predicted by the Oldroyd-B model. Model 4 followed a similar trend as model 3 (at
De = 200) but with a significantly reduced magnitude to shear-thinning effects. The remarkable viscoelastic effects in the polymeric flows are due to the anisotropy in the orientation of the polymers in the flow and are responsible for higher first normal stress differences [
9,
44]. The shear-thinning property of Giesekus fluid is responsible for the strong variations in the location of eddies, which become more pronounced at higher Deborah numbers. The direction-dependent relaxation of stress is due to the quadratic term in the constitutive equation for Giesekus fluid [
43]. The highly curved streamline flow pattern observed at the interface of the two adjacent dominant vortical structures (model 3) gives rise to a significant x-normal stress component, which is also aligned to the direction of motion of the coated surface. However, the nonlinear interaction between shear thinning and elasticity results in a significantly dampened effect on normal stress development in the process.
The first normal stress difference (
Figure 10a) almost purely followed the x-normal stress distribution and was quite significant for models 3 and 4 at high Deborah number (
De = 200). Both models presented a significant first normal stress difference due to the highly elastic type of fluid for the Deborah number of 200; however, the shear-thinning phenomena as predicted by the Giesekus model seemed to have a relaxing effect on this stress difference. Therefore, controlling the stress development over the coated surface is highly significant for industrial blade coating processes as large variations on the stress or force distribution on the paper can affect the color penetration into the porous fiber web and consequently the functionality and performance of the coated paper. For instance, the surface uniformity or fiber coverage can deteriorate when sufficient amount of pressure is not exerted on the paper [
45].
Figure 10b shows the shear stress development along the surface of the paper. It is clear that shear stresses were significantly more dominant in model 1, where no elastic properties of the fluid were considered. However, the magnitude of the shear stresses in model 2 was significantly reduced due to shear thinning. For models 3 and 4 at
De = 2, the observed minor increase in the shear stress significantly damped the shear stress development predicted by model 1 due to elasticity effects. For higher Deborah number (
De = 200), an additional increase in the shear stress profile was observed for model 3 as the flow became highly elastic; however, the shear-thinning action predicted by model 4 displayed an intermediate behavior between models 2 and 3. Hence, the development of shear stresses in the region before the blade channel entry has significantly lower impact for fluids displaying shear thinning and highly elastic behavior, in contrast to purely viscous fluids.
Figure 10c shows the distribution of the y-normal stress component along the length of the paper. It is evident that the polymer chains experienced stronger extension with increasing Deborah number in a longitudinal direction [
46] and the shear thinning acted as a damping factor.
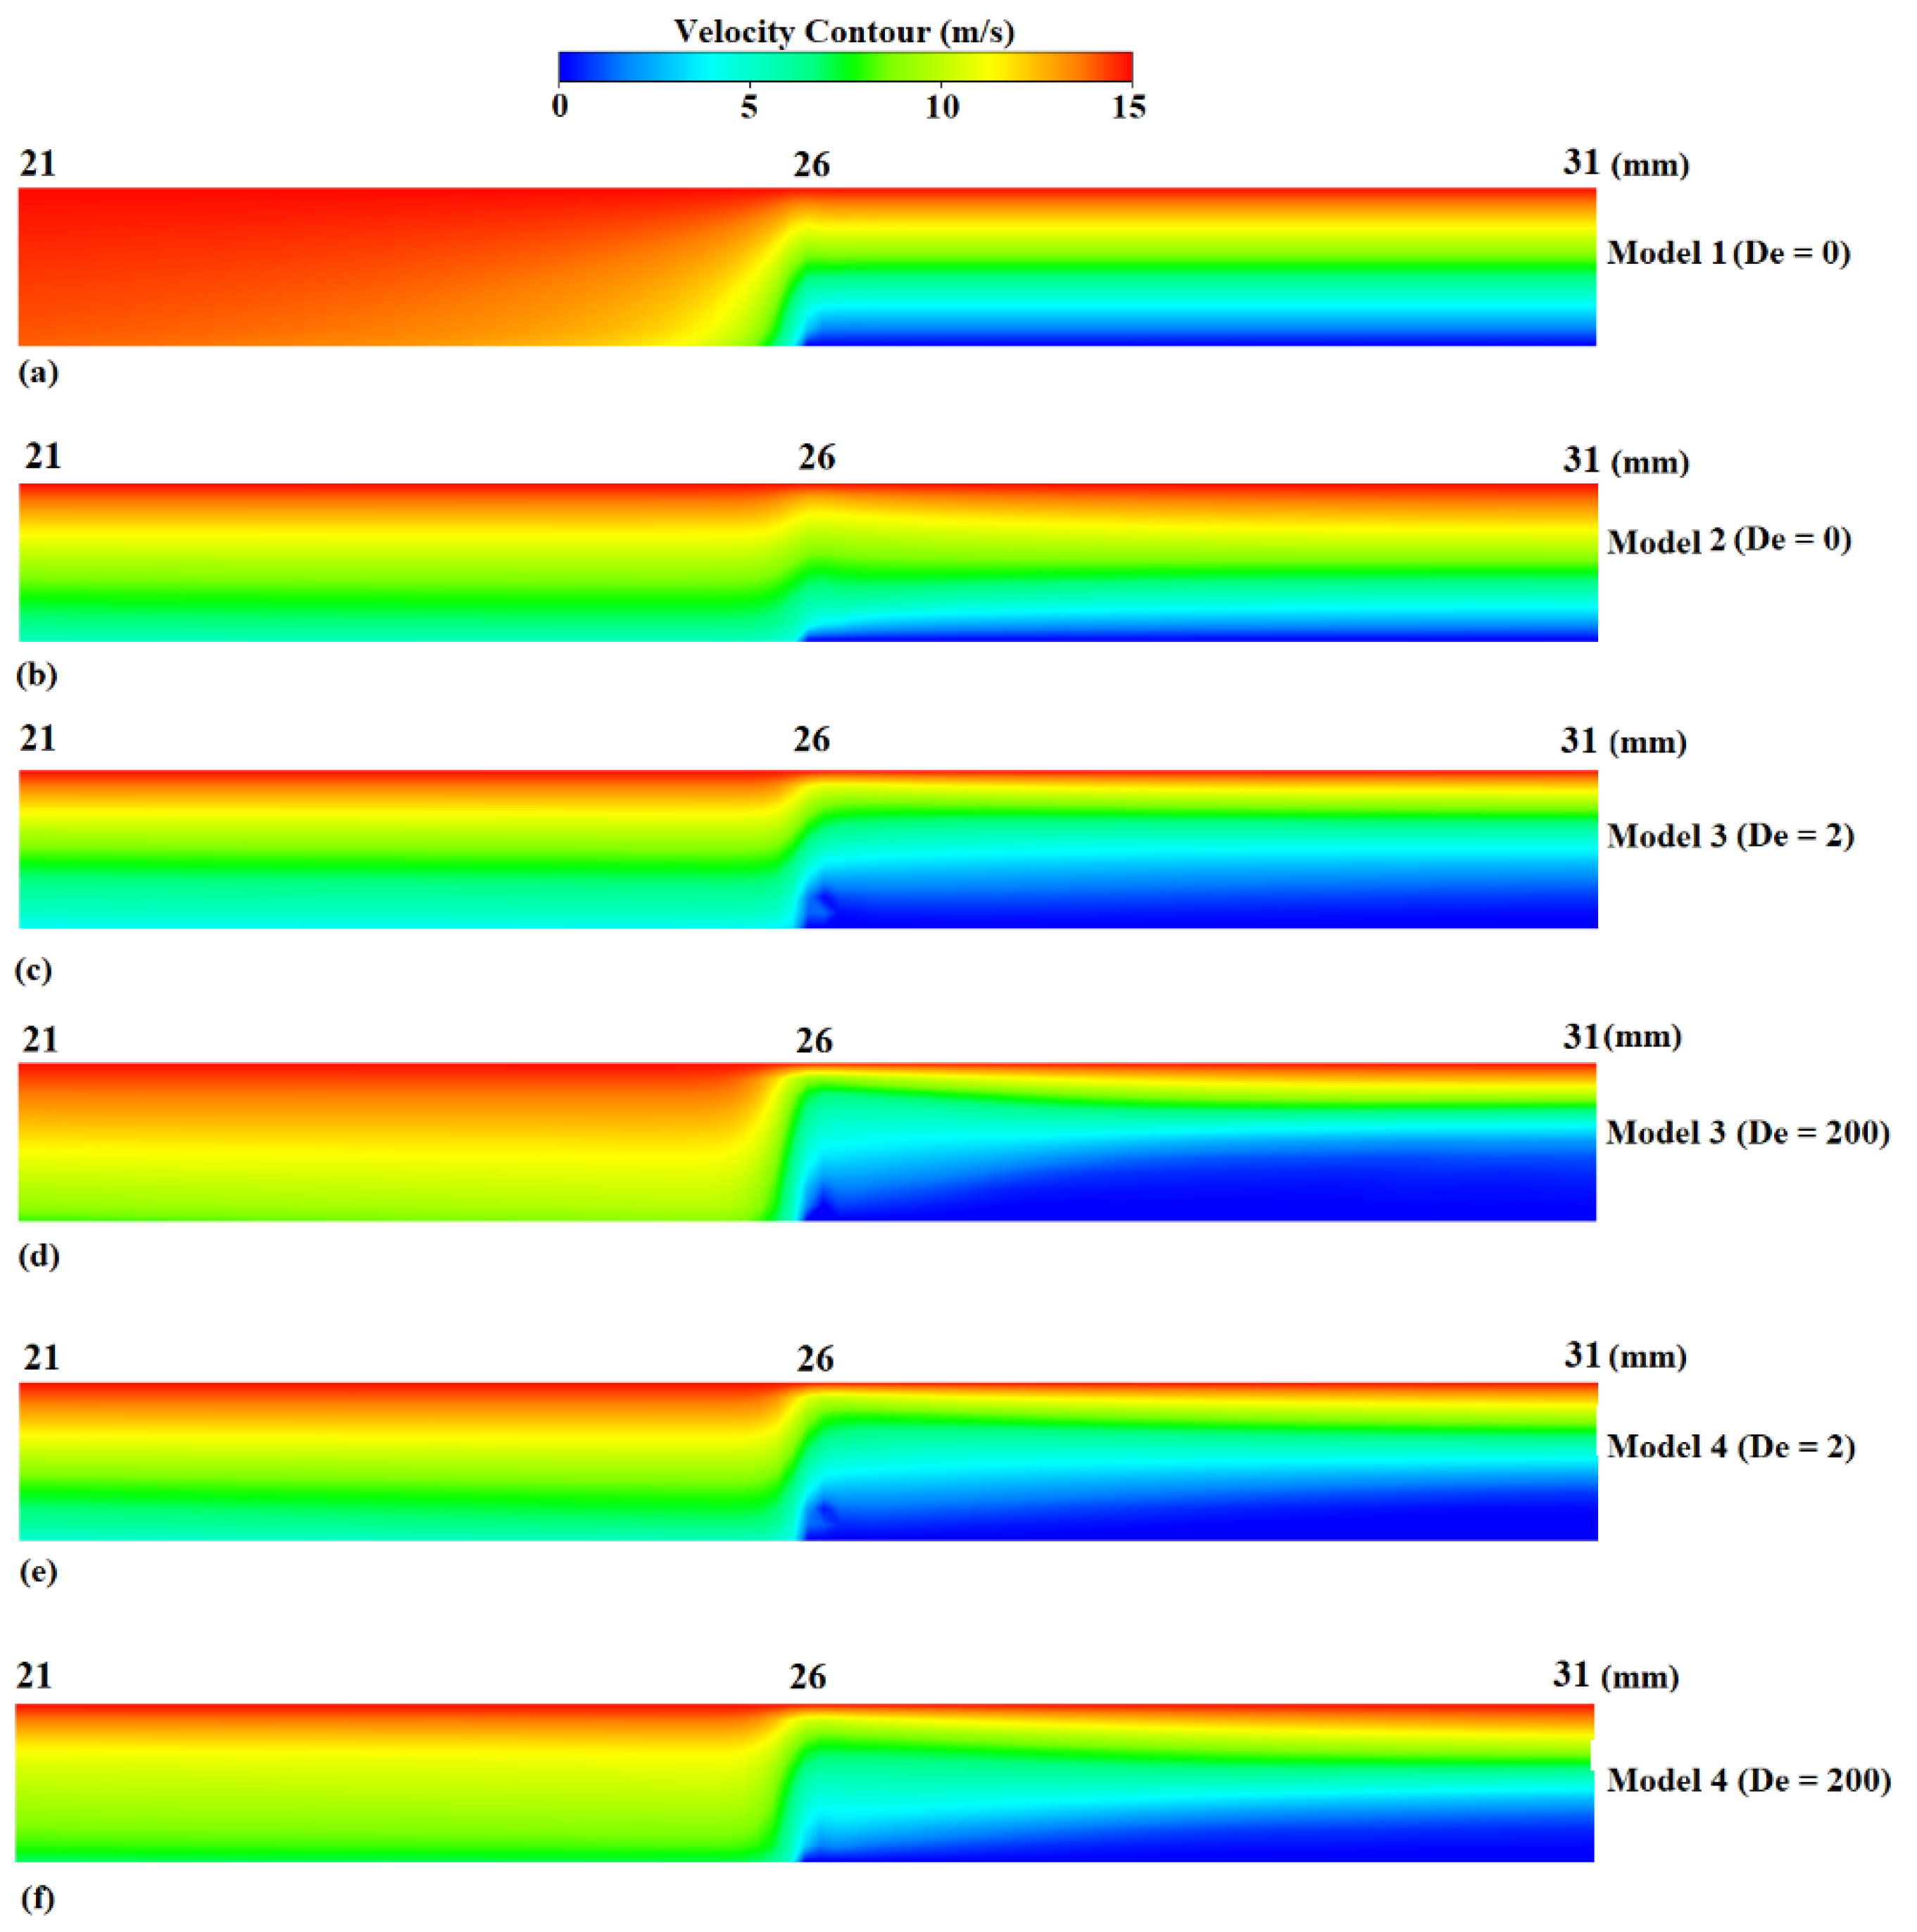
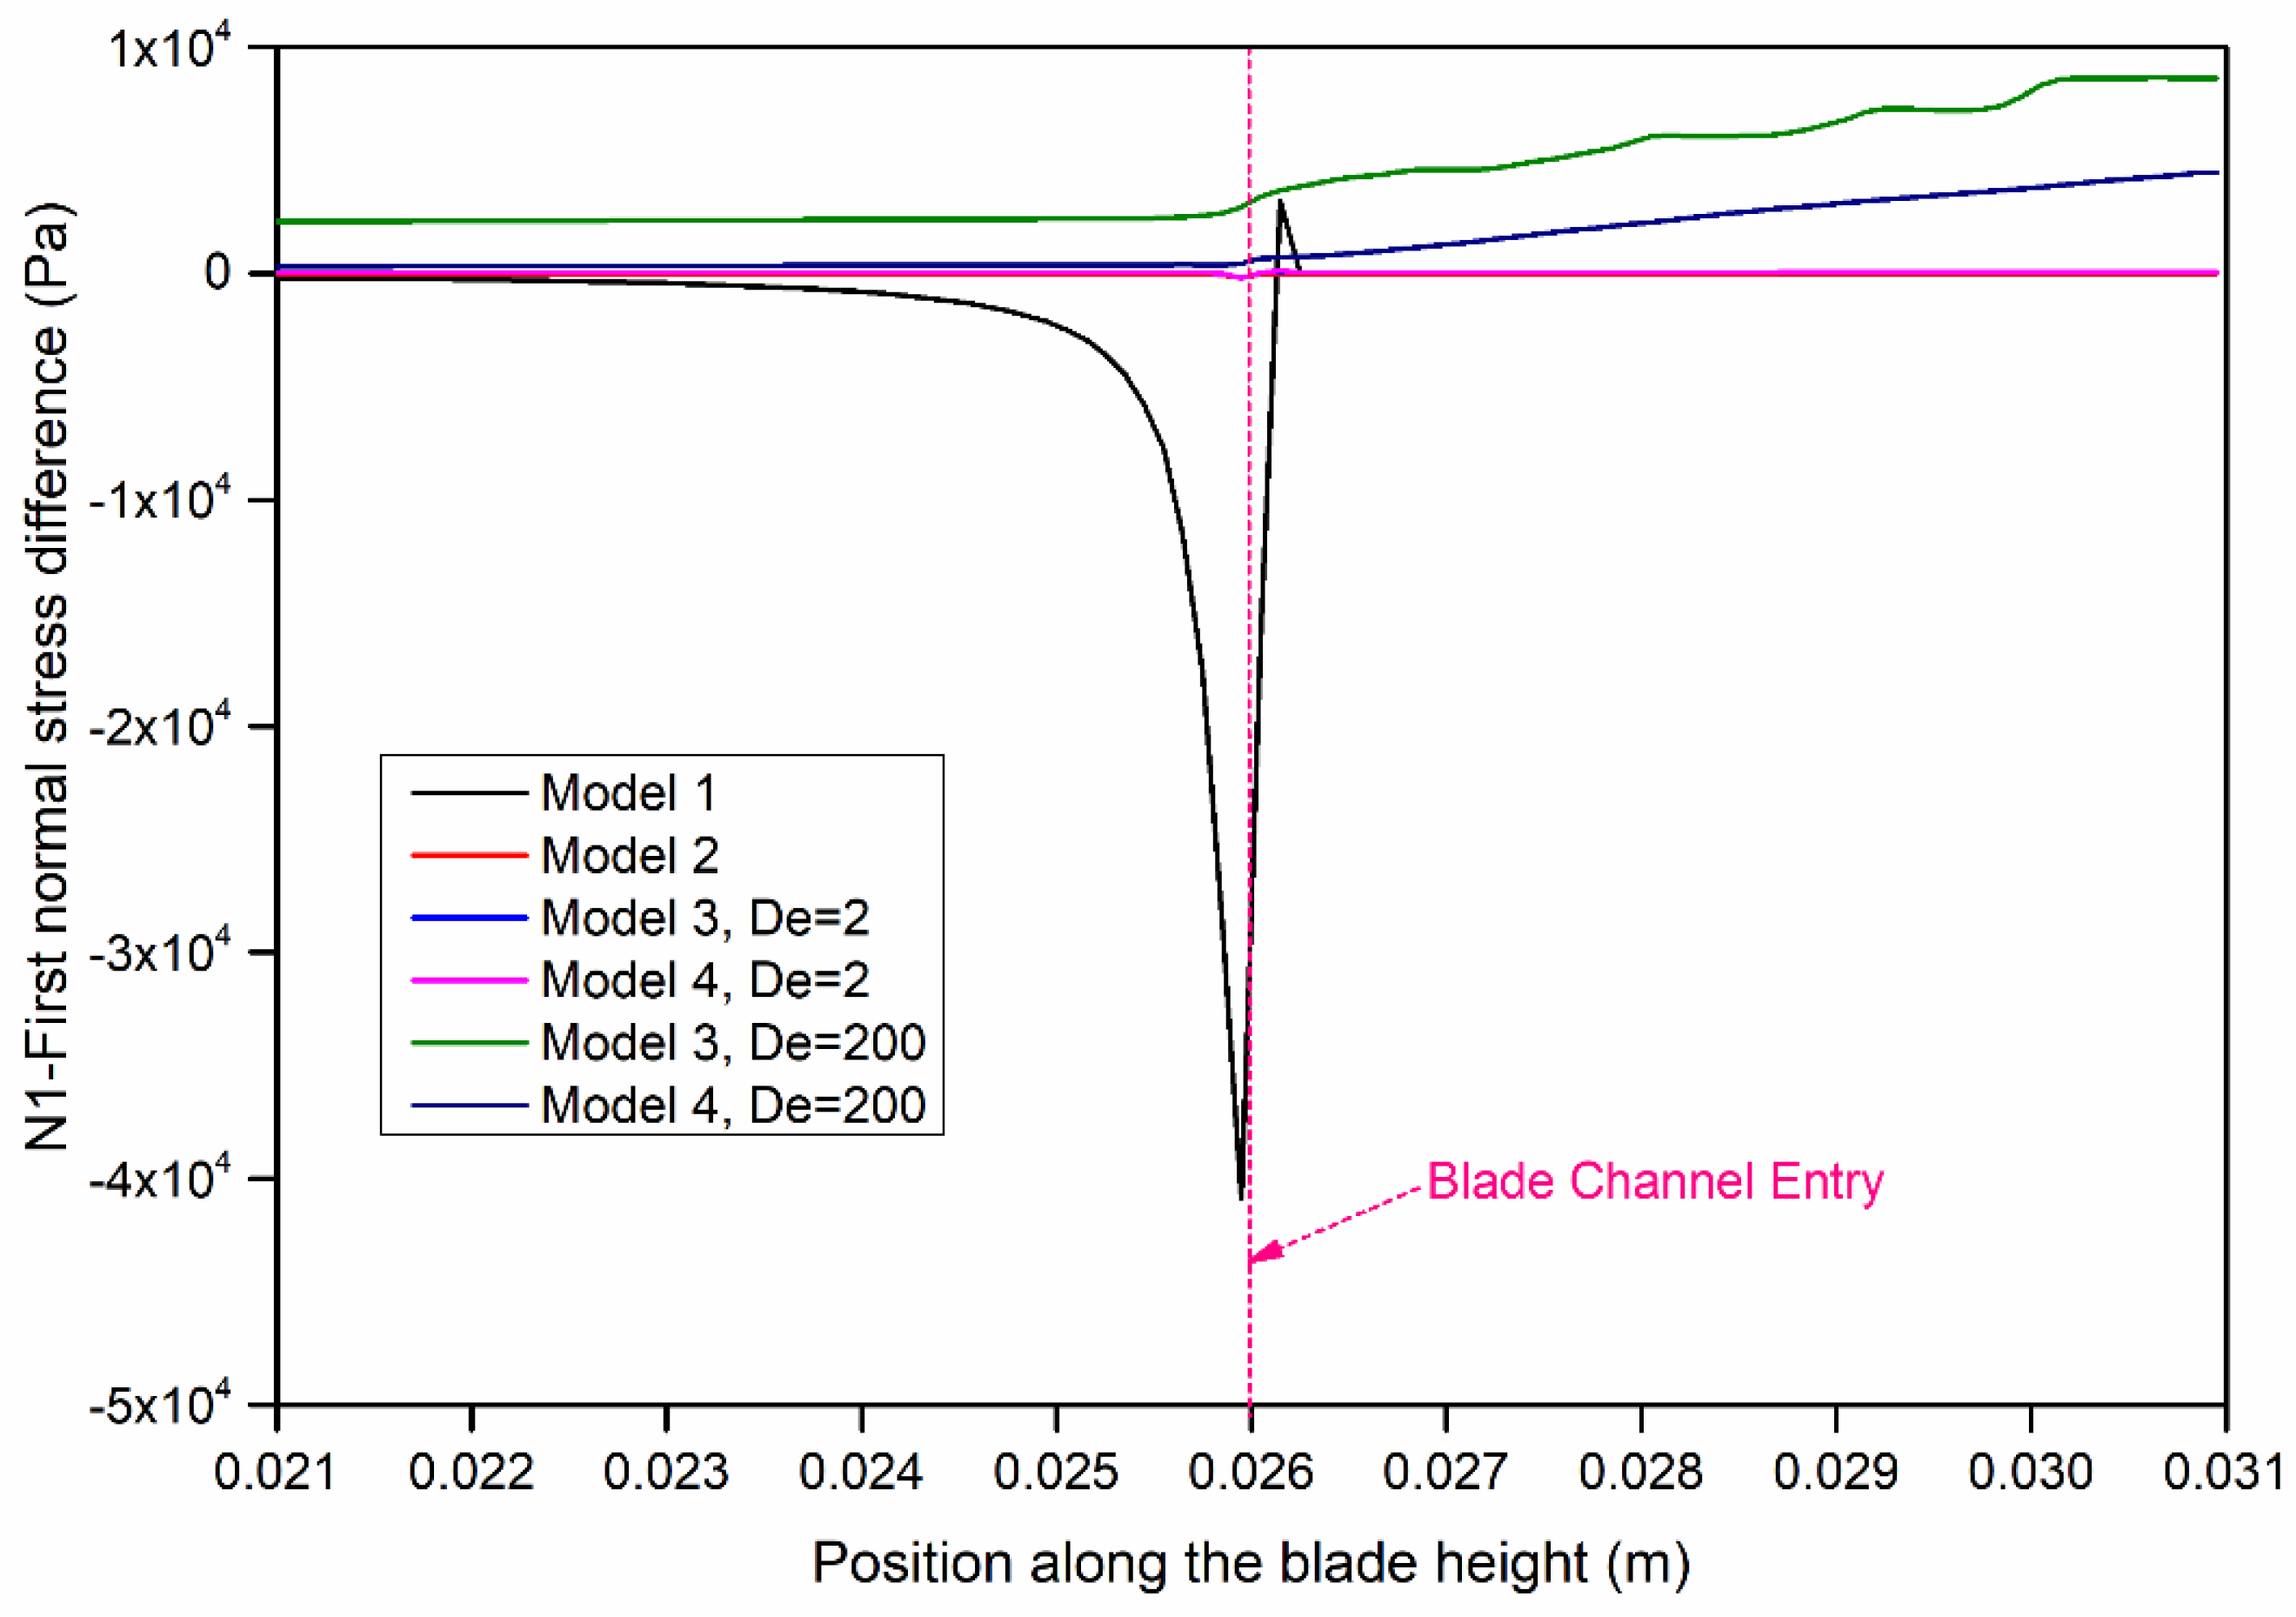
Figure 11 shows the velocity magnitude distribution at the region adjacent to the blade position (i.e., 21–26 mm) and over the coating blade region (i.e., 26–31 mm). It can be observed that the velocity profile within the blade channel was very similar between models 1 and 2, except the flow transition at the inlet of the blade channel was much smoother in the latter one. However, the boundary layer thickness was greater among the viscoelastic cases, making them distinctive.
As anticipated, the normal stress difference for the nonviscoelastic fluids (models 1 and 2) was zero just before and after the blade channel entry as was also the case along the surface of the paper (models 1 and 2,
Figure 12). Examining the results of
Figure 11 in conjunction with the first normal stress difference along the blade shown in
Figure 12, one can observe the dominance of the elastic effects in the case of models 3 and 4 at
De = 200, although in the latter case, the shear-thinning phenomena tended to relax the development of normal stresses.
The size of the gap between the blade and paper, where the coating film was formed, was mainly governed by the amount of the net lifting forces applied simultaneously on the paper surface and blade as well as their respective trend or profile in that region. Because both the paper and the thin blade were elastic materials with Young’s modulus of approximately 50 MPa and 9 GPa, respectively, the variable net force can cause uneven compression and ultimately lead to uneven coat weight. Interaction of hydrodynamic forces on the elastic component of the system is out of the scope of the current study and will be addressed in our future study. Surface roughness, the desired adhesion of the coating on the substrate, fluid penetration, and the interface between coating and substrate will vary as a consequence of nonuniform force or pressure distribution on the paper and blade. This knowledge can be useful in the design of coaters, especially when an elastic blade or rod is used.
It should be highlighted that further experimental investigations are required on the flow of bio-based coating suspensions for further refinement of the numerical calculations. Visualization of the flow under realistic processing conditions using advanced techniques and a better characterization of the rheological properties of the suspension at high deformation rates are demanded. More advanced models can be developed if these demands are fulfilled. Although the models used in these numerical simulations shed a light on the rheological issues appearing in SDCs, any further advances would rely on the available knowledge detailing the rheological behavior of the coating colors. Furthermore, three-dimensional models can be developed for better understanding of the flow dynamic variations in the cross direction as this can highly affect the coating weight or evenness of the coating layer.


