3.1. Microstructure Characterization
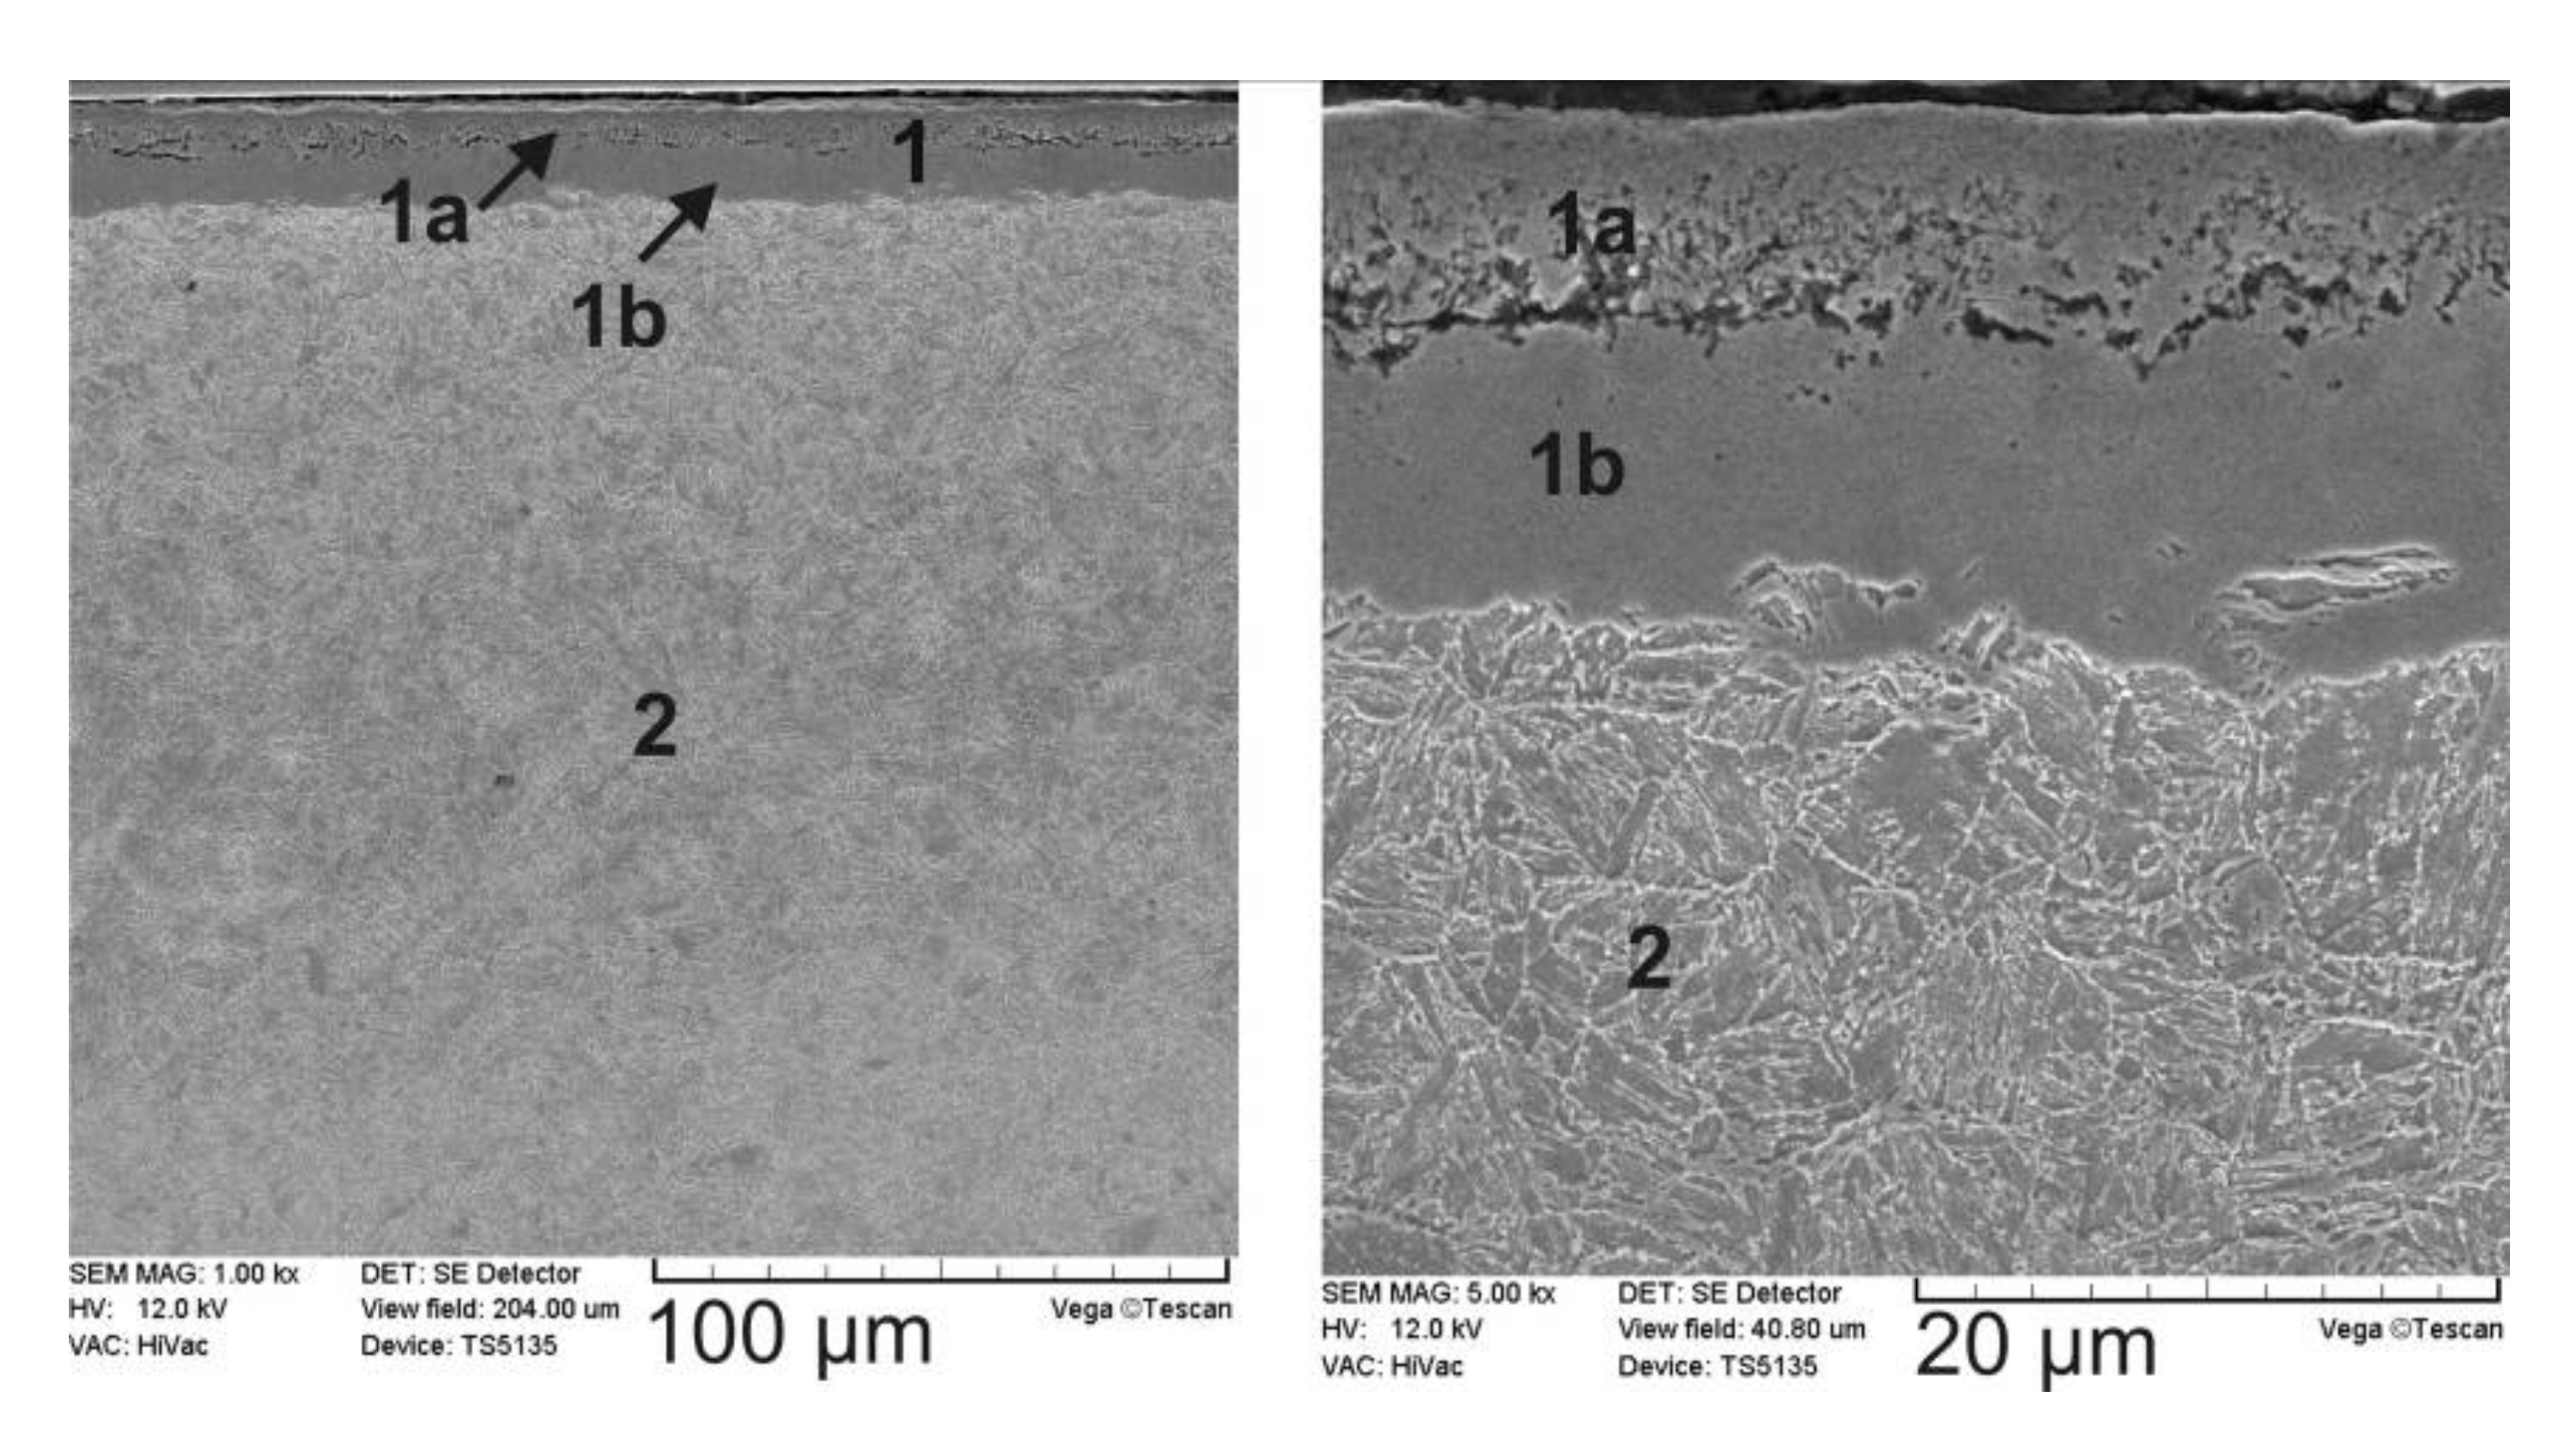
Figure 2 shows the SEM images of microstructure of 42CrMo4 steel after the controlled gas nitriding at 570 °C for 4 h. As usual, before gas nitriding, the substrate material (42CrMo4 steel) was subjected to quenching and high-temperature tempering, i.e., to toughening. After such a heat treatment, the microstructure of base material consisted of the sorbite, i.e., the mixture of ferrite and cementite, produced as a consequence of the diffusion transformation of martensite during tempering. Next, this steel was gas-nitrided. The diffusion process resulted in the saturation of the surface with nitrogen. Nitriding potential was gradually diminished in order to limit the thickness of the porous ε phase. However, the presence of porous ε nitrides close to the surface was advisable in order to check the effect of laser irradiation on the microstructure of this phase. The selected parameters of gas nitriding facilitated the rapid formation of a compound zone with limited thickness close to the surface. Simultaneously, the nitriding potential was higher than the boundary potential between the γ’ and ε phases according to the Lehrer diagram, the value of which slightly exceeded 1 atm
−0.5 at the temperature applied [
3]. After the process, the nitrogen concentration obtained a maximal value close to the surface, diminishing towards the core of steel.
As a consequence of controlled gas nitriding, the nitrided layer consisted of a compound zone (1) and a diffusion zone (2). The two regions were clearly visible in the compound zone (see the right SEM image in
Figure 2). A porous ε nitrides (zone 1a) were observed close to the surface. Below this region, more compact zone 1b with ε + γ’ nitrides was observed. The averaging thickness of the whole compound zone, i.e., ε + (ε + γ’) nitrides, was equal to 19.35 μm. The phase analysis by XRD confirmed the presence of both ε and γ’ phases in a compound zone in the case of the similar nitrided layer [
28,
29]. In the diffusion zone (2), the nitric sorbite with precipitates of γ’ nitrides occurred. The total thickness of the produced nitrided layer was equal to about 450 µm based on the microstructure observation. Below the diffusion zone, the microstructure resulted from the heat treatment, carried out before nitriding. It was typical of a quenched and high-temperature tempered base material, and consisted of sorbite. The microstructure of this zone was invisible in
Figure 2.
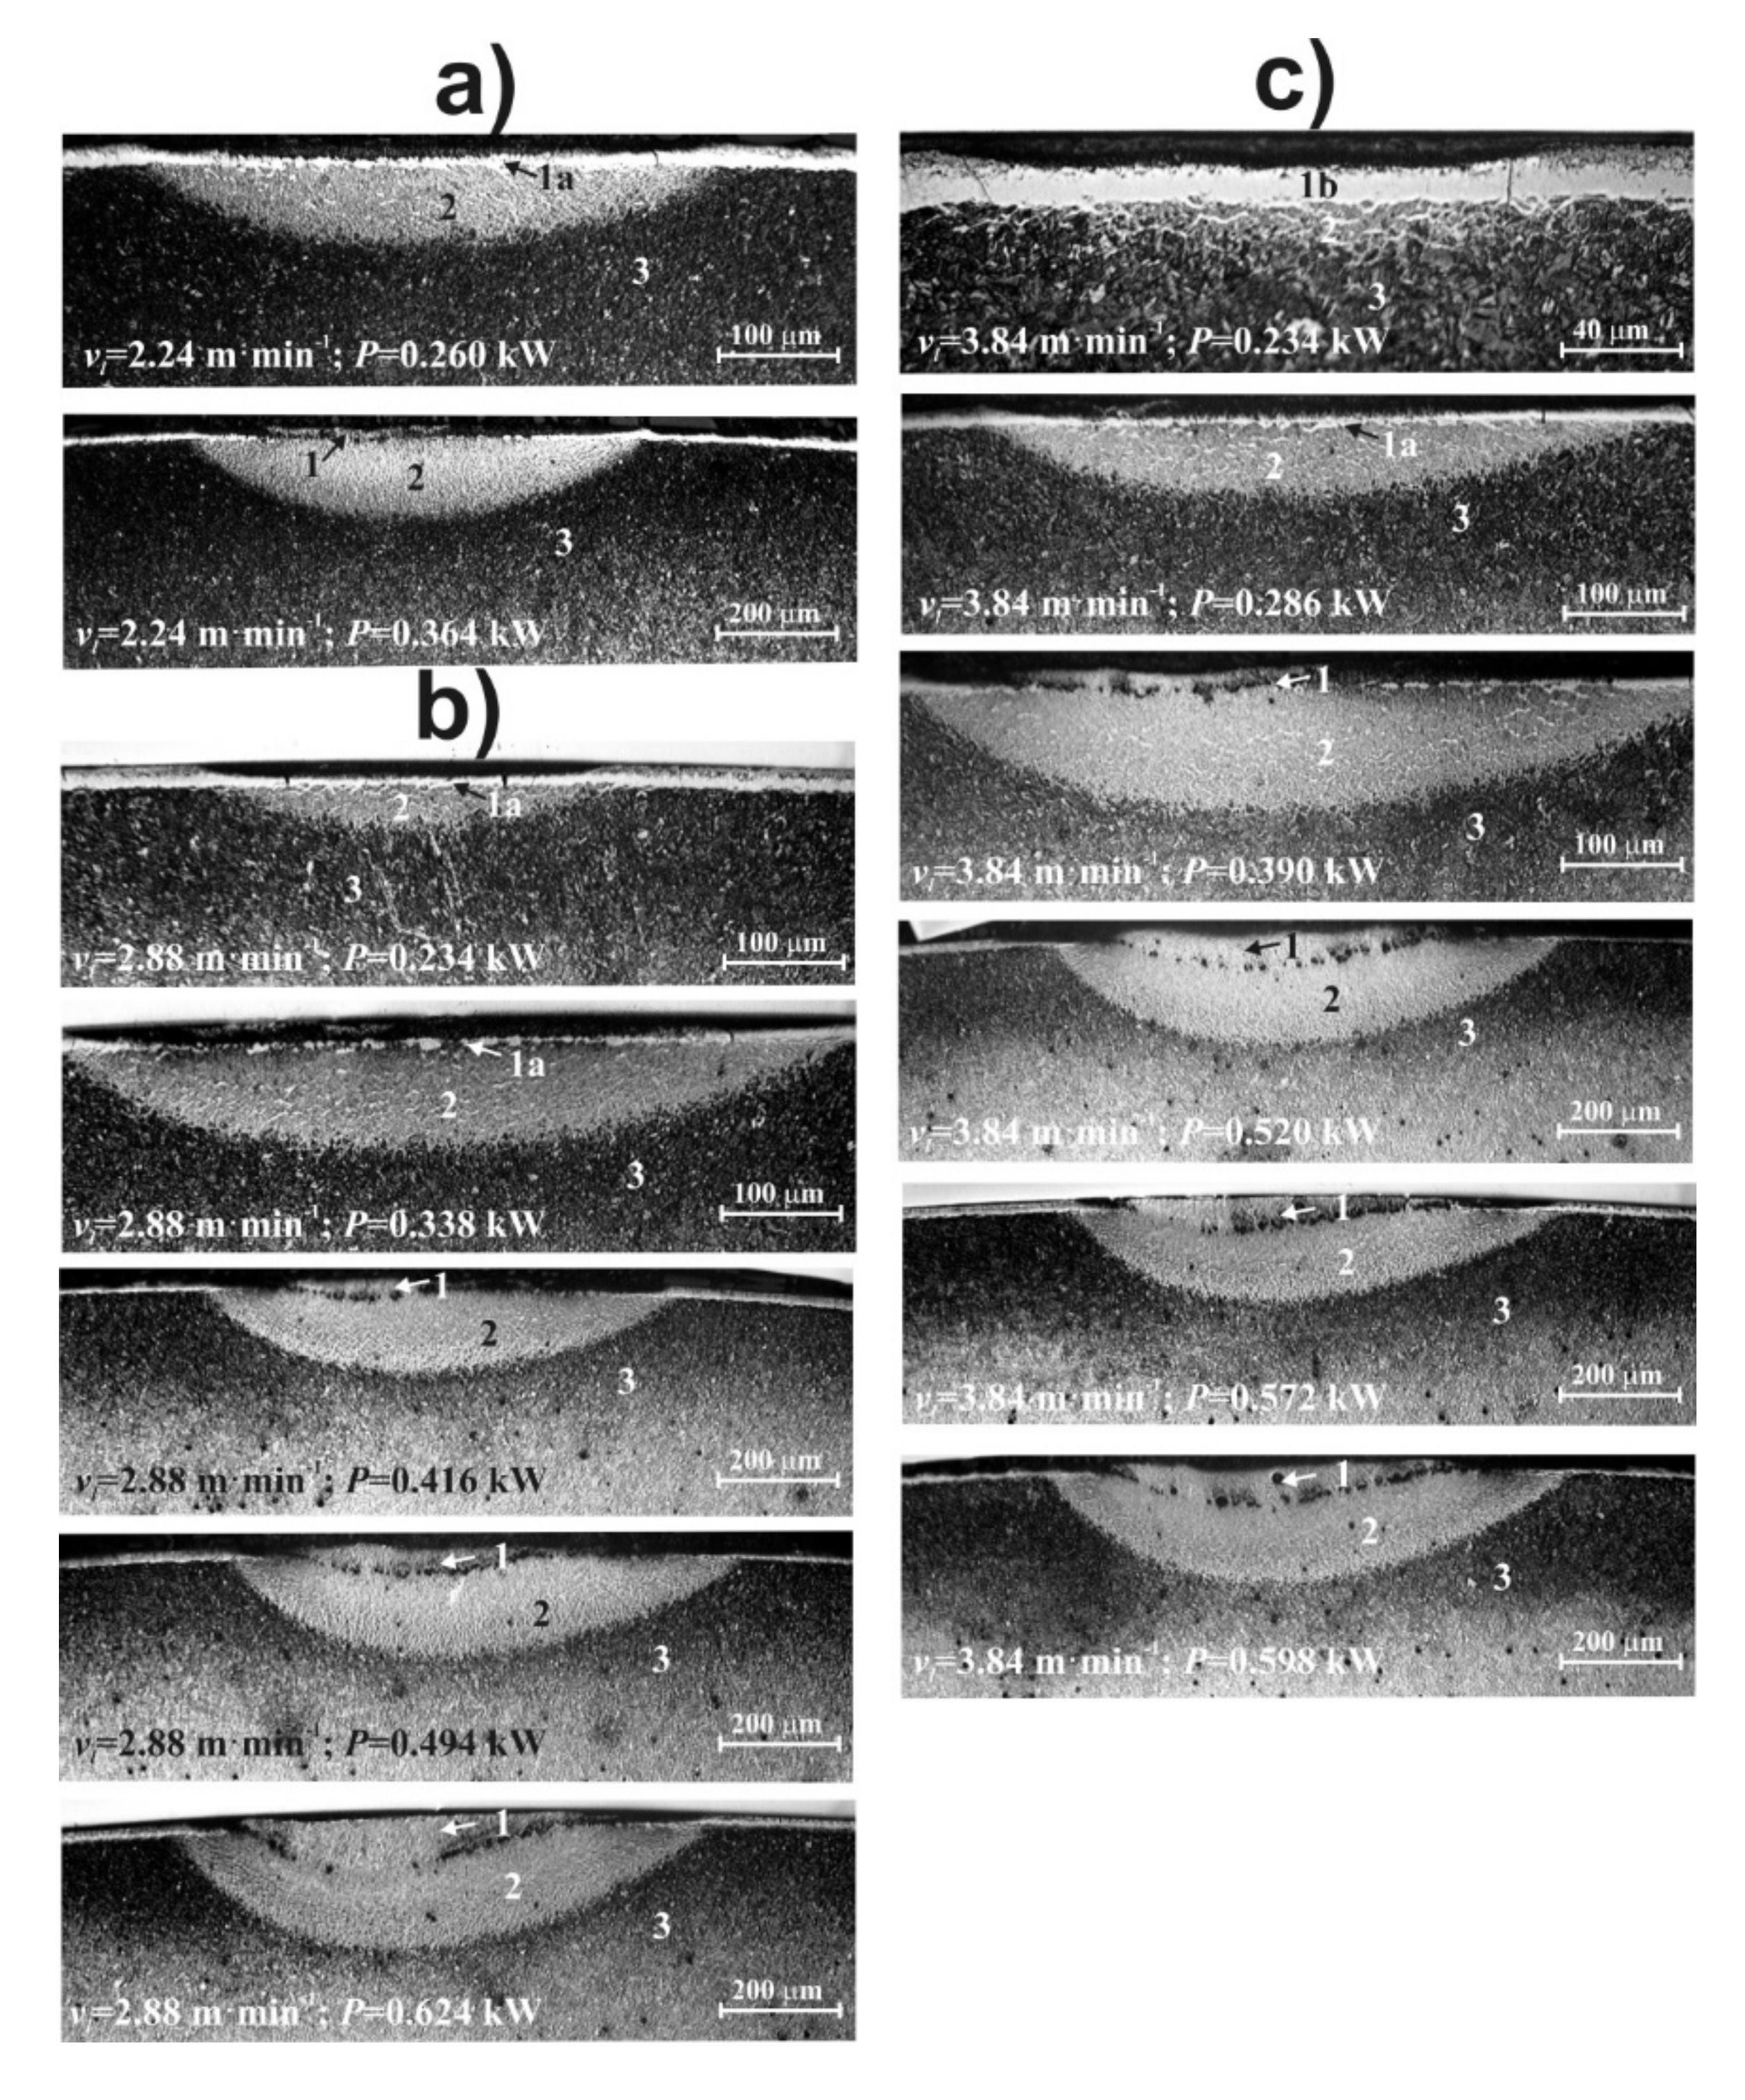
The OM microstructure of the single laser tracks, produced by hybrid surface treatment (gas nitriding + LHT) at various scanning rates 2.24, 2.88, and 3.84 m·min
−1, is shown in
Figure 3. Laser processing was carried out with or without re-melting. It depended on LHT parameters, which modified the microstructure of nitrided layer. If the scanning rate was equal to 2.24 m·min
−1 (see
Figure 3a), only the two laser beam powers were used (0.260 and 0.364 kW). The laser beam power of 0.260 kW resulted in the presence of the partially re-melted compound zone (1a) and heat-affected zone (2). An amount of iron nitrides was still visible in the compound zone after LHT. Only the porous ε nitrides, occurring close to the surface, were partially re-melted (zone 1a). Due to the relatively high cooling rate, exceeding the critical cooling rate, the martensite transformation proceeded in the HAZ. Hence, the fine-grained nitric martensite was formed in this zone. During the heating, nitrogen partially dissolved in the austenite and remained in the produced martensite. However, an amount of γ’ precipitates could remain in HAZ. Below the HAZ, the diffusion zone without visible effects of laser modification (3) occurred. Its microstructure consisted of nitric sorbite with precipitates of γ’ phase. After laser modification with the use of the higher laser beam power (0.364 kW), the microstructure was typical of the laser remelting. The three zones were observed in the microstructure of hybrid surface layer: re-melted zone (1), heat-affected zone (2), and nitrided layer (precisely its diffusion zone) without visible effects of LHT (3). The microstructure of MZ, HAZ, and the diffusion zone without visible effects of LHT consisted of coarse-grained nitric martensite with possible ε precipitates [
27], fine-grained nitric martensite with γ’ precipitates, and nitric sorbite with γ’ precipitates, respectively. The increase in the laser beam power caused the increased dimensions of laser track, i.e., increased depths and widths of MZ and HAZ.
Figure 3b shows the OM microstructure of the single laser tracks, produced using the scanning rate
vl = 2.88 m·min
−1. The laser beam power (
P) ranged from 0.234 to 0.624 kW. The use of a relatively low laser beam power (0.234 and 0.338 kW) resulted in the formation of the partially re-melted compound zone (1a) and heat-affected zone (2). Whereas the laser beam power in the range of 0.416 to 0.624 kW caused the microstructure of the laser tracks to consist of re-melted zone (1) and heat-affected zone (2). An amount of iron nitrides remained in the compound zone after LHT and was still visible in the partially re-melted compound zone (1a). However, if the laser beam power was equal to 0.234 kW, the continuous ε + γ’ zone remained after LHT. The use of the laser beam power of 0.338 kW resulted in the formation of the discontinuous iron nitrides in partially re-melted zone (1a). In the microstructure of MZ (1), the coarse-grained nitric martensite with possible ε precipitates [
27] appeared, whereas the fine-grained nitric martensite with γ’ precipitates always occurred in the HAZ (2). Below the heat-affected zone (2), the diffusion zone without visible effects of LHT (3) was visible. Its microstructure, like previously, consisted of nitric sorbite with γ’ precipitates. The dimensions of laser tracks (i.e., the depths and widths of MZ and HAZ) were greater if the laser beam power increased.
The OM microstructure of laser tracks, formed at a scanning rate of 3.84 m·min
−1, is presented in
Figure 3c. The laser beam power (
P) was used in the range of 0.234–0.598 kW. In this case, the more variants of microstructure were observed. The use of the lowest laser beam power
P = 0.234 kW resulted in the presence of the compound zone without visible effects of remelting (1b) and heat-affected zone (2). It seemed that the ε + (ε + γ’) compound zone remained in the microstructure and the laser irradiation caused only the formation of the HAZ, i.e., the partial hardening of the diffusion zone due to the presence of a fine-grained nitric martensite with γ’ precipitates. The second laser beam power (
P = 0.286 kW) caused the formation of the zones as follows: the partially re-melted compound zone (1a) and heat-affected zone (2). An amount of iron nitrides, especially the continuous ε + γ’ zone, remained in the compound zone after LHT and was still visible close to the surface. Finally, the laser beam power in the range of 0.390–0.598 kW caused the formation of the microstructure consisting of re-melted zone (1) and heat-affected zone (2). The diffusion zone without visible effects of LHT (3) was visible below the heat-affected zone in all the cases. This zone consisted of nitric sorbite with γ’ precipitates. Like previously, the dimensions of laser tracks (i.e., the depths and widths of MZ and HAZ) increased if the laser beam power was higher. The typical sorbite was characteristic of the microstructure of the base material (quenched and high-temperature tempered 42CrMo4 steel). In all the produced laser tracks, it was easy to identify and measure the depths of partially re-melted compound zones (1a), compound zones without visible effects of remelting (1b), re-melted zones (1), and heat-affected zones (2). In general, the higher scanning rate, the smaller size of laser tracks at the same laser beam power.
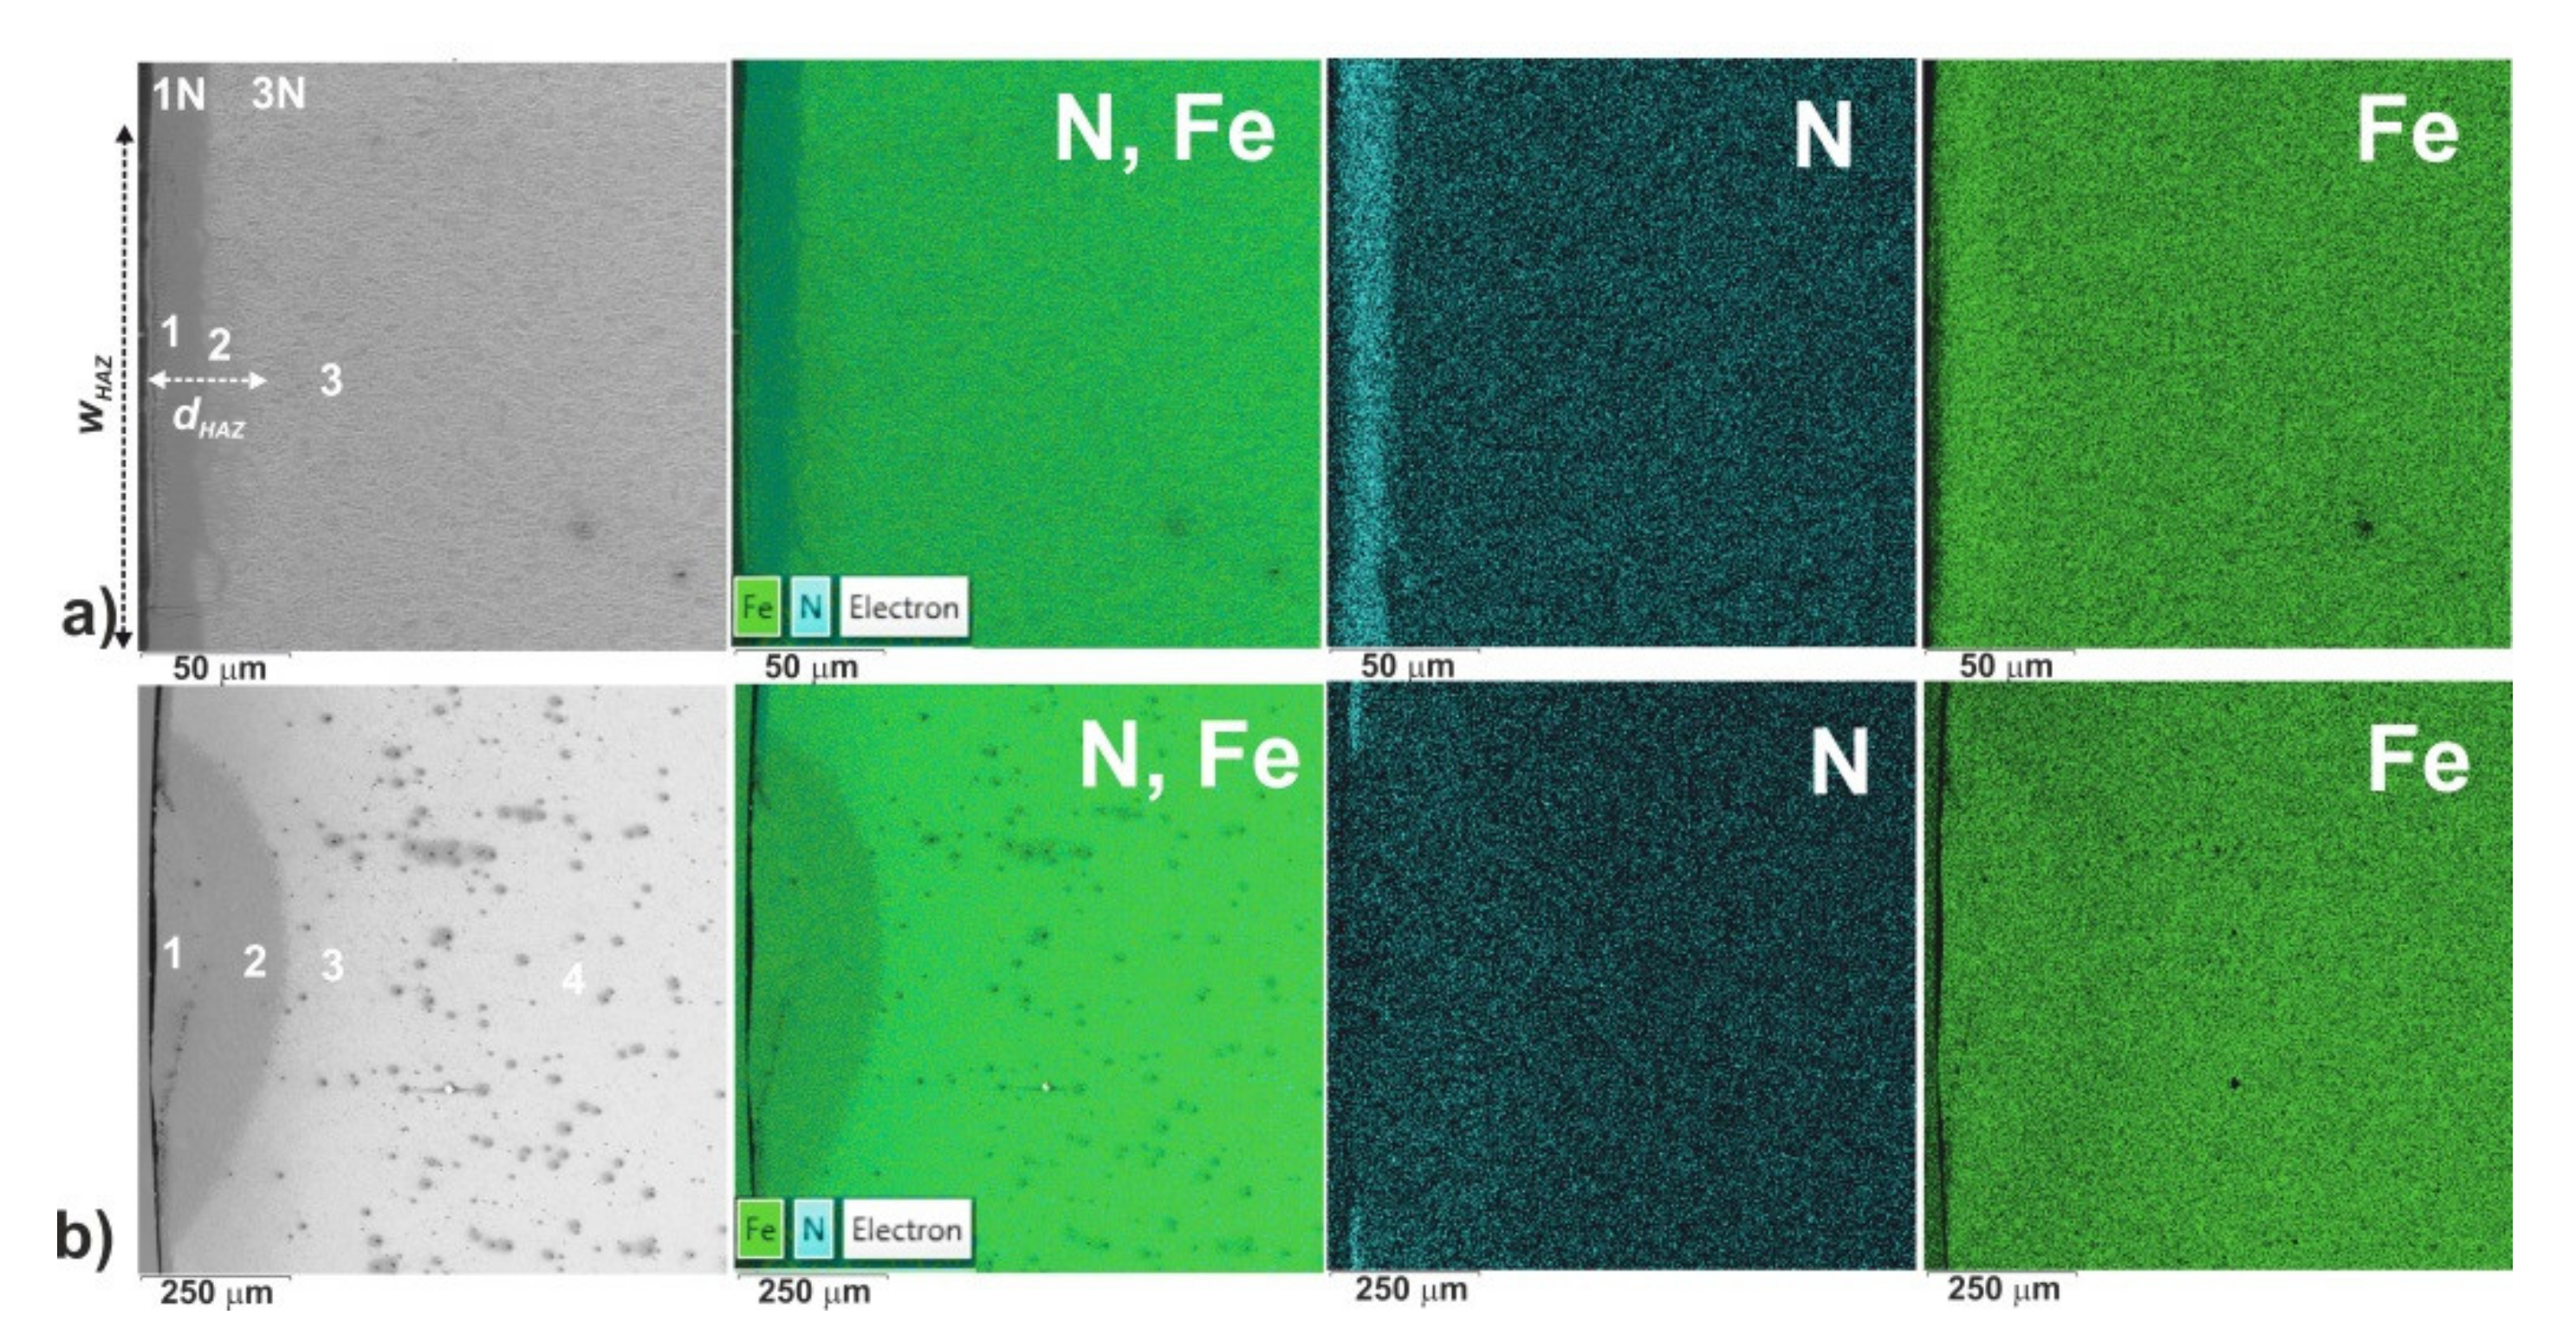
The microstructures of the two-laser track, produced after gas nitriding with and without remelting, were compared taking into account the distribution of iron and nitrogen, measured by Energy Disspersive X-ray Spectroscopy (EDS). SEM images and EDS patterns of iron and nitrogen are shown in
Figure 4. In the case of LHT without remelting (
Figure 4a), it is clearly visible that the increased concentration of nitrogen remained in ε + (ε + γ’) compound zone (1), which was not re-melted. Whereas in the HAZ (2), the change in nitrogen concentration was invisible. Simultaneously, the slightly increased iron concentration was observed in the compound zone (1) as well as heat-affected zone (2). The area of laser activity is characterized in
Figure 4a by the width and depth of HAZ (
wHAZ and
dHAZ, respectively). In the upper part of this figure, the gas-nitrided layer without the laser irradiation was visible (zones: 1N and 3N). The EDS patterns in this area did not differ from those-obtained in the region, which was laser heat-treated without remelting. After the LHT with remelting (
Figure 4b), the iron nitrides were re-melted and nitrogen dissolved in the MZ (1), in which the slightly increased concentration of this element appeared. However, an amount of ε phase could remain in this zone [
27] because of the short time of heating. Simultaneously, the slightly increased concentration of iron was visible in MZ (1) and HAZ (2), probably as a consequence of martensite transformation in these zones.
3.2. Effect of the Temperature Distribution on the Microstructure of Laser Tracks
The temperature distribution during laser heat treatment depended on the laser processing parameters (laser beam radius
rB, laser beam power
P, scanning rate
vl) as well as the physical properties of the treated material (density ρ, specific heat
Cp, thermal conductivity λ, thermal diffusivity α). In the present study, the gas nitrided 42CrMo4 steel was subjected to laser modification using the different parameters (see
Table 1). Therefore, some differences were expected in the effect of LHT, e.g., in the surface temperature and temperature distribution vs., the distance from the surface. The temperature distribution influenced the microstructure, the depths of re-melted zone (MZ), and heat-affected zone (HAZ) as well as the hardness of laser-modified nitrided layer. In order to determine the depths of re-melted zone and heat-affected zone, the melting point and austenitizing temperature were needed. In order to determine the depths of MZ (
dMZ) and HAZ (
dHAZ), the characteristic temperatures of the treated material were needed, i.e., its melting point
Tm, eutectoid temperature
AC1 and temperature of allotropic transformation
AC3. The
AC1 and
AC3 temperatures of 42CrMo4 steel were equal to 1018 K (745 °C) and 1063 K (790 °C), respectively. They were assumed based on the technical card of Lucefin Group [
47]. According to the data of Xingsheng Special Steel company [
48], the melting point
Tm of 42CrMo4 was equal to 1689 K (1416 °C). Such temperatures were taken into account in order to calculate the
dMZ and
dHAZ values based on the temperature distribution vs. the distance from the surface.
It was assumed that the end of MZ (dMZ) should correspond to the melting point Tm. Simultaneously, the end of HAZ (dHAZ) was expected at the depth, which should be between the two depths related to AC3 and AC1 temperatures, respectively. Such assumptions resulted from the unquestionable fact that the re-melted zone should occur between the depth equal 0 (corresponding to the maximal temperature at the surface) and the depth corresponding to the melting point Tm if, obviously, the maximal temperature would be higher than Tm. Then, the LHT with remelting would be carried out. The HAZ would appear between the depth related to Tm and the depth related to AC3 or AC1 temperature. If AC3 was the limiting temperature of this zone, the microstructure of HAZ would consist of the martensite mainly. While, if AC1 temperature was accepted as limiting temperature, the mixture of martensite and ferrite would appear at the end of HAZ. If the maximal temperature was lower than Tm, the MZ would not appear. It would correspond to the LHT without remelting. Then, the ε + (ε + γ’) compound zone would remain in the microstructure. Below the iron nitrides, the HAZ would be observed up to depth related to AC3 or AC1 temperature.
The temperature distribution
T (z, t) along the axis of a single laser track was calculated as a function of the distance from the surface. The results were shown as a graph, related to the obtained microstructure for each variant of LHT parameters used.
Figure 5,
Figure 6 and
Figure 7 show these results for the scanning rates 2.24, 2.88, and 3.84 m·min
−1, respectively. The melting point
Tm, eutectoid temperature
AC1 and temperature of allotropic transformation
AC3 are marked in the presented diagrams of temperature distribution together with calculated depths of MZ (
dMZ) and HAZ (
dHAZ). Simultaneously, the measured values of
dMZ and
dHAZ are shown based on the microstructure observations.
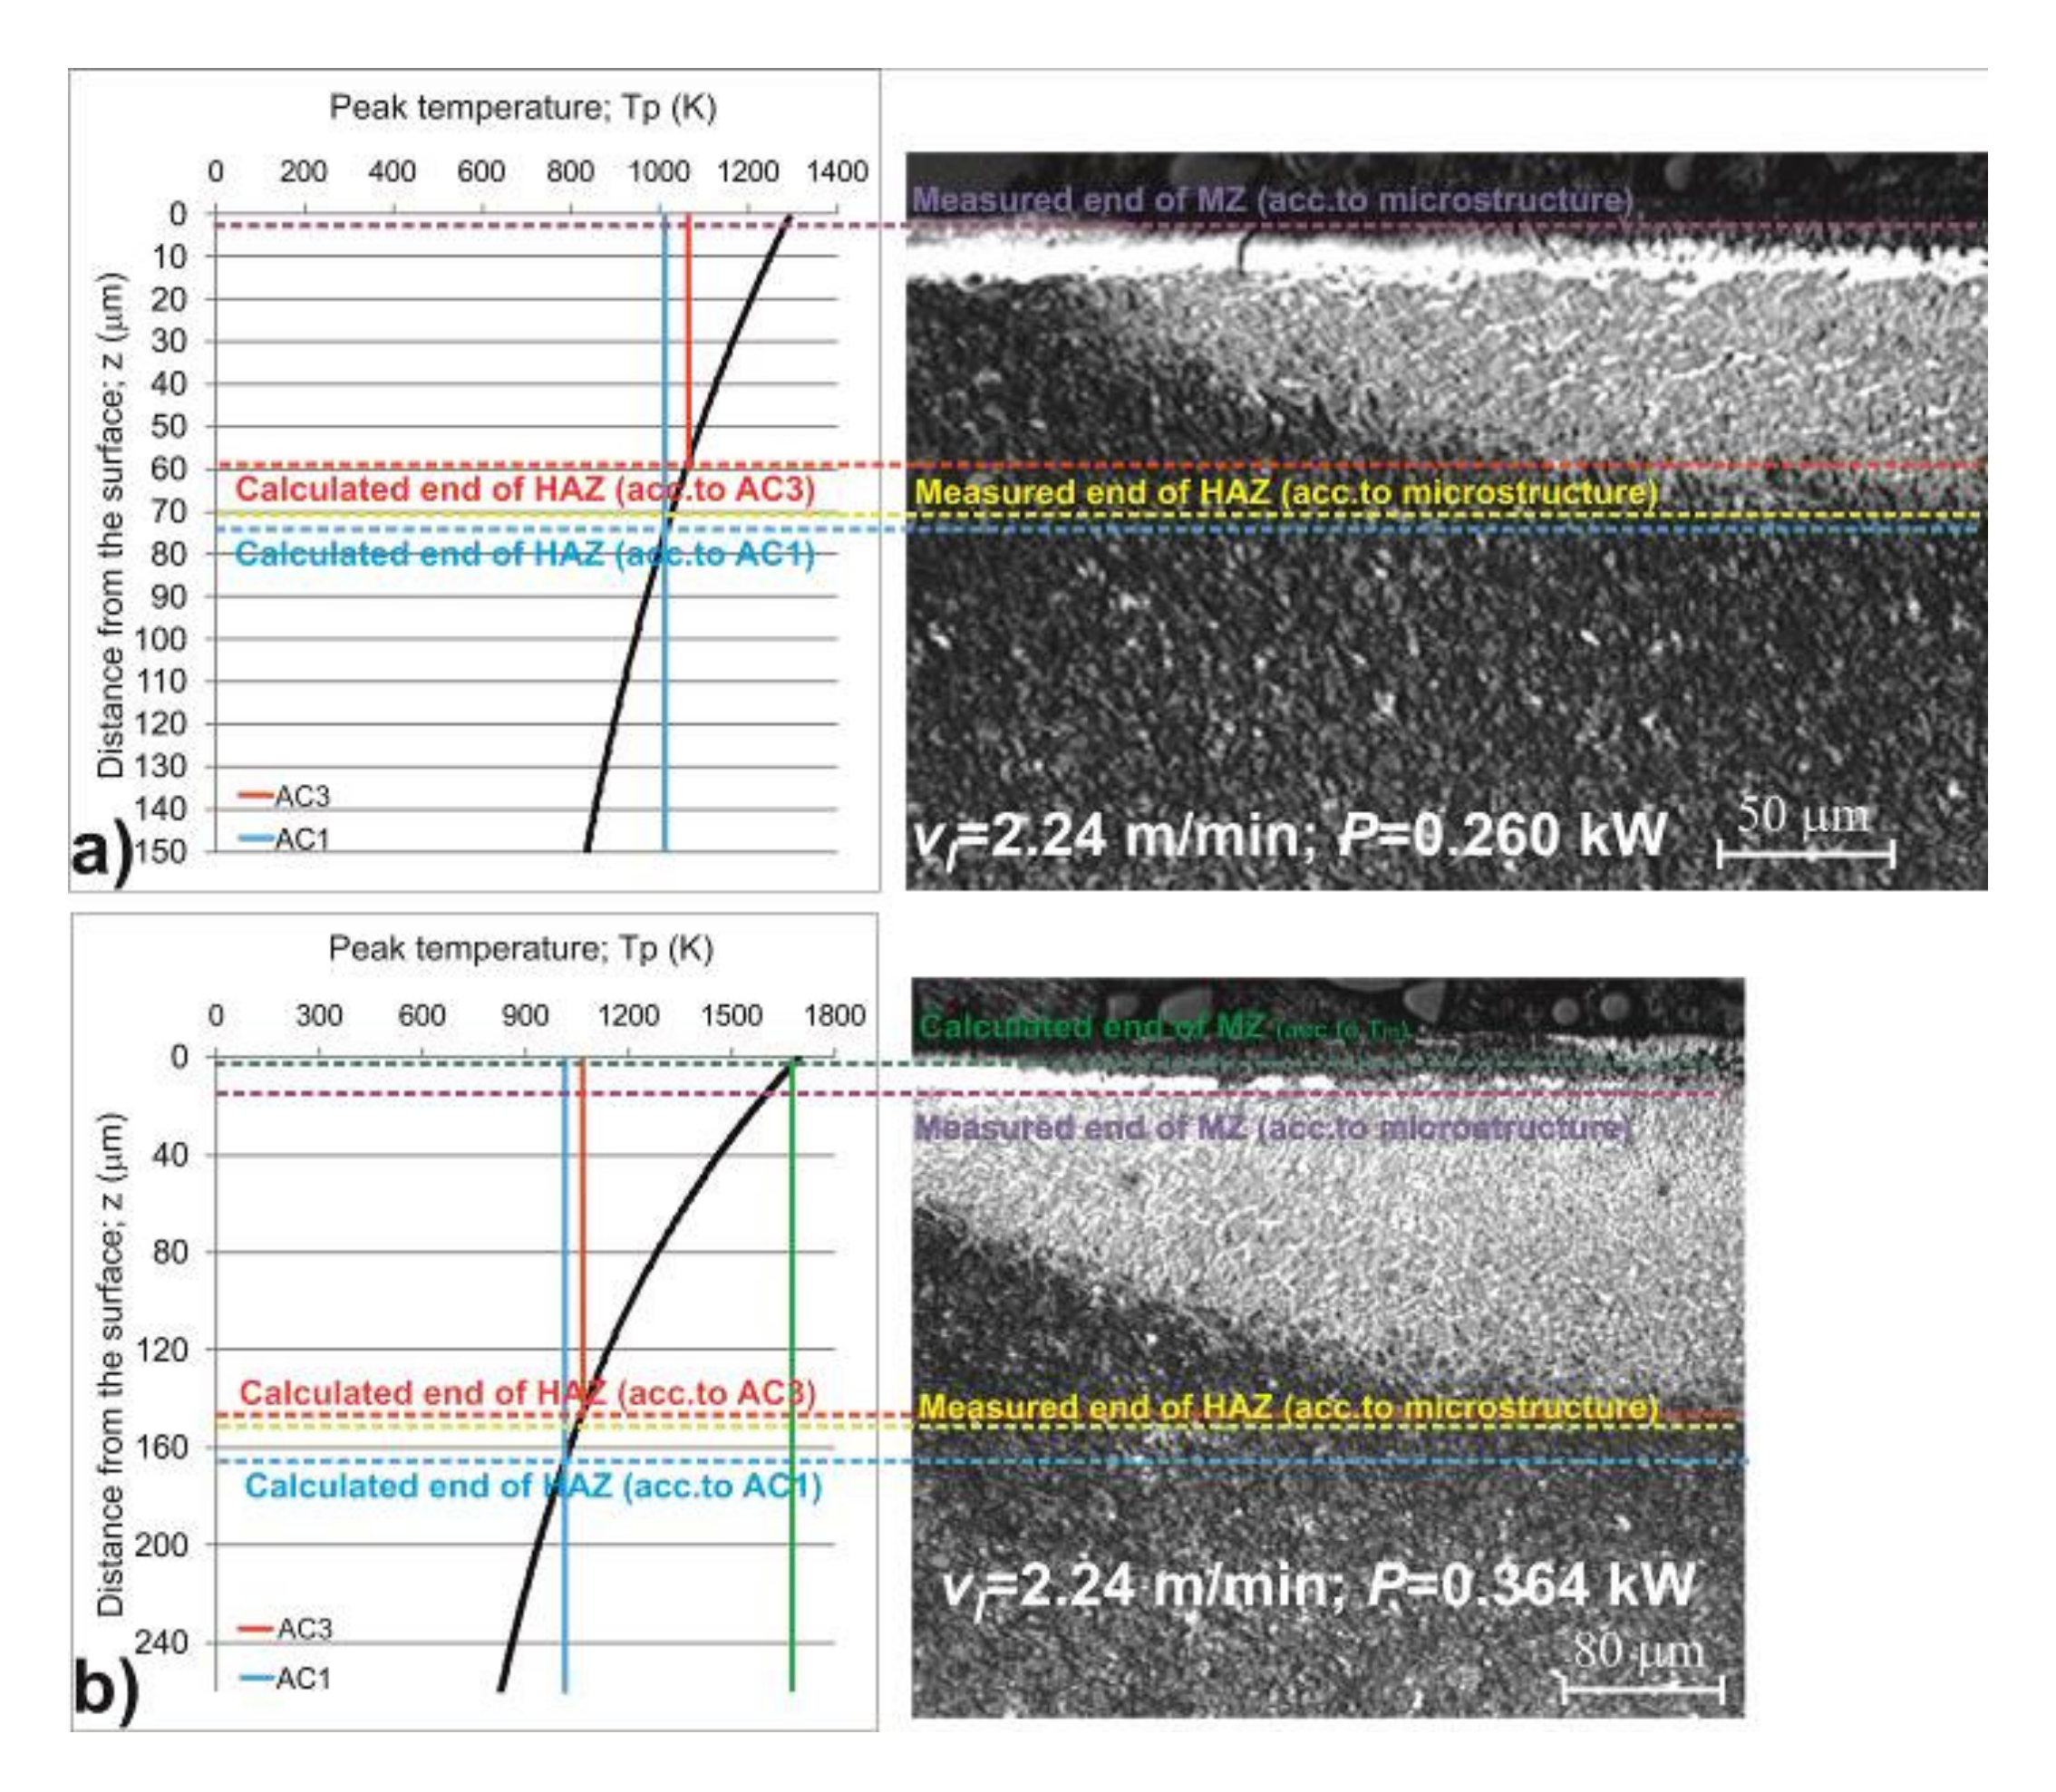
In
Figure 5, the temperature distribution along the axes of laser tracks and related microstructures are shown for gas-nitrided 42CrMo4 steel after laser heat treatment using the scanning rate
vl = 2.24 m·min
−1 and the two laser beam powers (0.260 and 0.364 kW). The maximal temperature, obtained at the surface (1294 K) at laser beam power
P = 0.260 kW, was lower than melting point of the substrate material (
Figure 5a). Therefore, the laser beam action should not cause remelting. However, based on the microstructure observation, the compound zone was slightly re-melted up to a depth of 3 µm (measured end of MZ). The temperature along the axis of a laser track gradually decreased with an increase in the distance from the surface. The measured end of HAZ, i.e., depth of this zone
dHAZ (related to microstructure), was equal to 71 µm. This value ranged between the depths of HAZ related to
AC3 and
AC1 temperatures (59 and 74 µm, respectively) and calculated using the temperature distribution. The use of the second laser beam power
P = 0.364 kW (
Figure 5b) resulted close to the surface in the maximal temperature of 1693 K, which was slightly higher than melting point of the substrate (1689 K). Hence, the calculated end of MZ, i.e., depth of this zone
dMZ, was equal to 2 µm based on the temperature distribution. However, the measured value of
dMZ (related to microstructure) was higher, obtaining 15 µm, and the re-melted zone was clearly visible. Like previously, the measured end of HAZ (
dHAZ = 151 µm) ranged between the values related to
AC3 and
AC1 temperatures (147 and 164 µm, respectively) according to the temperature distribution.
The temperature distribution along the axes of laser tracks and related microstructures are shown in
Figure 6 for gas-nitrided 42CrMo4 steel after laser heat treatment using the scanning rate
vl = 2.88 m·min
−1 and the laser beam powers in the range of 0.234–0.624 kW. At laser beam power of 0.234 kW, the maximal temperature close to the surface (1192 K) was lower than melting point of the substrate material (
Figure 6a). Hence, the laser irradiation should not form the MZ. However, the microstructure observation indicated that the compound zone was slightly re-melted up to a depth of 5 μm (measured end of MZ). The gradual decrease in the temperature along the axis of this laser track was observed with an increase in the distance from the surface. The measured end of HAZ (related to microstructure), i.e., depth of this zone
dHAZ, was equal to 51 μm. The measured
dHAZ was outside the depth range (31–43 µm) determined by the depths of HAZ related to
AC3 and
AC1 temperatures (based on the temperature distribution), obtaining the slightly higher value. The next laser beam power
P = 0.338 kW used (
Figure 6b) also resulted in the lower maximal temperature (1592 K) than melting point of the substrate (1689 K). In this case, the MZ should not be formed. However, the compound zone was partially re-melted, and the measured value of
dMZ (related to microstructure) was equal to 13 μm. Like previously, the measured end of HAZ (
dHAZ = 100 μm) was outside the depth range related to
AC3 and
AC1 temperatures (111–126 μm) according to the temperature distribution. In this case, the measured
dHAZ was slightly lower. The use of the next laser beam power (
P = 0.416 kW) resulted in the maximal temperature of 1892 K, which was clearly higher than melting point of the substrate (1689 K). The temperature distribution, related to the microstructure, is shown in
Figure 6c. It caused the compound zone to re-melt. The calculated and measured depths of MZ were similar, obtaining the values of 27 and 30 μm, respectively. The measured depth of HAZ (
dHAZ = 151 μm) was slightly lower than its depth range (164–180 μm) related to
AC3 and
AC1 temperatures.
The re-melted zone was also visible after LHT using the laser beam power of 0.494 kW. The effect of temperature distribution on the microstructure was shown in
Figure 6d. The maximal temperature (2191 K) significantly exceeded the melting point of the substrate (1689 K). The depths of MZ, measured based on microstructure observation and calculated based on temperature distribution, slightly differed, obtaining the values of 49 and 63 μm, respectively. Whereas the measured depth of HAZ (
dHAZ = 188 μm) was clearly outside the depth range (212–230 μm), calculated for
AC3 and
AC1 temperatures. Larger differences between calculated and measured depths of MZ and HAZ were observed after LHT using the laser beam power of 0.624 kW (
Figure 6e). The maximal temperature close to the surface was equal to 2691 K. The measured depth of MZ (
dMZ = 90 μm) was significantly lower than the value calculated for the melting point (
dMZ = 116 μm). The measured depth of HAZ (
dHAZ = 207 μm) was even more outside the depth range (284–304 μm), related to
AC3 and
AC1 temperatures.
In
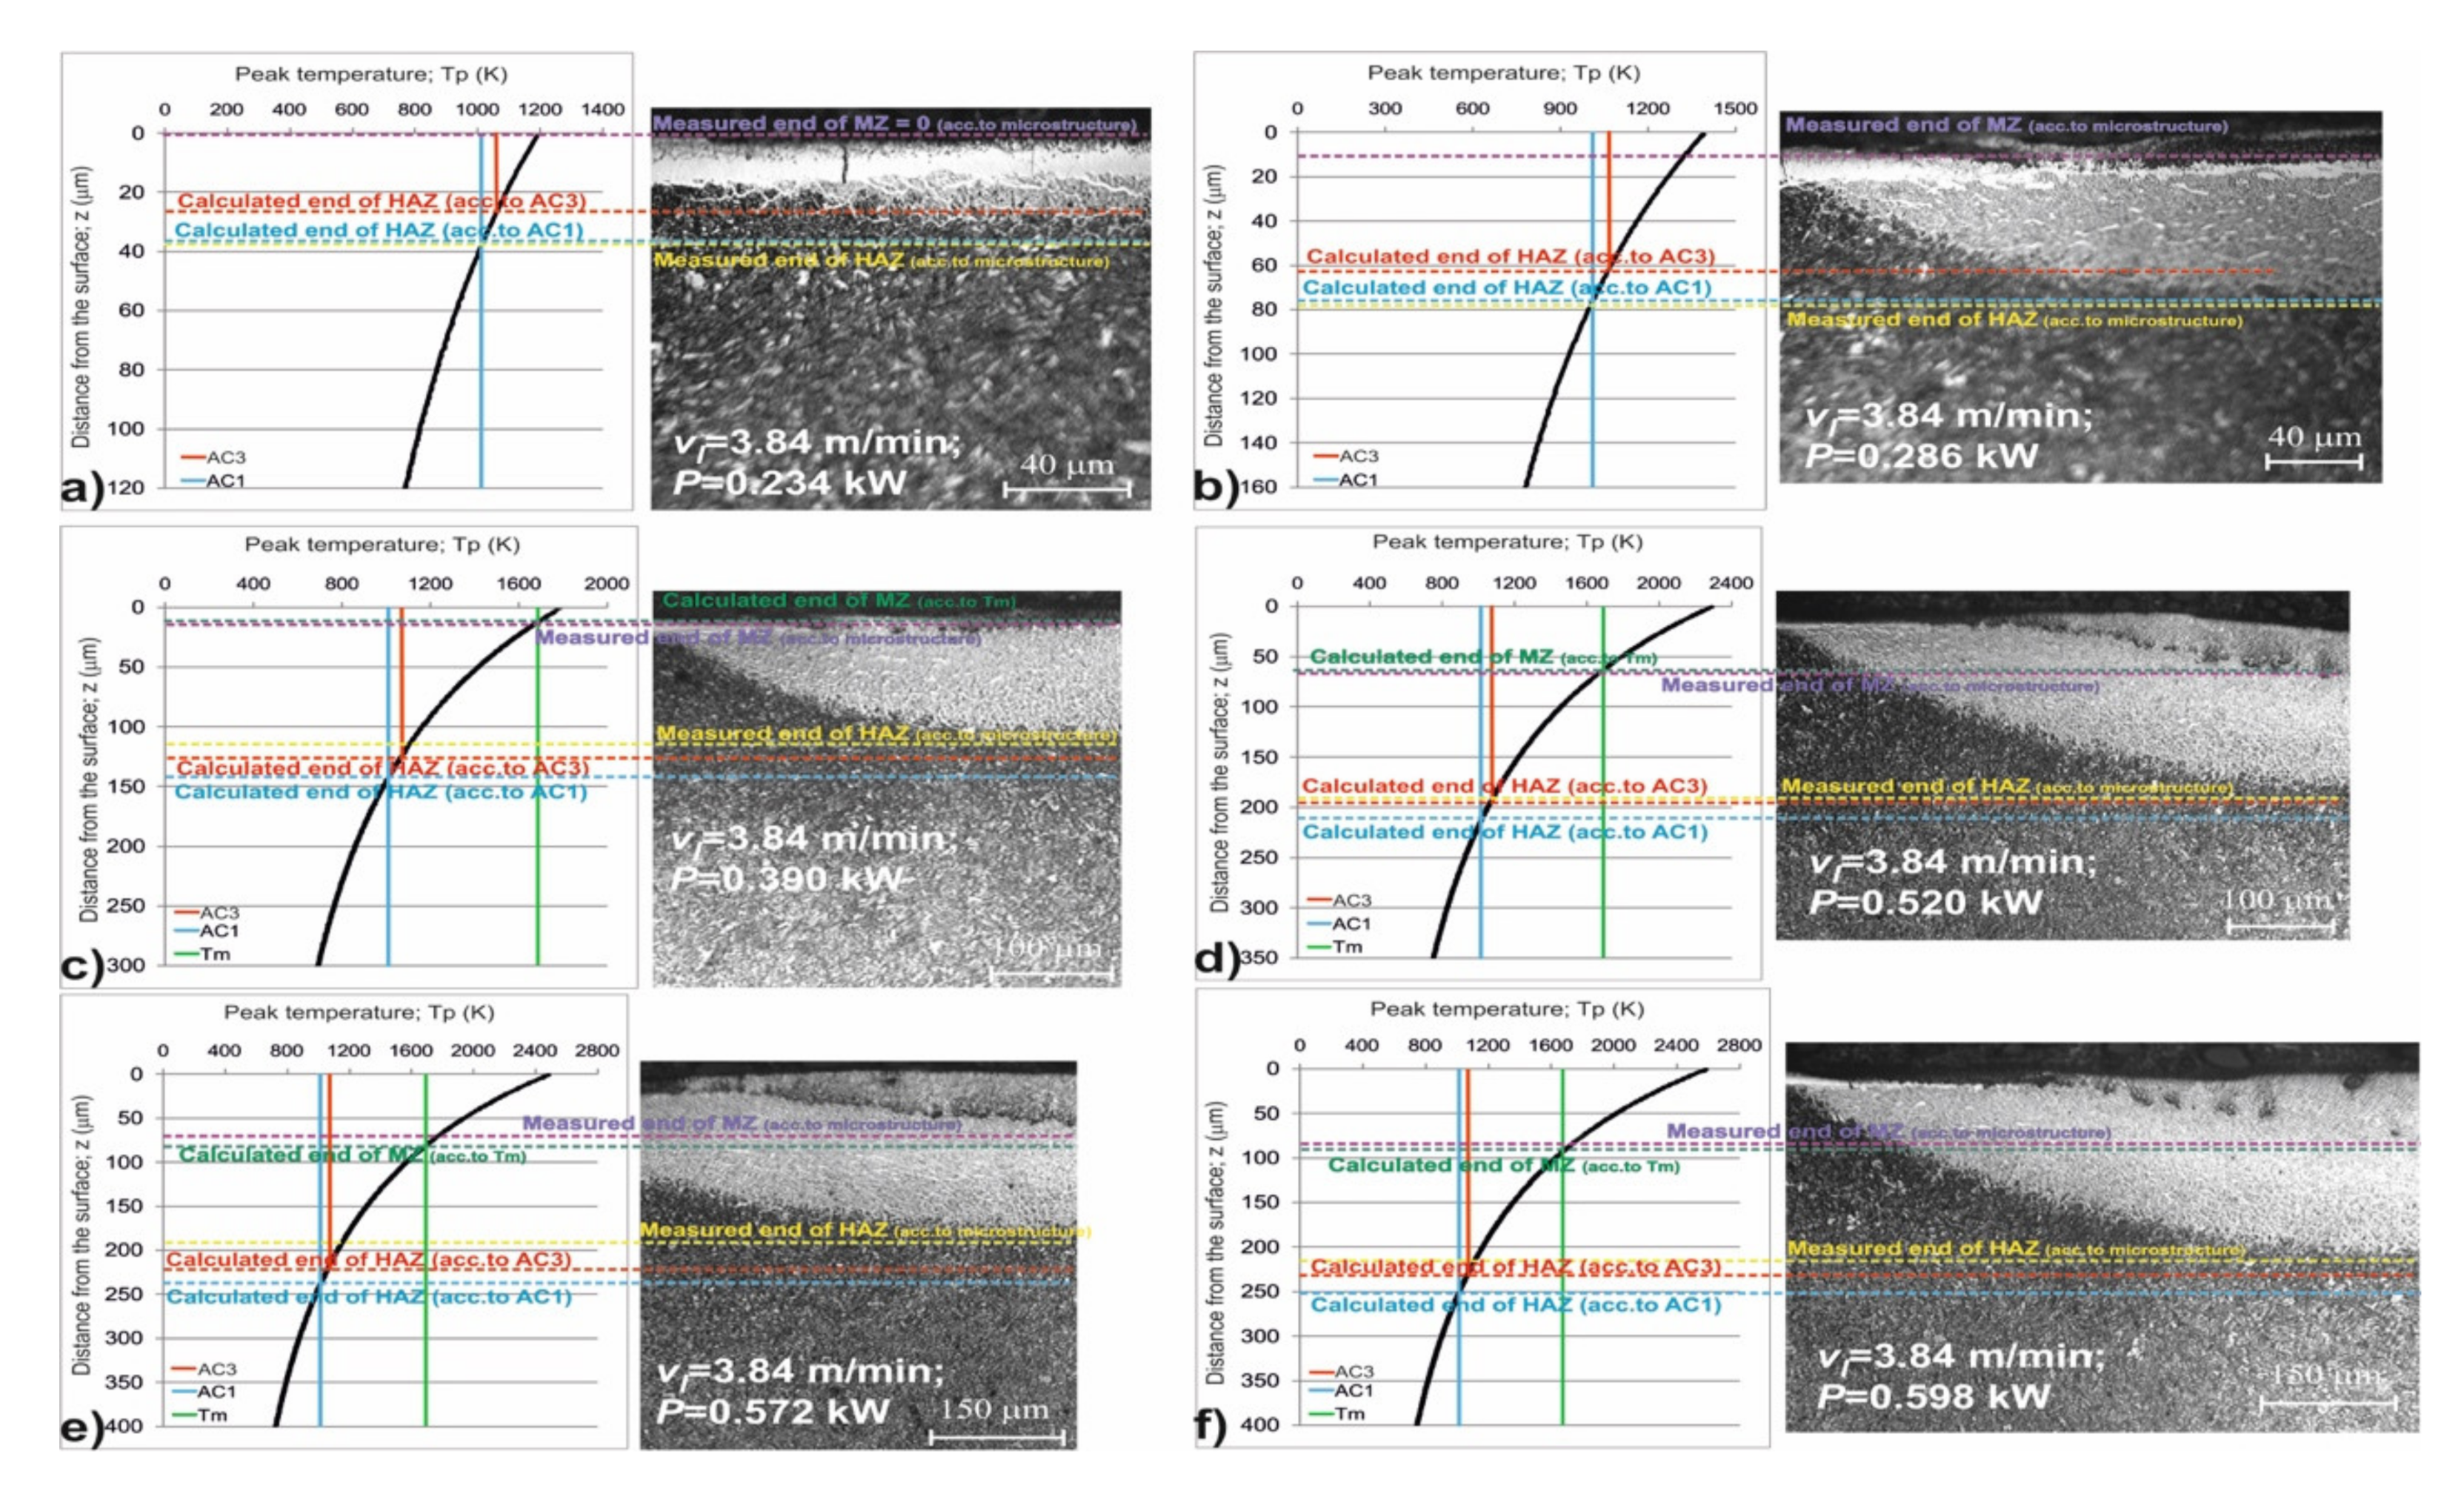
Figure 7, the temperature distribution along the axes of laser tracks and related microstructures are shown for gas-nitrided 42CrMo4 steel after LHT using the scanning rate
vl = 3.84 m·min
−1 and the laser beam power in the range of 0.234–0.598 kW. At laser beam power of 0.234 kW, the maximal temperature close to the surface (1192 K) was significantly lower than melting point of the substrate material (
Figure 7a). The calculated and measured depths of MZ (
dMZ) were the same, obtaining the value of 0 μm. It was indicated that the laser heat treatment without remelting was observed. The ε + (ε + γ’) compound zone remained after LHT. It was the only case during the laser modification of gas-nitrided layer. The measured depth of HAZ (
dHAZ = 38 μm), based on the microstructure observation, was slightly higher than its depth range (27–37 μm) related to
AC3 and
AC1 temperatures. Although the maximal temperature at the surface (1391 K) was lower than the melting point of the substrate, the laser beam power of 0.286 kW resulted in the formation of the partially re-melted compound zone (
Figure 7b). The measured depth of MZ (based on microstructure observation) was equal to 11 μm. Like in the previous case, the measured depth of HAZ (
dHAZ = 78 μm), based on the microstructure observation, was slightly higher than its depth range (63–75 μm) related to
AC3 and
AC1 temperatures and calculated using the temperature distribution. The LHT using the laser beam power
P = 0.390 kW (
Figure 7c) caused the formation of re-melted zone (MZ) and heat-affected zone (HAZ) due to the relatively high maximal temperature (1791 K), which exceeded the melting point of the substrate (1689 K). The calculated and measured values of
dMZ were similar, obtaining 12 and 14 μm, respectively. Whereas the measured depth of HAZ (
dHAZ = 114 μm) was outside the depth range (127–142 μm), calculated for
AC3 and
AC1 temperatures.
The next laser beam power (0.520 kW) resulted in the still higher maximal temperature (2290 K). Hence, the depths of MZ and HAZ were even greater (
Figure 7d). The calculated and measured depths of MZ (
dMZ) were almost the same (64 and 65 μm, respectively). Like previously, the measured depth of HAZ (
dHAZ) was outside the depth range (196–212 μm), determined for
AC3 and
AC1 temperatures. Its value was slightly smaller (190 μm) than the lower limit of this range. The next laser beam powers (0.572 and 0.598 kW) caused still deeper remelting because the maximal temperatures (2489 and 2589 K, respectively) significantly exceeded the melting point (1689 K). In general the depths of MZ and HAZ were greater with the increase in laser beam power (
Figure 7e,f). In the case of
P = 0.572 kW (
Figure 7e), the measured depth of MZ (
dMZ) was equal to 67 μm, being slightly smaller than the calculated value (81 μm), whereas, the measured depth of HAZ (
dHAZ = 197 μm) was outside the depth range (222–238 μm), calculated for
AC3 and
AC1 temperatures. The use of the laser beam power of 0.598 kW (
Figure 7f) resulted in the slightly smaller measured depth of MZ (
dMZ = 82 μm) than the calculated value (90 μm). Like previously, the measured depth of HAZ (
dHAZ = 218 μm) was smaller than the lower limit of the depth range (234–251 μm), which was determined by
AC1 and
AC3 temperatures.
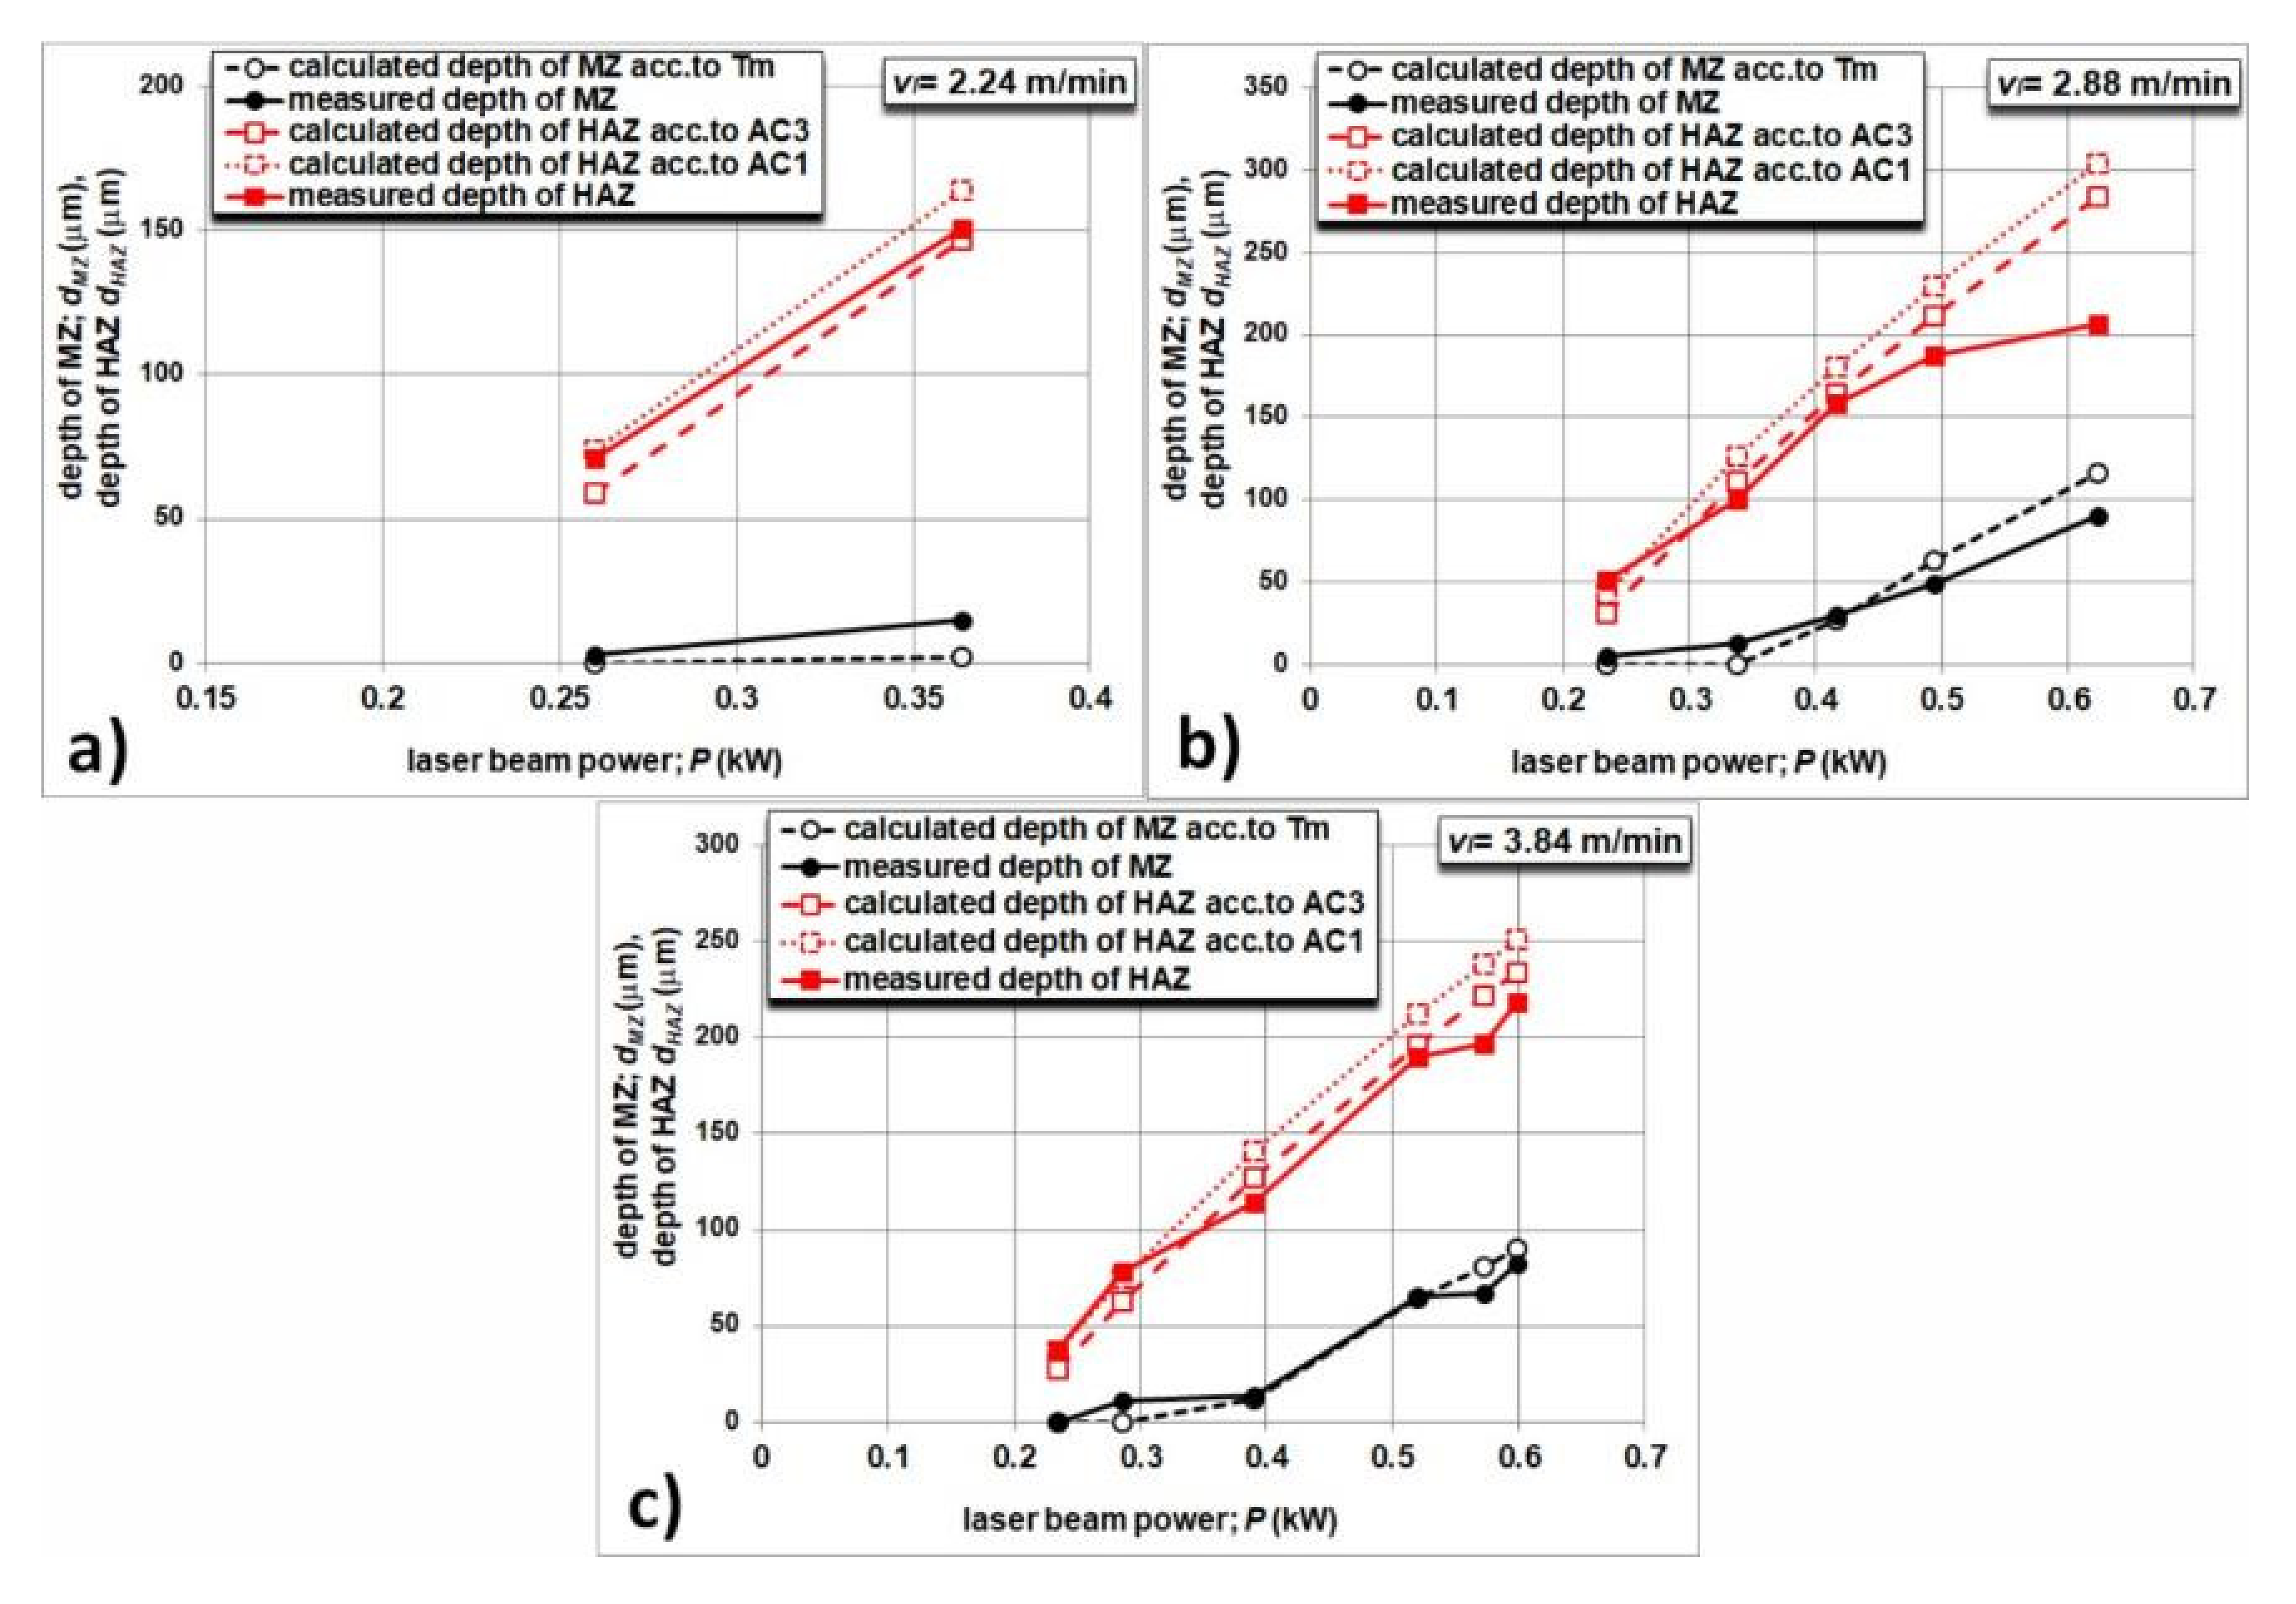
In
Figure 8, the calculated and measured values of
dMZ and
dHAZ are compared for all the applied laser processing parameters. Only the two laser beam powers were used during LHT at scanning rate
vl = 2.24 m·min
−1 (
Figure 8a). The laser beam power of 0.260 kW should not cause remelting of the compound zone. However, the iron nitrides were partially re-melted. The measured and calculated depths of MZ differed slightly. Whereas the measured depths of HAZ were in the depth range, determined by
AC3 and
AC1 temperatures. At scanning rate
vl = 2.88 m·min
−1 (
Figure 8b), the measured depths of MZ were initially slightly greater than the calculated values. Such a situation was observed if the laser beam power did not exceed 0.416 kW. The next laser beam powers resulted in the diminished measured values of
dMZ when compared to the calculated depths. Up to the laser beam power of 0.494 kW, the measured depths of HAZ slightly differed from the calculated values, being outside the depth range determined by
AC3 and
AC1 temperatures. The significant difference was observed if the laser beam power of 0.624 kW was used. In general, at a scanning rate
vl = 3.84 m·min
−1 (
Figure 8c), the measured depths of MZ and HAZ were close to the calculated values. Only the laser beam higher than 0.520 kW resulted in larger differences. The diagrams, presented in
Figure 8, showed that the depths of re-melted zone and heat-affected zone could be efficiently predicted using the equations developed by Ashby and Esterling [
31,
32,
33]. The accuracy of this prediction could be better if some of the physical properties of iron nitrides, such as thermal conductivity λ and specific heat of material
Cp, were known. However, there were no data in the literature regarding these properties.
3.3. Effect of the Temperature Distribution on Microhardness Profiles
The microhardness profiles along the axes of the produced single laser tracks after gas nitriding are presented in
Figure 9,
Figure 10 and
Figure 11. The measurements were carried out perpendicular to the treated surface and compared to the microhardness profile after the controlled gas nitriding. The maximal hardness of the gas-nitrided 42CrMo4 steel was measured in compound zone and was equal to 759.4 HV. Next, the gradual decrease in microhardness was observed. In the diffusion zone, the microhardness decreased from 654.8 (close to the compound zone) to 346.8 HV at the end of diffusion zone. The end of the diffusion zone, assumed as the depth at which the hardness obtained the values characteristic of the substrate, corresponded to about 450 μm. The toughened (quenched and high-temperature tempered) substrate material had a hardness of about 320–340 HV. As a consequence of the various laser processing parameters (scanning rate and laser beam power), the LHT was carried with complete remelting of the compound zone, with partial remelting of compound zone or without remelting. The temperature distribution during LHT influenced the microstructure produced. It resulted in the different microhardness profiles along the laser tracks. In general, the changes in microstructure, especially the appearance of nitric martensite in MZ and in HAZ, could result in the increased microhardness.
The microhardness profiles of single laser tracks, produced in the gas-nitrided 42CrMo4 steel at scanning rate
vl = 2.24 m·min
−1 and the two laser beam powers used (0.260 and 0.364 kW), are shown in
Figure 9. The use of
P = 0.260 kW resulted in the formation of very thin partially re-melted compound zone and heat-affected zone. It was difficult to measure the microhardness of partially re-melted zone because of its small depth. The microhardness of HAZ ranged from 732.6 to 833 HV and was significantly increased when compared to the same area of diffusion zone in gas-nitrided layer. The hardening of this zone occurred as a consequence of martensite transformation. Below the HAZ, the microhardness profile was characteristic of the rest part of diffusion zone, which was not subjected to LHT. Laser beam power of 0.364 kW caused the formation of clearly visible MZ (completely re-melted compound zone) and HAZ. The microhardness of re-melted compound zone (MZ) was equal to 698 HV and was slightly lower than the microhardness of the iron nitrides before LHT. The HAZ was characterized by the microhardness in the range of 726.1–916 HV. Its maximal value exceeded the microhardness, usually obtained after typical quenching of 42CrMo4 steel (about 700–750 HV). It resulted from the increased hardenability due to the formation of austenite enriched in nitrogen before the martensite transformation. Hence, the martensite, supersaturated with carbon, additionally contained nitrogen. Besides, an amount of γ’ precipitates could remain in HAZ and also cause the increase in hardness. The microhardness of MZ was lower than that of HAZ because of the presence of coarse-grained nitric martensite, whereas in HAZ, the fine-grained martensite occurred.
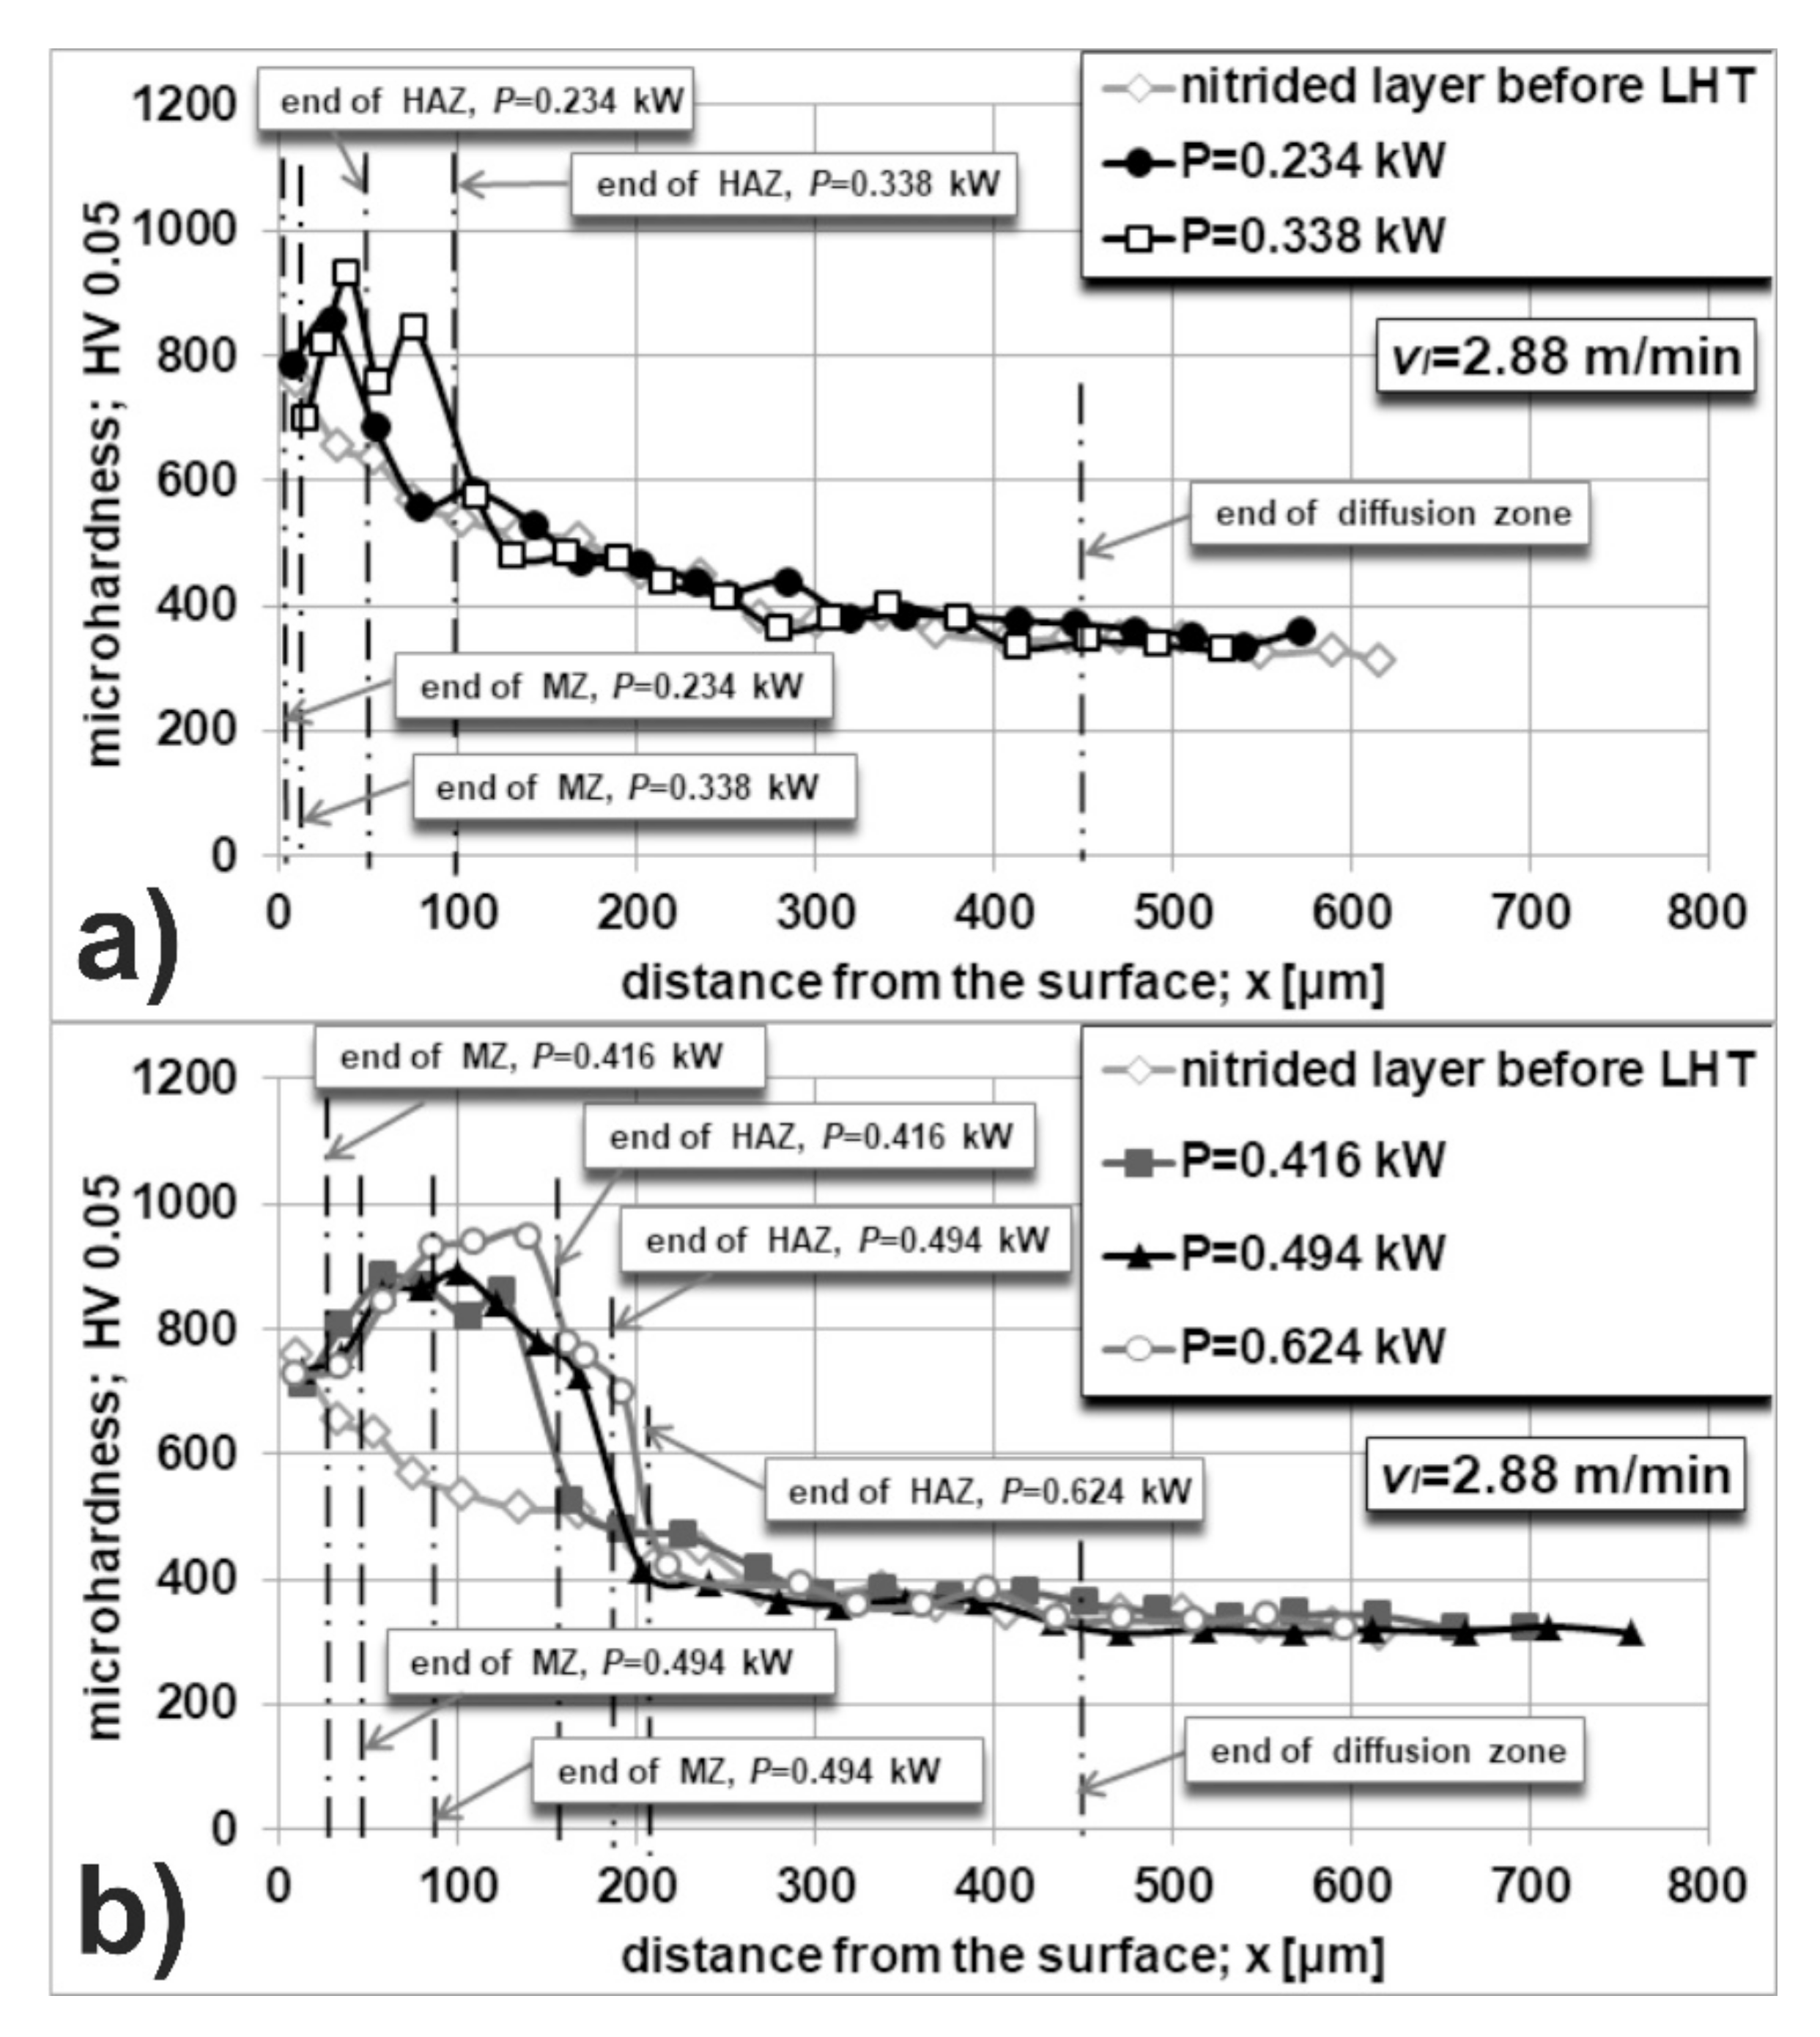
The five microhardness profiles of single laser tracks are shown in
Figure 10, in which the effect of the temperature distribution is presented after LHT using the scanning rate
vl = 2.88 m·min
−1. The laser beam power ranged from 0.234 to 0.624 kW. The two first values of
P (0.234 and 0.338 kW) caused the formation of partially re-melted compound zone and heat-affected zone (
Figure 10a). The microhardness of relatively thin MZ (partially re-melted iron nitrides) was equal to 787 and 698 HV, respectively. The microhardness of the relatively thin HAZ, produced at the lower laser beam power (0.234 kW) ranged from 689.1 to 857.2 HV, whereas the LHT using the higher value of
P (0.338 kW), resulted in the larger depth of HAZ and the microhardness in the range of 752.5–927.2 HV. Like previously, the relatively high microhardness of HAZ was caused by the presence of fine-grained nitric martensite and increased hardenability because of the nitrogen, dissolved in austenite during heating. The presence of coarse-grained nitric martensite in partially re-melted compound zone was the reason for the lower microhardness in this zone. The rest of the microhardness profiles of single laser tracks, produced at a scanning rate of 2.88 m·min
−1, are presented in
Figure 10b. The laser beam power was in the range of 0.416–0.624 kW. In these cases, the completely re-melted compound zones (MZ) as well as heat-affected zones (HAZ) were clearly visible in the microstructure. The depths of MZ and HAZ increased with the increasing laser beam power. Like previously, the microhardness of MZ was slightly lower than that of HAZ by the reasons, mentioned above. The values, measured in MZ after the LHT using laser beam power of 0.416, 0.494 and 0.624 kW, were as follows: 710 HV, in the range of 732.6–758 HV and in the range of 726.1–841 HV, respectively. Whereas the microhardness of HAZ obtained the values in the range of 802.3–882.5, 726.1–891.2, and 695–936.5 HV after LHT using laser beam power of 0.416, 0.494, and 0.624 kW, respectively.
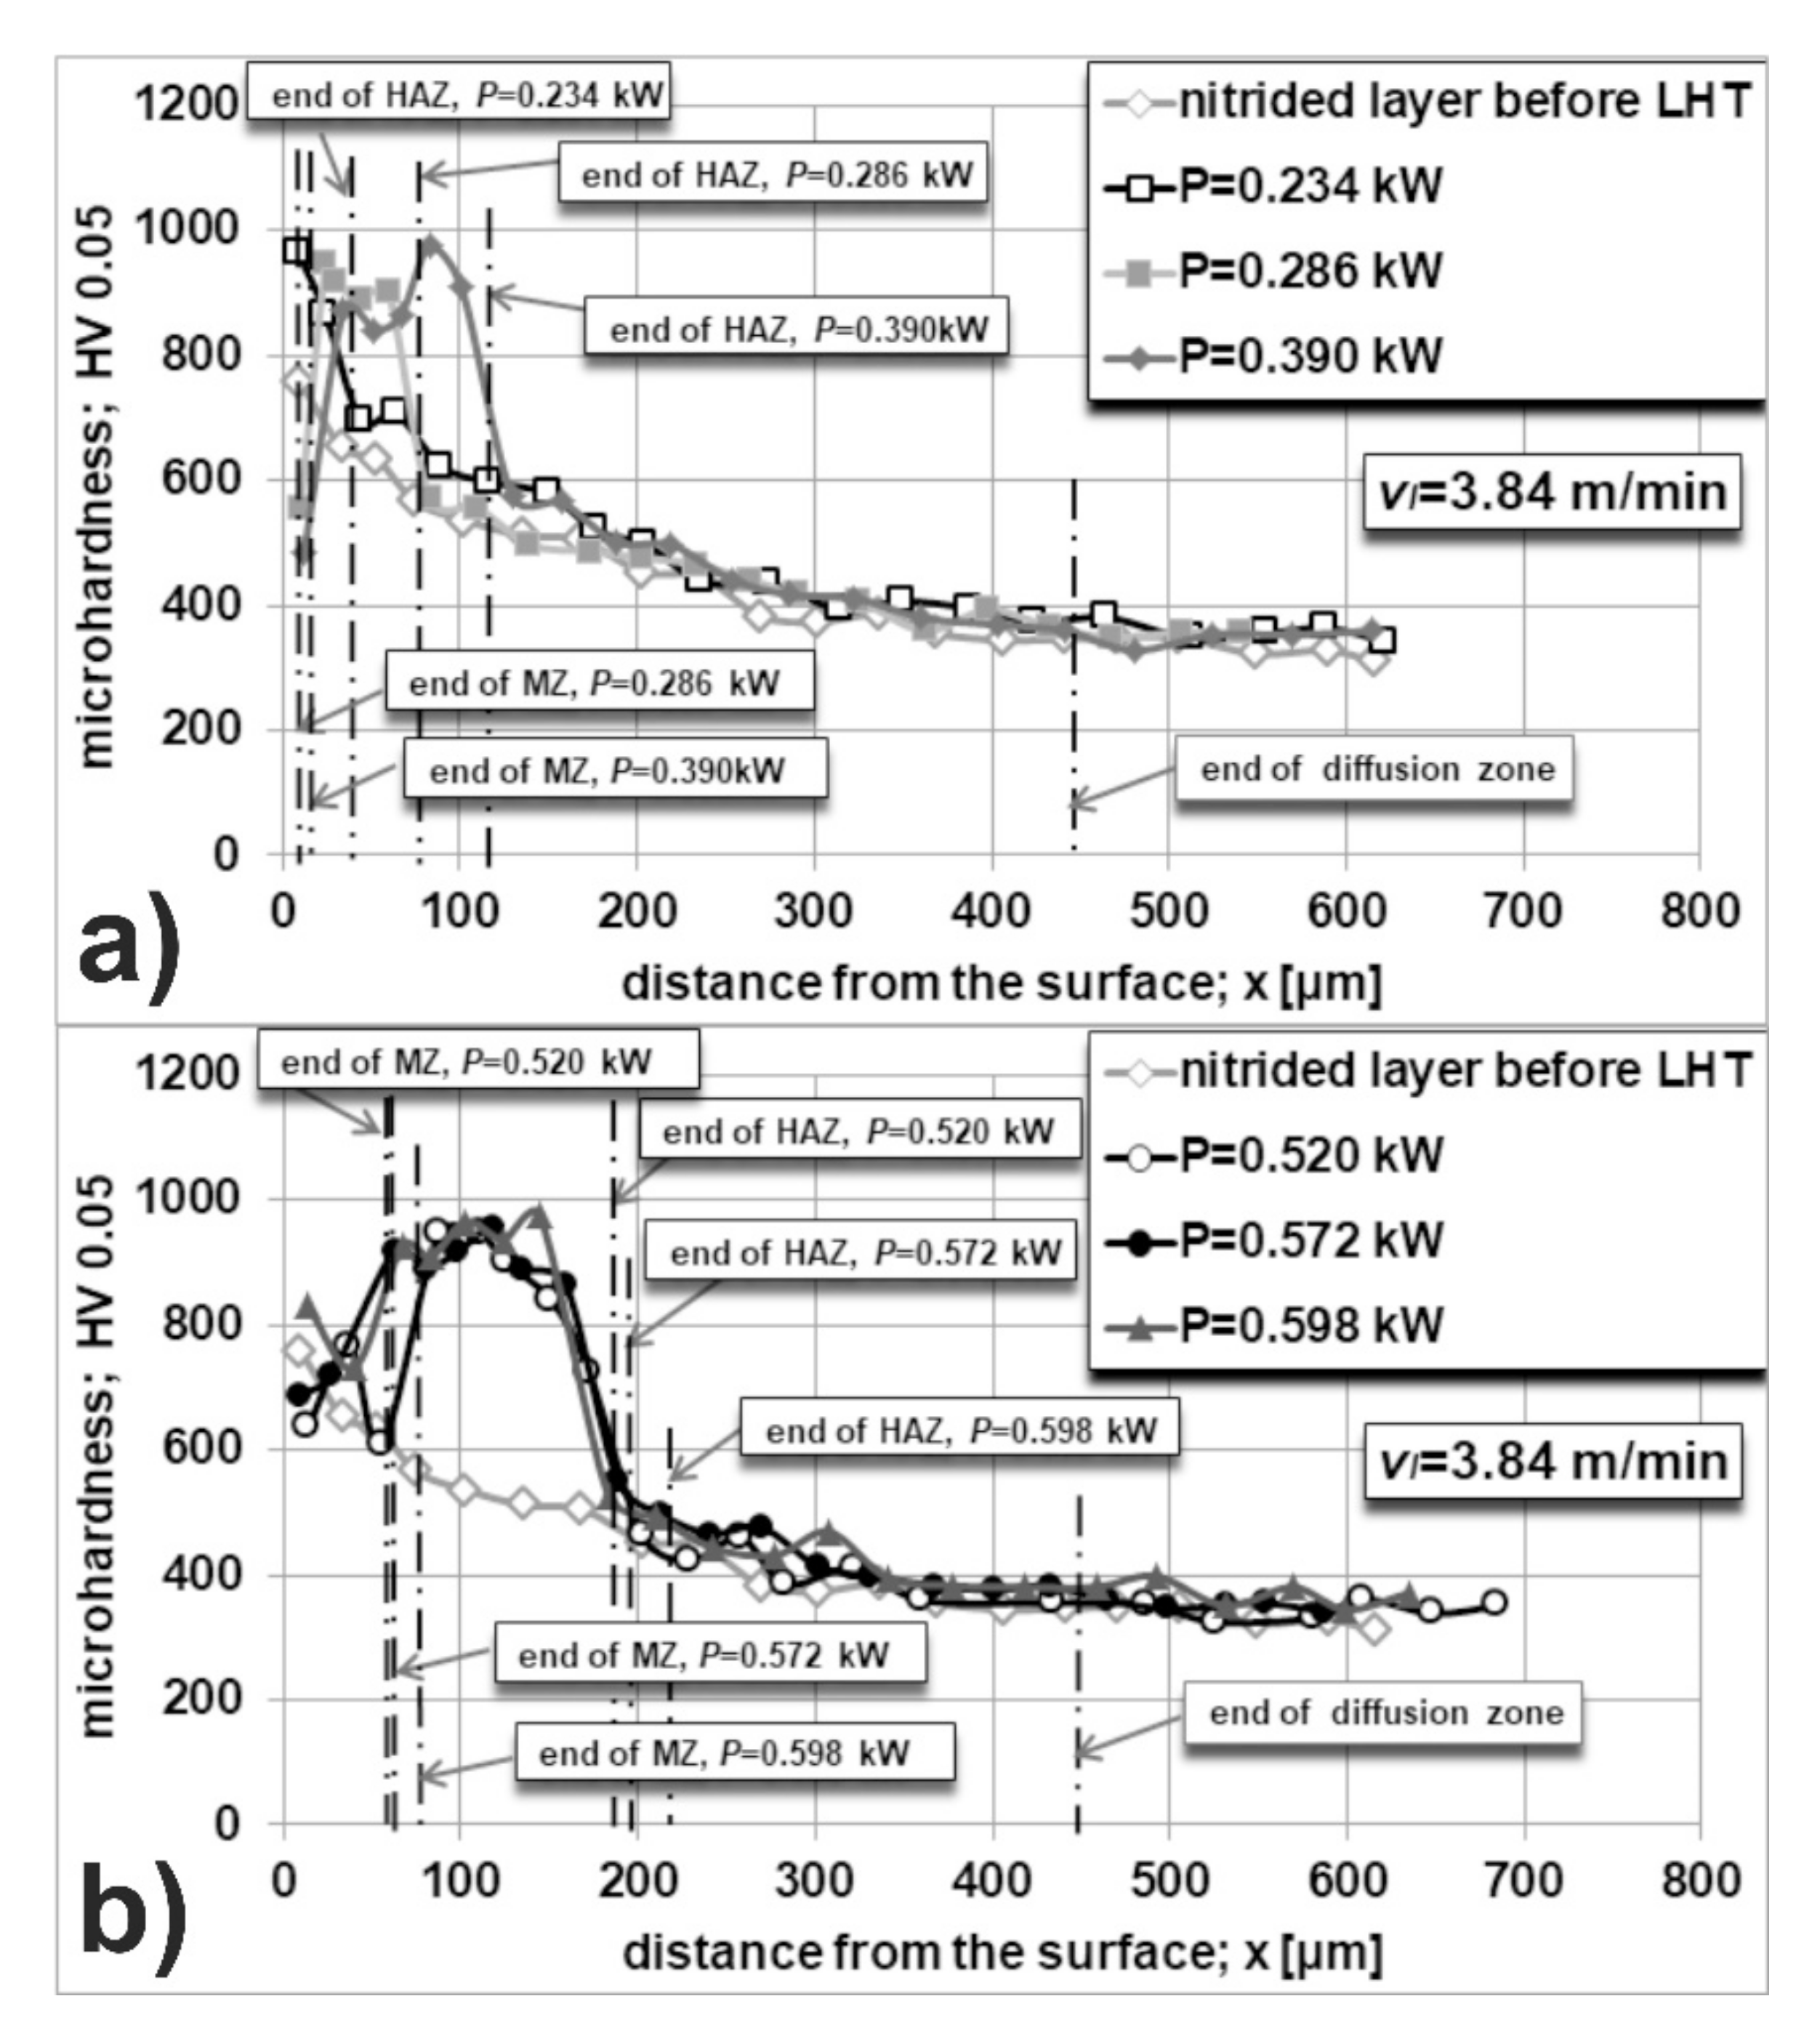
The microhardness profiles of single laser tracks, produced in the gas-nitrided 42CrMo4 steel at scanning rate
vl = 3.84 m·min
−1 and the laser beam power in the range of 0.234–0.598 kW are shown in
Figure 11. The use of
P = 0.234 kW resulted in the formation of a laser track without visible remelting of compound zone. The microstructure consisted of the laser-modified ε + (ε + γ’) compound zone and heat-affected zone.
Figure 11a shows the microhardness measured along the axis of this laser track. The microhardness of the compound zone (965.4 HV) was higher than the value obtained directly after gas nitriding (759.4 HV). It could be the result of an advantageous influence of LHT without remelting on the microstructure of a compound zone. It was reported previously that the outer ε zone seemed to be less porous and more compact because of laser irradiation without remelting [
27,
28]. The higher hardness of the compound zone after LHT could confirm this conclusion. The microhardness of HAZ ranged from 695 to 865.6 HV and was significantly increased when compared to the same area of diffusion zone in gas-nitrided layer. The slightly increased microhardness was also observed below HAZ up to a depth of 90 µm. It could indicate that the real depth of HAZ was greater. The laser beam power of 0.286 kW caused the formation of partially re-melted compound zone and heat-affected zone. In this case, the microhardness of MZ (557.2 HV) was lower than that of a compound zone directly after gas nitriding (
Figure 11a), whereas the microhardness of HAZ was exceptionally high, obtaining the values in the range of 891.2–946 HV. The last microhardness profile, presented in
Figure 11a, was determined after LHT with the use of laser beam power
P = 0.390 kW. In this case, the completely re-melted compound zone and the larger heat-affected zone were identified in the microstructure. Simultaneously, the relatively low microhardness was measured in the MZ (483.4 HV). The HAZ was characterized by the high microhardness, ranged from 841 to 975.4 HV. The relatively thin MZ, slightly bonded to the HAZ, as well as the lower cooling rate could be the probable reasons for the significantly diminished microhardness of MZ in the two last cases.
Figure 11b shows the microhardness profiles vs., the distance from the surface, measured after LHT using the scanning rate of 3.84 m·min
−1 and the next laser beam powers:
P = 0.520 kW,
P = 0.572 kW, and
P = 0.598 kW. In all theses cases, the completely re-melted compound zones as well as the relatively thick heat-affected zones were observed in the microstructure. The use of
P = 0.520 kW resulted in the microhardness of MZ in the range of 607.9–766.3 HV and was comparable to the microhardness of compound zone, measured directly after gas nitriding. Like in the previous cases, the HAZ was harder because of the presence of fine-grained nitric martensite with γ’ precipitates. The microhardness of HAZ ranged from 726.1 to 946 HV and was significantly increased in comparison with the same area of diffusion zone after gas nitriding. After LHT with the use of laser beam power of 0.572 kW, the measured microhardness of MZ and HAZ ranged from 689.1 to 719.8 HV and from 865.6 to 955.7 HV, respectively. The laser track, produced at
P = 0.598 kW, was characterized by the relatively high microhardness of MZ (732.6–833 HV) and still higher microhardness of HAZ (908.9–975.4 HV). However, the range of the microhardness, obtained in the MZ and HAZ, could be random to a certain degree. The measured values strongly depended on the selected measuring sites.
3.4. Effect of the Temperature Distribution on Nanomechanical Properties
Nanomechanical properties were measured for the gas-nitrided layer and the two hybrid surface layers, i.e., gas-nitrided and laser-modified. The selected laser tracks represented the LHT without remelting (
P = 0.234 kW and
vl = 3.84 m·min
−1) as well as LHT with significant remelting (
P = 0.624 kW and
vl = 2.88 m·min
−1). The measurements were performed on the etched specimens so that it was easy to identify the zones, occurring in the surface layer, as well as the indents in these zones. In the case of gas-nitrided sample, the zones were as follows: compound zone, i.e., ε iron nitrides and ε + γ’ iron nitrides, and diffusion zone with nitric sorbite and γ’ precipitates. The LHT without remelting provided the microstructure consisted of laser-modified compound zone, i.e., ε iron nitrides and ε + γ’ iron nitrides, heat-affected zone with fine-grained nitric martensite and γ’ precipitates, and the rest part of the diffusion zone with nitric sorbite and γ’ precipitates. Whereas, the LHT with remelting caused the formation of re-melted zone with coarse-grained nitric martensite, heat-affected zone with fine-grained nitric martensite and γ’ precipitates, and the rest part of the diffusion zone with nitric sorbite and γ’ precipitates. The number of measurements in each zone ranged from 3 to 11, depending on the size of the specified zone, i.e., its depth. The nanomechanical properties of the substrate, i.e., quenched and high-temperature tempered 42CrMo4 steel, were also measured. The indentation hardness
HIT and plane-strain modulus
E* were provided directly by the nanoindenter, based on the obtained indentation curve (load-displacement curve) during loading and unloading. The Vickers hardness
HVIT and indentation modulus
EIT were calculated using the equations reported by the paper [
28]. The calculations of
EIT values required to take into account Poisson’s ratio of the measured phase. According to the analysis, mentioned in
Section 2.5, Poisson’s ratio ν
s = 0.3029 was accepted for calculations in the ε zone, and ν
s = 0.3281 was accepted for ε + γ’ zone. The standard value of Poisson’s ratio ν
s = 0.3 was assumed for the other zones, i.e., diffusion zone, re-melted zone, heat-affected zone, as well as substrate material.
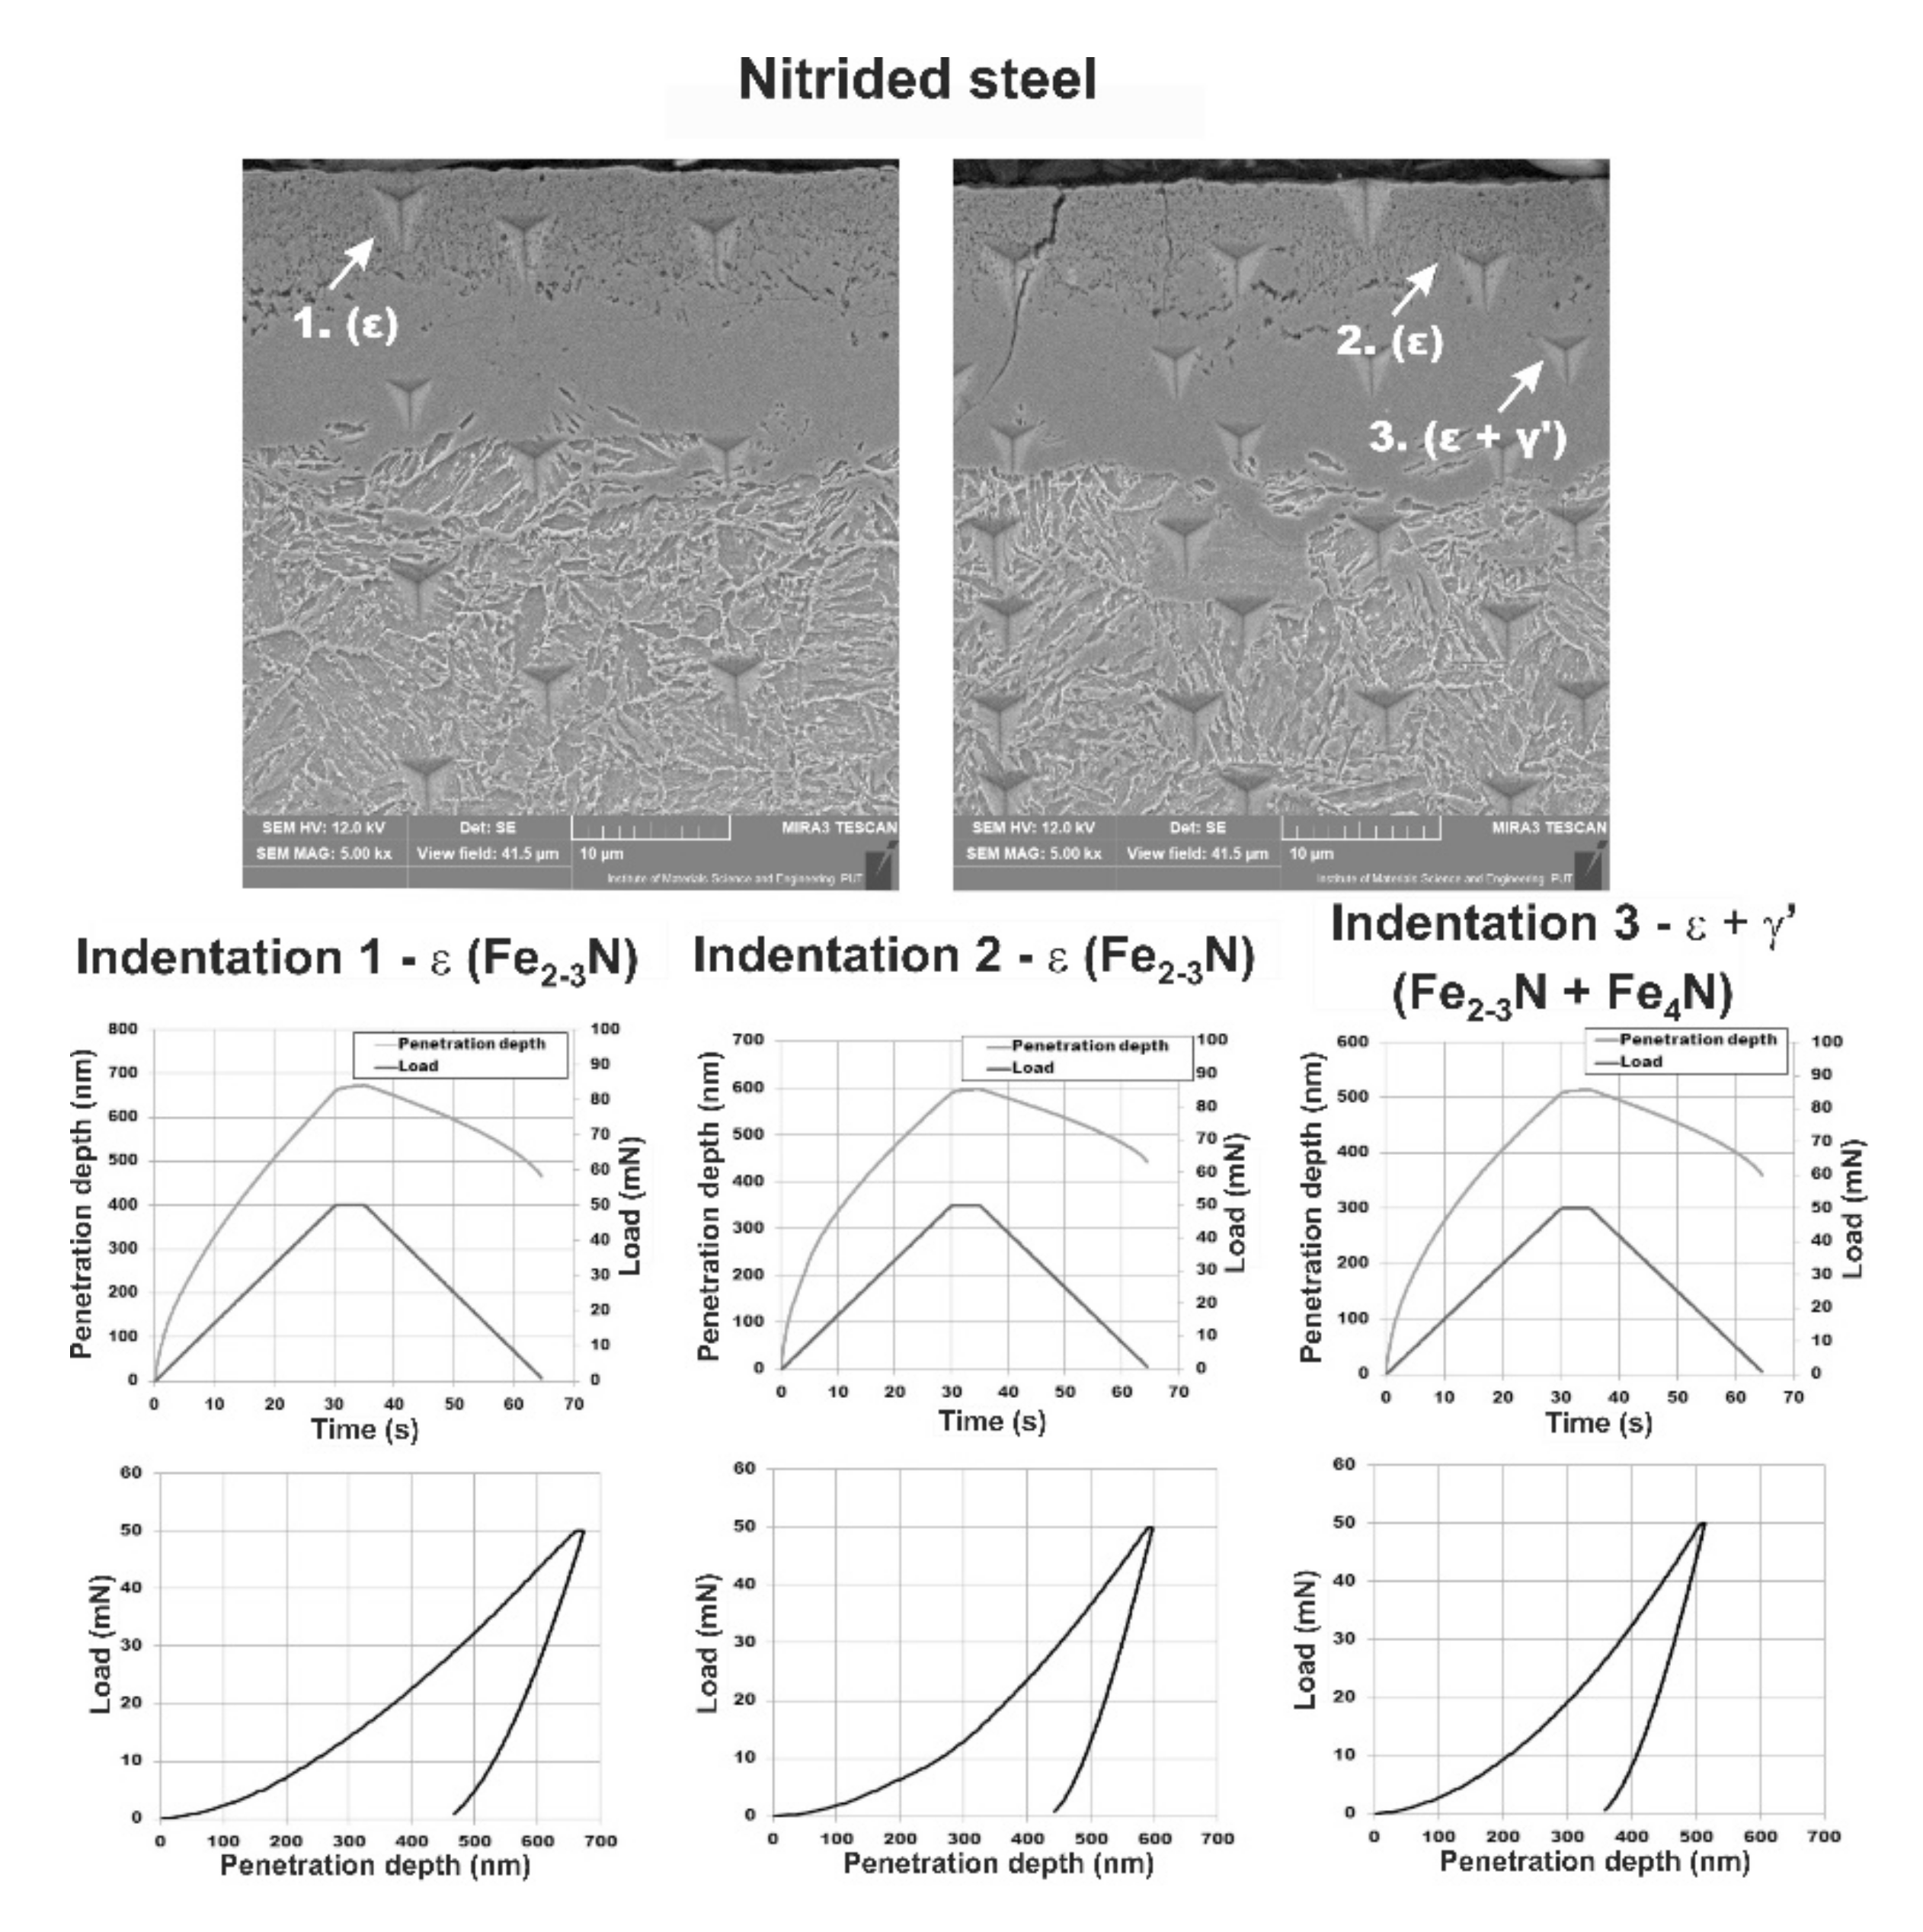
Figure 12 shows the selected indentations performed directly after gas nitriding, before LHT. The indentations 1 and 2 were impressed in the zone with ε iron nitrides. The indentation 3 was performed in ε + γ’ iron nitrides. The SEM images of indentations are visible in the upper part of
Figure 12. The penetration depth and load vs. time of the test, as well as the load vs. penetration depth (load-displacement curves), are also shown for the three analyzed indents. Based on these curves, the indentation hardness (
HIT) and plane-strain modulus
E* were determined. As a consequence, the Vickers hardness
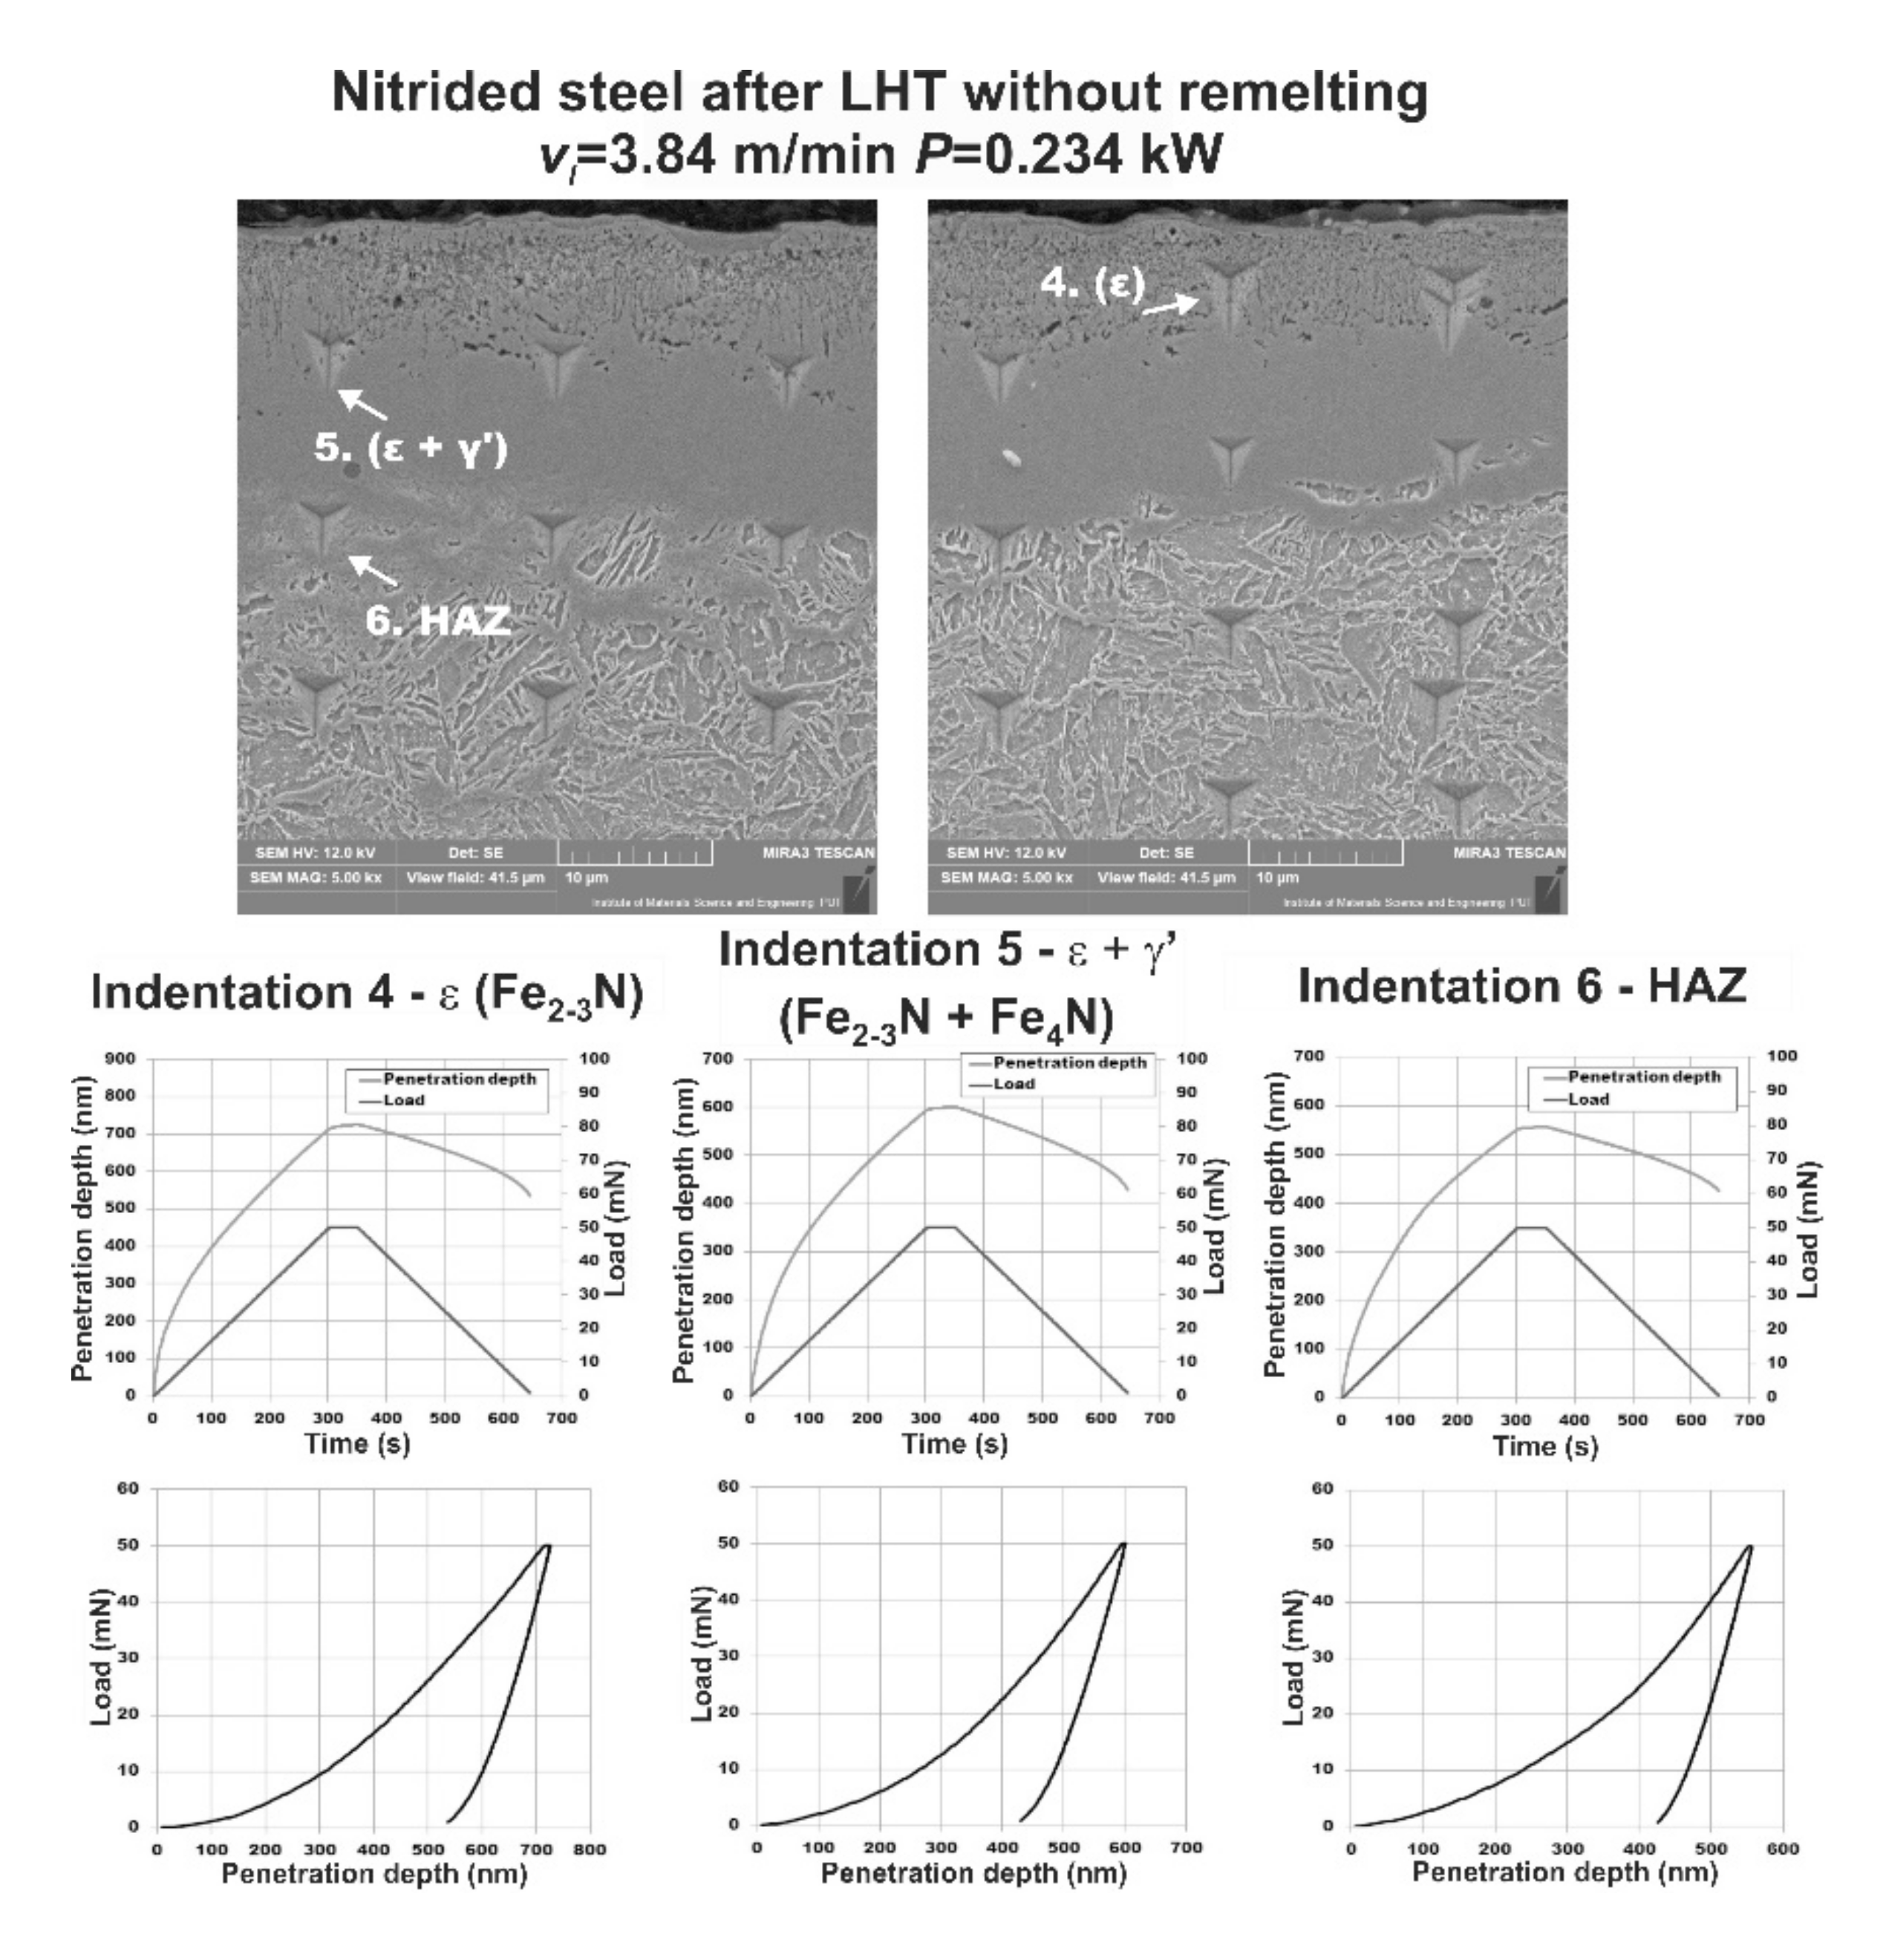
HVIT and indentation modulus could be calculated. The SEM images of indents, obtained in a laser track after LHT without remelting (
P = 0.234 kW and
vl = 3.84 m·min
−1) as well as corresponding curves are shown in
Figure 13. The indentations 4 and 5 corresponded to ε iron nitrides and ε + γ’ mixture of iron nitrides, respectively. The indentation 6 was performed in the HAZ, i.e., in the laser-quenched part of diffusion zone, right below the compound zone. Nitric martensite with γ’ precipitates was characteristic of the microstructure in this zone.
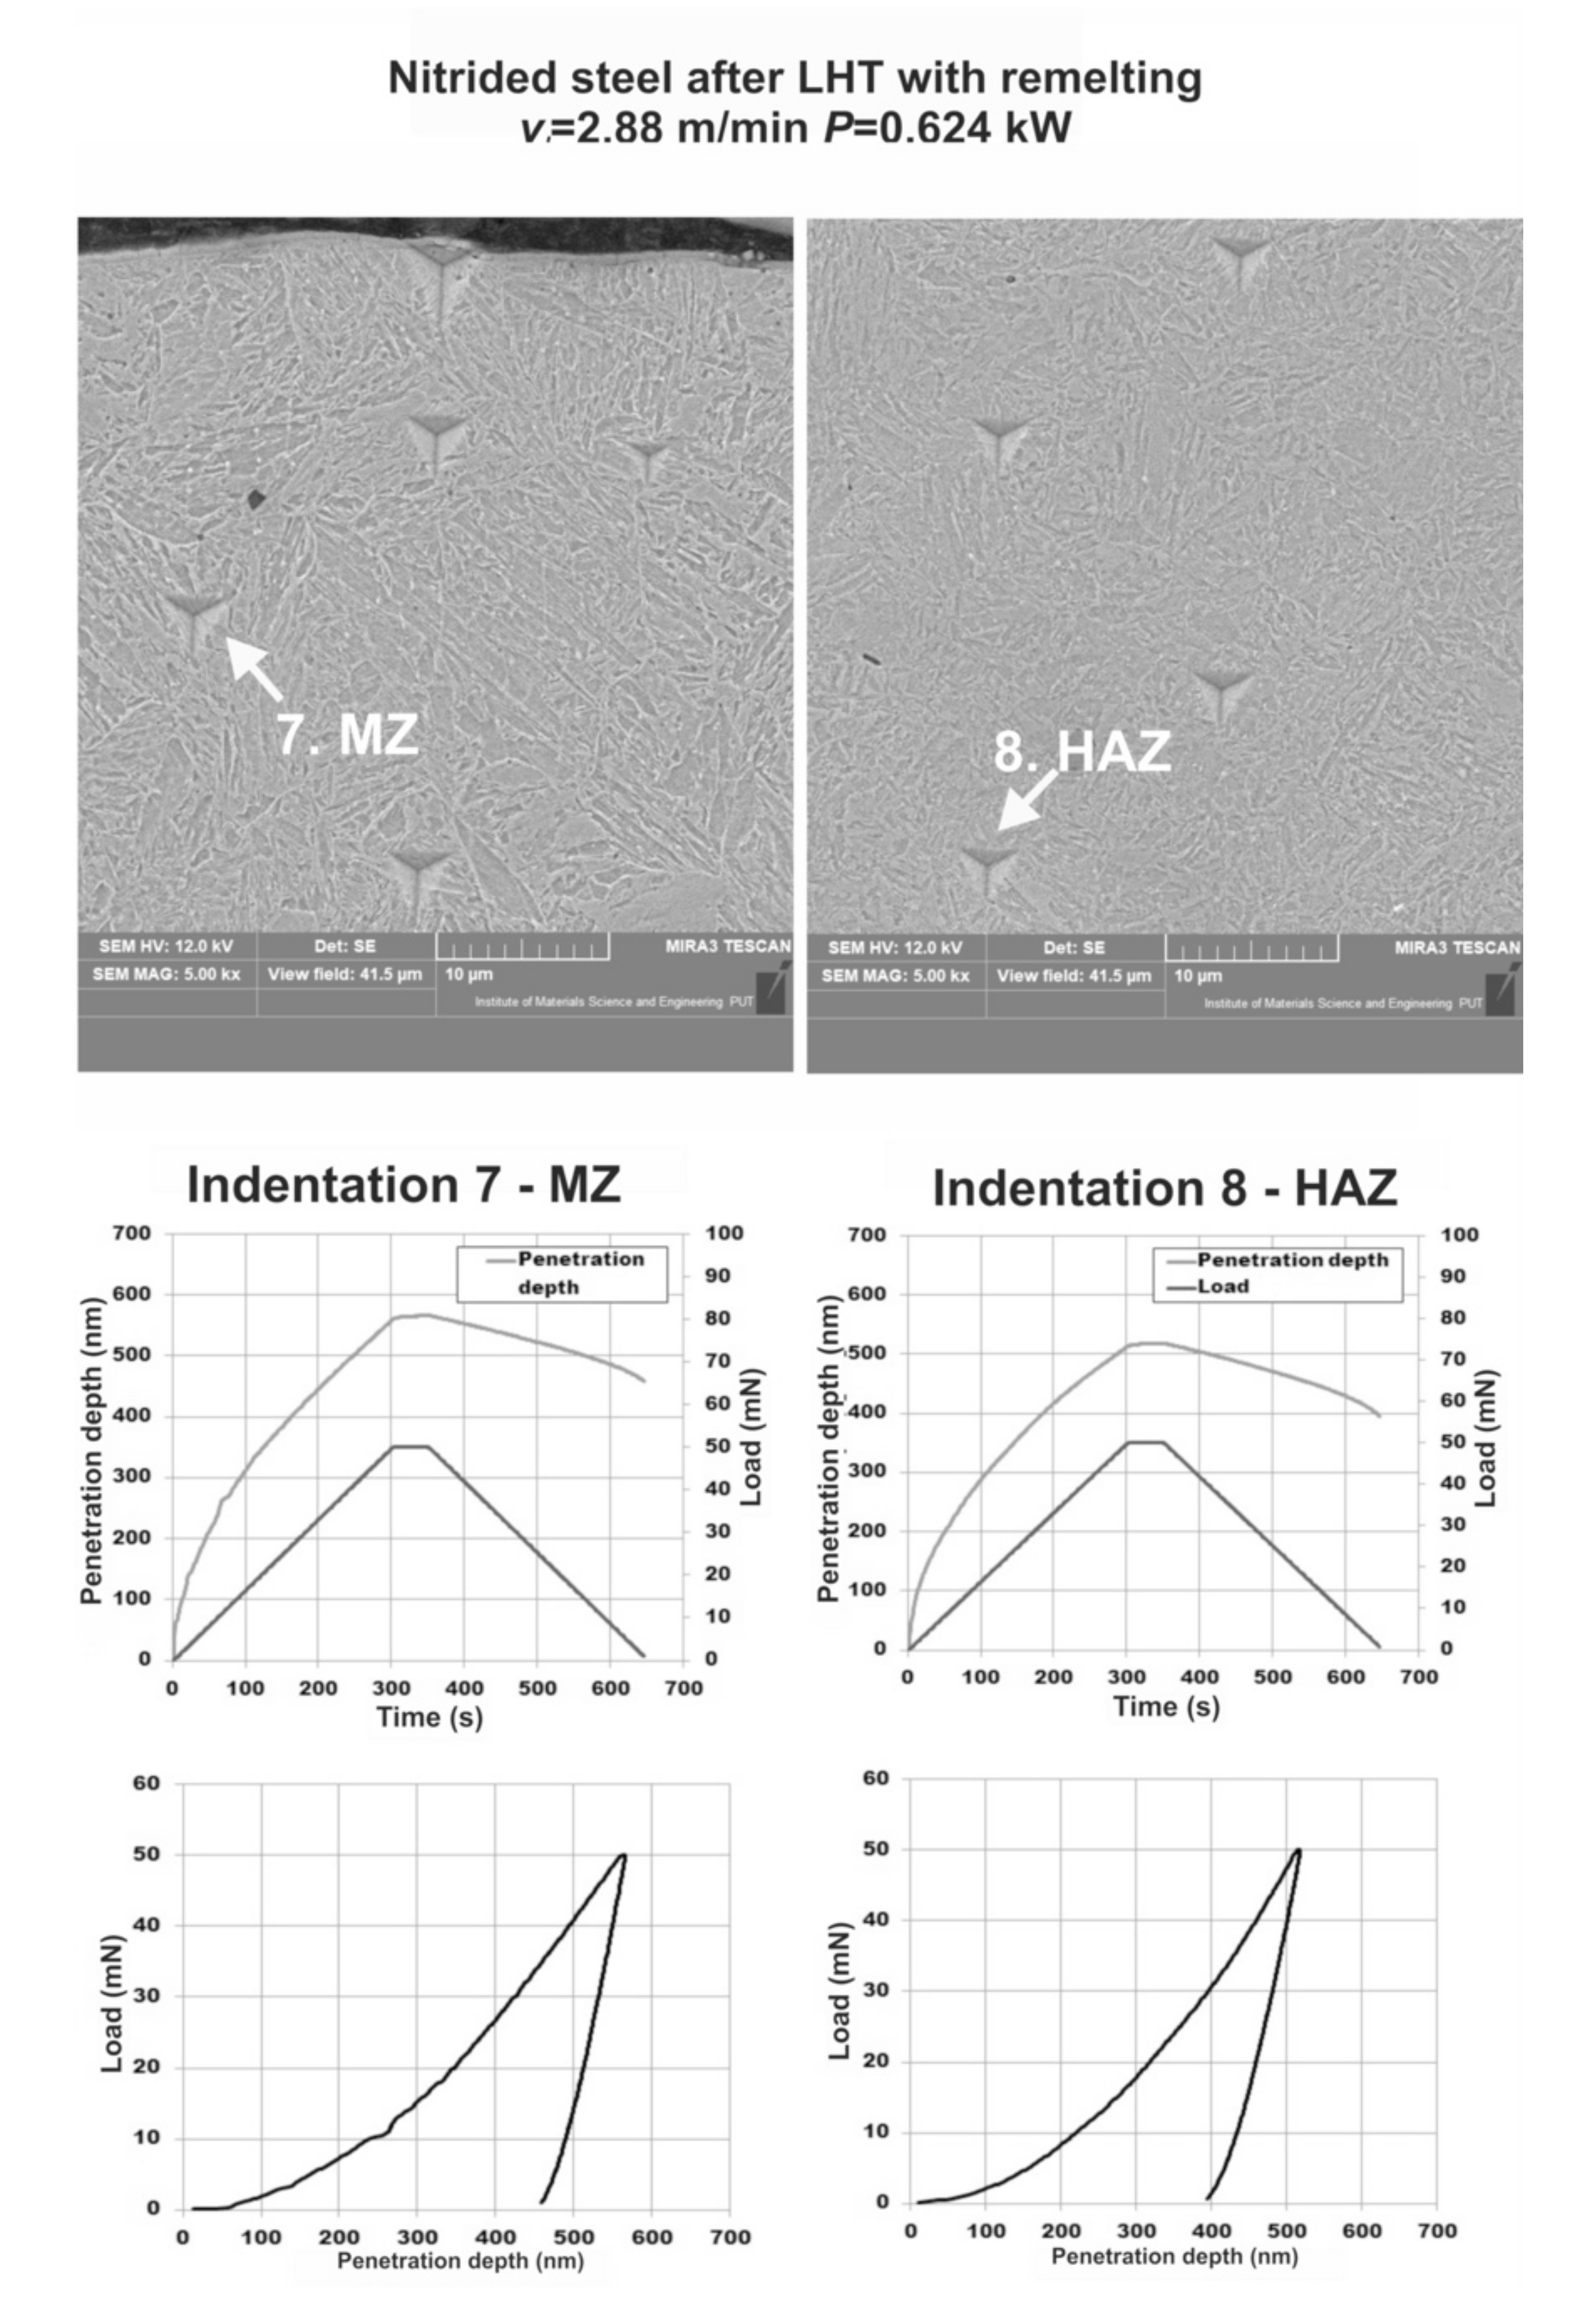
Figure 14 presents the SEM images of selected indents, performed in a laser track after LHT with remelting (
P = 0.624 kW and
vl = 2.88 m·min
−1), as well as the recorded curves (penetration depth and load vs., time of the test or load-displacement curves). The indentations 7 and 8 corresponded to MZ and HAZ, respectively. The elastic-plastic behavior of the investigated phases was confirmed by all the indentation curves obtained. The results of the investigations are listed in
Table 3 for all the indentations selected. The values of Vickers hardness (
HVIT) and indentation modulus (
EIT) are shown for gas-nitrided layer and the same layer subjected to LHT with or without re-melting.
The profiles of Vickers hardness
HVIT and indentation modulus
EIT vs., the distance from the surface in the selected single laser tracks, produced using LHT with and without remelting, are presented in
Figure 15 and
Figure 16, respectively. The results were compared to the profiles of
HVIT and
EIT in the gas-nitrided layer. The measurements of
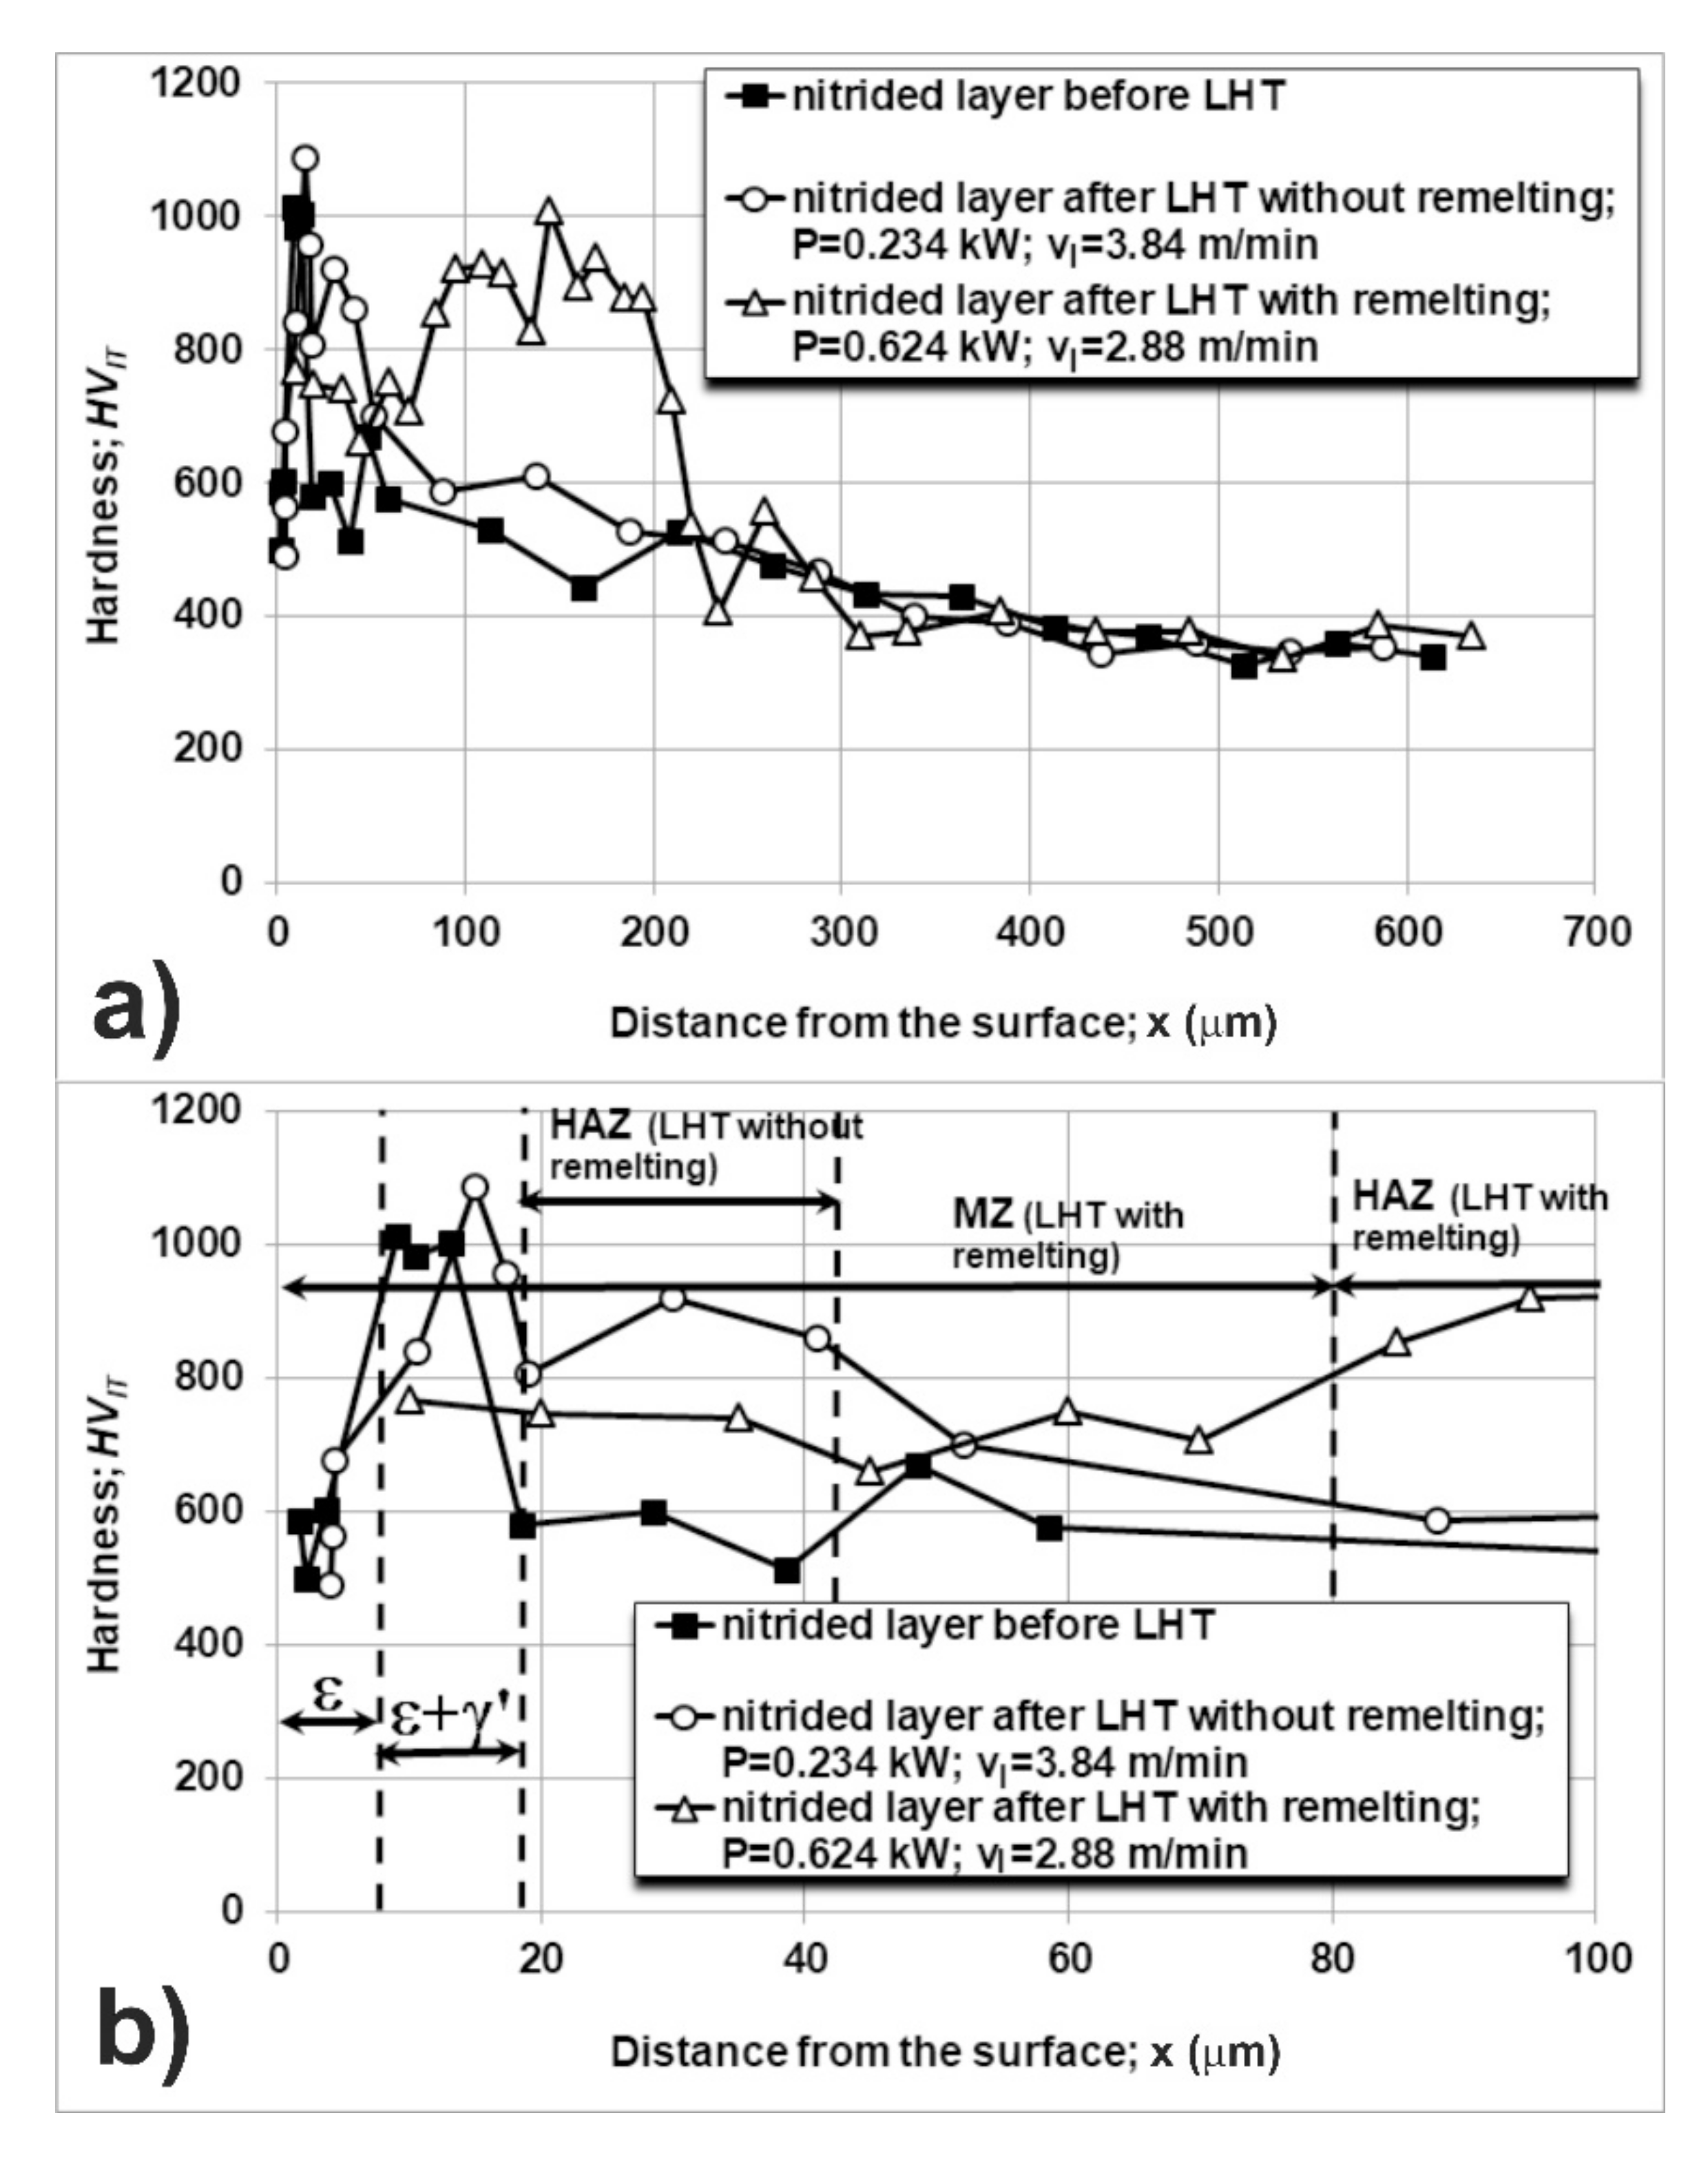
HVIT, performed directly after gas nitriding (
Figure 15a), revealed the differences in hardness between the ε and ε + γ’ zones due to the relatively low load used (50 mN). The details were visible in
Figure 15b, in which the results were shown close to the surface up to a depth of 100 µm.
HVIT values ranged from 500.5 to 602 HV in the outer zone with ε iron nitrides, whereas the ε + γ’ zone was characterized by Vickers hardness
HVIT in the range of 984.5–1013.6 HV. Next, the
HVIT values gradually diminished in the diffusion zone (composed of nitric sorbite with γ’ precipitates) from 580.1 HV directly below the iron nitrides to 382 HV at the end of this zone. The averaging Vickers hardness of the substrate with sorbite was 355.1 HV. The similar
HVIT values (
Figure 15) were obtained in the compound zone after LHT without remelting (
P = 0.234 kW,
vl = 3.84 m·min
−1). In this case, the
HVIT of ε iron nitrides was in the range of 491.3–676.8 HV, and the measurements in ε + γ’ zone ranged from 839 to 1088.5 HV (
Figure 15b). It was characteristic of the single track, produced without remelting, that the maximal values of
HVIT in ε and ε + γ’ zones were higher than those-measured in the gas-nitrided layer. It could indicate an advantageous influence of the LHT without remelting on the microstructure of compound zone. The previous papers [
27,
28] confirmed the diminished porosity of ε iron nitrides in the case of multiple laser tracks (with overlapping of 72%), formed by LHT without remelting. In the HAZ, the Vickers hardness
HVIT obtained the values in the range of 806.8–860.2 HV because of the hardening of this zone by laser quenching. The hardness of this zone was higher than the hardness of the same area of diffusion zone in gas-nitrided layer due to the presence of fine-grained nitric martensite with γ’ precipitates. Below the HAZ (
Figure 15a), the values of
HVIT gradually decreased from 701.3 to 390 HV in the diffusion zone without laser heat treatment. The Vickers hardness of the substrate material was about 350.1 HV. The use of the laser processing parameters (
P = 0.624 kW,
vl = 2.88 m·min
−1), which caused complete remelting of the compound zone, resulted in the Vickers hardness
HVIT in the range of 660.6–765.3 HV in MZ and 826.2–1006.9 HV in HAZ. The
HVIT hardness of MZ was slightly lower in comparison with the typical microhardness measurements at a load of 0.49 N (726.1–841 HV). Whereas the
HVIT values, measured in HAZ, were slightly higher than those-measured at 0.49 N (695–936.5 HV). However, in general, the obtained results were compatible.
The profiles of indentation modulus
EIT vs., the distance from the surface in the selected single laser tracks, produced using LHT with and without remelting, are presented in
Figure 16a for the entire surface layers. The results were compared to the profile of
EIT in the gas-nitrided layer. In general, the significant differences in the values of
EIT were visible only in the case of the compound zone, produced by gas nitriding or by gas nitriding and LHT without remelting. The measurements of
EIT, performed directly after gas nitriding (
Figure 16), revealed the differences in indentation modulus between the ε and ε + γ’ zones. The details were visible in
Figure 16b, in which the results were shown close to the surface up to a depth of 100 µm.
EIT values ranged from 100.7 to 132.9 GPa in the outer zone with ε iron nitrides. Whereas the ε + γ’ zone was characterized by indentation modulus
EIT in the range of 194.5–208.6 GPa. Next, the
EIT values were nearly the same in the diffusion zone (averaging value of 235.7 GPa) as well as the substrate material (averaging value of 247.1 GPa). The similar
EIT values (
Figure 16) were obtained in the compound zone after LHT without remelting (
P = 0.234 kW,
vl = 3.84 m·min
−1). In this case, the indentation modulus
EIT of ε iron nitrides was in the range of 119–142.4 GPa, and the measurements in ε + γ’ zone ranged from 175.9 to 215.8 GPa (
Figure 16b). It was characteristic of the single track, produced without remelting, that the maximal values of
EIT in ε and ε + γ’ zones were higher than those-measured in the gas-nitrided layer. It confirmed an advantageous influence of the LHT without remelting on the microstructure of a compound zone [
27,
28]. In the HAZ, the indentation modulus
EIT obtained the values in the range of 203.8–284 GPa because of the hardening of this zone by laser quenching. The indentation modulus of this zone was higher than the
EIT values of the same area of diffusion zone in gas-nitrided layer due to the presence of fine-grained nitric martensite. Below the HAZ (
Figure 16a), the values of
EIT were in the range of 233.4–271.8 GPa in the diffusion zone without laser heat treatment. The averaging indentation modulus of the substrate material was equal to 244.7 GPa. The use of the LHT with remelting (
P = 0.624 kW,
vl = 2.88 m·min
−1), resulted in the indentation modulus
EIT in the range of 226–246.2 GPa in MZ and 218.7–250.9 GPa in HAZ. The averaging
EIT values in diffusion zone and in the substrate material were equal to 241.6 and 255.2 GPa, respectively.
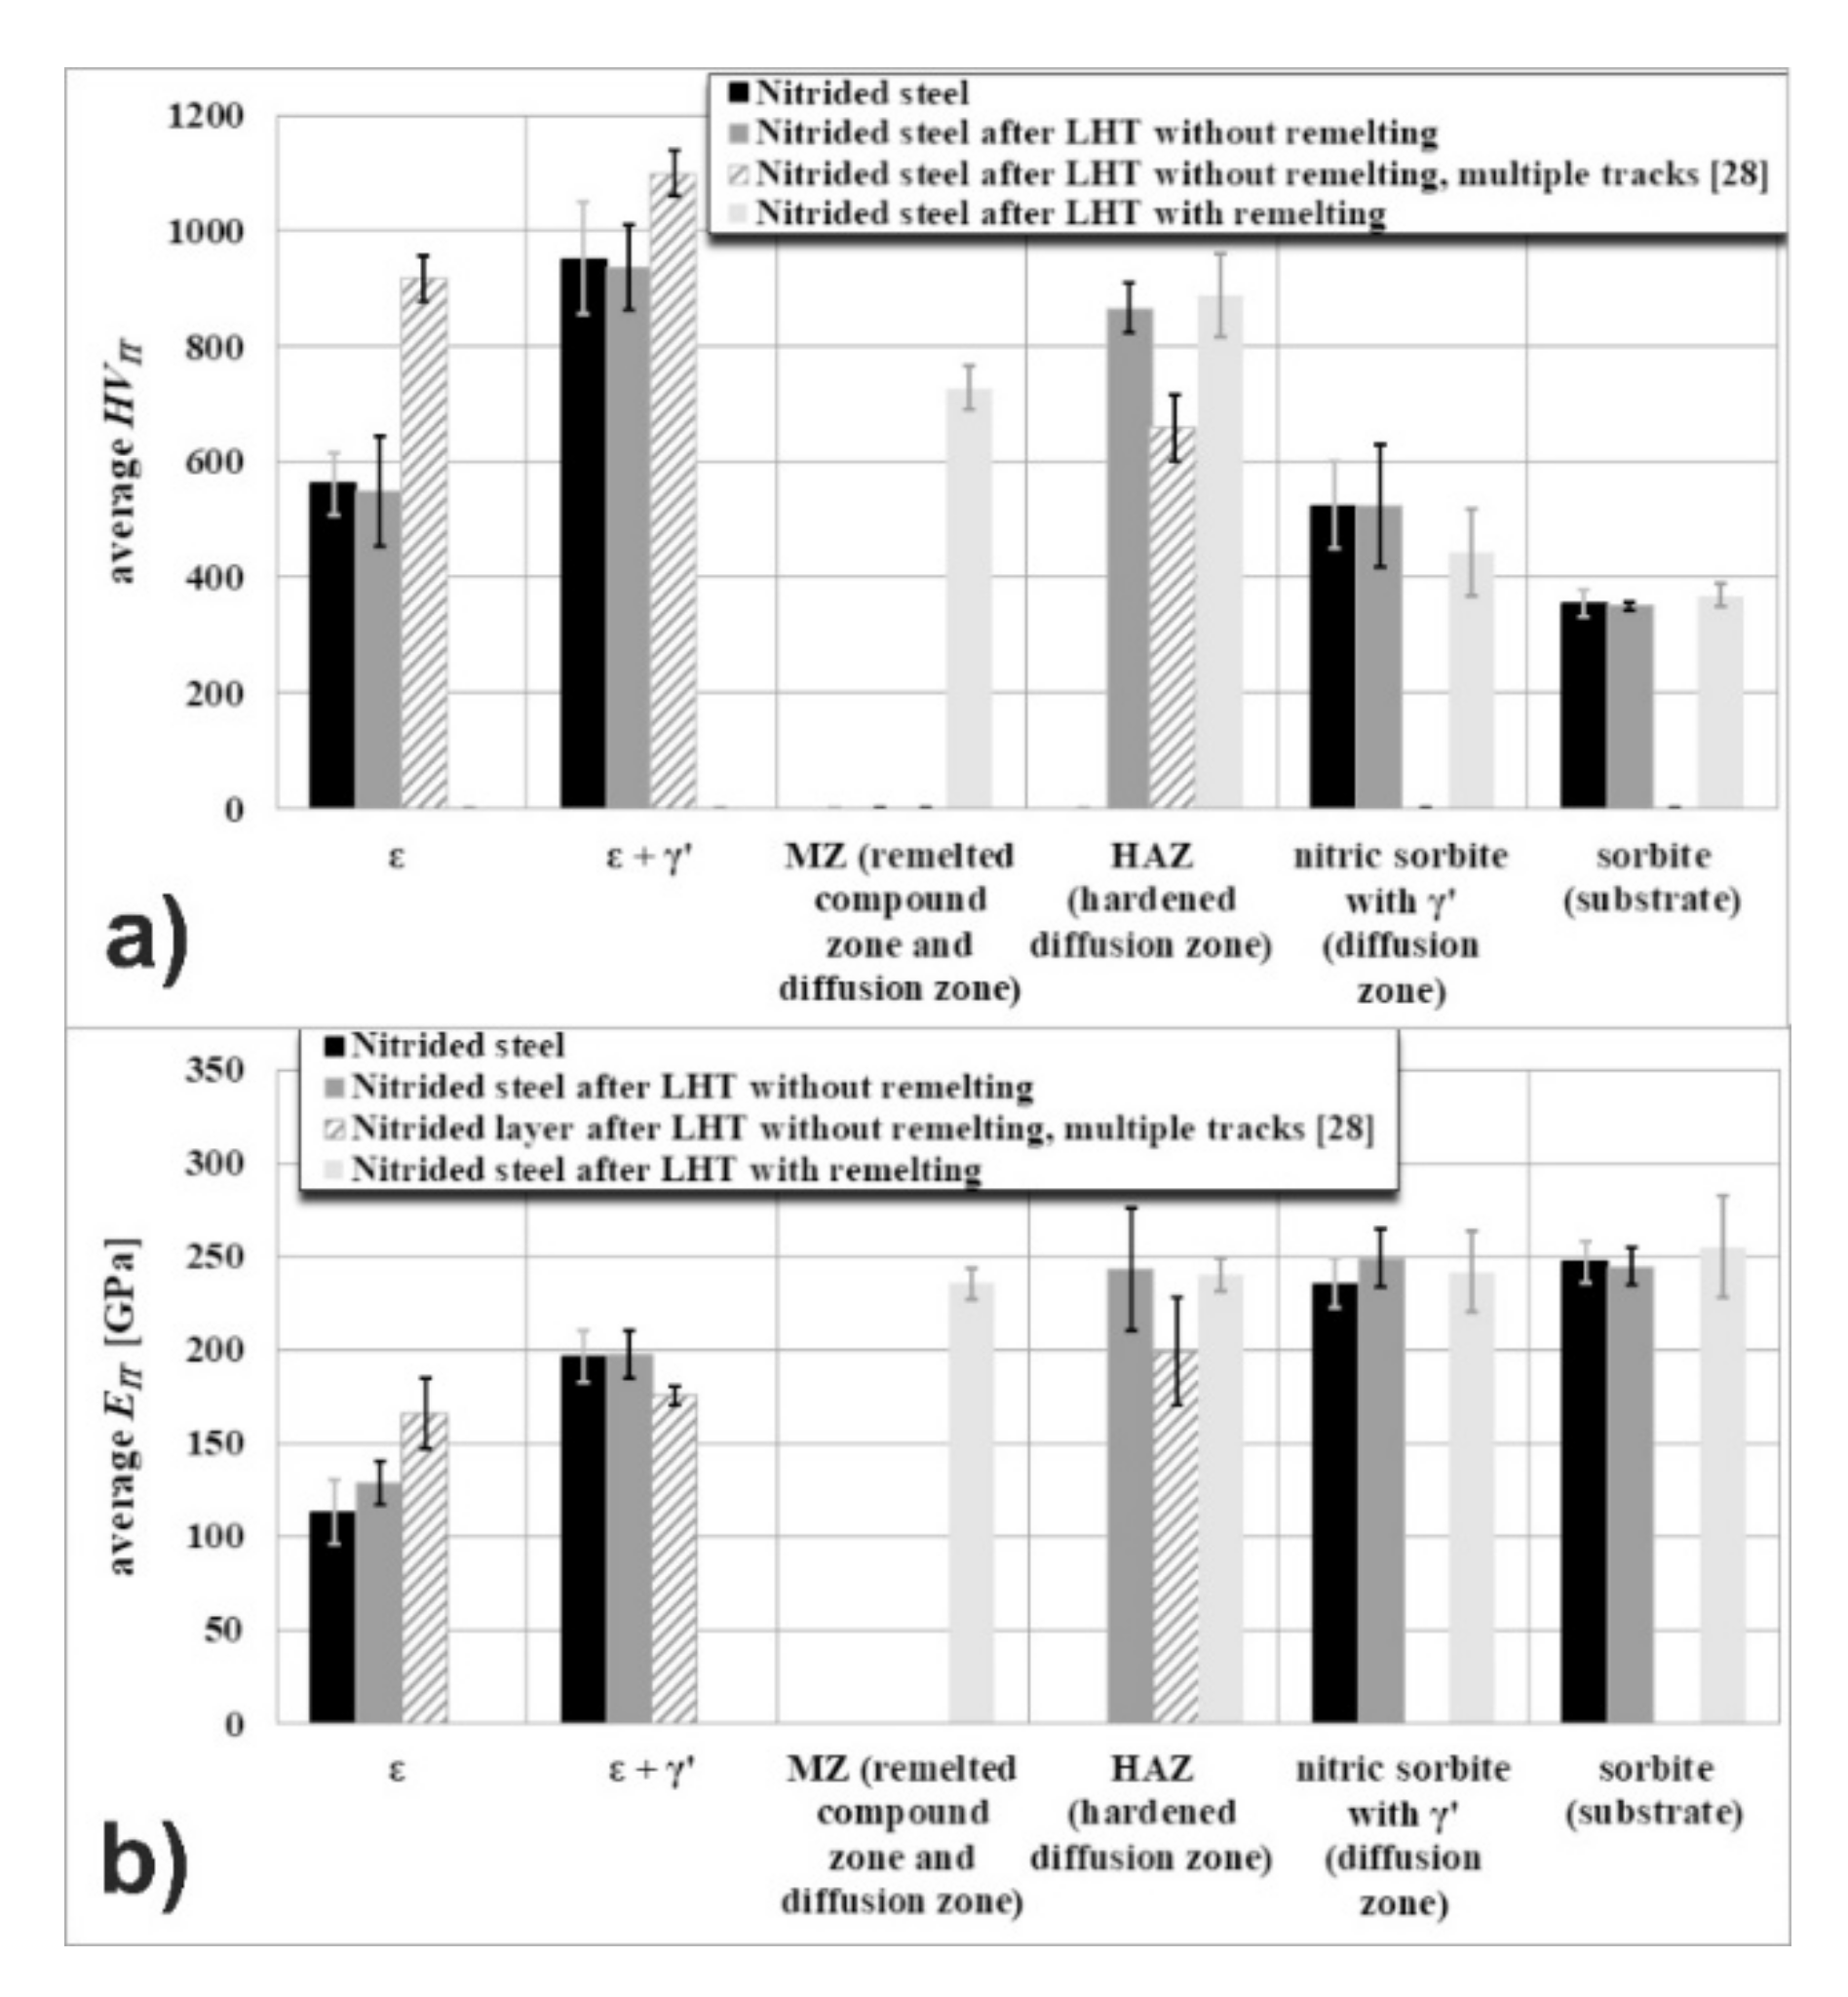
The averaging values of the Vickers hardness
HVIT and indentation modulus
EIT, measured in the different zones of gas-nitrided and laser-modified nitrided layers, are listed in
Table 4 and shown in
Figure 17 with the standard deviations. The results of the present study were compared to the values of
HVIT and
EIT, obtained after LHT of gas-nitrided layer without remelting in the case of multiple laser tracks’ formation with the overlapping of 72% [
28].
This study provided the new experimental data related to the indentation moduli (
EIT) and Vickers hardness (
HVIT) of ε-Fe
2-3N iron nitride (
Table 4). This phase was observed close to the surface in the compound zone after gas nitriding as well as after nitriding followed by laser heat treatment without re-melting using
P = 0.234 kW and
vl = 3.84 m·min
−1. The controlled gas nitriding resulted in the formation of ε phase, which was characterized by average indentation modulus
EIT of 113.60 ± 17 GPa and average Vickers hardness
HVIT of 562.44 ± 54 (corresponding to indentation hardness
HIT = 6.07 ± 0.6 GPa). These values were slightly lower than those-measured previously (
EIT = 123.30 ± 20 GPa and
HIT = 7.38 ± 0.9 GPa) [
28]. It could result from the differences in chemical composition of ε-Fe
2-3N phase (e.g., nitrogen concentration) as well as from the more defected microstructure of this zone produced this time. Taking into account the data of other authors, the measured hardness corresponded rather to the value reported by Weber et al. [
49] than to the paper [
46], and Young’s modulus was significantly lower than that measured from ε-Fe
3N
1−x phase (
EIT = 203 GPa), prepared by a reaction of iron powder in flowing NH
3 at 520 °C [
46]. Probably, the less porosity of ε phase was the reason for the significantly higher
EIT value measured [
46].
It seemed that LHT without remelting advantageously influenced the indentation modulus of ε iron nitrides. The average
EIT value increased up to 129.15 ± 12 GPa (
Table 4), whereas LHT without remelting did not influence the Vickers hardness.
HVIT obtained 549.03 ± 95 on average (i.e.,
HIT = 5.93 ± 1.0 GPa). The previous measurements in ε phase, subjected to LHT without remelting, were carried out in the multiple laser tracks [
28]. The laser action on this phase was multiplied because of the high overlapping of laser tracks. Hence, the average indentation modulus
EIT and indentation hardness
HIT strongly increased up to 165.72 ± 19 GPa and 9.90 ± 0.5 GPa, respectively [
28]. The diminished porosity and more compact microstructure (as a consequence of LHT) were the probable reasons for such a situation. In case of single laser track, the laser action on the compound zone was not so strong due to the irradiance profile across the laser beam diameter during LHT using the TEM
01* mode of laser beam [
50].
The Vickers hardness and indentation moduli were also measured in the mixture of iron nitrides ε + γ’ (Fe
2-3N + Fe
4N), occurring below ε zone (
Table 4). The average values were determined for this zone directly after gas nitriding as well as after nitriding followed by LHT without remelting. The calculated mean values of
EIT (197.99 ± 13 GPa) and
HVIT (936.44 ± 75, corresponding to
HIT = 10.11 ± 0.8 GPa) after gas nitriding and LHT without remelting were comparable to the values characteristic of only nitrided steel (
EIT = 196.92 ± 14 GPa and
HVIT = 951.51 ± 97, corresponding to HIT = 10.28 ± 1.1 GPa). In the case of producing the multiple laser tracks without visible effects of remelting [
28], the averaging indentation modulus of ε + γ’ iron nitrides was lower (
EIT = 175.27 ± 4.8 GPa), and averaging indentation hardness was higher (
HIT = 11.87 ± 0.4 GPa) than the values obtained in the present study. However, there was also difficulty to confirm the essential influence of the LHT without remelting on the mechanical properties of ε + γ’ zone in the case of the formation of multiple laser tracks [
28]. Taking into account that the determined indentation moduli in ε + γ’ zone were even higher than the measured (157 GPa) [
37] or calculated (in the range of 161.5–197 GPa) [
37,
38,
39,
40,
41,
51] values by other authors in γ’ phase, it could indicate the significant percentage of γ’ iron nitrides in this region. Hence, the porosity of ε + γ’ zone, produced by gas nitriding in the present study, had to be relatively small.
The averaging measured values of indentation modulus and Vickers hardness in HAZ (
Table 4) were nearly the same in the case of both LHT without remelting (
EIT = 242.92 ± 33 GPa,
HVIT = 866.53 ± 42) and LHT with remelting (
EIT = 240.61 ± 9.0 GPa,
HVIT = 887.27 ± 72). Simultaneously, the obtained values in the case of producing the multiple laser tracks [
28] were lower (
EIT = 199.06 ± 29 GPa,
HVIT = 658.55 ± 57). It could result from the worse conditions of heat removal and the lower cooling rate in this zone during formation of multiple laser tracks. The averaging nanomechanical properties of MZ (
Table 4) in single laser track (
EIT = 235.56 ± 8.5 GPa,
HVIT = 727.87 ± 38) were diminished in comparison with those measured in HAZ. The presence of coarse-grained nitric martensite and worse condition of heat removal (lower cooling rate) in MZ could be the reason for such a situation.
The averaging nanomechanical properties were also determined in diffusion zone, consisting of nitric sorbite with γ’ precipitates (
Table 4). In the case of indentation modulus
EIT, the calculations of averaging values in this zone seemed to be justified because of the approximately constant values, measured vs., the distance from the surface. The averaging
EIT values of the diffusion zone in gas-nitrided layer, gas-nitrided layer after LHT without remelting, and gas-nitrided layer after LHT with remelting were similar and equal to 235.66 ± 13, 249.12 ± 15, and 241.64 ± 22 GPa, respectively. The calculations of averaging Vickers hardness in the diffusion zone could not be fully accepted due to the gradual decrease in
HVIT values towards the core of steel. As a consequence of the LHT, a part of the diffusion zone was laser-quenched, and the area of appearing this zone was reduced. It was visible, especially in the layer, which was laser heat-treated with remelting. In this case, the HAZ was very large and the diffusion zone was reduced the most. As a consequence, the averaging Vickers hardness of the rest part of diffusion zone was relatively low (
HVIT = 443.85 ± 76). The differences in the diffusion zone thickness were smaller for the gas-nitrided layer and gas-nitrided layer subjected to LHT without remelting. Therefore, the obtained averaging values of Vickers hardness were similar (525.43 ± 77 and 523.86 ± 106, respectively). Obviously, the averaging nanomechanical properties of the steel substrate with nitric sorbite were similar, irrespective of the surface treatment (
Table 4). The mean values of
EIT ranged from 244.70 ± 10 GPa measured below the nitrided layer after LHT without remelting and 247.06 ± 11 GPa measured below the gas-nitrided layer to 255.24 ± 27 GPa measured below the nitrided layer after LHT with remelting. The average values of
HVIT were equal to 350.13 ± 6.3, 355.09 ± 23, and 368.67 ± 20, respectively.

 ,
, 


