Article

The Analysis of Resistance to Brittle Cracking of Tungsten Doped TiB2 Coatings Obtained by Magnetron Sputtering

Łukasiewicz Research Networks–Institute for Sustainable Technology, 6/10 Pułaskiego St., 26-600 Radom, Poland
*
Author to whom correspondence should be addressed.
Coatings 2020, 10(9), 807; https://doi.org/10.3390/coatings10090807
Submission received: 27 July 2020 / Revised: 12 August 2020 / Accepted: 19 August 2020 / Published: 20 August 2020

Abstract

:
In this work, the authors present the possibility of characterization of the fracture toughness in mode I (KIC) for TiB2 and TiB2 coatings doped with different concentration of W (3%, 6% and 10%). The Young’s modulus, hardness and fracture toughness of this coatings are extracted from nanoindentation experiments. The fracture toughness was evaluated using calculation of crack length measurement. An important observation is that increasing tungsten concentration in the range 0–10% changes the microstructure of the investigated coatings: from columnar structure for TiB2 coating to nano-composite structure for Ti-B-W (10%) coating. It can be concluded that doping with concentration 10 at.% W causes an increase of the fracture toughness for the tested coatings.

1. Introduction

Brittle cracking resistance is one of the most important material features. The fracture toughness in mode I (KIC) is the parameter considered to be a material constant, which determined the material’s resistance to brittle cracking. It is independent of the thickness of the material being tested because it refers to a constant state of stress. This makes it possible to assess how much load a structural element containing a crack can carry. The method for determining the KIC factor, which is currently the basic material constant in fracture mechanics, is standardized for solid materials [1,2] and consists of analyzing the process of cracking samples with a properly prepared notch in the three-point bending test. The use of the penetration method to study the fracture toughness KIC was initiated in the 1970s by the Evans and Charles, who observed the relation between the crack lengths, which was generated in the corners of Vickers indenter during the hardness test and the value of KIC [3]. This made it possible to use the microindentation and nanoindentation methods for the mechanical characterization of micro-volume systems, including layers and coatings.
The mechanical characteristics of thin coatings are of great importance in the processes of optimization and development of material solutions for coatings with high tribological efficiency. For mechanical characterization of thin coatings, including determination of their hardness (H), Young’s modulus (E) and fracture toughness as the KIC coefficient, nanoindentation has proved to be a very effective technique. Hardness and Young’s modulus are determined on the basis of load and displacement curves, while the KIC coefficient can be estimated based on the crack lengths initiated by the indenter.
It should be remembered that, in the case of thin coatings, the results of the brittleness index tests obtained by the nanoindentation method cannot be verified by the impact method, as it is possible for solid materials. Therefore, in the case of solid materials, we can more precisely select the model and range of indenter loads in nanoindentation tests to determine the brittleness of specific materials, e.g., SiC [4], glass, and Al2O3 [5]. In the case of thin coatings, we additionally encounter a very large number of material combinations, i.e., chemical composition, phase structure, state of internal stresses resulting from, e.g., the type of substrate or the method of coating deposition. Therefore, it seems very difficult to indicate one model for the determination of the KIC coefficient for all coatings in the current state of knowledge. It has been shown that methods using the nanoindentation method and crack length analysis to determine the brittleness of materials lead to comparable results [6]. This can be a good tool for comparing the brittleness of materials. Importantly, in the case of thin coatings, it is currently difficult to find another method that has as much potential and capabilities in determining the fracture toughness of thin coatings as the nanoindentation method.
The literature analyses show different models for determining the KIC coefficient of thin coatings [7,8], of which two are most often used, as proposed by Anstis’s [9] and Laugier [10].
The aim of the research, the results of which are presented in this article, was to propose a method for determining the KIC coefficient of thin PVD coatings using the nanoindentation method. In the article, the Laugier model was used to analyze changes in fracture toughness (KIC) for TiB2 ceramic coatings doped with tungsten. The coatings were produced by magnetron sputtering in a Direct Current (DC) system. The problem to be solved was the methodology of selecting loads for the Berkovich indenter in the indentation process and the methodology of measuring the crack lengths generated in the coating.

2. Materials and Methods

2.1. Coating Deposition

Tungsten doped TiB2 coatings were prepared by DC magnetron sputtering method using original magnetron systems made by Łukasiewicz Research Network-Institute for Sustainable Technology in Radom (Ł-ITeE Radom) with a Balzers pump system (Radom, Poland) with two circular magnetrons placed at an angle of 120° to each other. In the deposition process was using two targets made of TiB2 (99.50% purity) and pure-W (99.95% purity) according the procedure present in paper [11]. The diameter of targets was d = 100 mm and thickness g = 7 mm. The TiB2 and Ti-B-W coatings were deposited in an atmosphere of pure argon (Ar 100%). The parameters of the Ti-B-W coating process are shown in Table 1.
The tested coatings were deposited on to samples made of high-speed steels SW7M with a diameter of 25 mm, thickness 6 mm and surface roughness Ra ≤ 0.05 μm and on samples of monocrystalline Si (100). The samples were washed with 99.9% pure alcohol before being placed in the process chamber. Before the coating process, the samples were ion-etched in the Ar + plasma. During the coating process, the sample temperature was stabilized at 300 °C using resistance heaters. The Ti-B-W coatings were deposited by changes of the source power in the range 25–75 W. The deposition time for each coating was 1 h. The scheme and view of the magnetron system that we used are shown in Figure 1a–c.

2.2. Coating Characterization

Samples of monocrystalline Si (100) were used for chemical composition analysis by Wavelength-Dispersive X-Ray Spectroscopy–WDS (Nova NanoSEM 450 with WDS IbeX, Thermo Fisher Scientific, Waltham, MA, USA) localized in AGH (Kraków, Poland). The coatings thickness of brittle fracture cross-section measurements was performed using SEM-Hitachi TM3000 scanning electron microscopy (Radom, Poland).
Samples of SW7M steel with the deposited coatings were subjected to hardness and Young’s modulus testing using the Nanoindentation Tester NHT manufactured by Anton Paar with Berkovich diamond indenter (Anton Paar, Ł-ITeE Radom, Poland). For each of the tested coatings, 20 indentations were made in the regime of a contact-depth. The contact-depth of the indenter does not exceed 10% of the coating thickness. The correct indentations were selected and the average hardness values—H and Young’s modulus—E, were calculated based on the results obtained, as well as the corresponding standard deviations. The measurement results made it possible to determine the H/E—as the plasticity index or load factor which is responsible for the maximum elastic deflection, when the coating is not destroyed and the H3/E2—as a resistance to plastic deformation, which determines the load capacity of the coating.
The surface roughness for all tested coatings were measured by Hommel Tester T1000 produced by JENOPTIK (Ł-ITeE Radom, Poland) by contact method. The mean values of Ra, Rz and Rt parameters were calculated.

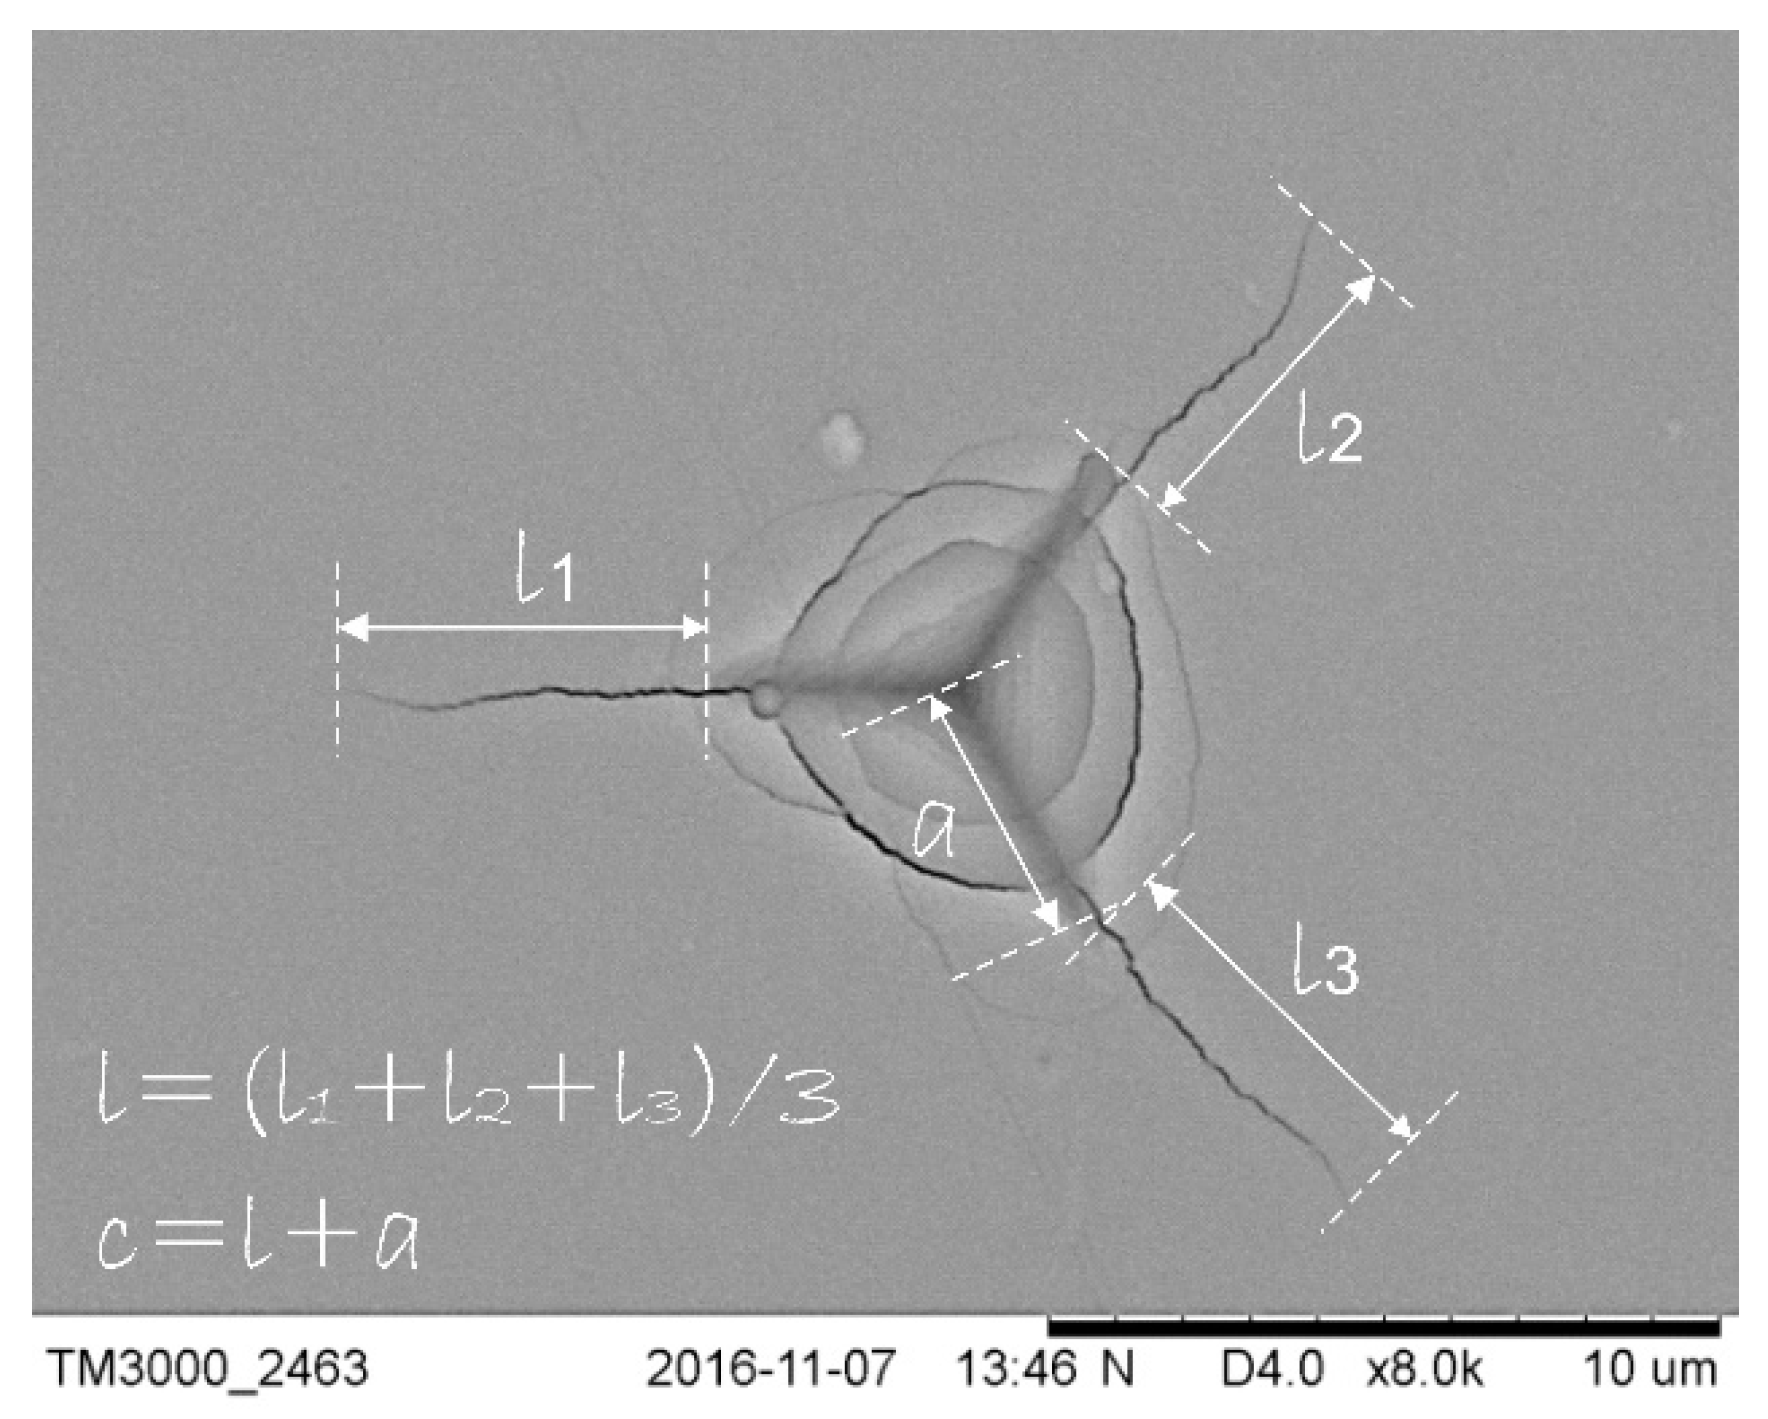
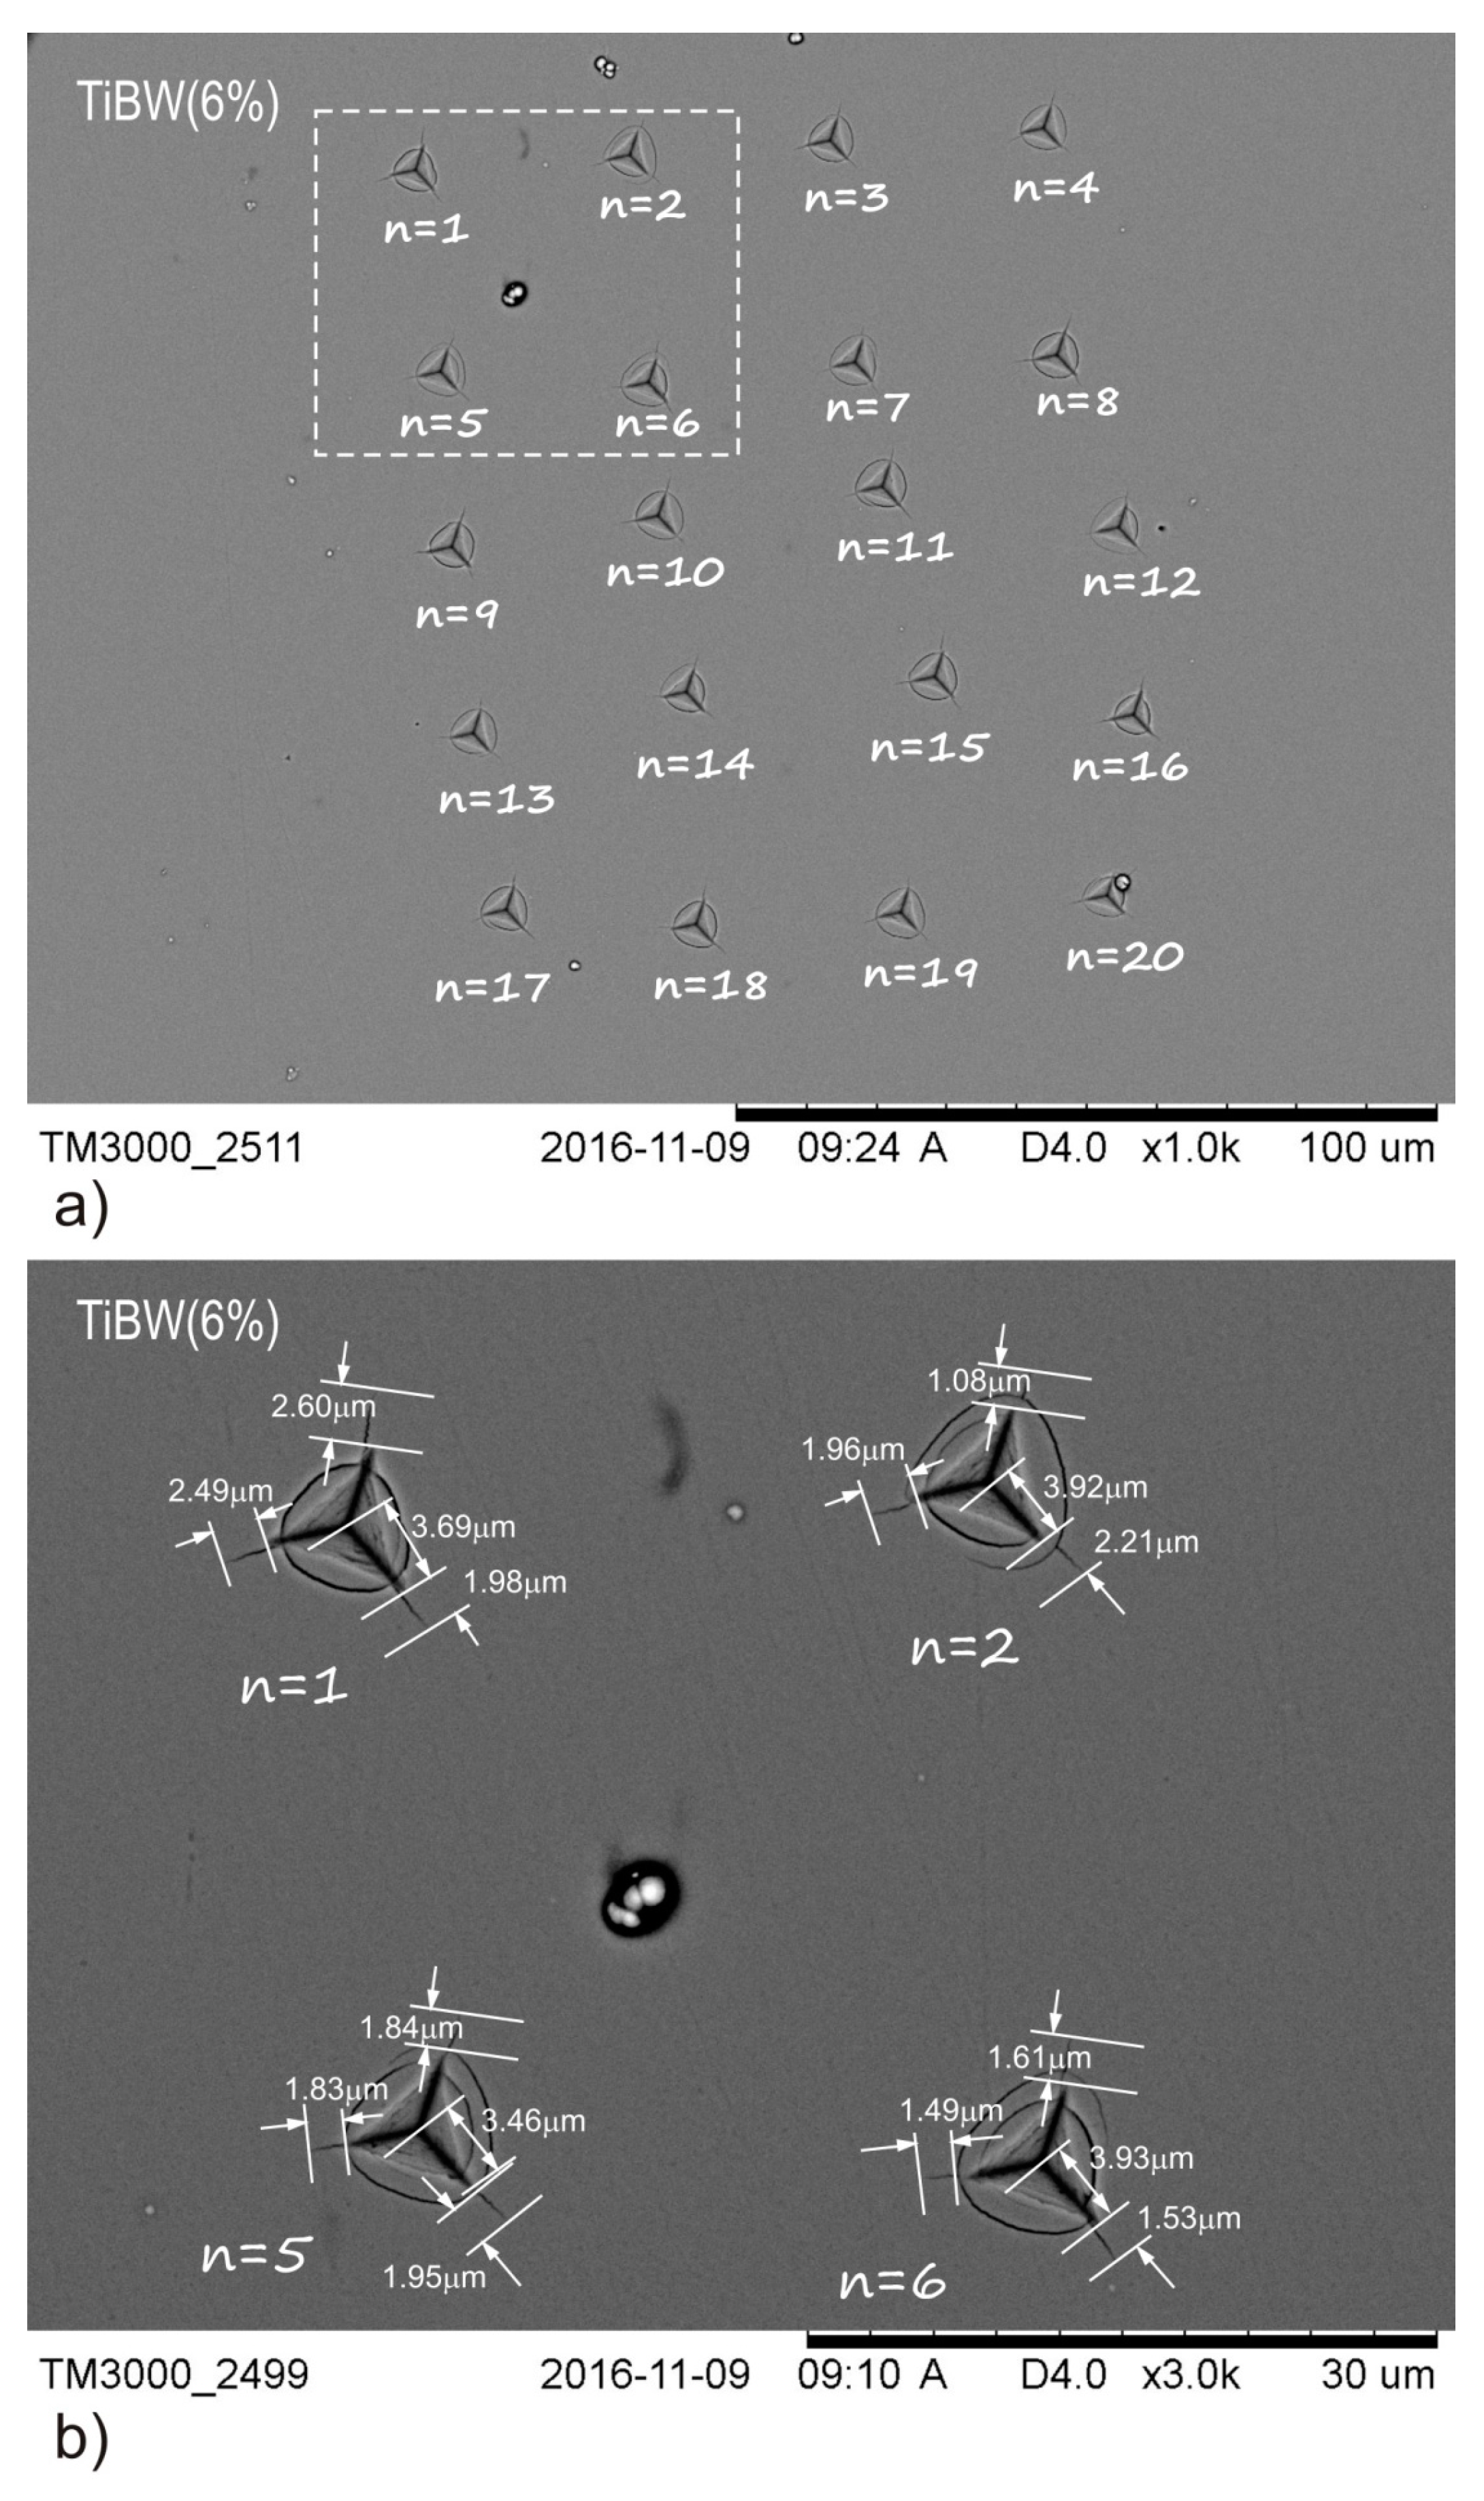
2.3. Berkovich Indentation Fracture Toughness Test

SW7M steel samples were also used to study the resistance of brittle cracking using the nanohardness tester CSM with Berkovich diamond indenter. The analysis was carried out in two steps. In the first step, indenter load was selected, when radial cracks were generated in the tested TiB2 and Ti-B-W coatings. For this purpose, 5 indentations were made for each of the tested coatings at different values of the intender normal force, i.e., 50, 100, 200, 300 and 400 mN. The indenter load, for which generated cracks were measurable, was selected for each coating. In the second step, 20 indentations were made for each coating. For each indentation, individual crack length measurements, i.e., (an) and (ln) were made according to the scheme shown in Figure 2. For each coating, based on a group of 20 indentations, the mean values a and l were determined. Then, according to the Laugier model formula (Equation (1)) [10,12], the value of the fracture toughness KIC was determined. Observation and crack lengths measurement in the area of the indentations were carried out using SEM Hitachi TM3000 scanning electron microscopy.
K IC = x v · ( a l ) 1 2 · ( E H ) 2 3 · P c 3 2
where: KIC—fracture toughness; xv–indenter geometry factor (for Laugier Equation xv = 0.016); E—Young modulus of coating (GPa); H—hardness of coating (GPa); P–the indentation load (mN); a—the length from the center of the indent to the corner of the indent (μm); l1,2,3—the length of the cracks; l = (l1 + l2 + l3)/3; c = l + a—the total length from the center of the indent to the end of crack.

3. Results

3.1. Coating Characterization

The pure TiB2 coatings and Ti-B-W coatings doped with tungsten were analyzed after the deposition processes, obtained by the DC magnetron sputtering method, according the parameters presented in Table 1. First, the surface observations and coating thickness measurements were made using the scanning electron microscopy (SEM-Hitachi TM3000) and the surface roughness tests with using the Roughness Hommel Tester. The results of these measurements were necessary to the fracture toughness test, which was planned in the next step. Figure 3 shows the results of surface and cross-sections observations for the tested TiB2 and Ti-B-W coatings. All tested coatings are characterized by high surface smoothness and good coherence, which are free of cracks and defects. The thickness of all investigated coatings was in the range 1.2–1.3 µm.
The prepared coatings were subjected to chemical composition analysis using the WDS method. The obtained results (Table 2) showed that the tungsten concentration doped into the TiB2 coating increased with increasing tungsten power and it is range 3%–10%. The Ti/B or B/(Ti+W) ratios were determined adequately in the TiB2 and Ti-B-W coatings.
The hardness and Young’s modulus measurements were carried out without exceeding the depth of 10% of the coating thickness, i.e., max 100 nm. Examples of changes in the force acting on the Berkovich indenter in the case of testing the hardness and Young’s modulus of the TiB2 coating and the view of the indentation. Based on the obtained results, the plasticity index as H/E and the resistance to plastic deformation as H3/E2 of investigated coatings were determined. All parameters of the investigated TiB2 and Ti-B-W coatings are shown in Table 3.

3.2. Determination of the Fracture Toughness KIC

For measured the sizes of the crack lengths emerging from their corners after indentation with different forces 50, 100, 200, 300 and 400 mN, all the generated cracks were imaged using a scanning electron microscopy (SEM-Hitachi TM3000). The images of indentations for different types of coatings are shown in Figure 4. Observations for the indentations made with the different loads showed, that the cracks for coatings such as TiB2, Ti-B-W (3%), Ti-B-W (6%), which were generated in the corners of the indentation, were clearly visible and well measurable already at the indenter load of 200 mN (Figure 4a–c). On the other hand, the cracks for coating Ti-B-W (10%) were visible and well measurable only with indenter load of 400 mN (Figure 4d). Such intender loading values were accepted for testing of the fracture toughness KIC for selected coatings.
According to the adopted methodology (present in Section 2.1), 20 indentations were made for each coating with the selected indenter load (P), i.e., for the coatings: TiB2, Ti-B-W (3%), Ti-B-W (6%) was P = 200 mN, while for the coating Ti-B-W (10%) was P = 400 mN. The penetration depth was respectively h200mN = 1000 nm and h400mN = 1600 nm. For each indention, we measured the edge lengths for the indentation an and the crack lengths ln1, ln2, ln3, where n is the number of indentation. For each indentation, we determined the average values of ln according with equation ln = (ln1 + ln2 + ln3)/3. Then, for each tested coating, the average values of l and a were determined for the whole series of 20 indentations in accordance with relation Equations (2) and (3). Figure 5a,b shows an example of series of indentations made for the Ti-B-W (6%) coating and the results of the indentation n = 1.
a = ( a n = 1 + a n = 2 + + a n = 20 ) / 20
l = ( l n = 1 + l n = 2 + + l n = 20 ) / 20
Based on the material tests and measurements of the crack lengths in the corners of the indentations made of the Berkovich indenter, Table 4 summarizes the parameters that are needed to determine the KIC for the tested coatings, i.e., TiB2, Ti-B-W (3%), Ti-B-W (6%) and Ti-B-W (10%). The value of the coefficient (xv) in the Lougier model depends on the geometry of the indenter, which was used. According to the analysis carried out by N. Cuadrado et al. [13], for materials such as SiC, Si and soda-lime glass, in the case of Berkovich’s geometry the value of coefficient (xv) = 0.022 ± 0.001.
The analysis carried out according to the Laugier model showed that, as a result of doping the TiB2 coating with tungsten, there is a significant increase in its fracture toughness. When the tungsten concentration increases up to 10%, the cracks that were generated in the corners of the indentation made with Berkovich indenter become shorter. For concentrations of 3%–6% W, the fracture toughness of Ti-B-W coatings achieves a value comparable to KIC suitable for TiN [14] and CrN [15] coatings. The fracture toughness of Ti-B-W with 10 at.% W is KIC [TiBW (10%)] = 4.98 and is nearly 7.5 times higher than for the TiB2 coating KIC [TiB₂] = 0.67.

4. Discussion

In the article, the authors presented how the changes in the fracture toughness KIC for TiB2 and Ti-B-W coatings depend on the atomic % tungsten concentration (at.% W), as shown in Figure 6a. Observations of the brittle fracture cross-section showed that the TiB2 coating has a column structure, where the grain diameter is ≈100 nm (Figure 3a). The brittle fracture cross-section in the TiB2 coating has a clear intergranular character. In Figure 6b, the authors presented a scheme of the microstructure of the TiB2 coating, where the direction of cracking is parallel to the direction of growth of pillar grains (perpendicular to the surface of the coating). The presented diagram explains the high brittleness of the TiB2 coating and the low value of the fracture toughness KIC (KIC [TiB2] = 0.67).
Doping the TiB2 coating with 3% tungsten reduces column grains to a diameter of ≈30 nm (Figure 3b). Figure 6c proposes a diagram of the microstructure of the Ti-B-W (3%) coating, where grain refinement does not change the cracking mechanism, which still works mainly in a direction perpendicular to the surface. However, increasing the hardness and Young’s modulus of the Ti-B-W (3%) coating, and consequently also increasing the plasticity index of coating H/E and resistance to plastic deformation of coating H3/E2, results in increased resistance to brittle cracking (KIC [TiBW (3%)] = 1.84).
For Ti-B-W coatings, which contain 6% tungsten, the column structure with diameter of grains 30 nm also dominates (Figure 3c). The cracking mechanism is noticeably changed, where the directions of parallel and perpendicular cracking to the surface of the coating are equivalent. At the brittle fracture cross-section, the columnar grains were observed, which cracked in a direction parallel to the surface of the coating. In Figure 6d, the authors proposed a scheme of the Ti-B-W (6%) coating microstructure, where columnar grains change their structure and growth directions due to tungsten segregation and the possibility of new phases appearing, e.g., WB4. The occurrence of local differences in the microstructure and phase structure justifies the increase in the hardness of the TiBW (6%) coating (HTiBW (6%) = 37 GPa) and the possibility of cracking energy dissipation by changing the direction of cracking and its separation into several others.
In the Ti-B-W coating, obtained by the TiB2 coating doped with 10% tungsten, one can observe a compact columnar structure with the individual columns, which are agglomerates of equiaxed grains with a diameter ≈100 nm. This allows us to make conclusions regarding the possible occurrence of nano-composite microstructure in Ti-B-W (10%) coatings, which was confirmed by the results of the research presented by Sobol et al. [16]. In Figure 6e, the authors presented a scheme of the Ti-B-W (10%) coating microstructure, where the cracking process is not oriented, but indicates the possibility of energy dissipation during cracking. In addition, the doping 10% of tungsten in the structure of the TiB2 coating results in a large increase in hardness and Young’s modulus, i.e., HTiB2 = 34 GPa → HTiBW (10%) = 38GPa and ETiB2 = 405 GPa → ETiBW (10%) = 435 GPa, and the increase plasticity index H/E of coating and resistance to plastic deformation H3/E2 of Ti-B-W (10%) coatings, which are respectively: H/ETiBW (10%) = 0.087 and H3/E2TiBW (10%) = 0.289. As a result, the fracture toughness is significantly increased: KIC TiBW (10%) = 4.98.

5. Conclusions

The article demonstrated that the brittleness of thin TiB2 ceramic coatings can be effectively improved by tungsten doping. Tungsten concentration in the range of 0–10% can significantly changes the microstructure of coatings, from a typical columnar structure with a grain diameter of about 100 nm for TiB2, to a clear nano-composite structure for Ti-B-W (10%). Analysis of the tested TiB2 and Ti-B-W coatings, including: brittle fracture cross-section, changes in hardness (H) and Young’s modulus (E) and plasticity index H/E and resistance to plastic deformation H3/E2, enabled the development of microstructure diagrams for TiB2 coatings and Ti-B-W coatings with different tungsten concentration. Observations of brittle fracture cross-section show that, in the case of doping TiB2 coatings with tungsten at an amount of 10%, the microstructure is fragile and the nano-composite structure is created. Then it is possible to change the direction of cracking many times and to disperse it into several other directions. The energy of a single crack is reduced, which often results in the disappearance of cracks. As a result, in such a coating we observed a significant increase in values of fracture toughness KIC.
To assess the fragility of the tested coatings, the authors used the Berkovich indenter induction method and the calculation of the fracture toughness KIC according to Laugier model. Doping of TiB2 coating show that 10% tungsten causes a more than 7-times increase in the fracture toughness KIC from KIC [TiB2] = 0.67 to KIC [TiBW (10%)] = 4.98.
At the same time, Ti-B-W (10%) coatings are characterized by greater hardness and comparable surface roughness compared to TiB2 coating, which makes them coatings with a very high application potential.

Author Contributions

Conceptualization, J.S.; methodology, J.S., J.K.-G., and S.S.; investigation, S.S. and A.P.; data curation, J.S, J.K.-G., and S.S.; writing—original draft preparation, J.S.; writing—review and editing, S.S. All authors have read and agreed to the published version of the manuscript.

Funding

This research received no external funding.

Conflicts of Interest

The authors declare no conflict of interest.

References

  1. ASTM G40-15 Standard Terminology Relating to Wear and Erosion; ASTM: West Conshohocken, PA, USA, 1987; Volume 3, pp. 243–250.
  2. Zhu, X.-K.; Joyce, J.A. Review of fracture toughness (G, K, J, CTOD, CTOA) testing and standardization. Eng. Fract. Mech. 2012, 85, 1–46. [Google Scholar] [CrossRef] [Green Version]
  3. Lawn, B.R.; Evans, A.G.; Marshall, D.B. Elastic/plastic indentation damage in ceramics: The median/radial crack system. J. Am. Ceram. Soc. 1980, 63, 574–581. [Google Scholar] [CrossRef]
  4. Datye, A.; Schwarz, H.T.; Lin, U.D. Fracture toughness evaluation and plastic behavior law of a single crystal silicon carbide by nanoindentation. Ceramics 2018, 1, 198–210. [Google Scholar] [CrossRef] [Green Version]
  5. Lee, K.; Marimuthu, K.P.; Lee, J.H.; Rickhey, F.; Han, J.; Lee, H. Determination of crack-free mechanical properties of brittle materials via single nanoindentation. Int. J. Solids Struct. 2020, 191, 8–25. [Google Scholar] [CrossRef]
  6. Hervas, I.; Montagne, A.; Van Gorp, A.; Bentoumi, M.; Thuault, A.; Iost, A. Fracture toughness of glasses and hydroxyapatite: A comparative study of 7 methods by using Vickers indenter. Ceram. Int. 2016, 42, 12740–12750. [Google Scholar] [CrossRef] [Green Version]
  7. Feng, Y.; Zhang, T. Determination of fracture toughness of brittle materials by indentation. Acta Mech. Solida Sin. 2015, 28, 221–234. [Google Scholar] [CrossRef]
  8. Sebastiani, M.; Johanns, K.E.; Herbert, E.G.; Pharr, G.M. Measurement of fracture toughness by nanoindentation methods: Recent advances and future challenges. Curr. Opin. Solid State Mater. Sci. 2015, 19, 324–333. [Google Scholar] [CrossRef] [Green Version]
  9. Anstis, G.R.; Chantikul, P.; Lawn, B.R.; Marshall, D.B. A critical evaluation of indentation techniques for measuring fracture toughness: I, direct crack measurements. J. Am. Ceram. Soc. 1981, 64, 533–538. [Google Scholar] [CrossRef]
  10. Laugier, M.T. New formula for indentation toughness in ceramics. J. Mater. Sci. Lett. 1987, 6, 355–356. [Google Scholar] [CrossRef]
  11. Smolik, J.; Mazurkiewicz, A.; Garbacz, H.; Kopia, A. Tungsten doped TiB2 coatings obtained by magnetron sputtering. J. Mach. Constr. Maint. 2018, 4, 27–32. [Google Scholar]
  12. Fabijanic, T.A.; Coric, D.; Musa, M.Š.; Sakoman, M. Vickers indentation fracture toughness of near-nano and nanostructured WC-Co cemented carbides. Metals 2017, 7, 1–16. [Google Scholar]
  13. Cuadrado, N.; Casellas, D.; Anglada, M.; Jiménez-Piqué, E. Evaluation of fracture toughness of small volumes by means of cube-corner nanoindentation. Scr. Mater. 2012, 66, 670–673. [Google Scholar] [CrossRef] [Green Version]
  14. Zhang, L.; Yang, Y.; Pang, X.; Gao, K.; Volinsky, A.A. Microstructure, residual stress, and fracture of sputtered TiN films. Surf. Coat. Technol. 2013, 224, 120–125. [Google Scholar] [CrossRef]
  15. Daniel, R.; Meindlhumer, M.; Zalesak, J.; Sartory, B.; Zeilinger, A.; Mitterer, C.; Keckes, J. Fracture toughness enhancement of brittle nanostructured materials by spatial heterogeneity: A micromechanical proof for CrN/Cr and TiN/SiOx multilayers. Mater. Des. 2016, 104, 227–234. [Google Scholar] [CrossRef]
  16. Sobol, O.V.; Dub, S.N.; Pogrebnjak, A.D.; Mygushchenko, R.P.; Postelnyk, A.A.; Zvyagolsky, A.V.; Tolmachova, G.N. The effect of low titanium content on the phase composition, structure, and mechanical properties of magnetron sputtered WB2-TiB2 films. Thin Solid Films 2018, 662, 137–144. [Google Scholar] [CrossRef]
Figure 1. Dual DC magnetron system used to apply TiB2 coatings doped with tungsten: (a) scheme; (b,c) process chamber view.
Coatings 10 00807 g001
Figure 2. Illustrations of the measurement method of fracture toughness for all investigated indentations.
Coatings 10 00807 g002
Figure 3. SEM micrographs from the surface (on the left section) and from the brittle fracture cross-section (on the right section) with coating thickness measurements for coatings obtained with different power of tungsten sputtering (PW in Table 1): (a) TiB2: PW = 0 W; (b) Ti-B-W(1): PW = 25 W; (c) Ti-B-W(2): PW = 50 W; (d) Ti-B-W(3): PW = 75 W.
Coatings 10 00807 g003
Figure 4. The indentations for selected TiB2 and Ti-B-W coatings after testing with different values of indenter loading force: (a) TiB2: 200 Mn; (b) Ti-B-W (3%): 200 mN; (c) Ti-B-W (6%): 200 mN; (d) Ti-B-W (10%): 400 mN.
Coatings 10 00807 g004
Figure 5. SEM images of groups indentations used for fracture toughness analysis (KIC) for Ti-B-W (6%) coating: (a) series of 20 indentations with a Berkovich indenter at a load of P = 200 mN; (b) dimensional analysis of crack lengths for different indentations where n = 1, 2, 5, 6.
Coatings 10 00807 g005
Figure 6. The results of the fracture toughness KIC analysis for TiB2 and Ti-B-W coatings: (a) changes of values of KIC for TiB2 and Ti-B-W coatings depending on the tungsten concentration (at. % W); (b) scheme of microstructure TiB2 coating; (c) scheme of microstructure Ti-B-W (3%) coating; (d) scheme of microstructure Ti-B-W(6%) coating; (e) scheme of microstructure Ti-B-W (10%) coating.
Coatings 10 00807 g006
Table 1. Deposition parameters of reference TiB2 coating and TiB2 coatings doped with tungsten.
CoatingAtmospherePressureUBiasPower of MagnetronTemperature
(Pa)(V)PTiB₂ (W)PW (W)T (°C)
TiB2Ar 100%0.5−501000300
Ti-B-W (1)100025
Ti-B-W (2)100050
Ti-B-W (3)100075
Table 2. Parameters for investigated TiB2 and Ti-B-W coatings.
CoatingThickness
g (μm)
Roughness
Ra/Rz/Rt (μm)
Hardness
H (GPa)
Young’s Modulus
E (GP)
Plasticity Index
H/E
Resistance to Plastic Deformation H3/E2
TiB21.00.03/0.22/0.5534.0 ± 2405 ± 50.0750.239
Ti-B-W (3%)1.10.01/0.21/0.4135.5 ± 2415 ± 100.0850.259
Ti-B-W (6%)1.20.01/0.29/0.5637.0 ± 2425 ± 70.0870.280
Ti-B-W (10%)1.30.02/0.13/0.2938.0 ± 3435 ± 50.0870.289
Table 3. The results of investigations of the chemical composition for TiB2 and Ti-W-B coatings, which were made using the WDS method.
CoatingChemical Composition (at.%)B/(Ti + W)
TiWB
TiB231692.2
Ti-B-W (1)223753.0
Ti-B-W (2)226722.5
Ti-B-W (3)2210682.1
Table 4. Results of calculation of fracture toughness (KIC), hardness and Young modulus for all investigated coatings.
CoatingxvP (mN)H (GPa)E (GPa)a (μm)l (μm)c (μm) K I C = x v · ( a l ) 1 / 2 · ( E H ) 2 / 3 · P c 3 / 2
TiB20.02220034.0 ± 2405 ± 54.205.329.52KIC [TiB₂] = 0.67
Ti-B-W (3%)0.02220035.5 ± 2415 ± 103.782.426.20KIC [TiBW (3%)] = 1.84
Ti-B-W (6%)0.02220037.0 ± 2425 ± 73.642.105.74KIC [TiBW (6%)] = 2.16
Ti-B-W (10%)0.02240038.0 ± 3435 ± 56.201.204.83KIC [TiBW (10%)] = 4.98

