Article

Green Solid-State Chemical Reduction of Graphene Oxide Supported on a Paper Substrate

Institute for Polymers, Composites, and Biomaterials, National Research Council, UOS Napoli/Portici, Piazzale Enrico Fermi 1, Portici, 80055 Naples, Italy
*
Author to whom correspondence should be addressed.
Coatings 2020, 10(7), 693; https://doi.org/10.3390/coatings10070693
Submission received: 22 June 2020 / Revised: 14 July 2020 / Accepted: 16 July 2020 / Published: 17 July 2020
(This article belongs to the Special Issue Recent Advances in Carbon/Graphite Coatings)

Abstract

:
The reduction of graphene oxide (GO) thin films deposited on substrates is crucial to achieve a technologically useful supported graphene material. However, the well-known thermal reduction process cannot be used with thermally unstable substrates (e.g., plastics and paper), in addition photo-reduction methods are expensive and only capable of reducing the external surface. Therefore, solid-state chemical reduction techniques could become a convenient approach for the full thickness reduction of the GO layers supported on thermally unstable substrates. Here, a novel experimental procedure for quantitative reduction of GO films on paper by a green and low-cost chemical reductant (L-ascorbic acid, L-aa) is proposed. The possibility to have an effective mass transport of the reductant inside the swelled GO solid (gel-phase) deposit was ensured by spraying a reductant solution on the GO film and allowing it to reflux in a closed microenvironment at 50 °C. The GO conversion degree to reduced graphene oxide (r-GO) was evaluated by Fourier transform infrared spectroscopy (FT-IR) in attenuated total reflectance (ATR) mode and X-ray Diffraction (XRD). In addition, morphology and wettability of GO deposits, before and after reduction, were confirmed by digital USB microscopy, scanning electron microscopy (SEM), and contact angle measurements. According to these structural characterizations, the proposed method allows a bulky reduction of the coating but leaves to a GO layer at the interface, that is essential for a good coating-substrate adhesion and this special characteristic is useful for industrial exploitation of the material.

1. Introduction

In recent decades, graphene and its derivatives have attracted great interest because of their excellent mechanical, electrical, thermal, and optical properties [1,2,3,4,5]. On this basis, graphite oxide, first reported over 150 years ago [6], has re-emerged with an intense research interest due to its possible role as a precursor for a cost-effective mass-production of graphene-based materials. Reduced graphene oxide (r-GO) has mechanical, electrical, and optical properties quite similar to graphene because it has a slightly heterogeneous structure made of graphene-like planes, decorated by a few oxygen-containing chemical groups. Owing to the graphene-like properties, r-GO is a convenient material for many technological fields (e.g., catalysis, energy-storage, electronics, etc.) [7,8]. Several GO synthesis methods, which are alternatives to the original Hammer’s method [9,10,11,12], and new chemical reduction schemes are being proposed [13,14,15,16,17,18,19,20,21,22,23,24,25,26,27]. The GO conversion to r-GO usually requires some reducing agents or a high temperature [13,14,15,16,17,18]. Among these reduction strategies, the chemical approach is very promising for bulk production of r-GO at low cost. Unfortunately, most of the widely used chemical reductants such as hydrazine or hydrazine hydrate are highly toxic and/or explosive, which can potentially induce environmental and safety risks [19]. Moreover, the chemical reduction process of GO usually occurs under liquid-phase conditions by dissolving reducing agent and GO in an adequate solvent. This approach commonly determines the presence of some reduction by-products in the final r-GO material. Consequently, an alternative solid-state reduction technique could lead to an environmentally friendly and contaminant-free product [20].
When GO is deposited in the form of a thin film on a substrate, which provides mechanical stability and flexibility to it, during the reduction process, some other limitations related to the presence of this substrate can arise. For example, a limitation of thermal reduction in the presence of substrate is represented by the operating temperature to be applied, which is dependent on the thermal stability of the substrate. On the other hand, in the photo-reduction method, which is also used for supported r-GO production and typically requires laser radiation, the main limitation is that only the sample surface is involved in the process [21,22,23,24,25,26,27]. Consequently, the availability of effective soft-chemistry approaches for converting GO supported on substrates to r-GO are strictly required.
Here, a novel method to reduce GO supported on paper to r-GO has been developed. Such a method is based on the use of L-Ascorbic acid (L-aa) as the reductant [28,29,30]. L-aa is an effective green chemical reductant having a mild activity and non-toxic property, it is largely employed as a reducing agent and it has been also used when GO is converted to r-GO in liquid-phase [31,32,33]. L-aa is much more environmentally friendly then typical GO reductants like hydrazine and hydrazine hydrate. In addition, a different study revealed that GO reduced by L-aa achieved a C/O ratio (i.e., 12.5) and conductivity values (i.e., 77 S/cm), which are comparable to those produced by hydrazine [34]. Recently, other green reductants such as L-cysteine [35], Glycine [36], and green tea [37] have been study as reductant for GO, however these compounds have demonstrated to be inferior reducing agents. In our process, the solid GO deposit, in a water swelled form, has been reduced by L-aa, taking advantage of a diffusion-based mass-transport mechanism that is possible for the L-aa molecules, in a closed water-refluxing environment. This ecofriendly technique has shown to be very adequate to produce a bulky, uniform and highly reduced GO layer, preserving the paper substrate. Among the possible porous and flexible substrates, paper is one of the most used and low-cost natural polymers [35]. Cellulose is convenient as GO substrate because the hydroxyl groups present on the fiber surface may ensure an adequate interfacial adhesion. In addition, the paper substrate is interesting because it leads to devices that are light in weight, portable, flexible, foldable, and biodegradable which are strongly needed in fields like microfluidics, sensors, etc. [38,39,40,41,42,43].
The obtained r-GO layers were characterized by X-ray Diffraction (XRD) and Fourier transform infrared spectroscopy in attenuate total reflectance mode (FT-IR/ATR), to have structural information and to establish the reduction degree. In addition, the morphology was investigated by digital USB-microscopy and scanning electron microscopy (SEM), and changes in the GO deposit surface wettability with the reduction treatment was determined by contact angle measurements.

2. Materials and Methods

GO was synthesized by a modified Hummers’ method [11,27], that was based on the oxidation of graphite nanoplatelets (GNP) by KMnO4 (≥99%) and KNO3 (≥99%) solution in absolute H2SO4 and after ca. 1 h the reaction was stopped by adding H2O2 (30%). The raw reaction product was repeatedly washed by distilled water. All reactants were provided by Sigma-Aldrich. Then, the concentrated aqueous solution of GO was cast onto a paper substrate and this system was allowed to dry in air at room temperature. A Whatman® quantitative filter grade paper, 42 circles, diameter 42.5 mm, was selected as substrate.
The GO supported on paper was placed inside a closed Petri dish (Pyrex), and thermostated at a temperature of 50 °C by using a hot plate. The sample was periodically sprayed by L-ascorbic acid (L-aa, Sigma-Aldrich, St. Louis, MO, USA, 99%) aqueous solution to reduce GO (see Figure 1). Such treatment lasted for ca. 48 h. In these experimental conditions, an effective mass-transport diffusion of the L-aa reductant was possible inside the GO layer swelled by water. To remove all possible reduction by-products, at the end of treatment, the samples were washed by spraying distilled water on them.
The surface of samples was analyzed by digital USB-microscope (Dino-lite). In order to establish the time required for a complete reduction, the GO supported on paper samples were characterized by FT-IR spectroscopy, before and after the reduction treatment. FT-IR spectra were recorded in ATR mode in the 4000–700 cm−1 range by using a spectrophotometer (PerkinElmer Frontier NIR, Milan, Italy).
The paper substrate and GO supported on paper samples, before and after the reduction treatment, were structurally characterized by XRD (PANalytical-X’PERT PRO diffractometer, with CuKα radiation (λ = 0.154 nm)) in the range of 2θ = 5°–60°, scan step = 0.0130°, and full scan time = 18.9 s.
The surface and the cross-sections morphologies of the coating layer were visualized by a SEM (FEI Quanta 200 FEG, Hillsboro, OR, USA) equipped with an energy dispersive X-Ray (EDS) microanalyzer (Inca Oxford 250, High Wycombe, UK). Cross-sections were obtained by cutting the system with a scalpel.
The surface wettability of GO supported on paper, before and after the reduction treatment, was evaluated by contact angle measurements. In particular, the sessile drop method, that considers the shape of the small liquid test drop to be a truncated sphere, was used. The sessile drop contact angles were measured by a Dataphysics mod. OCA 20, using 1 μL as volume sampling. Each measurement was repeated ten times at room temperature and the achieved contact angle values were statistically treated.
The chemical structures have been drawn by ACD/ChemSketch Freeware Software, version 2019.2.1, Advanced Chemistry Development, Inc., Toronto, ON, Canada, www.acdlabs.com.

3. Results and Discussion

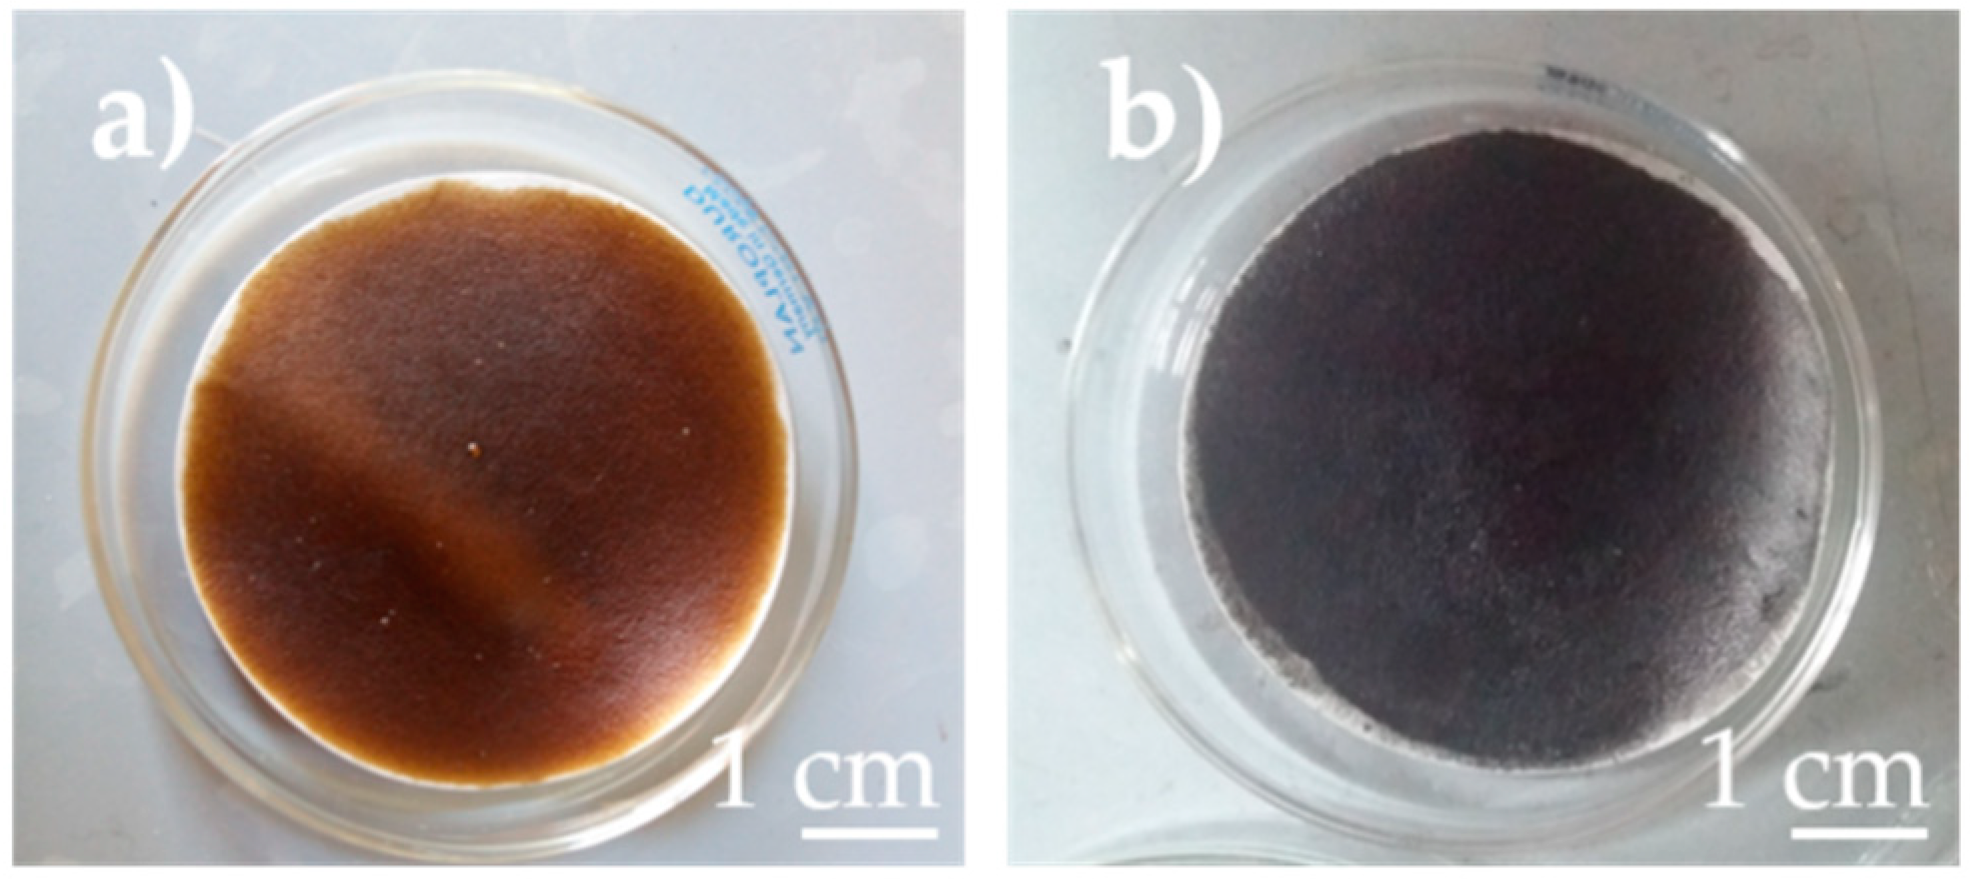
Figure 2 shows the images of a typical sample made of GO supported on paper, before and after the treatment with L-aa aqueous solution. As visible, the GO uniformly covers the surface of the paper substrate and its color changes from a light-brown (see Figure 2a) to black (see Figure 2b), as a consequence of the chemical reduction, thus proving that the GO has been converted to reduced graphene oxide (r-GO). The very uniform black color distribution in the coating layer suggests a complete chemical reduction of the GO into the r-GO. In addition, the coating does not show any defect (e.g., cracks, fractures, pores, etc.) and does not evidence any de-bonding of the substrate, before and after the chemical treatment. Further, the paper substrate was not modified by contacting the acid.
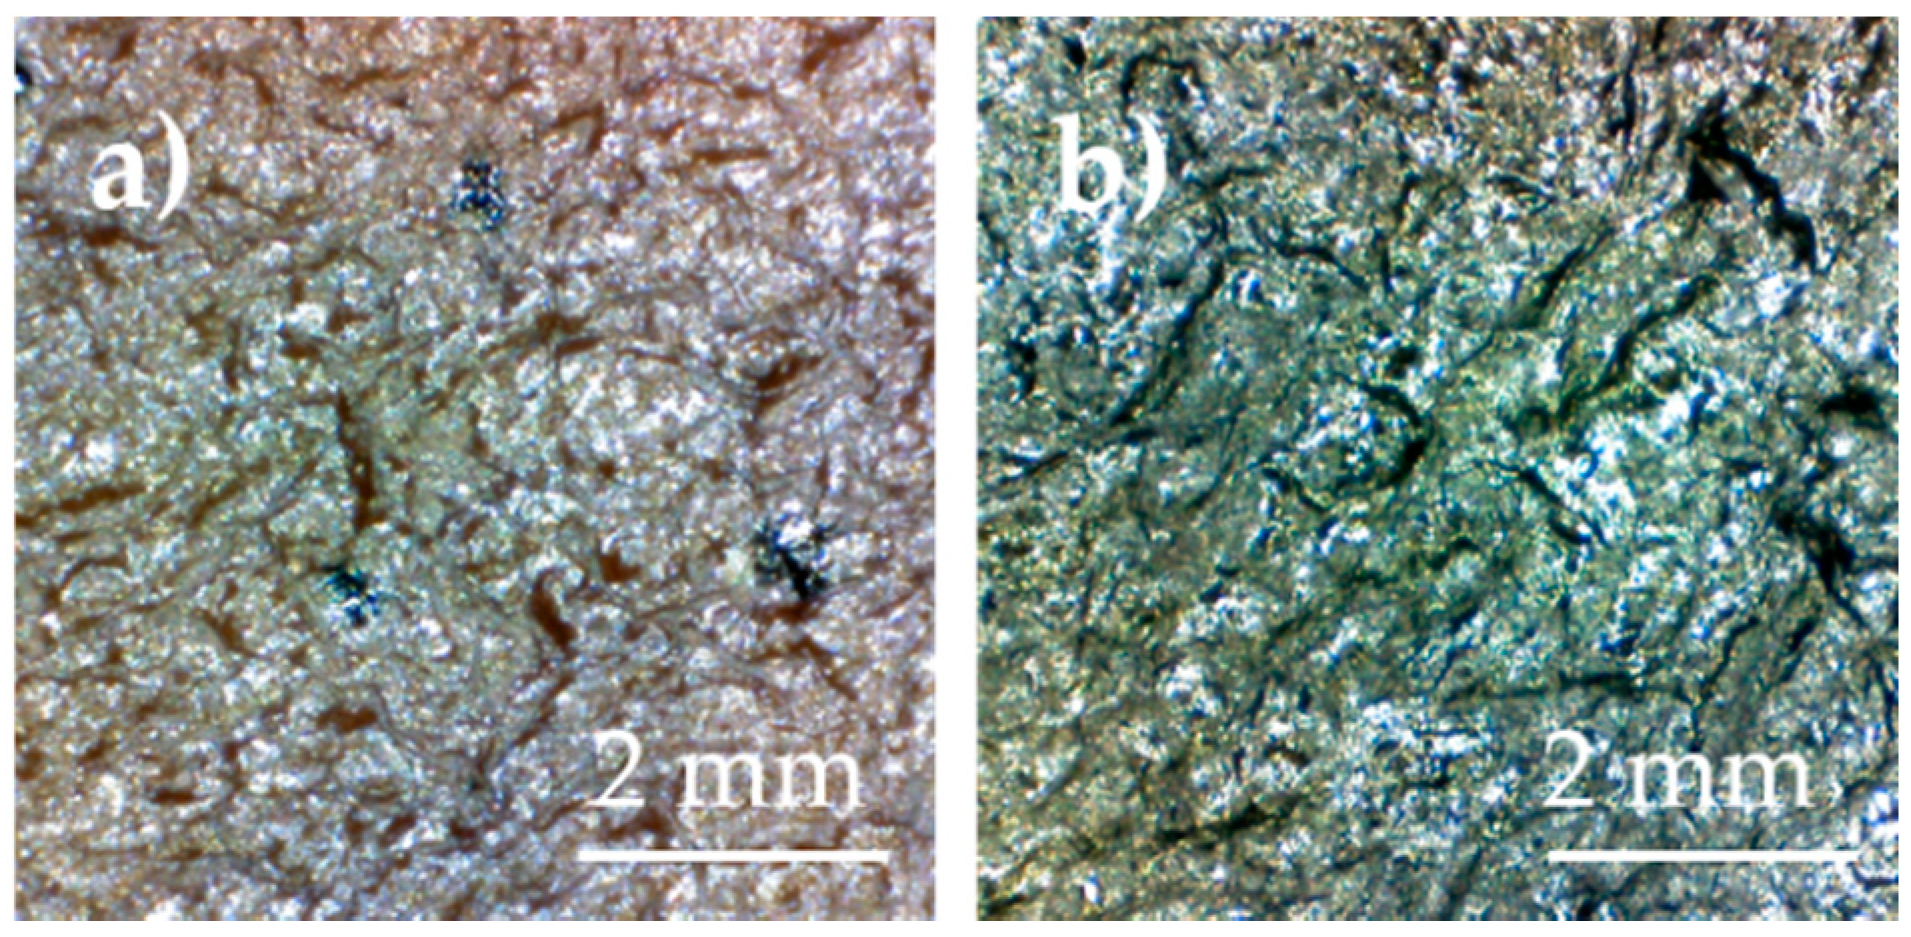
The coating surface morphology, before and after chemical reduction, was investigated by digital USB-microscopy. This type of microscopy is very sensible to the sample reflectivity because the observation takes place under reflected light. As visible in Figure 3, the reflectivity of the two samples significantly differs: the GO sample in Figure 2a does not reflect light and appears mostly brown, differently the r-GO sample in Figure 2b has a much higher reflectivity and includes even silvery areas. It is well known that graphite, similarly to the metals, has a glossy appearance, as a consequence also r-GO resembles graphite and have a mirror-like aspect. The higher reflectivity of the r-GO surface allows to better evidence the presence of an open porosity in the coating layer (dark areas uniformly distributed in the silvery phase).
Figure 4 shows the FT-IR spectra in ATR mode of paper substrate (green line), GO before (black line), and after (red line) the treatment with L-aa aqueous solution. The spectrum of paper (green line) shows peaks in the range of 3700–3000 cm−1 that can be referred to the resonance vibration of hydroxyl groups (–OH), a peak at ca. 2700 cm−1 that is due to the C–H stretching vibration, and other peaks in the range of 1500–900 cm−1 which could be due a C–O functional groups. As visible, the GO spectrum includes six main peaks that can be attributed to the resonance vibrations of: (i) the oxygen-containing groups and (ii) the carbon skeleton. In particular, the very strong and broad peak at 3171 cm−1 can be referred to the resonance vibration of hydroxyl groups (–OH), the peak at 1735 cm−1 to the resonance vibration of carbonyl groups (C=O), the peak at 1227 cm−1 to the alloy groups (C–O–H) and the peak at 1061 cm−1 to the epoxide groups (C–O–C). In addition, the stretching absorption of C=C groups is also clearly visible in the spectrum at 1621 cm−1, and the band centered at 2840 cm−1 is due to the C–H stretching vibration [44].
The spectrum of GO after the chemical reduction (red line in Figure 4) shows a decrease of absorption band number and intensities, thus confirming the formation of r-GO by the removal of most oxygen-containing functional groups. In particular, the C–O stretching resonance completely disappears, and the C=C stretching vibration slightly attenuates and shifts from 1621 to 1590 cm−1, because of the conjugation extension in the graphene plane [44]. The Optimized 3-D images of GO and r-GO are available in the Supplementary Information in Figure S1.
Figure 5 shows XRD diffractograms of: pristine paper substrate, GO, and r-GO supported on paper. The paper substrate has the typical semi-crystalline cellulose diffraction pattern (see Figure 5a), which includes diffraction peaks at 2θ values of: 14.7°, 16.8°, and 22.7°, corresponding respectively to the ( 1 ¯ 10 ) , (110), and (200) crystallographic planes of type I monolithic cellulose (PDF files: 000561717, 000561718, and 000561719) [34]. The XRD patterns of GO and r-GO supported on paper are shown in Figure 5b,c. As visible in Figure 5b, the untreated GO deposit XRD diffractogram includes, in addition to the paper substrate XRD pattern, the presence of a peak at 2θ = 10.62°, referred to the GO (002) plane [14]. The XRD diffractogram of r-GO deposit, shown in Figure 5c, includes, in addition to the paper substrate pattern, a peak of low intensity at 2θ = 11.53°, referred to the GO (002) plane, and two peaks at 25.39° and 43.02°, belonging to r-GO [14]. Other peaks present in the XRD diffractogram can be referred to the presence of inorganic/organic crystalline solid phases (i.e., residual L-aa, calcium salts, etc.) present in the sample at an impurity level. As known, the d-spacing of the GO is higher than the corresponding value of graphite, because of the presence of oxygen-containing functional groups attached on both sheet sides, and of the atomic-scale roughness, arising from structural defects (e.g., sp3 carbon atoms). It is possible to evaluate this d-spacing by the Bragg’s law [45,46,47]:
d(hkl) = n(λ/sinθ)
where λ is the wavelength of the X-ray (Cu-Kα1 = 1.5481 Å), θ is half of the corresponding scattering angle, n is an integer number, representing the diffraction peak order, d is the inter-plane distance of the lattice, and (hkl) are the Miller’s indices. According to Equation (1), such increased value of the d-spacing, calculated by a GO peak analysis, results: d(002) = 8.32 Å for the untreated GO deposit, while it results 7.67 Å, after the chemical treatment (see Table 1). The calculated d-spacing values were more than twice compared to that of pristine graphite (d(002) = 3.54 Å), thus confirming the expansion of graphitic stack during oxidation. Moreover, Scherrer’s equation can be used to obtain the average crystal thickness, i.e., the size perpendicular to the (002) plane (2θ = 10.62° for GO and 2θ = 25.39° for r-GO) and the in-plane crystallite average size that can be expressed in terms of in-plane periodicity peak (2θ = 43.02° for the (100) plane) [30,31,32] as follows:
L(hkl) = K·λ/FWHM·cosθ
where FWHM is the full-width-at-half-maximum in radians obtained by a Gaussian fit of the peak, K is a constant depending on the crystallite shape, and it is taken as 0.89 to evaluate the average in-plane thickness (i.e., L(002)), and 1.84, to evaluate the in-plane size (i.e., L(100)) [47].
The average number of the graphene layers (n) per crystalline domain can be calculate from the XRD peak broadening by using a combination of Scherrer’s and Bragg’s equations, that provides the following expression:
n = (L(002)/d) + 1
Table 1 summarizes the results of these calculations for the system before and after chemical treatment. The (002) peak area of the GO is significantly reduced (68% of the initial area), the average thickness of the GO crystallites before chemical reduction resulted 11.72 nm, while the same thickness was 19.95 nm after the chemical treatment. A thickness value of 27.21 nm was found by analyzing the r-GO peak at 2θ = 25.39.
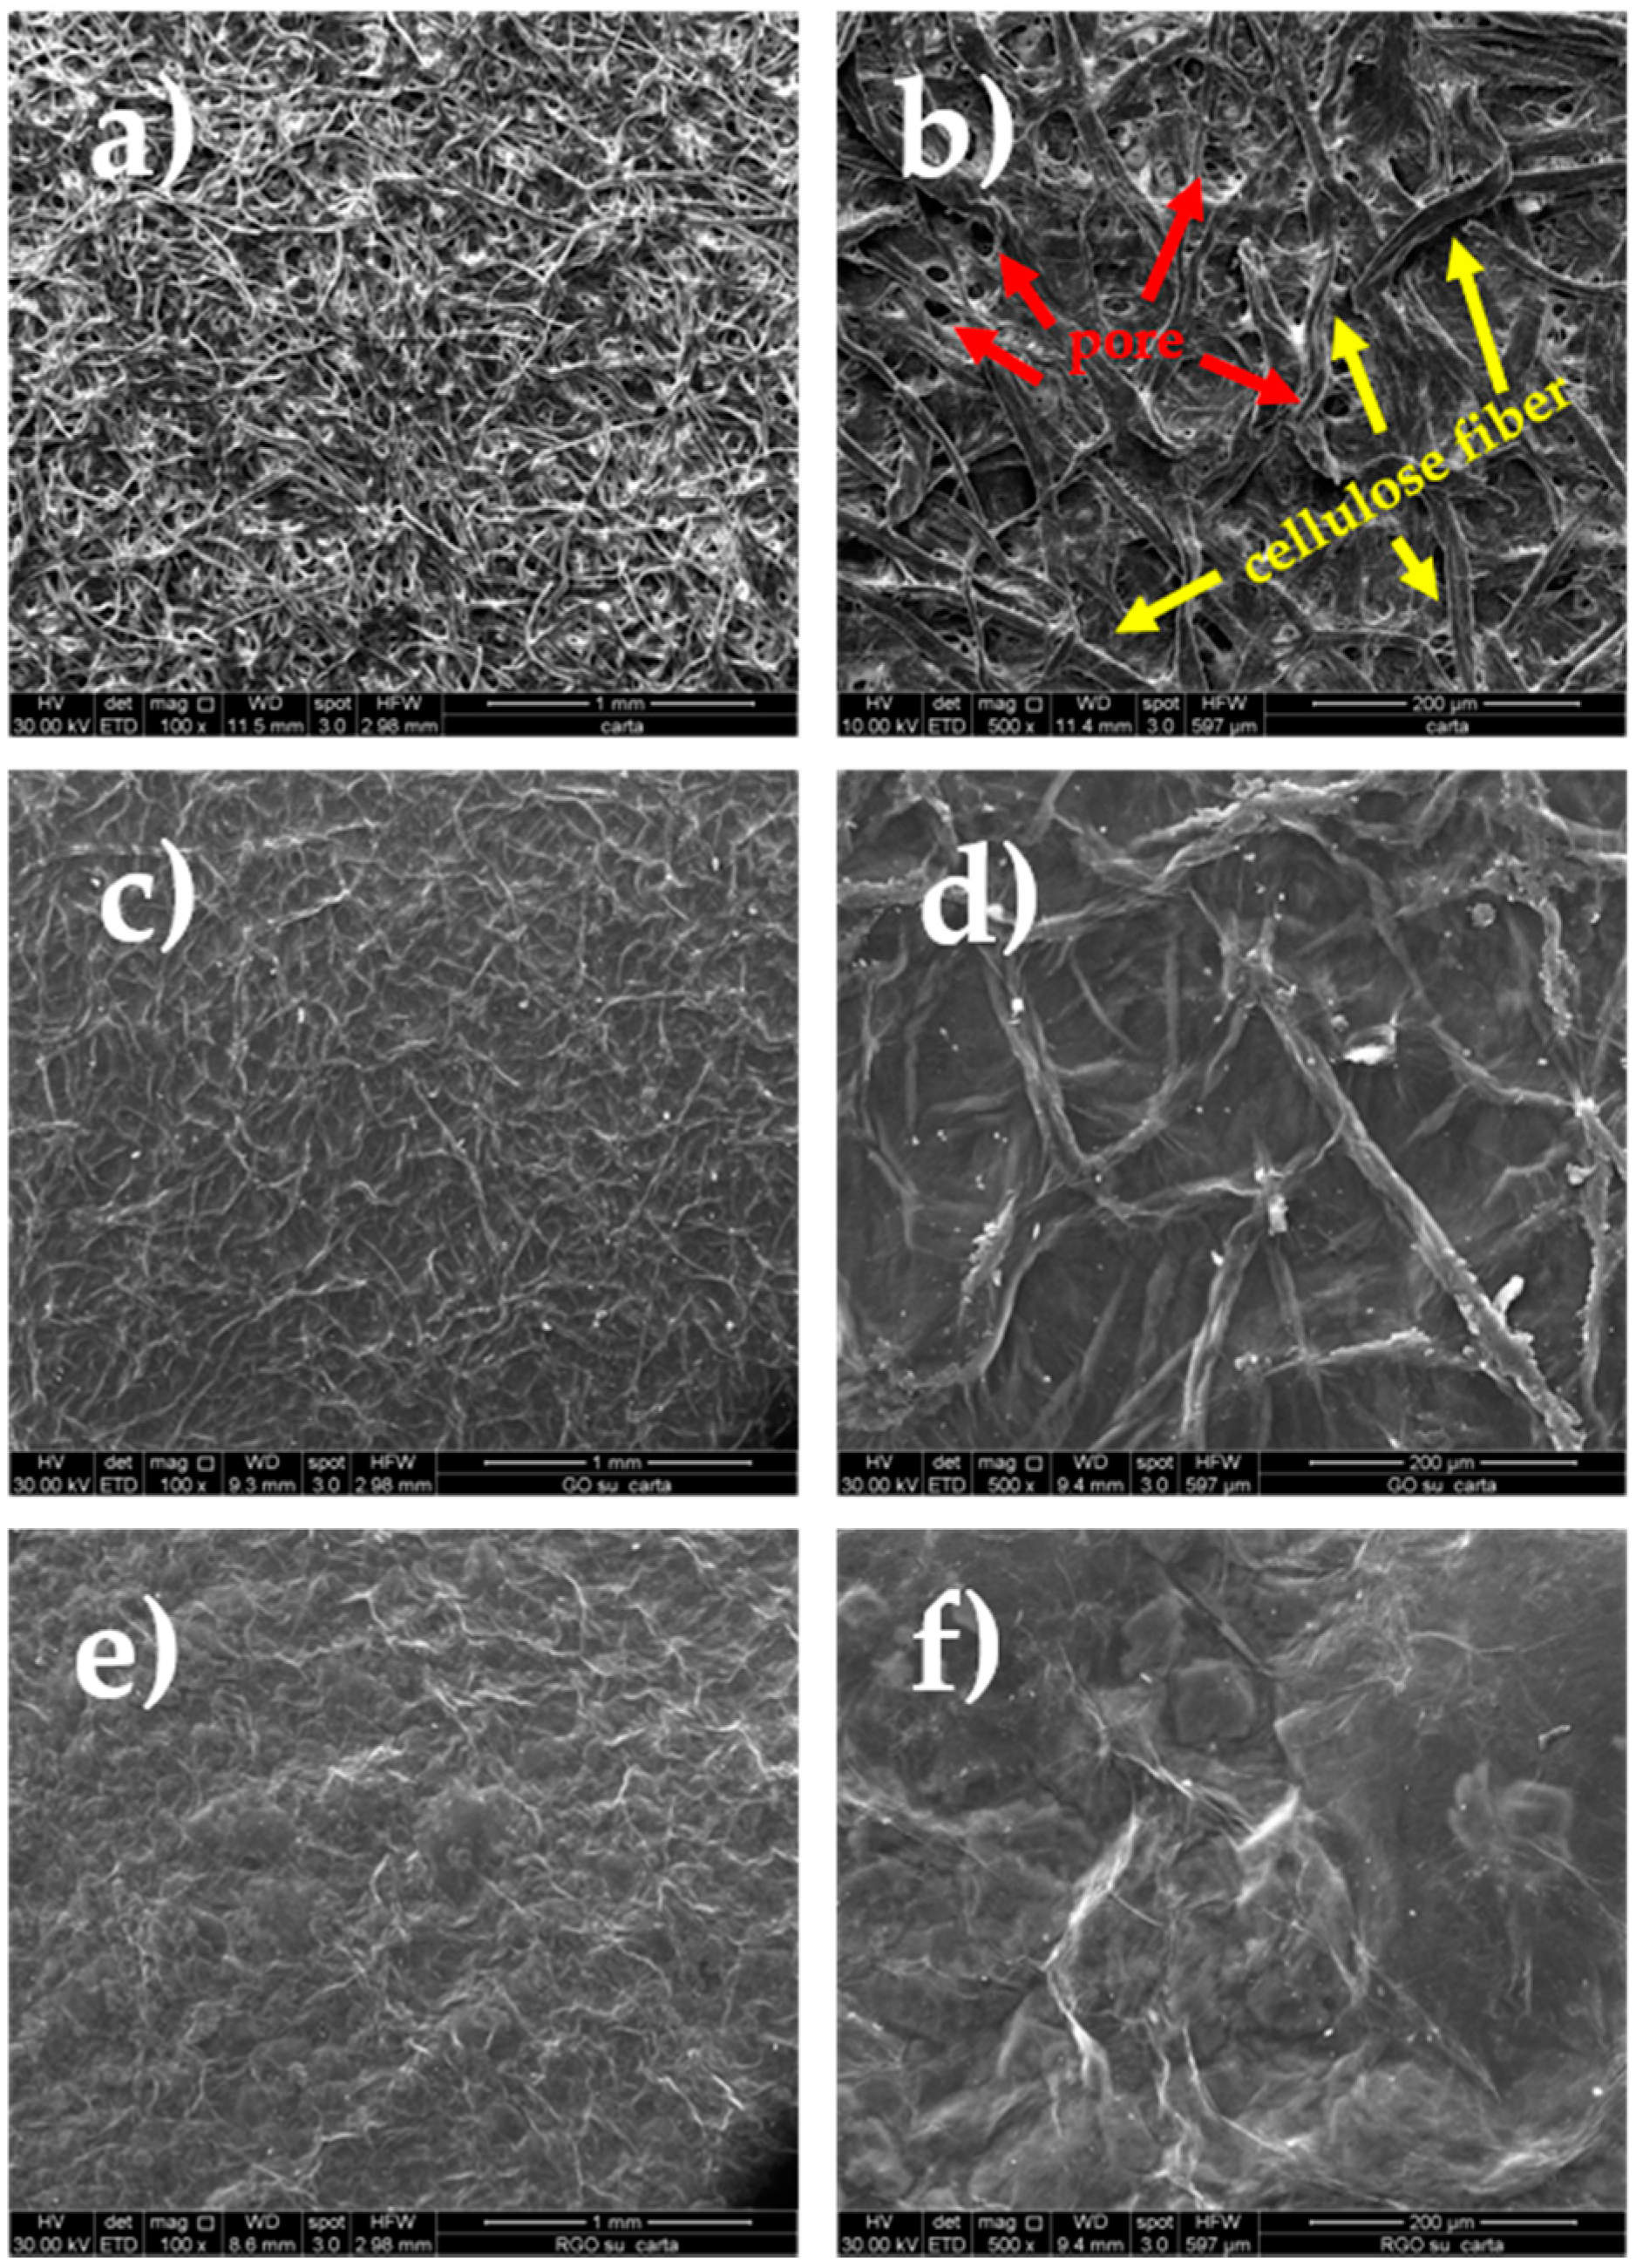
The morphologies of the paper substrate and the GO supported on paper, before and after the chemical reduction, were investigated by SEM, as shown in Figure 6. As visible in the two micrographs showing the substrate microstructure at different magnifications (Figure 6a,b), the substrate was made of compacted cellulose microfibers having a diameter in the 20–50 μm range. Several pores, with a size of ca. 2.5 μm, were uniformly distributed on the substrate surface. After coating the paper substrate by GO and drying this system in air, according to the SEM-micrographs shown in Figure 6c,d, a continuous and uniform coverage of both the cellulose fibers and pores by a thin GO layer was obtained. Obviously, the observed roughness in the GO surface has to be ascribed to the substrate fibrous morphology that is perfectly reproduced because of the conformational flexibility of GO chemical structure for the presence of the sp3-hybridized carbon atoms. Owing to the chemical affinity between the GO layer and the cellulose fibers, related to the presence of hydroxyl groups in both solid phases, a strong interfacial adhesion (i.e., absence of peeling off in the GO coating layer), with complete filling of the pores, was possible. As visible in Figure 6e,f, the coating morphology slightly changed after the chemical reduction treatment, indeed the surface roughness reduced significantly, and all deep grooves and folds are not visible anymore because of the increased stiffness of the graphene coating layer, which consist manly sp2-hybridized carbon atoms. Such a lower roughness of the sample surface that follows to the chemical treatment proves a complete conversion of GO sheets to r-GO, near the coating top.
A further SEM investigation was carried out on the cross-section of the GO and r-GO supported on paper samples (see Figure 7). According to these images, the GO and r-GO solid phases do not permeate the substrate fibrous structure. Figure 7a,b shows that the thickness of the paper substrate was ca. 120 μm, while the average thickness of GO layer was ca. 3 μm. As visible in Figure 6b, the coating layer appeared as quite compact and cavities or other defects were not present in this layer. In addition, a good interfacial adhesion resulted between the GO substrate and the fibrous coating. The SEM micrographs of the r-GO sample shown in Figure 7c,d suggests the formation of air cavities inside the layer as a consequence of the reduction treatment, and the layer thickness became ca. 50 μm. Probably, such cavities have been produced by the formation of gaseous by-products (mostly H2O) during the reduction process.
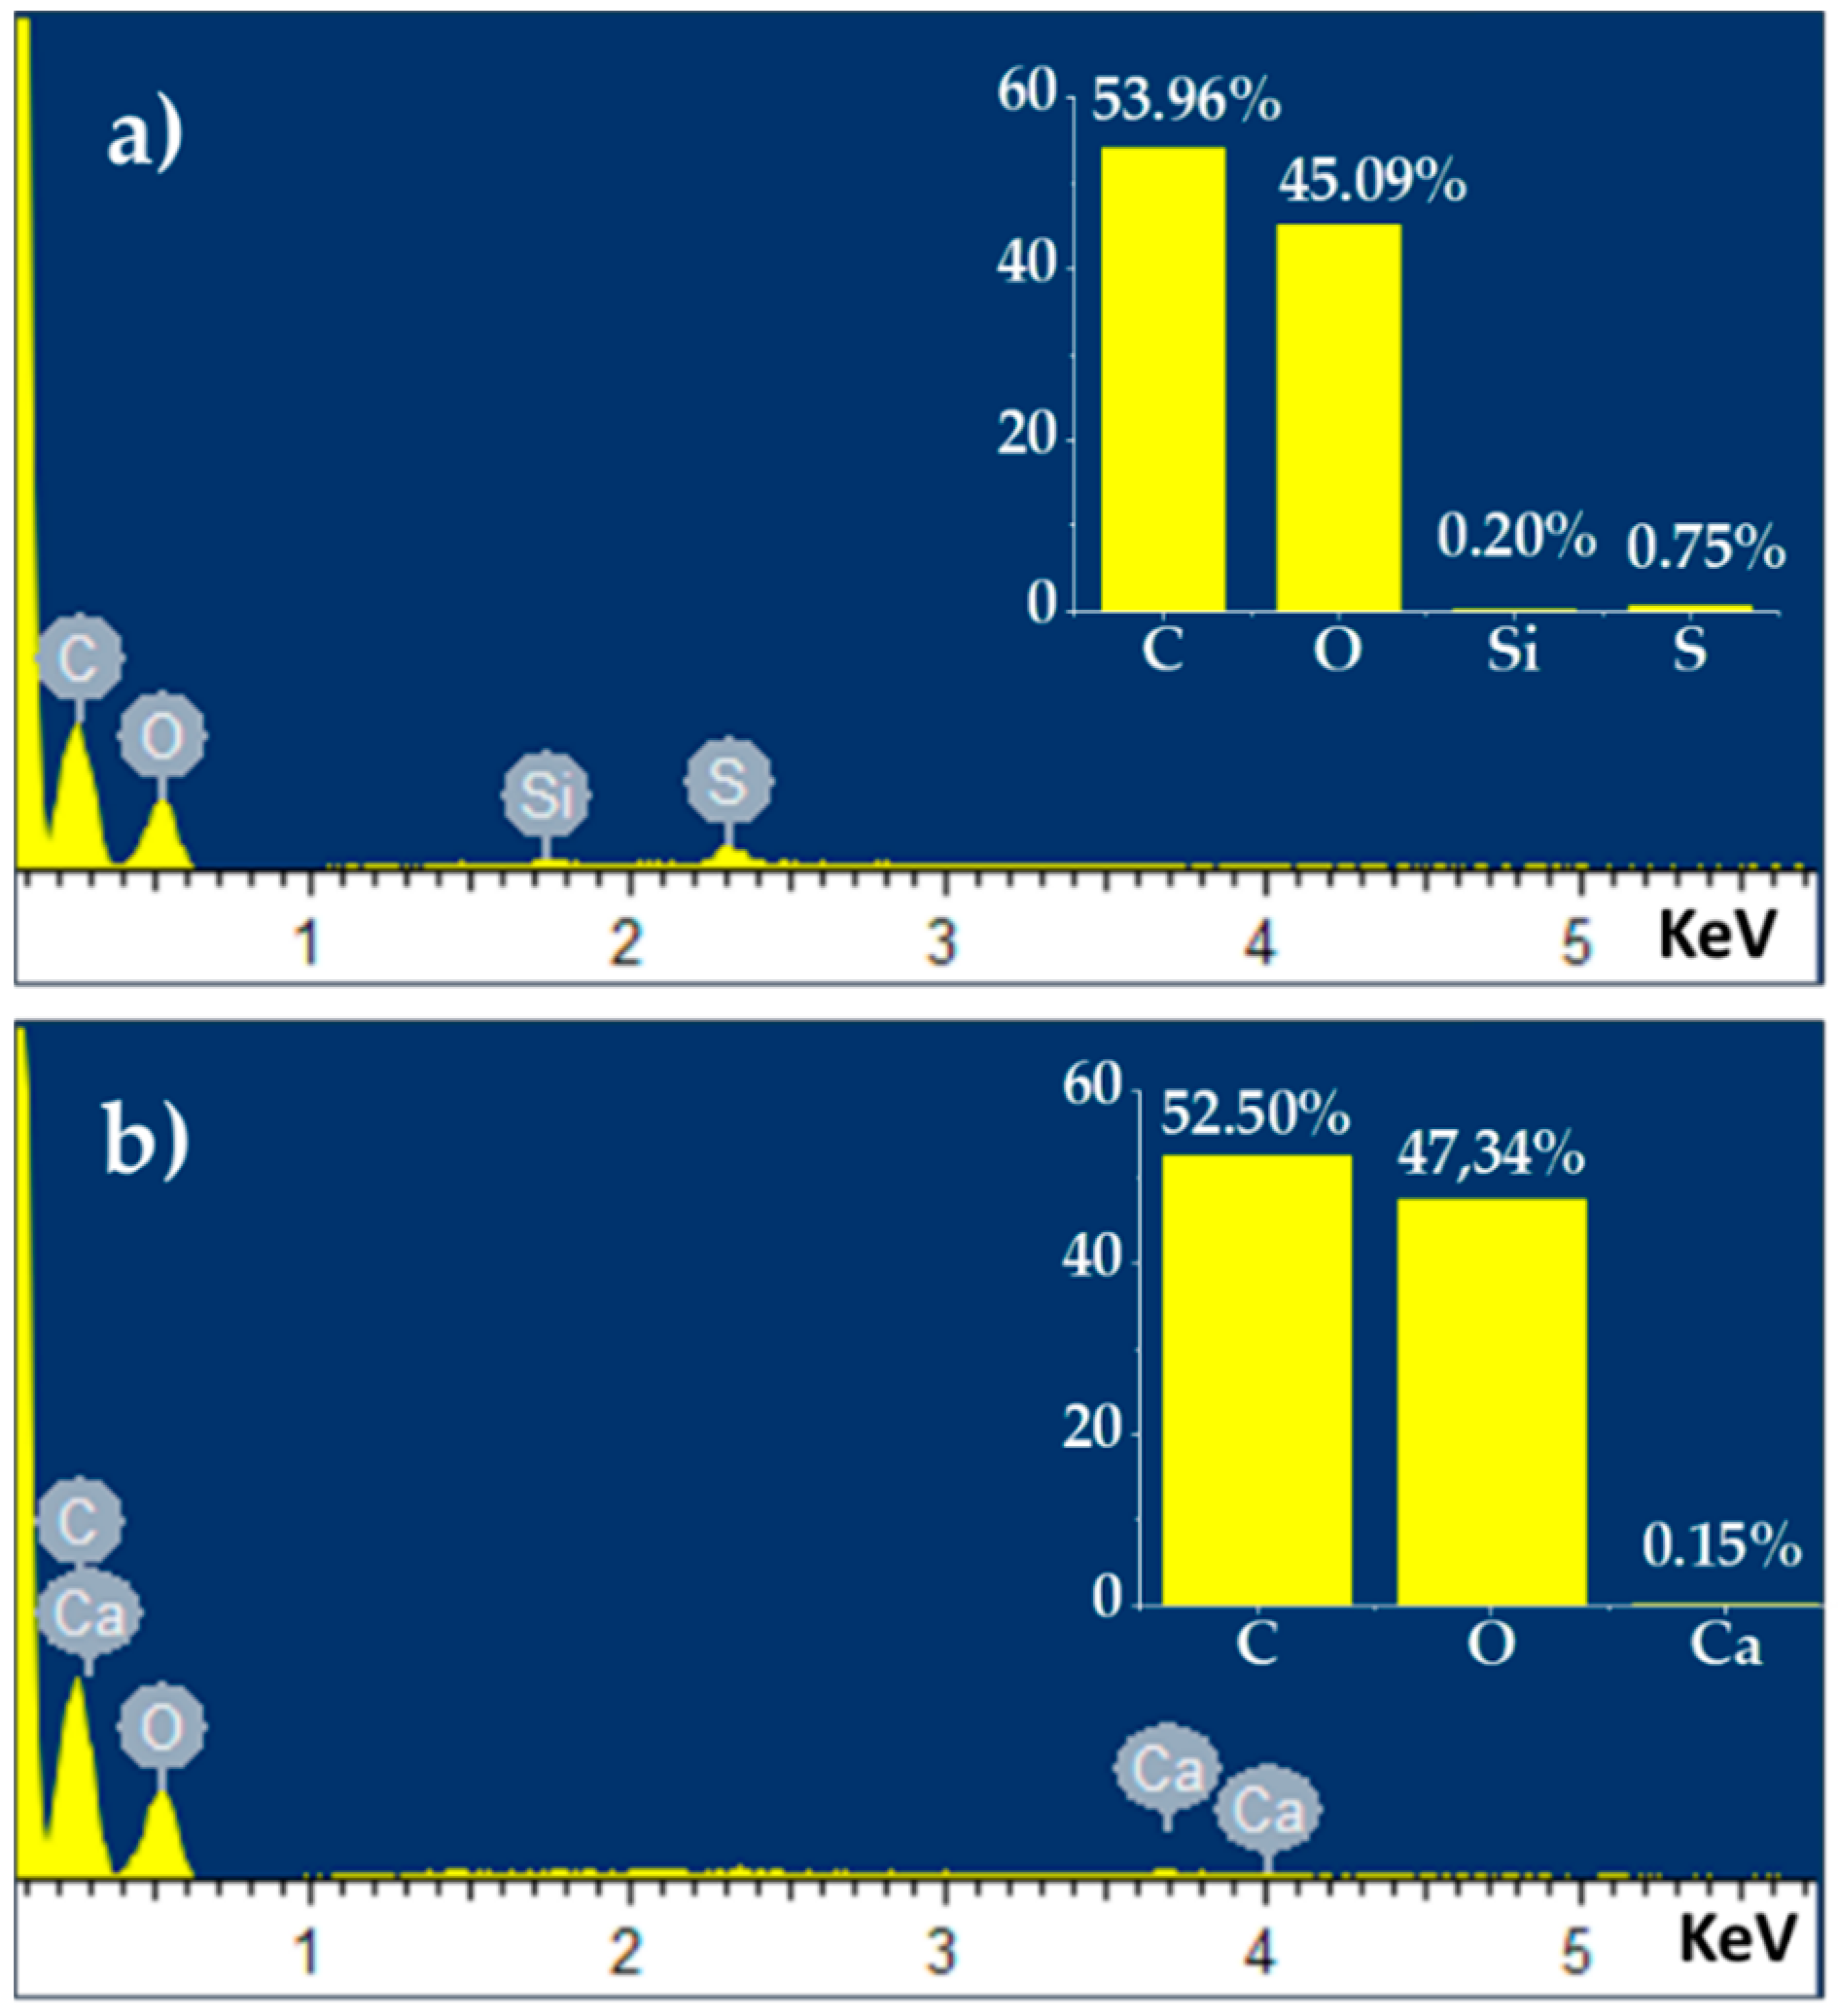
In order to establish the coating layer purity an EDS analysis of the sample, before and after the chemical reduction treatment, has been performed. The EDS spectrum of both GO and r-GO sample is shown in Figure 8. According to this EDS characterization, sulfur impurities (0.75%) and a little amount of silicon (0.20%) were present in the GO coating. However, such impurities completely disappear after the reduction treatment. Owing to the presence of a cellulose substrate, C and O signals remain mostly unchanged by the reduction treatment.
The variation of the GO coating wettability, as a consequence of the chemical reduction, was quantified by measuring the contact angle of this layer before and after treatment. The “sessile drop method” was used according to the literature [48]; this method considers the shape of the small water test drop as a truncated sphere and measures the angle between the surface of the liquid and the outline of contact surface by image analysis. An example the achieved values of the contact angle are given in Figure 9. The average contact angle value for a pristine GO layer is 53° ± 1.1°, however, it is possible to observe that the values on the two drop sides are not exactly equal, for example in Figure 9a, on the left side, the average value was 52.6°, while on the right side it was 55.8° and such a discrepancy is related to the high roughness that characterizes the layer surface. This low value of the contact angle confirms the high wettability (hydrophilic nature) of the GO coating. Differently, the average contact angle of a water drop located on the r-GO layer shows higher average values and precisely ca. 97° ± 1.5° (see Figure 9b), thus confirming the low wettability (hydrophobic nature) of the same layer after chemical reduction. This significant increase in the contact angle as a consequence of the chemical treatment shows the efficiency of the proposed method in the removal of most oxygen-containing groups from the GO surface [49].
Finally, this chemical technique is based on the possibility to convert the solid GO phase in an aqueous gel, where molecular transport by diffusion easily takes place exposing this hydrophilic substance to water vapor [50]. In particular, the hydrophilic surface of the GO sheets is easily solvated by water molecules that also accumulate at inter-layer, thus generating a continuous liquid phase interpenetrating the GO layers. The use of a temperature close to 50 °C allows a fast diffusion of the L-aa reductant molecules, periodically distributed by spraying a L-aa aqueous solution on the GO layer surface, inside the gel-phase. The mild temperature, selected for the experimental process, allowed to favor the L-aa molecule migration inside the gel-phase, without causing an early thermal degradation of the reductant. The schematic representation of the involved diffusion path is summarized in Figure 10. This process also allowed a solid-state removal of different by-products (e.g., dehydroascorbic acid) by spraying water on the produced r-GO layer.
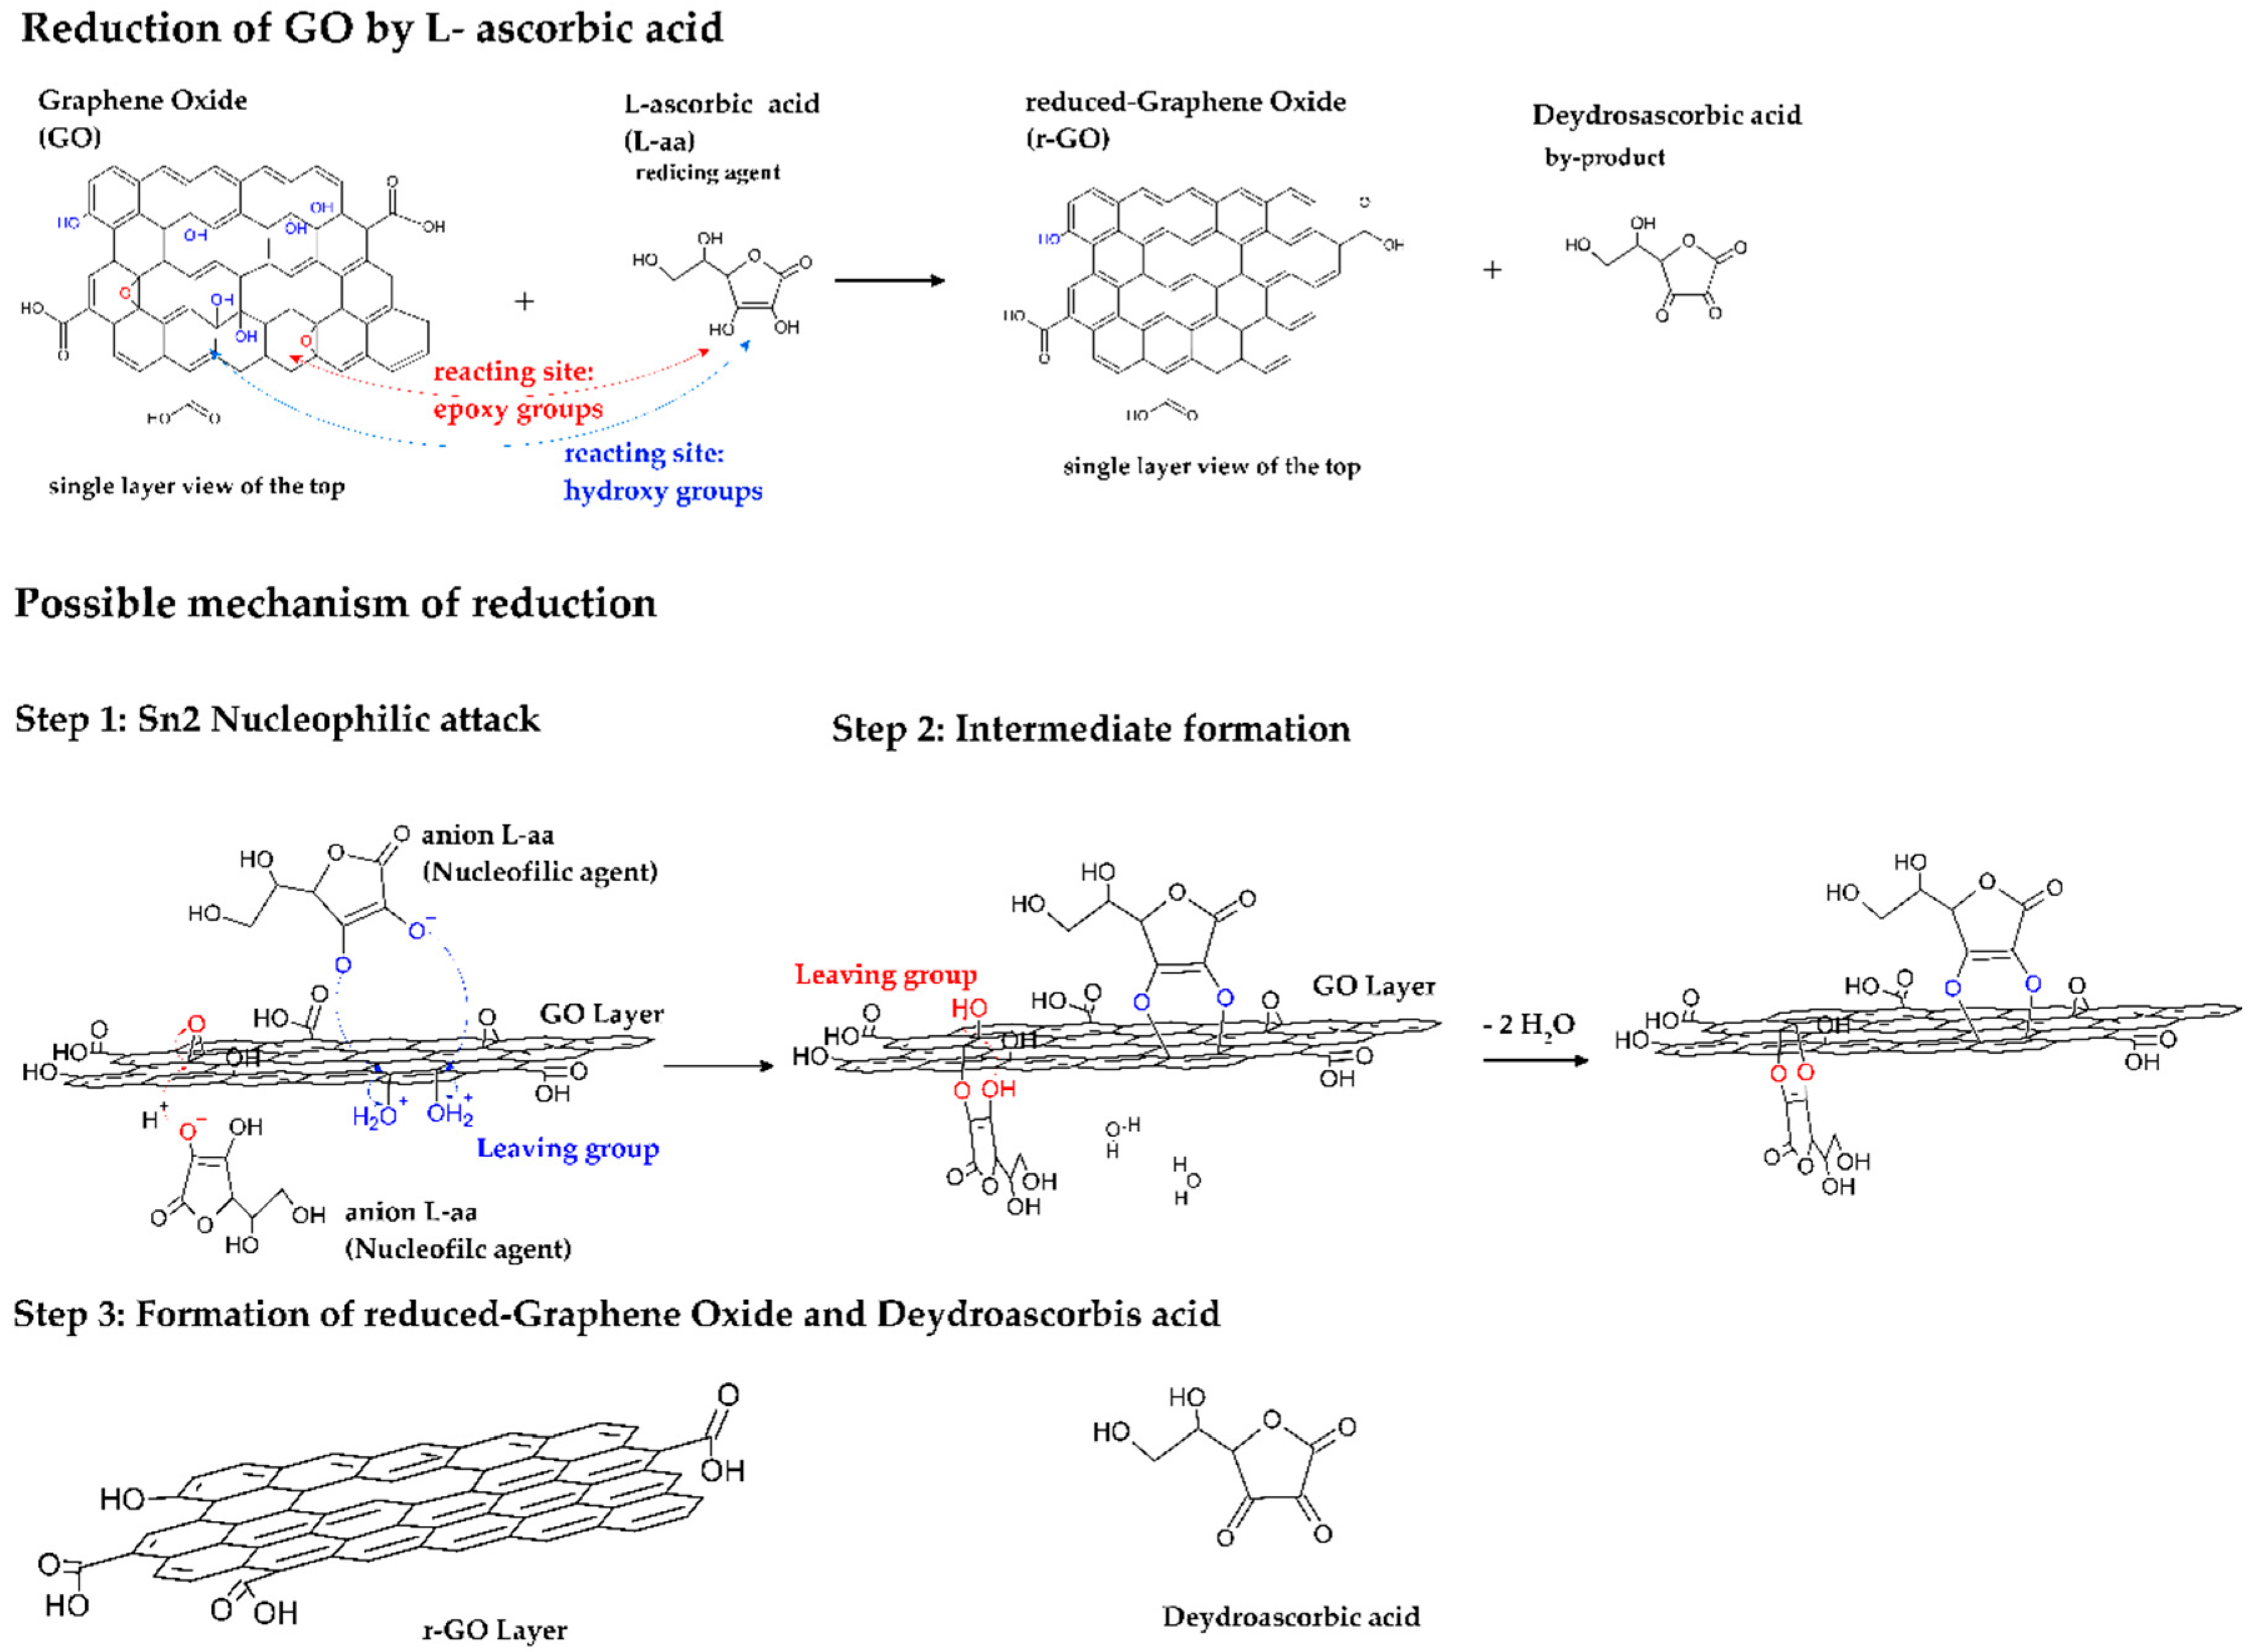
Concerning the chemical mechanism taking place in the gel-phase during GO reduction, the investigated system should approximately behave as reported in the literature for the reduction of single GO units dispersed in liquid-phase [51,52]. Owing to the slow diffusion rate of L-aa molecules, which always characterizes a gel-phase reduction, a lower value for the reaction rate is expected. Actually, the exact mechanism of the chemical reaction between GO and L-aa is not completely clear, but two different reactions should be involved in the interaction between L-aa and GO epoxy groups or L-aa and GO vicinal-hydroxyl groups. The reaction pathway is schematically indicated in Figure 11 (3-D images were not energetically optimized). As visible, both reactions require the formation of a good leaving group, which is a hydroxyl group, in the case of epoxies, and a water molecule, in the case of vicinal-hydroxyl groups. These types of leaving group are generated by protonation of the cited GO reactive groups. In particular, the electron withdrawing from five-membered ring of L-aa makes its hydroxyls more acidic, consequently the L-aa is ready to dissociate two protons, that are transferred to GO, thus generating the nucleophilic species (the oxyanion of L-aa, C6H7O6). After this preliminary acid–base reaction, an SN2 step follows. In this SN2 step, the nucleophilic agent attacks the sp2-carbon of the epoxy group or the Sp3-carbon of the alcoholic groups, and hydroxyl or water results as by-product, respectively. In the case of the reaction involving epoxy, a further condensation by SN2 mechanism follows. Then, this intermediate undergoes a thermally induced redox reaction, that leads to formation of reduced graphene (r-GO) and dehydroascorbic acid [51,52]. Optimized 3-D images of different reaction intermediate and some more structural information about the kinetic mechanism are available in the Supplementary Information in Figure S2.

4. Conclusions

The possibility to reduce thin GO deposits on paper substrate by a non-toxic, eco-friendly, and low-cost chemical reductant, like L-aa aqueous solution, has been investigated and according to the achieved results, a uniform and bulky layer of highly reduced r-GO can be obtained. This process requires to reflux the L-aa aqueous solution in presence of the GO deposit in a closed microenvironment for 48 h at a temperature of ca. 50 °C. In these experimental conditions, GO forms a gel-phase where the reductant diffusion can easily take place. According to the SEM investigation, a structural modification of coating surface follows to the chemical reduction treatment, mainly consisting in an increase of the coating flatness. According to the infrared spectroscopy (FT-IR) most of the oxygen-containing groups present in the GO layer were removed, thus determining a significant variation of the wettability of the material, that changes from hydrophilic (contact angle: 53°) to hydrophobic (contact angle: 97°). The XRD results show the presence of the main peaks of the r-GO pattern combined with signals of residual GO, thus confirming the spectroscopic results concerning r-GO formation in presence of a very thin residual GO layer at the interface with paper. In particular, the obtained r-GO coating is composed of graphite platelets, with the average thickness of ca. 27 nm and a width of ca. 40 nm, which are aligned parallel to the interfacial plane and show good graphitic quality. This structural characteristic is relevant to achieve a high flexible r-GO layer, supported on paper substrate because of the excellent GO-paper interface adhesion, which is strictly necessary for an industrial exploitation of this system.

Supplementary Materials

The following are available online at https://www.mdpi.com/2079-6412/10/7/693/s1, Figure S1: Optimized 3-D images of GO and r-GO. Figure S2: Optimized 3-D images of different reaction intermediate and some more structural information about the kinetic mechanism.

Author Contributions

Conceptualization, G.C.; methodology, G.C.; software, A.L.; validation, G.C., M.P., and A.L.; investigation, G.C., M.P., and A.L.; data curation, A.L. and M.P.; writing—original draft preparation, A.L. and M.P.; writing—review and editing, G.C., A.L., and M.P.; supervision, G.C.; project administration, G.C. All authors have read and agreed to the published version of the manuscript.

Funding

This research received no external funding.

Acknowledgments

The authors are grateful to Maria Cristina Del Barone of LAMEST laboratory (IPCB-CNR) for SEM analysis and to Maria Rosaria Marcedula of Thermo-Analysis Laboratory (IPCB-CNR) for FT-IR and contact-angle measurements. The authors acknowledge the funding support by the CNR-project titled: “Nanocompositi polimerici per applicazione ottiche”.

Conflicts of Interest

The authors declare no conflict of interest.

References

  1. Shafraniuk, S. Graphene: Fundamentals, Devices, and Applications, 1st ed.; Jenny Stanford Publishing: Boka Raton, FL, USA, 2015; ISBN 9789814613477. [Google Scholar]
  2. Novoselov, K.S.; Geim, A.K.; Morozov, S.V.; Jiang, D.; Zhang, Y.S.; Dubonos, V.; Grigorieva, I.V.; Firsov, A.A. Electric field effect in atomically thin carbon films. Science 2004, 306, 666–669. [Google Scholar] [CrossRef] [Green Version]
  3. Geim, A.K. Graphene: Status and prospects. Science 2009, 324, 1530–1534. [Google Scholar] [CrossRef] [PubMed] [Green Version]
  4. Geim, A.K.; Novoselov, K.S. The rise of grapheme. Nat. Mater. 2007, 6, 183–191. [Google Scholar] [CrossRef] [PubMed]
  5. Novoselov, K.S.; Jiang, Z.; Zhang, Y.; Morozov, S.V.; Stormer, H.L.; Zeitler, U.; Maan, J.C.; Boebinger, G.S.; Kim, P.; Geim, A.K. Room-temperature quantum hall effect in graphene. Science 2007, 315, 1379. [Google Scholar] [CrossRef] [PubMed] [Green Version]
  6. Schafhaeutl, C. On the combination of carbon with silicon and iron, and other metals, forming the different species of cast iron, steel, and malleable iron. Phil. Mag. 1840, 16, 570–590. [Google Scholar]
  7. Smith, A.T.; LaChance, A.M.; Zeng, S.; Liu, B.; Sun, L. Synthesis, properties, and applications of graphene oxide/reduced grapheneoxide and their nanocomposites. Nano Mater. Sci. 2019, 1, 31–47. [Google Scholar] [CrossRef]
  8. Roweley-Neale, S.J.; Randviir, E.P.; Abo Dena, A.S.; BanKs, C.E. An overview of recent applications of reduced graphene oxide as a basis of electroanalytical sensing platforms. Appl. Mater. Today 2018, 10, 218–226. [Google Scholar] [CrossRef]
  9. Hummers, W.S.; Offeman, R.E. Preparation of graphitic oxide. J. Am. Chem. Soc. 1958, 80, 1339. [Google Scholar] [CrossRef]
  10. Zhao, J.; Liu, L.; Li, F. Graphene Oxide: Physics and Application; Springer: Berlin/Heidelberg, Germany, 2015; ISBN 978-3662448281. [Google Scholar]
  11. Longo, A.; Verrucchi, R.; Aversa, L.; Tatti, R.; Ambrosio, A.; Orabona, E.; Coscia, U.; Carotenuto, G.; Maddalena, P. Graphene oxide prepared by graphene nanoplatelets and reduced by laser treatment. Nanotecnology 2017, 28, 224002. [Google Scholar] [CrossRef]
  12. Sun, L.; Fugetsu, B. Mass production of graphene oxide from expanded graphite. Mater. Lett. 2013, 109, 207–210. [Google Scholar] [CrossRef] [Green Version]
  13. Songfen, P.; Hui-Ming, C. The reduction of graphene oxide. Carbon 2012, 50, 3210. [Google Scholar]
  14. Seung, H.H. Thermal Reduction of Graphene Oxide—Physics and Applications of Graphene—Experiments; Mikhailov, S., Ed.; InTech: Rijeka, Yugoslavia, 2011. [Google Scholar] [CrossRef]
  15. Park, S.; An, J.; Potts, J.R.; Velamakanni, A.; Murali, S.; Ruoff, R.S. Hydrazine-reduction of graphite- and graphene oxide. Carbon 2011, 49, 3019–3023. [Google Scholar] [CrossRef]
  16. Huang, L.; Liu, Y.; Ji, L.C.; Xie, Y.Q.; Wang, T.; Shi, W.Z. Pulsed laser assisted reduction of graphene oxide. Carbon 2011, 49, 2431–2436. [Google Scholar] [CrossRef]
  17. Zhu, Y.; Murali, S.; Stoller, M.D.; Velamakanni, A.; Piner, R.D.; Ruoff, R.S. Microwave assisted exfoliation and reduction of graphite oxide for ultracapacitors. Carbon 2010, 48, 2118–2122. [Google Scholar] [CrossRef]
  18. Hassan, H.M.A.; Abdelsayed, V.; Khder, A.E.R.S.; AbouZeid, K.M.; Terner, J.; El-Shall, M.S.; Al-Resayes, S.I.; El-Azhary, A.A. Microwave synthesis of graphene sheets supporting metal nanocrystals in aqueous and organic media. J. Mater. Chem. 2009, 19, 3832–3837. [Google Scholar] [CrossRef]
  19. Furst, A.; Berlo, R.C.; Hooton, S. Hydrazine as a reducing agent for organic compounds (catalytic hydrazine reductions). Chem. Rev. 1965, 65, 51–68. [Google Scholar] [CrossRef]
  20. Bo, Z.; Zhu, W.; Tu, X.; Yang, Y.; Mao, S.; He, Y.; Chen, J.; Yan, J.; Cen, K. Instantaneous reduction of graphene oxide paper for supercapacitor electrodes with unimpeded liquid permeation. J. Phys. Chem. C 2014, 118, 13493–13502. [Google Scholar] [CrossRef]
  21. Abdelsayed, V.; Moussa, S.; Hassan, H.; Aluri, H.S.; Collinson, M.M.; El-Shall, M.S. Photothermal deoxygenation of graphite oxide with laser excitation in solution and graphene-aided increase in water temperature. J. Phys. Chem. Lett. 2010, 1, 2804–2809. [Google Scholar] [CrossRef]
  22. Gao, W.; Singh, N.; Song, L.; Liu, Z.; Reddy, A.L.; Ci, L.; Vajtai, R.; Zhang, Q.; Wei, B.; Ajayan, P.M. Direct laser writing of micro-supercapacitors on hydrated graphite oxide films. Nat. Nanotechnol. 2011, 6, 496–500. [Google Scholar] [CrossRef] [PubMed]
  23. Zhou, Y.; Bao, Q.; Varghese, B.; Tang, L.A.; Tan, C.K.; Sow, C.H.; Loh, K.P. Microstructuring of graphene oxide nanosheets using direct laser writing. Adv. Mater. 2010, 22, 67–71. [Google Scholar] [CrossRef]
  24. Zhang, Y.; Guo, L.; Wei, S.; He, Y.; Xia, H.; Chen, Q.; Sun, H.-B.; Xiao, F.-S. Direct imprinting of microcircuits on graphene oxides film by femtosecond laser reduction. Nano Today 2010, 5, 15–20. [Google Scholar] [CrossRef]
  25. Sokolov, D.A.; Shepperd, K.R.; Orlando, T.M. Formation of graphene features from direct laser-induced reduction of graphite oxide. J. Phys. Chem. Lett. 2010, 1, 2633–2636. [Google Scholar] [CrossRef]
  26. Sokolov, D.A.; Rouleau, C.M.; Geohegan, D.B.; Orlando, T.M. Excimer laser reduction and patterning of graphite oxide. Carbon 2013, 53, 81–89. [Google Scholar] [CrossRef]
  27. Orabona, E.; Ambrosio, A.; Longo, A.; Carotenuto, G.; Nicolais, L.; Maddalena, P. Holographic patterning of graphene-oxide films by light-driven reduction. Opt. Lett. 2014, 39, 4263–4266. [Google Scholar] [CrossRef] [PubMed] [Green Version]
  28. Karrer, P. The Chemistry of Vitamins A and C. Chem. Rev. 1934, 14, 17–30. [Google Scholar] [CrossRef]
  29. Loeffler, H.J.; Ponting, J.D. Ascorbic Acid. Ind. Eng. Chem. Anal. Ed. 1942, 14, 846–849. [Google Scholar] [CrossRef]
  30. Austin, J.; Partridge, D.A. Vitamin C: Its Chemistry and Biochemistry; Davies, M.B., Ed.; Royal Society of Chemistry: London, UK, 1991. [Google Scholar]
  31. Zhang, J.; Yang, H.; Sheng, G.; Cheng, P.; Zang, J.; Guo, S. Reduction of graphene oxide vial-ascorbic acid. Chem. Commun. 2010, 46, 1112–1114. [Google Scholar] [CrossRef]
  32. Liu, J.; Liu, L.; Wu, X.; Zhang, X.; Li, T. Environmentally friendly synthesis of graphene–silver composites with surface-enhanced Raman scattering and antibacterial activity via reduction with l-ascorbic acid/water vapor. Newj. Chem. 2015, 39, 5272–5281. [Google Scholar] [CrossRef]
  33. Habte, A.T.; Ayele, D.W. Synthesis and characterization of reduced graphene oxide (rgo) started from graphene oxide (go) using the tour method with different Parameters. Adv. Mater. Sci. Eng. 2019, 15, 1–9. [Google Scholar] [CrossRef] [Green Version]
  34. Fernández-Merino, M.J.; Guardia, L.; Paredes, J.L.; Villar-Rodil, S.; Solís-Fernández, P.; Martínez-Alonso, A.; Tascón, J.M.D. Vitamin C is an ideal substitute for hydrazine in the reduction of graphene oxide suspensions. J. Phys. Chem. C 2010, 214, 6426–6432. [Google Scholar] [CrossRef]
  35. Chen, D.; Li, L.; Guo, L. an environment-friendly preparation of reduced graphene oxide nanosheets via amino acid. Nanotecnology 2011, 22, 325601. [Google Scholar] [CrossRef] [PubMed]
  36. Bose, S.; Kuila, T.; Mishra, A.K.; Kim, N.H.; Lee, J.H. Dual role of glycine as a chemical functionalize and a reducing agent in the preparation of graphene: An environmentally friendly method. J. Mater. Chem. 2012, 22, 9696–9703. [Google Scholar] [CrossRef]
  37. Wang, Y.; Shi, Z.; Yin, J. Facile Synthesis of soluble graphene via a green reduction of graphene oxide in tea solution and its biocomposites. Acs Appl. Mater. Interfaces 2011, 3, 1127–1133. [Google Scholar] [CrossRef]
  38. Costa, M.N.; Veigas, B.; Jacob, J.M.; Santos, D.S.; Gomes, J.; Baptista, P.V.; Martins, R.; Inácio, J.; Fortunato, E. A low cost, safe, disposable, rapid and self-sustainable paper-based platform for diagnostic testing: Lab-on-paper. Nanotechnology 2014, 25, 094006. [Google Scholar] [CrossRef] [Green Version]
  39. Lua, Y.; Wang, H.; Zhao, W.; Zhang, M.; Qin, H.; Xie, Y. Flexible, stretchable sensors for wearable health monitoring: Sensing mechanisms, materials, fabrication strategies and features. Sensor 2018, 18, 645–652. [Google Scholar]
  40. Akyazi, T.; Basabe-Desmonts, L.; Benito-Lopez, F. Review on microfluidic paper-based analytical devices towards commercialization. Anal. Chim. Acta 2017, 1001, 1–17. [Google Scholar] [CrossRef] [PubMed]
  41. Song, S.; Zhai, Y.; Zhang, Y. Bioinspired graphene oxide/polymer nanocomposite paper with high strength, toughness, and dielectric constant. Appl. Mater. Interfaces 2016, 8, 31264–31272. [Google Scholar] [CrossRef] [PubMed]
  42. Saha, B.; Baek, S.; Lee, J. Highly sensitive bendable and foldable paper sensors based on reduced graphene oxide. Appl. Mater. Interfaces 2017, 9, 4658–4666. [Google Scholar] [CrossRef]
  43. Luong, N.D.; Pahimanolis, N.; Hippi, U.; Korhonen, J.T.; Ruokolainen, J.; Johansson, L.-S.; Namd, J.-D.; Seppälä, J. Graphene/cellulose nanocomposite paper with high electrical and mechanical performances. J. Mater. Chem. 2011, 21, 13991–13998. [Google Scholar] [CrossRef]
  44. Faniyi, I.O.; Fasakin, O.; Olofnjana, B.; Adekunle, A.S.; Oluwasusi, T.V.; Eleruja, M.A.; Ajayi, E.O.B. The comparative analyses of reduced graphene oxide (RGO) prepared via green, mild and chemical approaches. SN Appl. Sci. 2019, 1, 1181. [Google Scholar] [CrossRef] [Green Version]
  45. Buerger, M.J. X-Ray Crystallography; Wiley: New York, NY, USA, 1942. [Google Scholar]
  46. Cullity, B.D. Elements of X-Ray Diffraction, Reading; Addison-Wesley: Boston, MA, USA, 1956. [Google Scholar]
  47. Sharma, R.; Chadha, N.; Saini, P. Determination of defect density, crystallite size and number of graphene layers in graphene analogues using X-ray diffraction and Raman spectroscopy. Indian J. Pure Appl. Phys. 2017, 55, 625–629. [Google Scholar]
  48. Dimotrov, A.S.; Kralchevsky, P.A.; Nicolov, A.D.; Noshi, H.; Matsumoto, M. Contact angle measurements with sessile drops and bubbles. J. Colloid Interface Sci. 1991, 145, 279–282. [Google Scholar] [CrossRef]
  49. Kim, J.; Khoh, W.-H.; Weea, B.-H.; Hong, J.-D. Fabrication of flexible reduced graphene oxide–TiO2 freestanding films for supercapacitor application. Rsc Adv. 2015, 5, 9904–9911. [Google Scholar] [CrossRef]
  50. Cho, Y.H.; Kim, H.W.; Lee, H.D.; Shin, J.E.; Yoo BM Park, H.B. Water and ion sorption, diffusion, and transport in graphene oxide membranes revisited. J. Membr. Sci. 2017, 544, 425–435. [Google Scholar] [CrossRef]
  51. Chua, C.K.; Pumera, M. Chemical reduction of graphene oxide: A synthetic chemistry viewpoint. Chem. Soc. Rev. 2014, 43, 291–312. [Google Scholar] [CrossRef] [PubMed]
  52. Gao, J.; Liu, F.; Liu, Y.; Ma, N.; Wang, Z.; Zhang, X. Environment-Friendly Method to Produce Graphene That Employs Vitamin C and Amino Acid. Chem. Mater. 2010, 22, 2213–2218. [Google Scholar] [CrossRef]
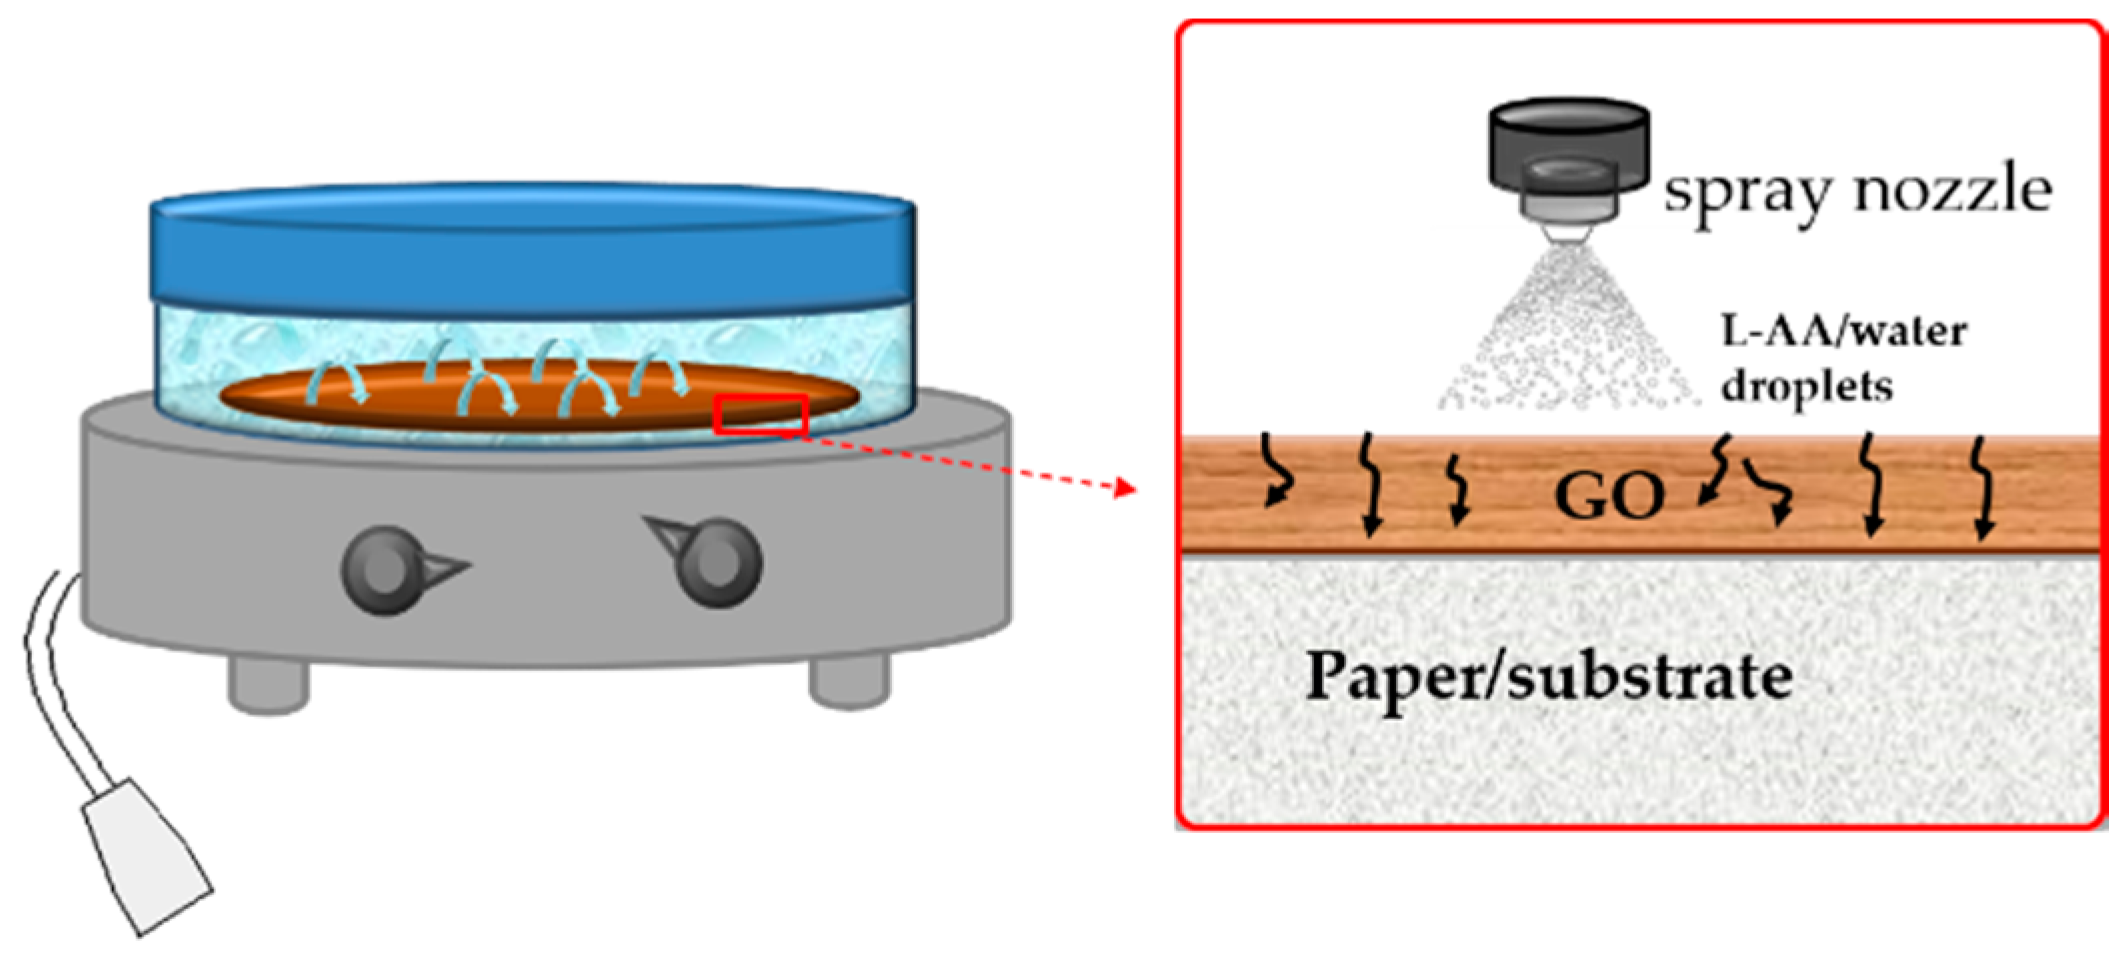
Figure 1. Schematization of experimental set-up.
Coatings 10 00693 g001
Figure 2. Graphene oxide (GO) supported on paper before (a) and after (b) treatment with an aqueous L-ascorbic acid (L-aa) solution.
Coatings 10 00693 g002
Figure 3. Surface morphologies, obtained by digital USB-microscopy, of: GO coating (a) and r-GO coating (b) on the paper substrate (100×).
Coatings 10 00693 g003
Figure 4. Fourier transform infrared spectroscopy (FT-IR) spectra of paper (green line), GO supported on paper before (black line), and after (red line) the treatment with L-aa aqueous solution.
Coatings 10 00693 g004
Figure 5. X-ray Diffraction (XRD) diffractogram of the paper substrate (a) and GO supported on paper before (b) and after (c) the treatment with L-aa aqueous solution. The inset in Figure 4c represents a magnification of the r-GO peak (100).
Coatings 10 00693 g005
Figure 6. Scanning electron microscopy (SEM) micrographs of paper substrate (a,b), GO supported on paper (c,d), and GO supported on paper after treatment with L-aa aqueous solution (e,f).
Coatings 10 00693 g006
Figure 7. Cross-section SEM-micrographs of GO (a,b) and r-GO (c,d) supported on paper.
Coatings 10 00693 g007
Figure 8. Energy dispersive X-ray spectra of the GO coating layer on paper substrate before (a) and after (b) the chemical reduction treatment by L-aa (insets give the elemental compositions of the layer).
Coatings 10 00693 g008
Figure 9. Water contact angle for GO supported on paper before (a) and after (b) the chemical reduction treatment.
Coatings 10 00693 g009
Figure 10. Schematic representation of the L-aa diffusion process inside the swollen GO layer.
Coatings 10 00693 g010
Figure 11. Schematic representation of reaction pathway.
Coatings 10 00693 g011
Table 1. Summary of XRD calculations for the system before and after the chemical treatment.
(hkl)Position
(2θ)
Area
(Counts)
FWHM
(2θ)
d
(nm)
L(hkl)
(nm)
n (Counts)
GO(002)10.622699.590.660.83211.7215
GO(002)11.53876.680.390.76719.9527
r-GO(002)25.39123.050.280.35427.2179
(100)43.0254.360.37-41.03-