Coating Deterioration and Underlying Metal Corrosion Processes in Water-Line Area: Role of DACs

 ,
, 
Abstract
1. Introduction
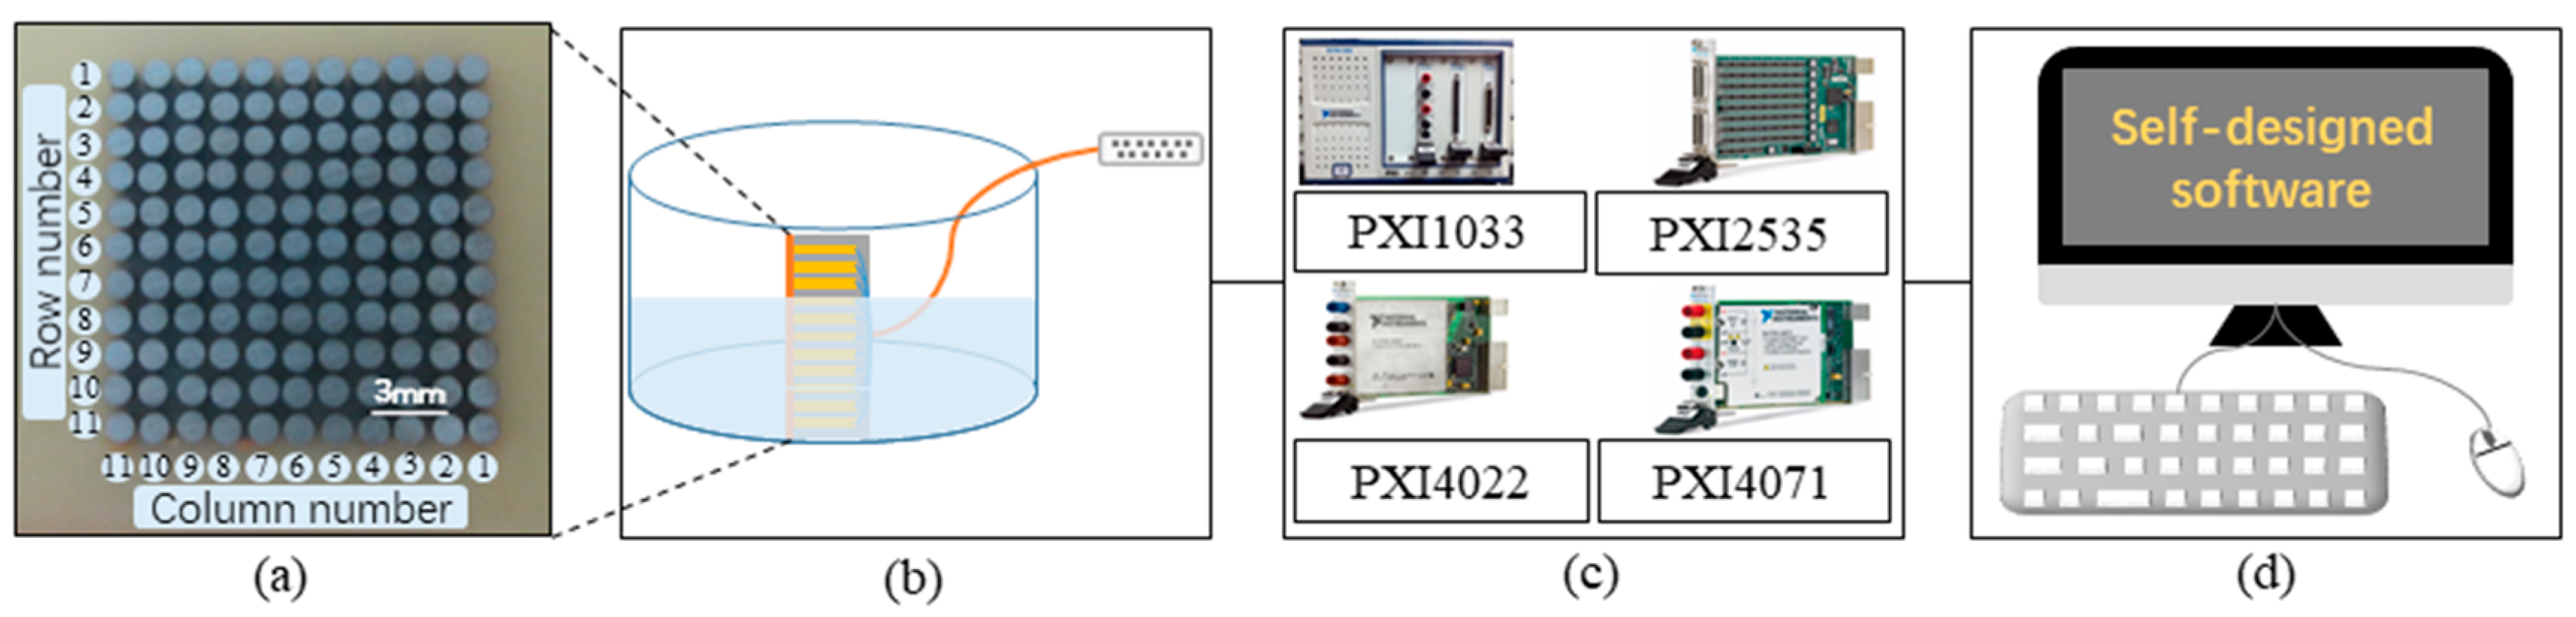
2. Experimental
3. Results and Discussion
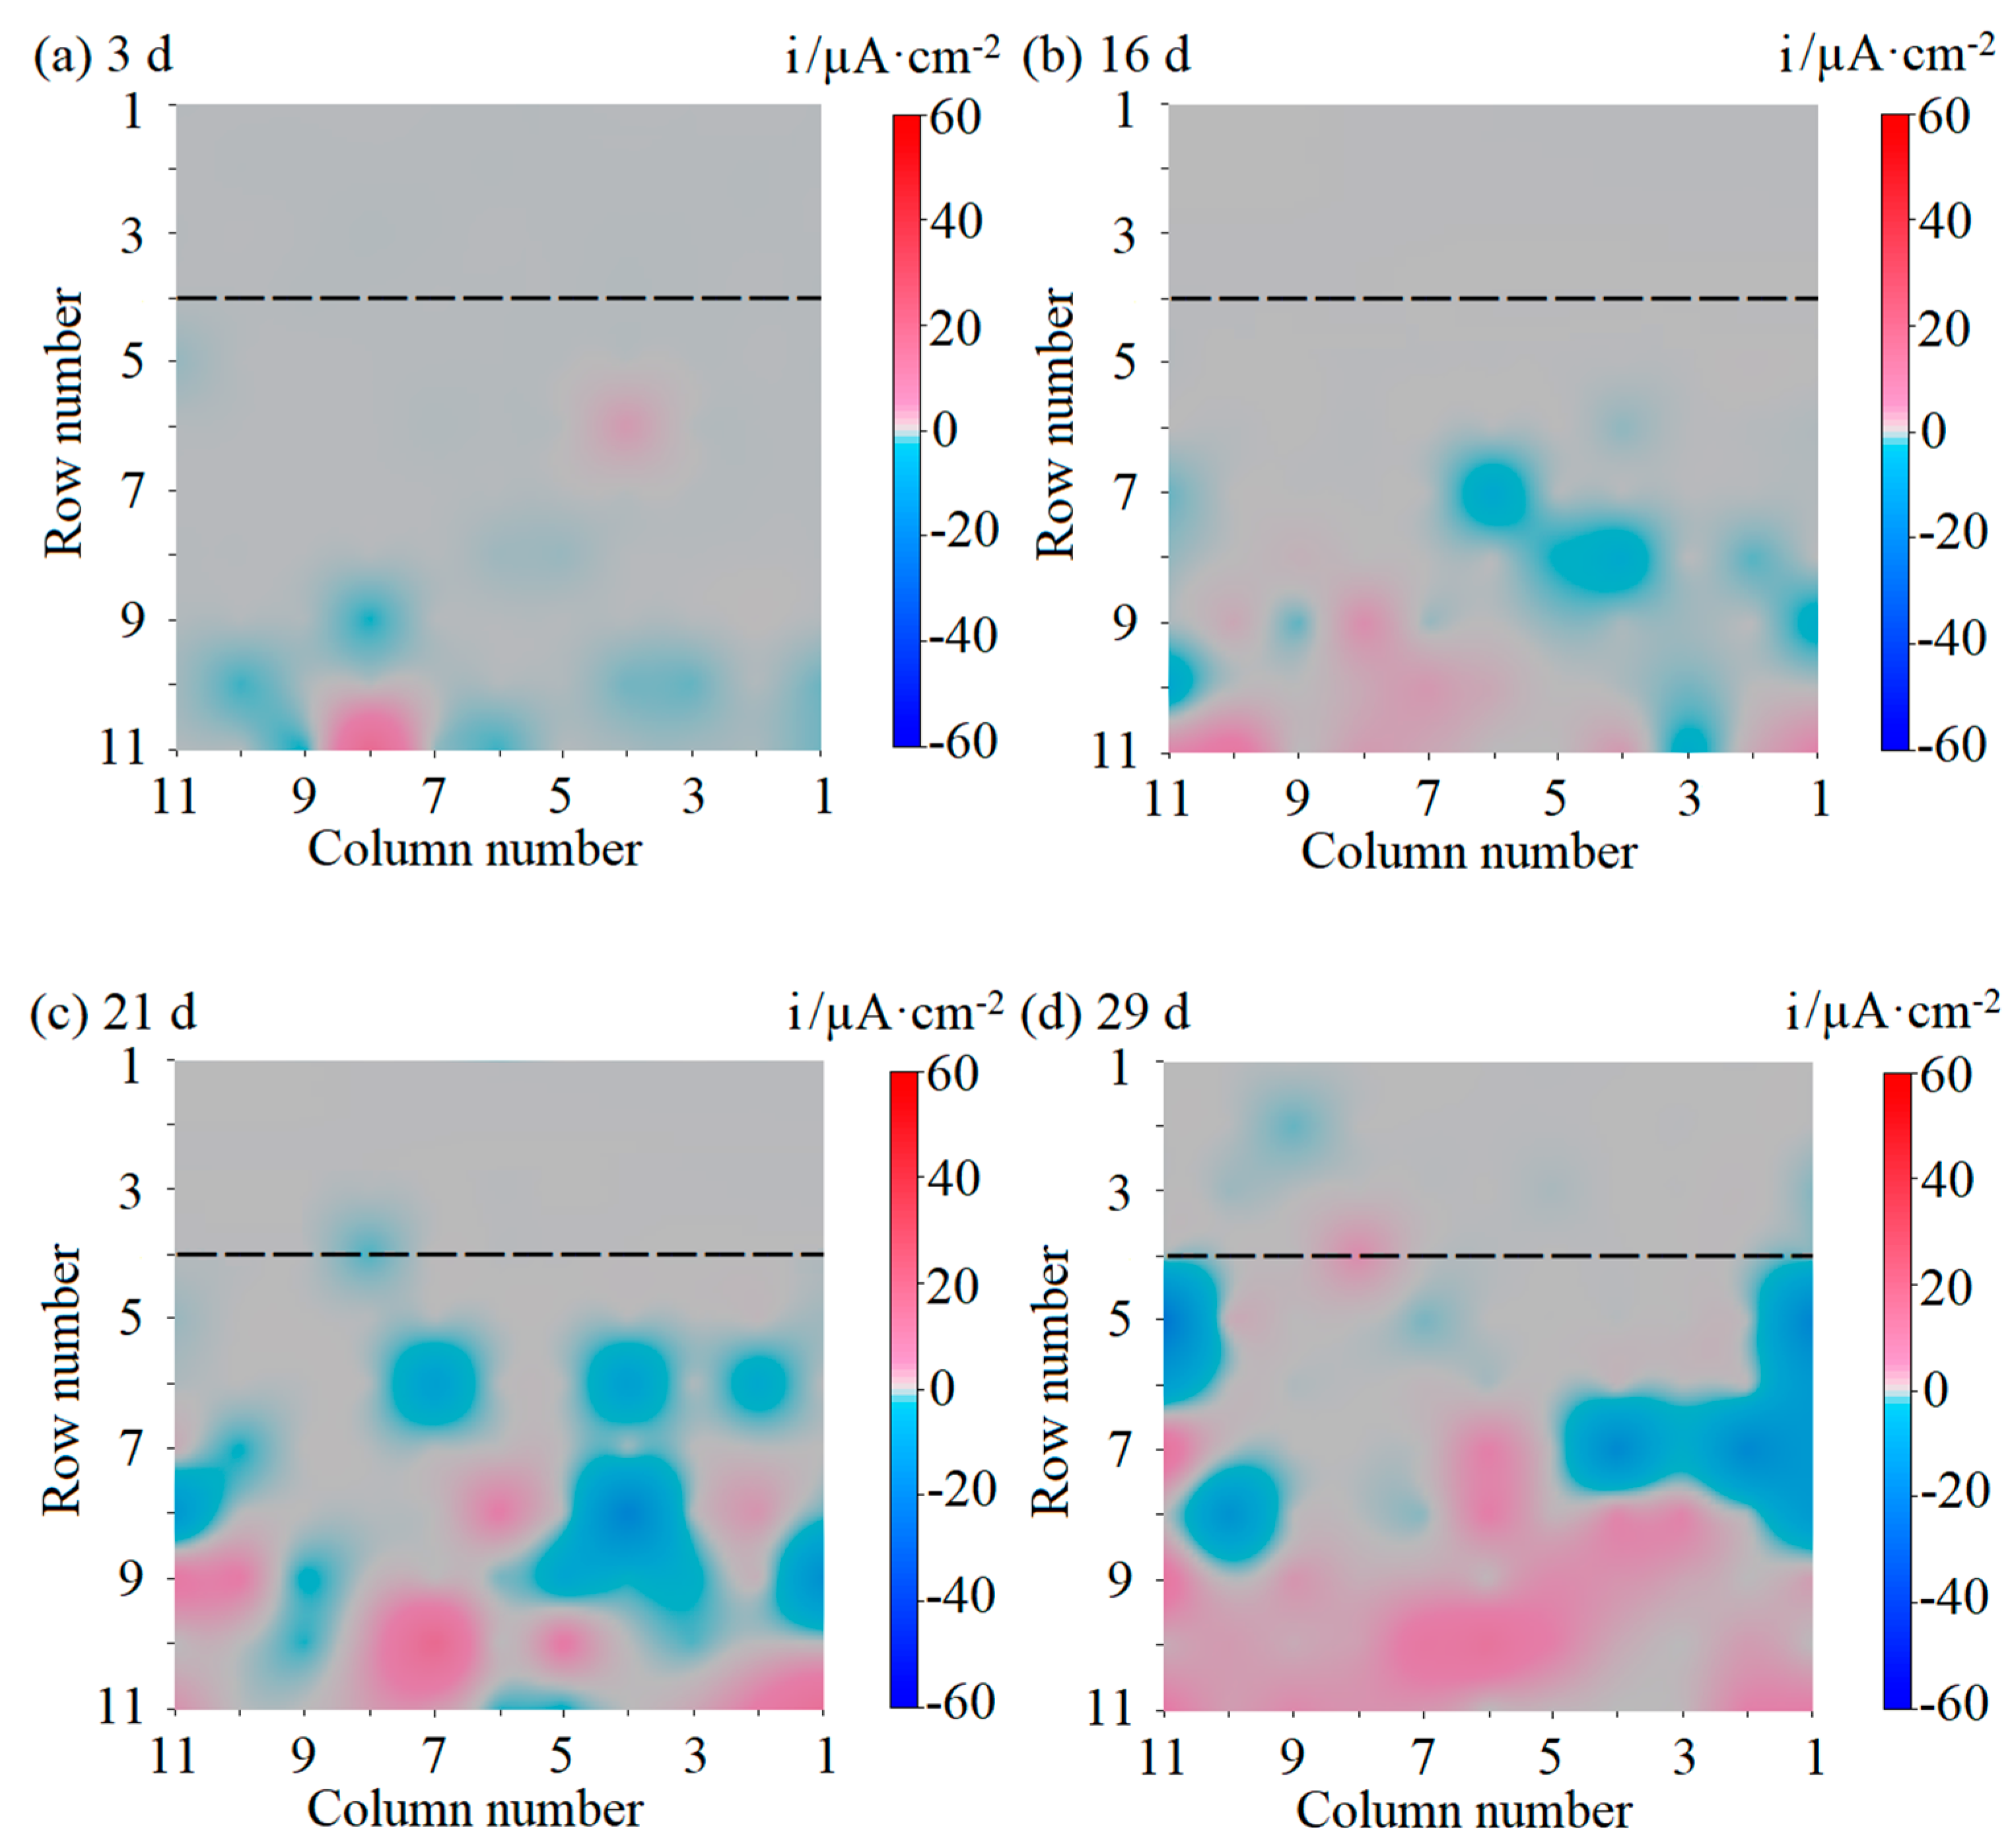
3.1. Galvanic Current Distribution Maps of the WBE
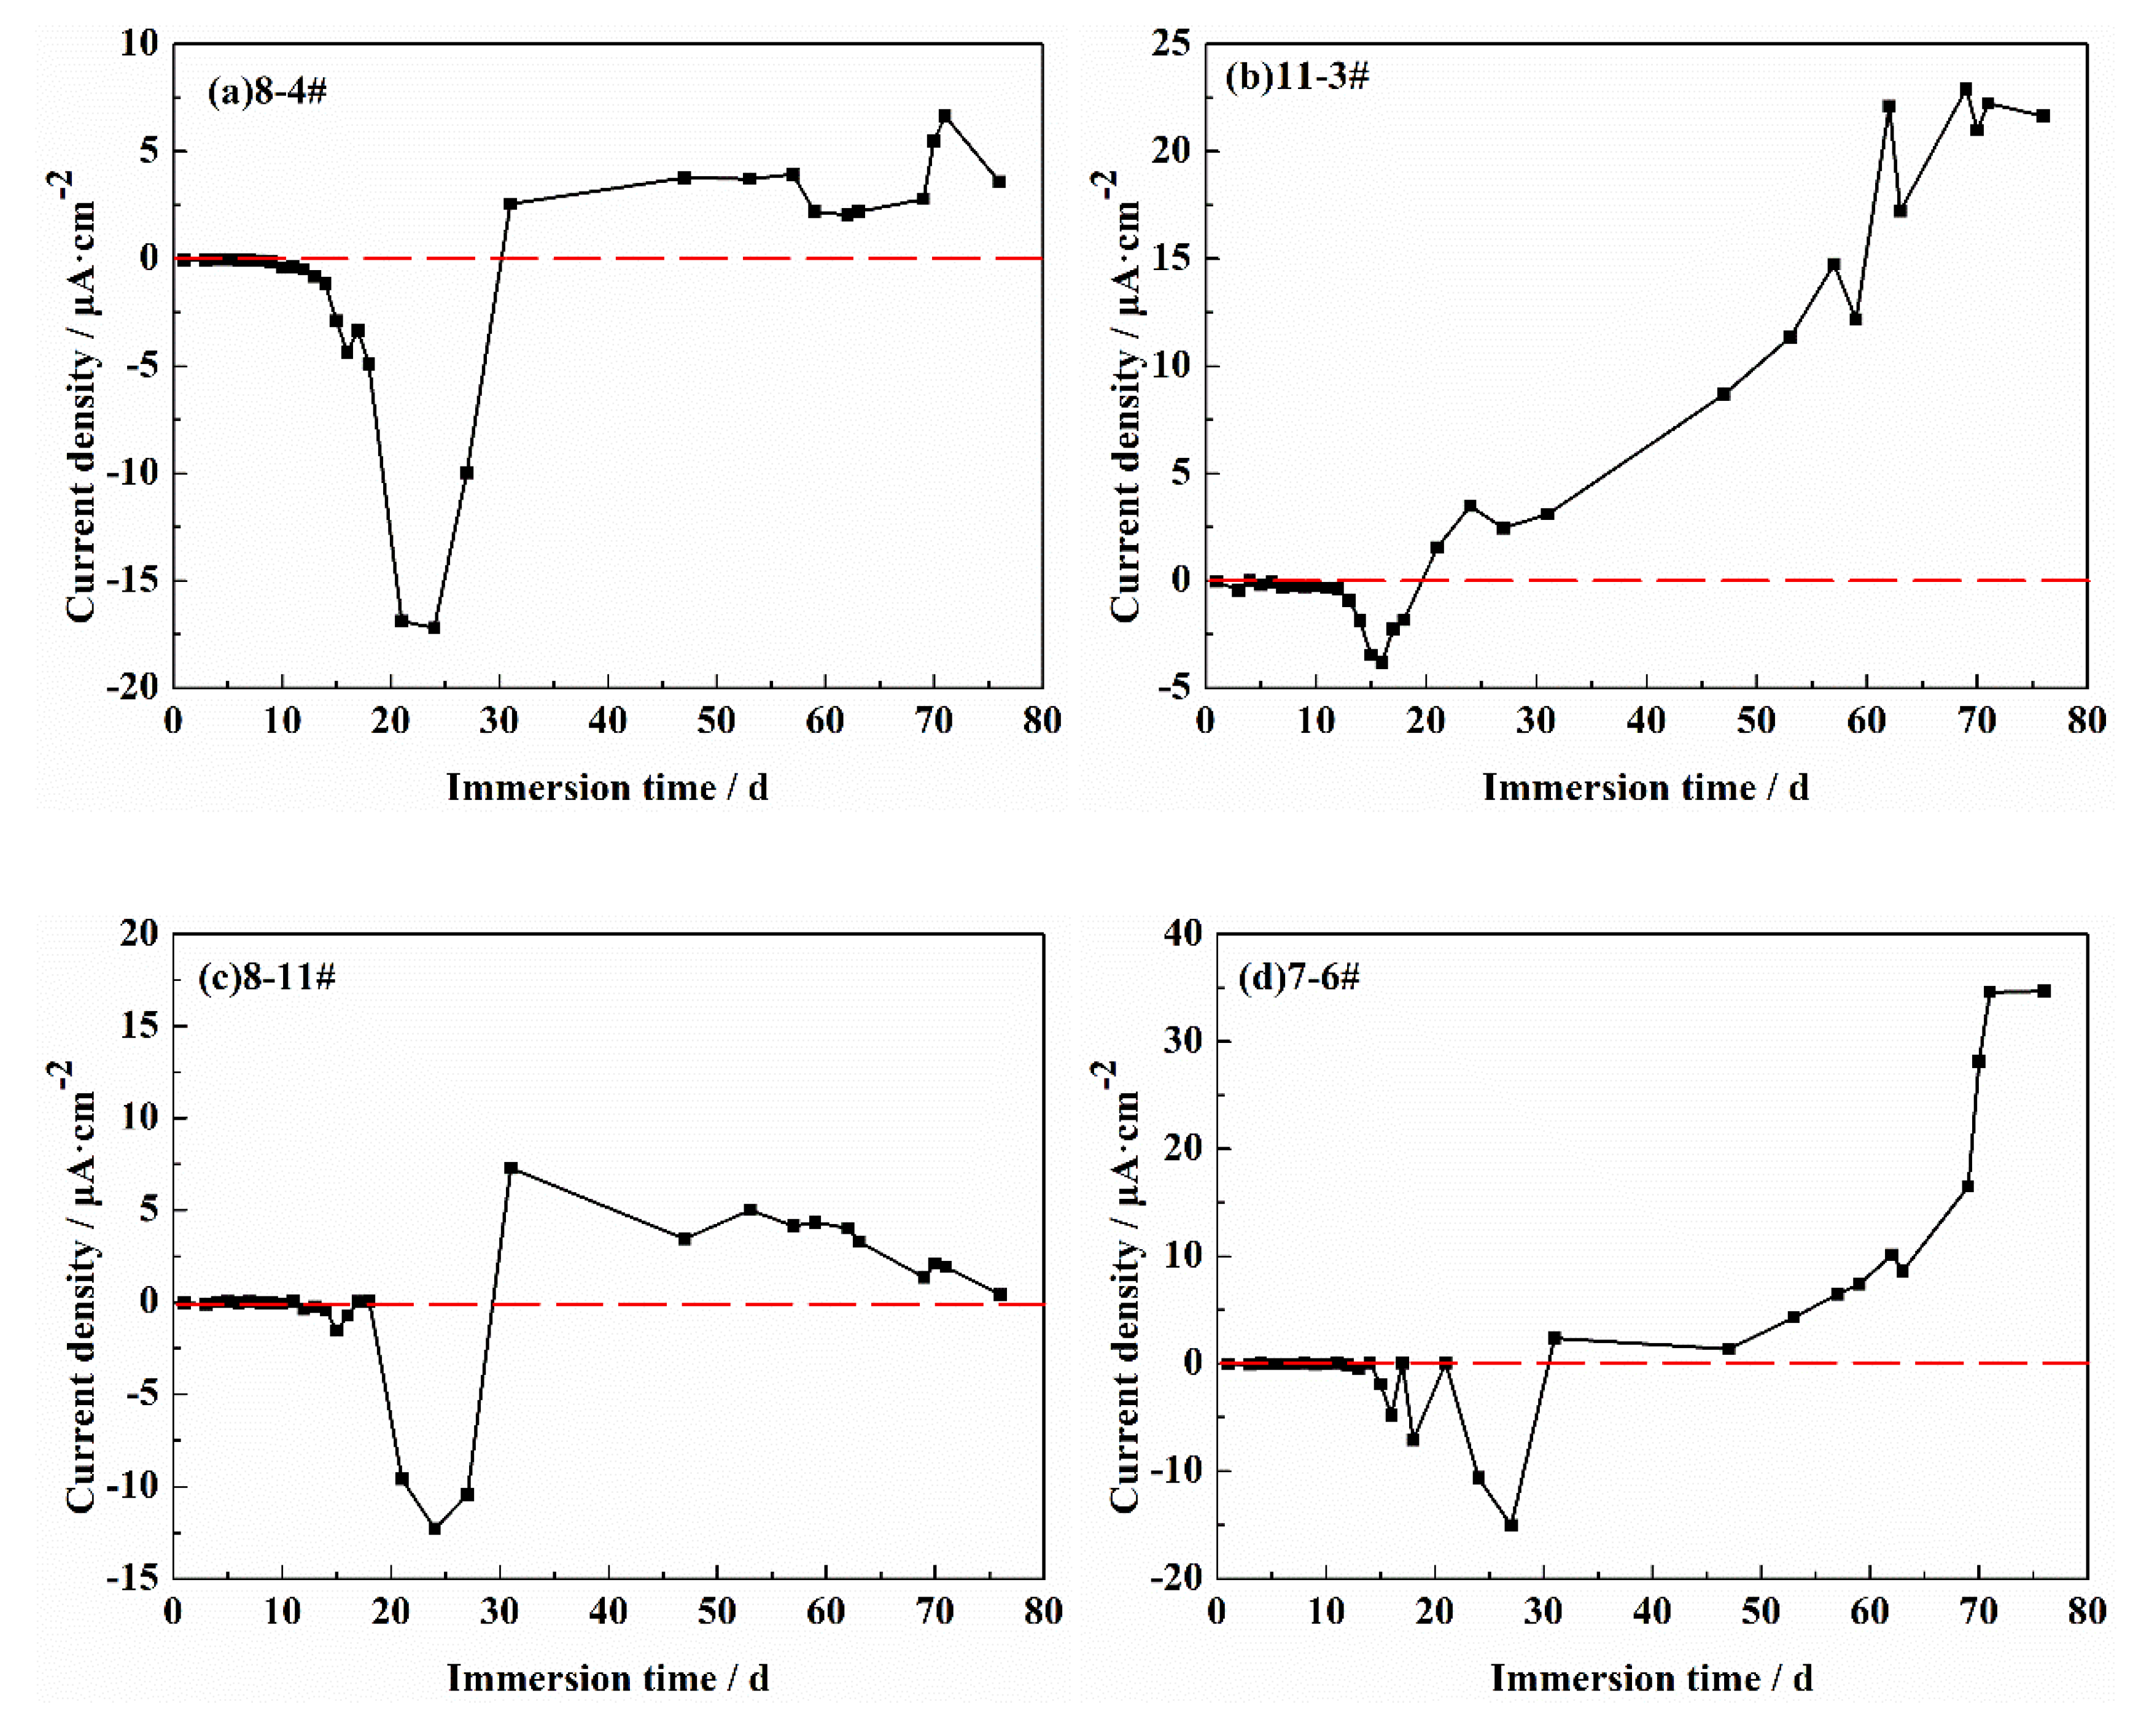
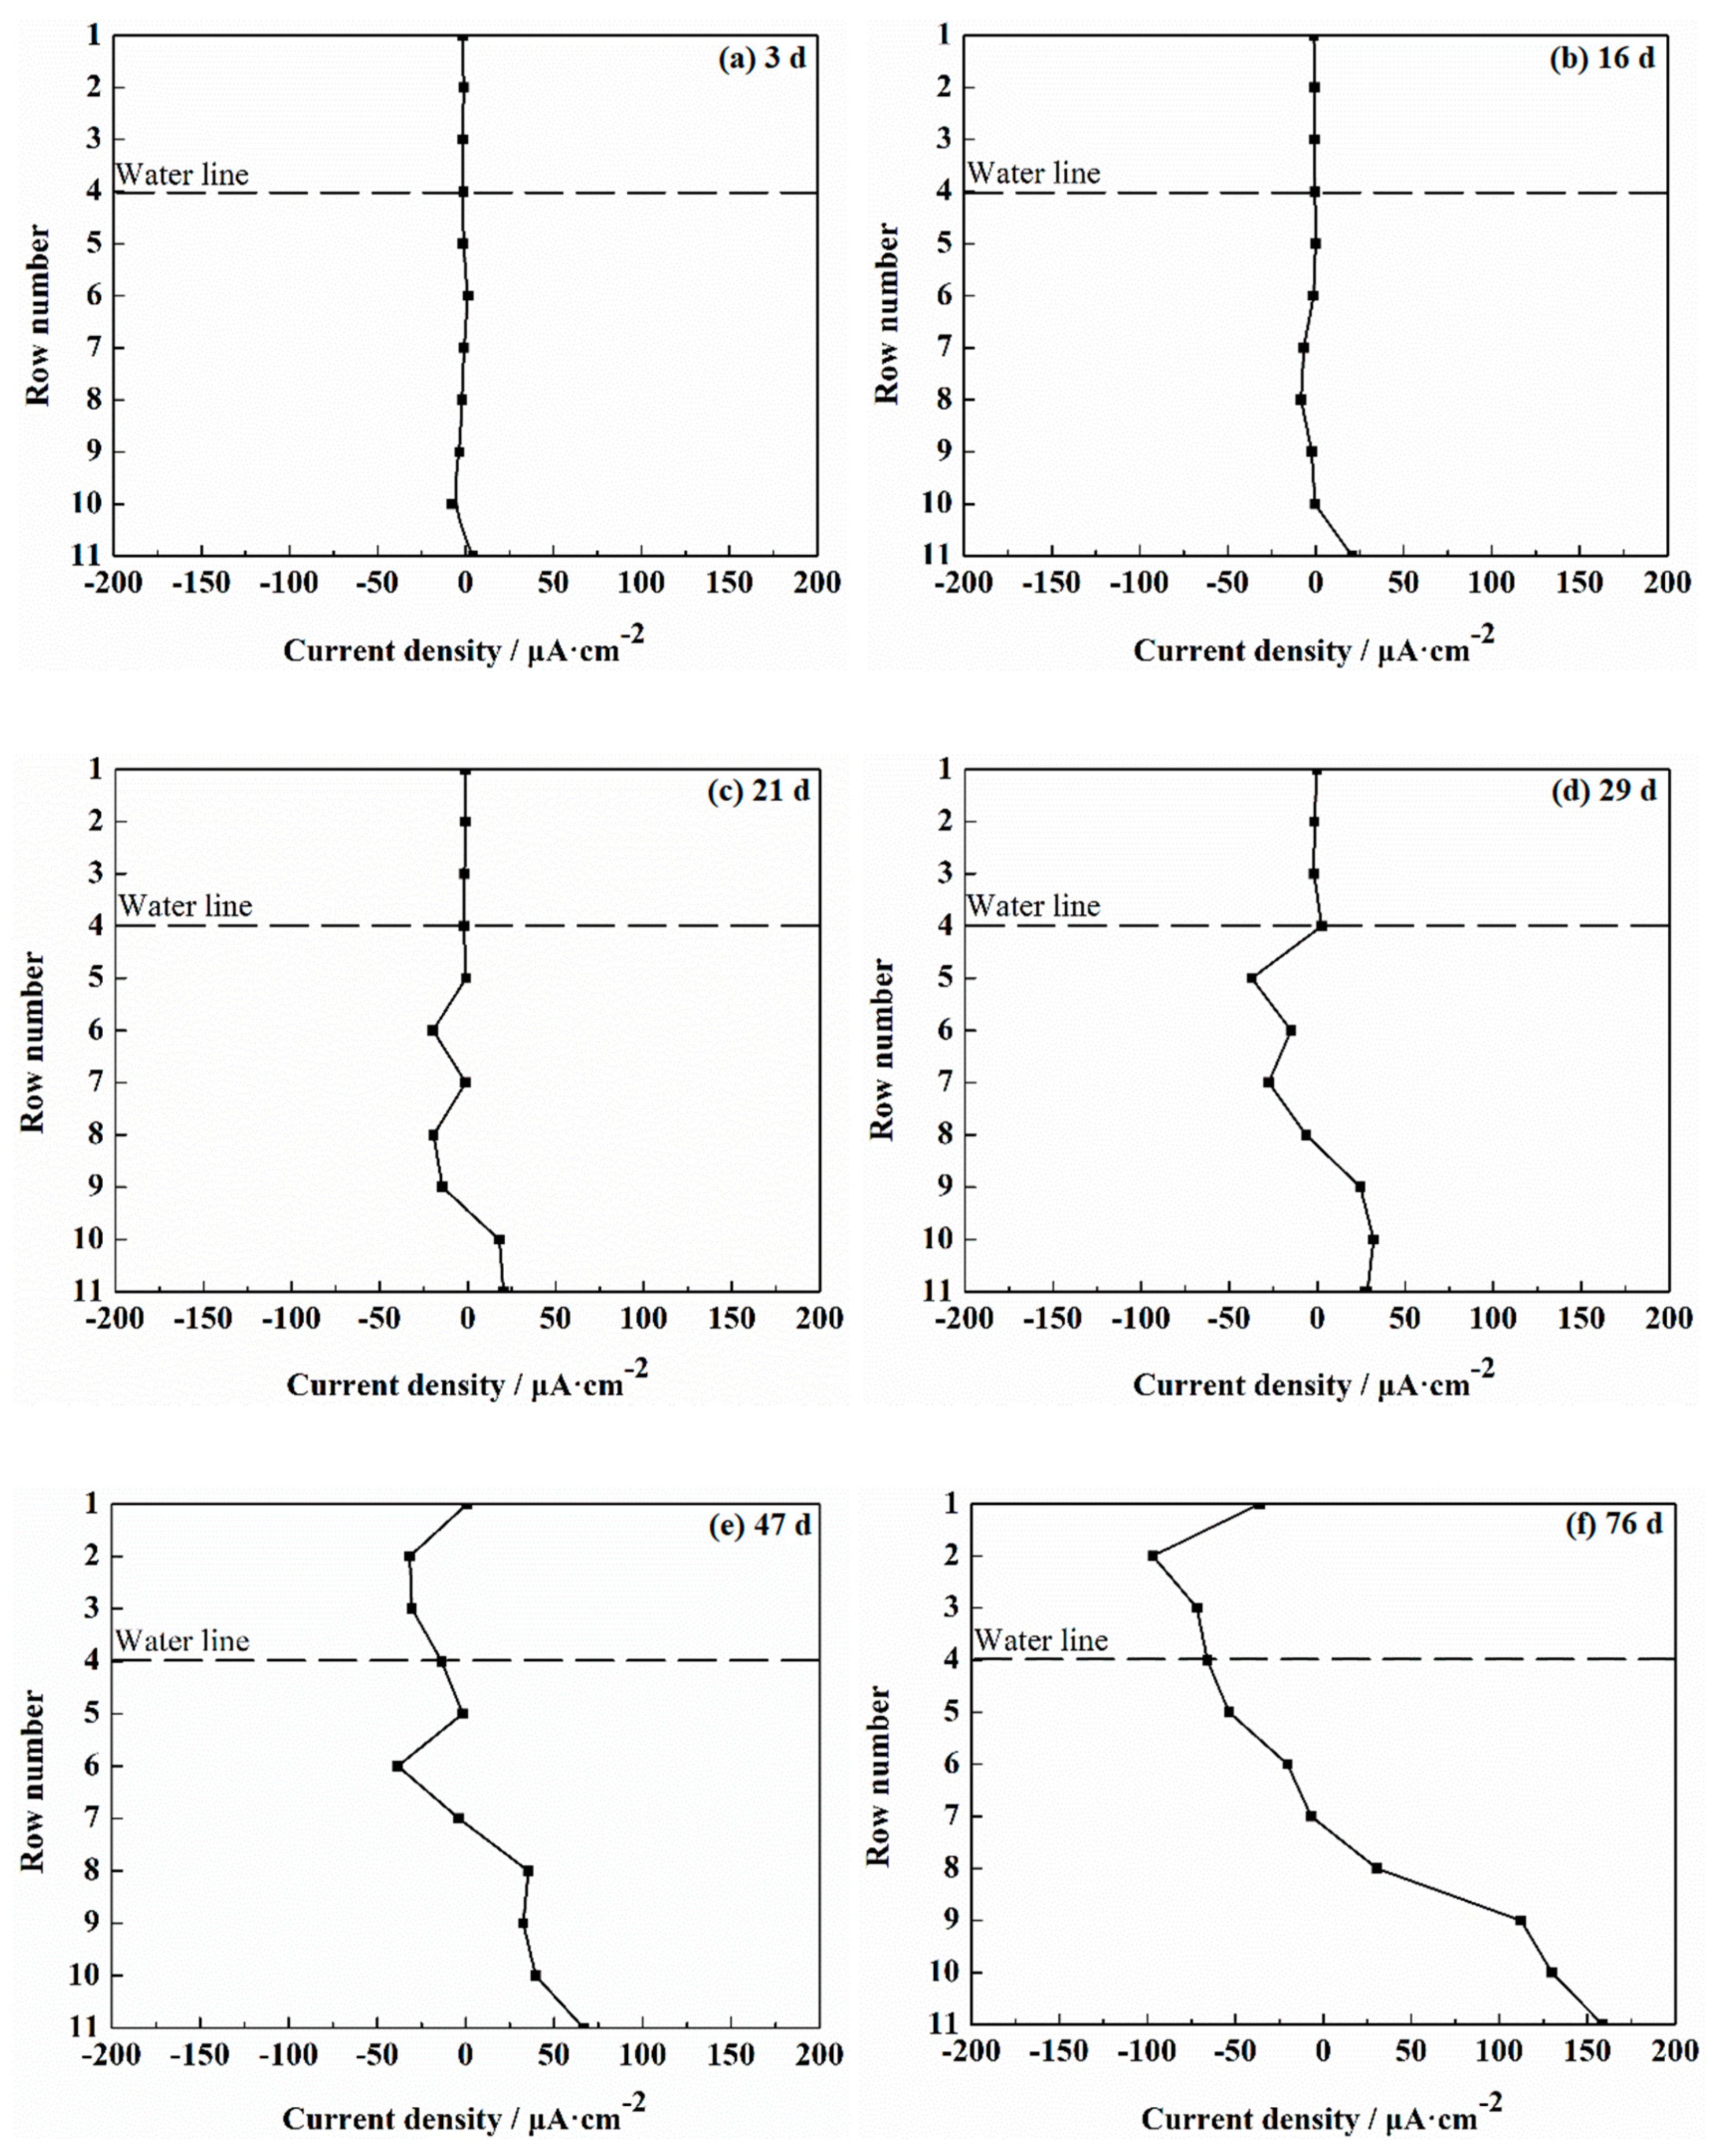
3.2. The Current Density Vector Sum
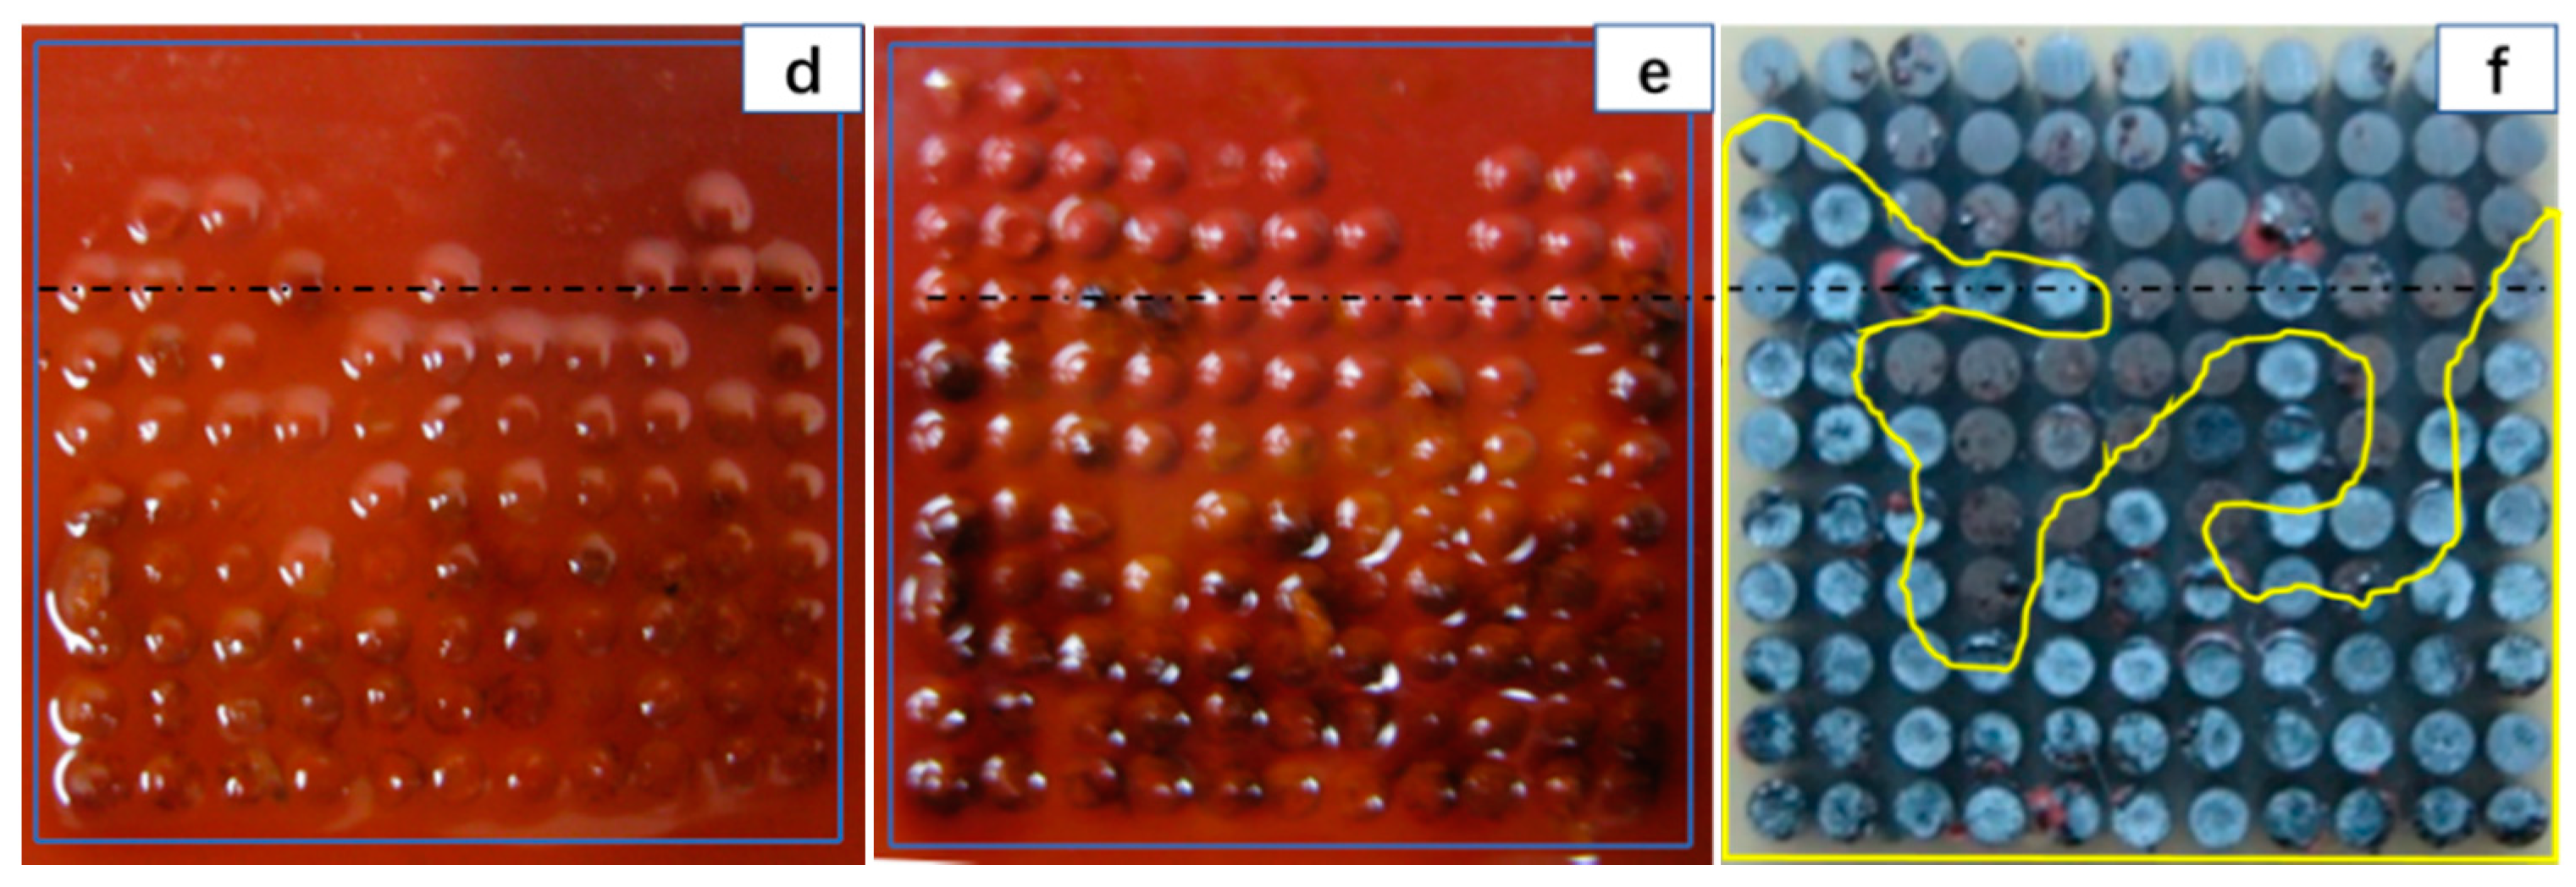
3.3. Morphology of the Coating and Substrate Metal Surface
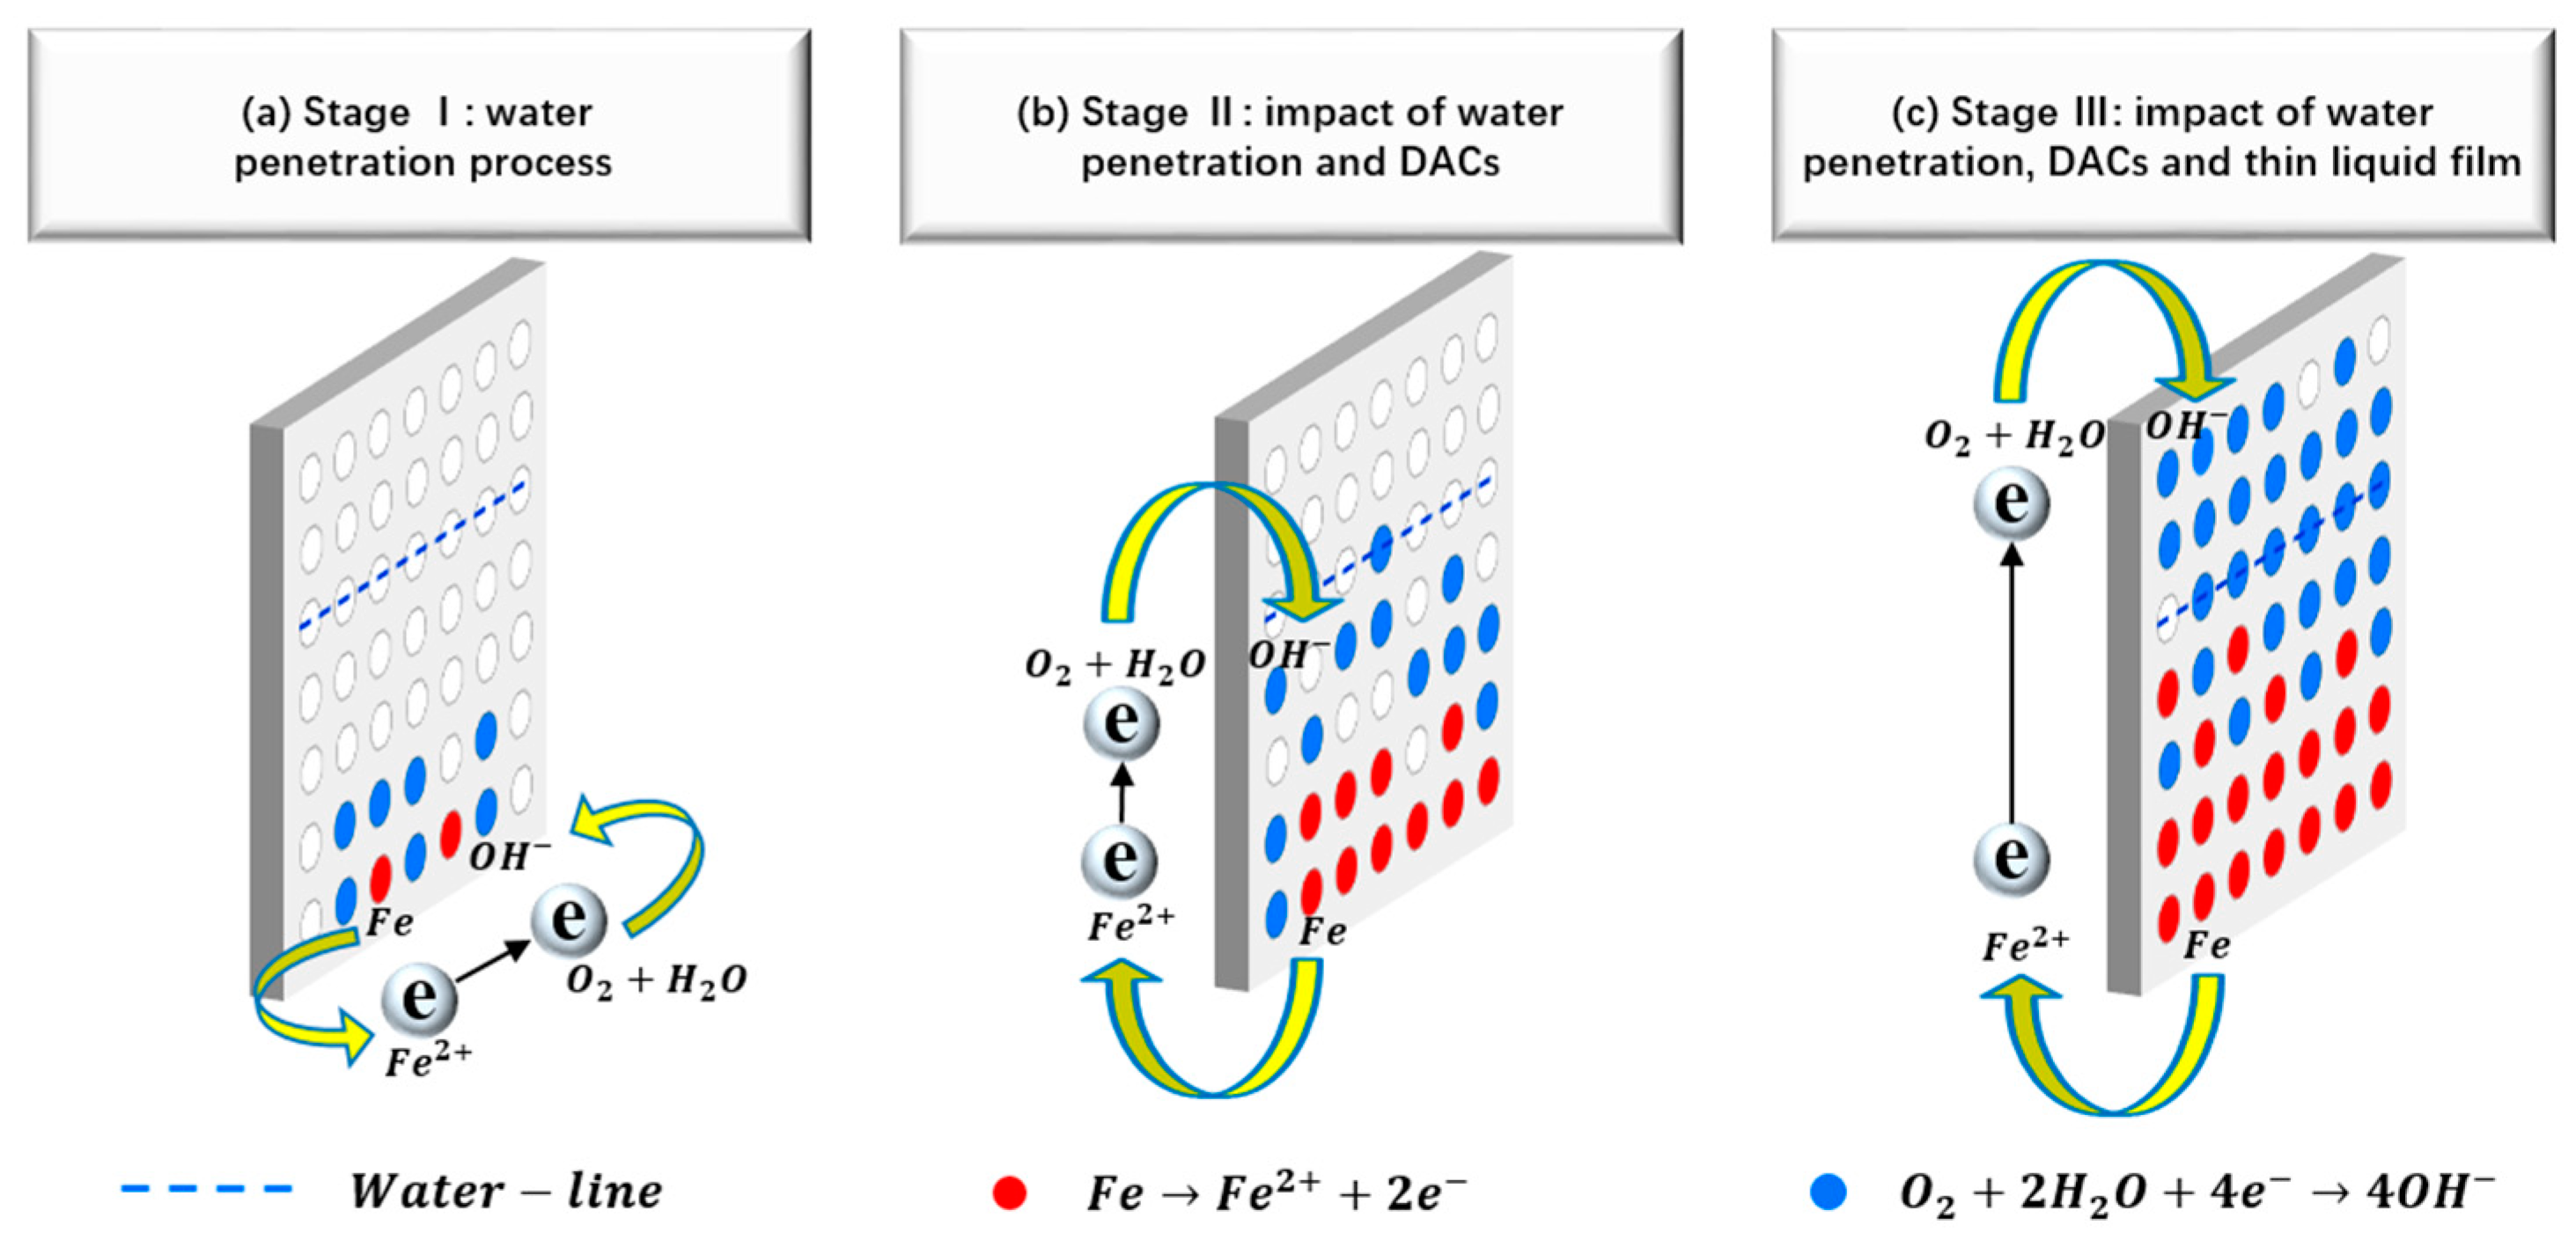
3.4. Coating Deterioration and Underlying Metal Corrosion Processes in Water-Line Area
4. Conclusions
Author Contributions
Funding
Conflicts of Interest
References
- Evans, U.R. The Corrosion and Oxidation of Metals: Scientific Principles and Practical Applications; Edward Arnold Pub. Ltd.: London, UK, 1960. [Google Scholar]
- Tomashov, N.D. The Theory of Corrosion and Protection of Metals; MacMillan: New York, NY, USA, 1966. [Google Scholar]
- Jeffrey, R.; Melchers, R.E. Corrosion of vertical mild steel strips in seawater. Corros. Sci. 2009, 51, 2291–2297. [Google Scholar] [CrossRef]
- Tan, Y.J.; Bailey, S.; Kinsella, B. Mapping non-uniform corrosion using the wire beam electrode method. III. water-line corrosion. Corros. Sci. 2001, 43, 1931–1937. [Google Scholar] [CrossRef]
- Tan, Y.J. Wire beam electrode: A new tool for studying localised corrosion and other heterogeneous electrochemical processes. Corros. Sci. 1998, 41, 229–247. [Google Scholar] [CrossRef]
- Chen, Y.; Zhang, W.; Wang, W.; Wang, J.; Wang, Q.; Cai, G. Evaluation of water-line area corrosion for Q235 steel by WBE technique. J. Chin. Soc. Corros. Prot. 2014, 34, 451–458. [Google Scholar] [CrossRef]
- Kong, D.; Wang, Y.; Zhang, W.; Wang, W.; Liu, X.; Wang, J. Correlation between electrochemical impedance and current distribution of carbon steel under organic coating. Mater. Corros. 2012, 63, 475–480. [Google Scholar] [CrossRef]
- Wang, W.; Zhang, X.; Wang, J. The influence of local glucose oxidase activity on the potential/current distribution on stainless steel: A study by the wire beam electrode method. Electrochim. Acta 2009, 54, 5598–5604. [Google Scholar] [CrossRef]
- Zhao, X.; Wang, J.; Wang, Y.; Kong, T.; Zhong, L.; Zhang, W. Analysis of deterioration process of organic protective coating using EIS assisted by SOM network. Electrochem. Commun. 2007, 9, 1394–1399. [Google Scholar] [CrossRef]
- Cao, C. Electrochemical Principle of Corrosion; Chemical Industry Press: Beijing, China, 2004; ISBN 7502551875. [Google Scholar]
- Ding, J.; Zhang, W.; Wang, J.; Chen, Y.; Yin, P.; Zhang, B. evaluation of water-line area corrosion for coating delamination by WBE technique-Ⅰ. J. Chin. Soc. Corros. Prot. 2016, 36, 463–470. [Google Scholar] [CrossRef]
- Morsch, S.; Lyon, S.; Gibbon, S.R. The degradation mechanism of an epoxy-phenolic can coating. Prog. Org. Coat. 2017, 102, 37–43. [Google Scholar] [CrossRef]
- Leng, A.; Streckel, H.; Stratmann, M. The delamination of polymeric coatings from steel. Part 1: Calibration of the Kelvinprobe and basic delamination mechanism. Corros. Sci. 1999, 41, 547–578. [Google Scholar] [CrossRef]
- Hamade, R.F.; Dillard, D.A. Assessing The effects of shear compression and peel on the cathodic degradation of elastomer-to-metal adhesive bonds. Int. J. Adhes. Adhes. 2005, 25, 147–163. [Google Scholar] [CrossRef]
- Reddy, B.; Sykes, J.M. Degradation of organic coatings in a corrosive environment: A study by scanning kelvin probe and scanning acoustic microscope. Prog. Org. Coat. 2005, 52, 280–287. [Google Scholar] [CrossRef]
- Jiang, J.; Wang, J.; Wang, W.; Zhang, W. Modeling influence of gas/liquid/solid three-phase boundary zone on cathodic process of soil corrosion. Electrochim. Acta 2009, 54, 3623–3629. [Google Scholar] [CrossRef]
- Tsuru, T.; Nishikata, A.; Wang, J. Electrochemical studies on corrosion under a water film. Mater. Sci. Eng. 1995, 198, 161–168. [Google Scholar] [CrossRef]
- Nishikata, A.; Ichihara, Y.; Hayashi, Y.; Tsuru, T. Influence of electrolyte layer thickness and pH on the initial stage of the atmospheric corrosion of iron. J. Electrochem. Soc. 1997, 144, 1244–1252. [Google Scholar] [CrossRef]
- Liu, Z.; Wang, W.; Wang, J.; Peng, X.; Wang, Y.; Zhang, P.; Wang, H.; Gao, C. Study of corrosion behavior of carbon steel under seawater film using the wire beam electrode method. Corros. Sci. 2014, 80, 523–527. [Google Scholar] [CrossRef]
- McCafferty, E. Introduction to Corrosion Science; Springer: New York, NY, USA, 2010; ISBN 9781441904546. [Google Scholar]
- Furbeth, W.; Stratmann, M. The delamination of polymeric coatings from electro galvanised steel—A mechanistic approach. P 1: Delamination from a defect with intact zinc layer. Corros. Sci. 2001, 43, 207–227. [Google Scholar] [CrossRef]
- Nazarov, A.P.; Thierry, D. Scanning Kelvin probe study of metal/polymer interfaces. Electrochim. Acta 2004, 49, 2955–2964. [Google Scholar] [CrossRef]
- Zhang, W.; Wang, J.; Zhao, Z.; Liu, X. EIS Study on the deterioration process of organic coatings under immersion and cyclic wet-dry conditions. J. Chin. Soc. Corros. Prot. 2011, 5, 329–335. [Google Scholar] [CrossRef]
- Zin, I.M.; Lyon, S.B.; Hussain, A. Under-film corrosion of epoxy-coated galvanised steel: An EIS and SVET study of the effect of inhibition at defects. Prog. Org. Coat. 2005, 52, 126–135. [Google Scholar] [CrossRef]
- Wu, J.; Wang, P.; Gao, J.; Tan, F.; Zhang, D.; Cheng, Y.; Chen, S. Comparison of water-line corrosion processes in natural and artificial seawater: The role of microbes. Electrochem. Commun. 2017, 80, 9–15. [Google Scholar] [CrossRef]


© 2020 by the authors. Licensee MDPI, Basel, Switzerland. This article is an open access article distributed under the terms and conditions of the Creative Commons Attribution (CC BY) license (http://creativecommons.org/licenses/by/4.0/).
Share and Cite
Chen, Z.; Zhang, W.; Zhan, Y.; Lei, B.; Sun, T.; Li, W. Coating Deterioration and Underlying Metal Corrosion Processes in Water-Line Area: Role of DACs. Coatings 2020, 10, 684. https://doi.org/10.3390/coatings10070684
Chen Z, Zhang W, Zhan Y, Lei B, Sun T, Li W. Coating Deterioration and Underlying Metal Corrosion Processes in Water-Line Area: Role of DACs. Coatings. 2020; 10(7):684. https://doi.org/10.3390/coatings10070684
Chicago/Turabian StyleChen, Zhiwei, Wei Zhang, Yi Zhan, Bing Lei, Tianying Sun, and Weihua Li. 2020. "Coating Deterioration and Underlying Metal Corrosion Processes in Water-Line Area: Role of DACs" Coatings 10, no. 7: 684. https://doi.org/10.3390/coatings10070684
APA StyleChen, Z., Zhang, W., Zhan, Y., Lei, B., Sun, T., & Li, W. (2020). Coating Deterioration and Underlying Metal Corrosion Processes in Water-Line Area: Role of DACs. Coatings, 10(7), 684. https://doi.org/10.3390/coatings10070684