Article

Research on Cleaning Mechanism of Anti-Erosion Coating Based on Thermal and Force Effects of Laser Shock

1
Science and Technology on Plasma Dynamics Laboratory, Air Force Engineering University, Xi’an 710038, China
2
State Key Laboratory for Manufacturing Systems Engineering, Xi’an Jiaotong University, Xi’an 710049, China
3
State Key Laboratory for Mechanical Behavior of Materials, Xi’an Jiaotong University, Xi’an 710049, China
*
Author to whom correspondence should be addressed.
Coatings 2020, 10(7), 683; https://doi.org/10.3390/coatings10070683
Submission received: 2 June 2020 / Revised: 11 July 2020 / Accepted: 13 July 2020 / Published: 15 July 2020
(This article belongs to the Section Plasma Coatings, Surfaces & Interfaces)

Abstract

:
TiN coating plays a positive role in improving the abrasion resistance and impact resistance of aero-engines in sand and dust environments. However, little research has been done on the laser cleaning of TiN coatings that failed on aircraft engines. In this paper, TiN coatings are deposited on Ti6Al4V alloys by magnetic filtered cathodic vacuum arc (MFCVA). The TiN coating was laser cleaned with different parameters. By analyzing coating morphology, surface composition and sample profile, the research reveals the morphological change of the TiN coating after cleaning and the laser cleaning mechanism. The results show that for TiN–Ti6Al4V structure, when the laser average power density is 2.54 × 10³ W/cm2, the cleaning mechanism of the coating is thermal expansion; The laser average power density is increased to 5.08 × 10³ W/cm2, the cleaning mechanism is thermal expansion, accompanied by the thermal melting of the substrate, a small amount of molten substrate overflows from the crack. When the laser average power density is 5.08 × 10³ W/cm2 and the number of cleanings doubles, the cleaning direction is perpendicular to each other, the cleaning mechanism is thermal expansion and thermal melting, both the substrate and the coating are melted, and the cleaning is obviously effective.

1. Introduction

Anti-erosion coating is the main technical means of sand and dust protection for military helicopters or large transport aircraft [1,2]. When taking off and landing in a desert environment, the titanium alloy blades imported from the engine compressor will inevitably suffer the erosion and abrasion of sand particles in the air, causing serious damage to the titanium alloy blades, thereby reducing the working efficiency of the compressor blades and endangering flight safety. It is an effective protection method to improve the resistance to sand erosion by preparing a ceramic anti-erosion coating on the surface of the compressor blade [3,4,5]. Ceramic anti-erosion coatings are usually made of TiN, TiAlN, TiCrN, and other materials, and the target particles are deposited on the surface of the sample to be processed by Physical vapor deposition (PVD) technology such as magnetic filtered cathodic vacuum arc (MFCVA) deposition apparatus [6,7,8].
However, in practical applications, ceramic coating blisters and falls off under the action of erosion and corrosion, which causes damage to the ceramic coating [9,10,11,12]. Therefore, the damaged anti-erosion coating is required to be removed and re-prepared to achieve the restoration of the coating function. Fang et al. controlled the deposition parameters such that the pressure of N2 was 1.0 Pa, the negative bias was −200 V, the arc current was 100 A, and the thickness of the coating was 16 μm. For the TiN/Ti coating prepared under this parameter, its adhesion reaches up to 72 N [13,14]. Due to the high hardness and strong adhesion of ceramic coatings, physical methods such as sandblasting did not show satisfactory effectiveness [14,15,16]. Chemical methods such as galvanic methods for cleaning hard coatings on metal alloy surfaces are commonly used in the industry. However, when using the electrochemical method, the composition of the electrolyte may contain a strong acid solution or a strong alkaline solution, which leads to a certain danger in the implementation of the method. In addition, the problem of treatment and cleaning of waste residues and liquids, as well as environmental damage, make chemical methods not the best solution for coating cleaning methods [17,18,19,20]. Laser cleaning is a technique that uses the thermal expansion difference between the coating and the substrate metal and the difference in melting point between the coating and the substrate to separate and peel the ceramic coating from the substrate [21,22,23,24,25]. Laser cleaning technology is widely used in various fields of industrial production due to its characteristics of environmental protection, good cleaning effect, wide application range and high cleaning accuracy [26,27].
In Ragusich et al. [28], to peel off the 20 μm thick TiAlN corrosion-resistant coating on the surface of aerospace titanium alloy parts, the TiAlN coating on the Ti6Al4V substrate was laser cleaned. Although TiAlN coatings have a better performance than TiN coatings in wear resistance, TiN coatings have significant advantages in erosion resistance [29]. Therefore, laser cleaning research on TiN anti-erosion coating is very necessary. However, as the melting point of TiN is higher than that of Ti6Al4V for the Ti6Al4V matrix coating system adopted by the aero-engine, the laser parameters should be strictly controlled during cleaning. Meanwhile, the cleaning effect should also be ensured for make the coating peel off from the matrix. This problem has been the focus of laser cleaning research on TiN coating-Ti6Al4V matrix system.
This article uses laser cleaning technology to clean the TiN coating on the Ti6Al4V substrate. By controlling the process parameters of laser cleaning, the anti-erosion coating clean method based on thermal and force effects of laser shock is implemented to completely peel off the TiN coating from the Ti6Al4V substrate. The surface morphology of TiN–Ti6Al4V substrate after cleaning under three parameters was compared and analyzed, and the reason for its morphology formation was studied. At the same time, the mechanism of laser cleaning was analyzed by studying the surface composition and surface profile and evaluated the cleaning effect of different parameters. The laser cleaning research of ceramic anti-erosion coating of disk will provide strong support for the development of aviation industry.

2. Experiment

2.1. TiN Coating Deposition

Ti6Al4V alloy material is manufactured in a size of 50 × 20 × 3 mm3. Table 1 shows the composition of the Ti6Al4V alloy. The sample was polished to a surface roughness of Ra 0.02. These substrates were then cleaned in an ultrasonic cleaner with acetone for 15 min and dried with alcohol before deposition. And the deposition parameters of the TiN coatings are shown in Table 2 [30].
The adhesion between TiN coatings and Ti6Al4V substrate was examined by using a commercial scratch tester (WS-2005, Rtec, Nanjing, China). In the adhesion test of TiN coating, the loading rate is 100 N/min, the horizontal velocity is 5 mm/min, and the maximum load is 90 N.

2.2. Laser Cleaning Principle Based on Impact Thermal Expansion

Researchers proposed three basic mechanisms for laser cleaning, namely pure vaporization, explosive removal caused by pressure buildup at the bottom interface, and two-phase removal caused by partial film evaporation and subsequent liquid discharge [22,31,32]. Under the laser beam radiation, the coating material is subjected to three types of thermal expansion of the particles, thermal expansion of the substrate surface, and light pressure applied to the particles. The combined force of these forces is the cleaning force. When the cleaning force is more powerful than the adhesion force of the surface of the object to the coating, the coating will fall off, so that the outer surface of the material is washed as shown in Figure 1.
Laser ablation cleaning methods include thermal expansion, gasification, melting, ablation, and phase explosion [33]. The main process is that the laser directly acts on the coating surface to be cleaned (can be performed in air, inert gas environment and vacuum environment). When the laser is directly irradiated on the surface of the material, the substrate Ti6Al4V and the coating TiN undergo thermal expansion. With the extension of the laser irradiation time, the temperature of the material surface will gradually increase. At this time, the following situations will occur:
When the temperature is lower than the melting threshold of the coating, only the physical change of the coating occurs at this time. Due to the difference in thermal expansion coefficient between the coating and the substrate, pressure is generated at the interface between the coating and the substrate, and the coating buckles. Tear open, produce mechanical fracture phenomenon, remove, or peel off the surface of the substrate by spraying [34].
When the temperature is higher than the melting temperature of the substrate and lower than the melting temperature of the coating, the coating is only affected by the force generated during laser cleaning, and the substrate will melt [35].
When the temperature is higher than the melting temperature of the substrate and the coating, the coating and the substrate will not only be affected by the cleaning force, but both the substrate and the coating will melt, which will have a greater impact on the surface of the sample [36].

2.3. Laser Cleaning Path Planning and Process Parameters

The process of laser cleaning is generally as follows: the laser emitted by the laser is transmitted from the optical fiber to the focusing lens. The laser is a beam carrying a high energy. After focusing, the power density can reach 100 to 1000 W/cm2 near the focus. From the nozzle bore to the surface of the workpiece to be cleaned, the small hole nozzle coaxial with the laser blows a gas with a certain pressure to the cleaning area, so as to prevent the lens from being polluted by splashes and smoke, and purify the surface of the sample, and strengthen the thermal effect of the laser and the material.
As a result of Ti6Al4V alloy being used as the main material of the aero-engine overall disk, a 5 μm-thick TiN alloy coating is applied to Ti6Al4V alloy, and this coating is cleaned by laser cleaning. The parameters of the laser cleaning machine are shown in Table 3.
The laser parameter setting consists of five parts: spot overlap rate, linear interval, spot diameter, pulse frequency, and number of cleanings. In Figure 2, the laser generator emits multiple laser beams and aligns them along the Y direction. During cleaning, the laser generator moves along the X direction, so that a straight line of laser lines cleans the sample surface along the X direction. As shown in Figure 2, 0.085 mm is the spot diameter, 40% is the overlap rate between two adjacent spots in the same row of spots, and 0.02 mm is the distance between the centers of the two spots of laser spots (called linear spacing).
The main steps are as follows: First, design a square area based on the damaged area and use any two mutually perpendicular boundaries of the square area as the X and Y directions for cleaning, respectively. Second, set the laser pulse frequency, spot diameter, spot overlap ratio, and linear interval. After that, the lasers are aligned in a straight line according to the set overlap rate and linear interval, a cleaning path needs to be set so that the straight line of the laser array scans the cleaning area along the X direction (or Y direction). Table 4 shows the laser parameters when laser cleaning the sample surface.

2.4. Laser Energy Comparison

Assuming that the peak power of the laser is Pm, the average power is Pa, the pulse frequency is f, the pulse width is t, and the pulse energy is q, the peak power and average power of the laser can be calculated according to the formula:
P m = q / t
P a = q × f
At the same time, when the effect area of a single laser beam acting on the surface of the sample is known, the average energy density and peak energy density of the laser can be calculated according to the formula, assuming the average energy density is Qa, the peak energy density is Qm and the area of action of a single laser beam is s:
Q a = P a / s
Q m = P m / s
Marimuthu et al. [34] determined the laser energy density to 2 J/cm2 by using a pulsed laser to strip the TiN coating on the surface of the Tungsten carbide alloy (WC) cutter head, and the cleaning threshold of the TiN coating was 1.62 J/cm2, which satisfied the cleaning higher than the TiN coating threshold condition. Therefore, the laser parameters selected in this paper can meet the conditions higher than the cleaning threshold of TiN coating.
Therefore, the energy parameters of the laser under the three parameters can be calculated according to the parameters given in Table 4, as shown in Table 5:
It can be seen from Table 5 that the laser cleaning parameters of samples 1, 2 and 3 are consistent in terms of peak energy, which means that the energy output by a single laser beam on the surface of the sample remains consistent. However, by adjusting the pulse frequency, the average energy of sample 3 during cleaning becomes half of the average energy of sample 1 and sample 2, and the total energy of the laser on the surface of samples 1, 2 and 3 is generated by changing the number of cleanings. This is different, so different cleaning effects are expected.

3. Results and Analysis

3.1. Adhesion of TiN Coatings

The adhesion is part of the main criteria for evaluating the erosion resistance and impact resistance of the coating. The strong adhesion can ensure that the coating will not peel off when it is eroded by grit and damaged by foreign objects. Figure 3 shows the scratch morphology and acoustic emission curve of TiN coating. When the load is loaded to 60 N, the acoustic signal fluctuates significantly. Combined with the scratch morphology, the coating only peeled off at its surface layer, and did not cause damage to the bonding interface between the coating and the substrate. When the load is loaded to 70 N, the acoustic signal fluctuates again, and the coating is broken within the box area shown, exposing the substrate under the coating, so the adhesion between the coating and the substrate is 70 N.

3.2. Morphology Analysis of the Sample

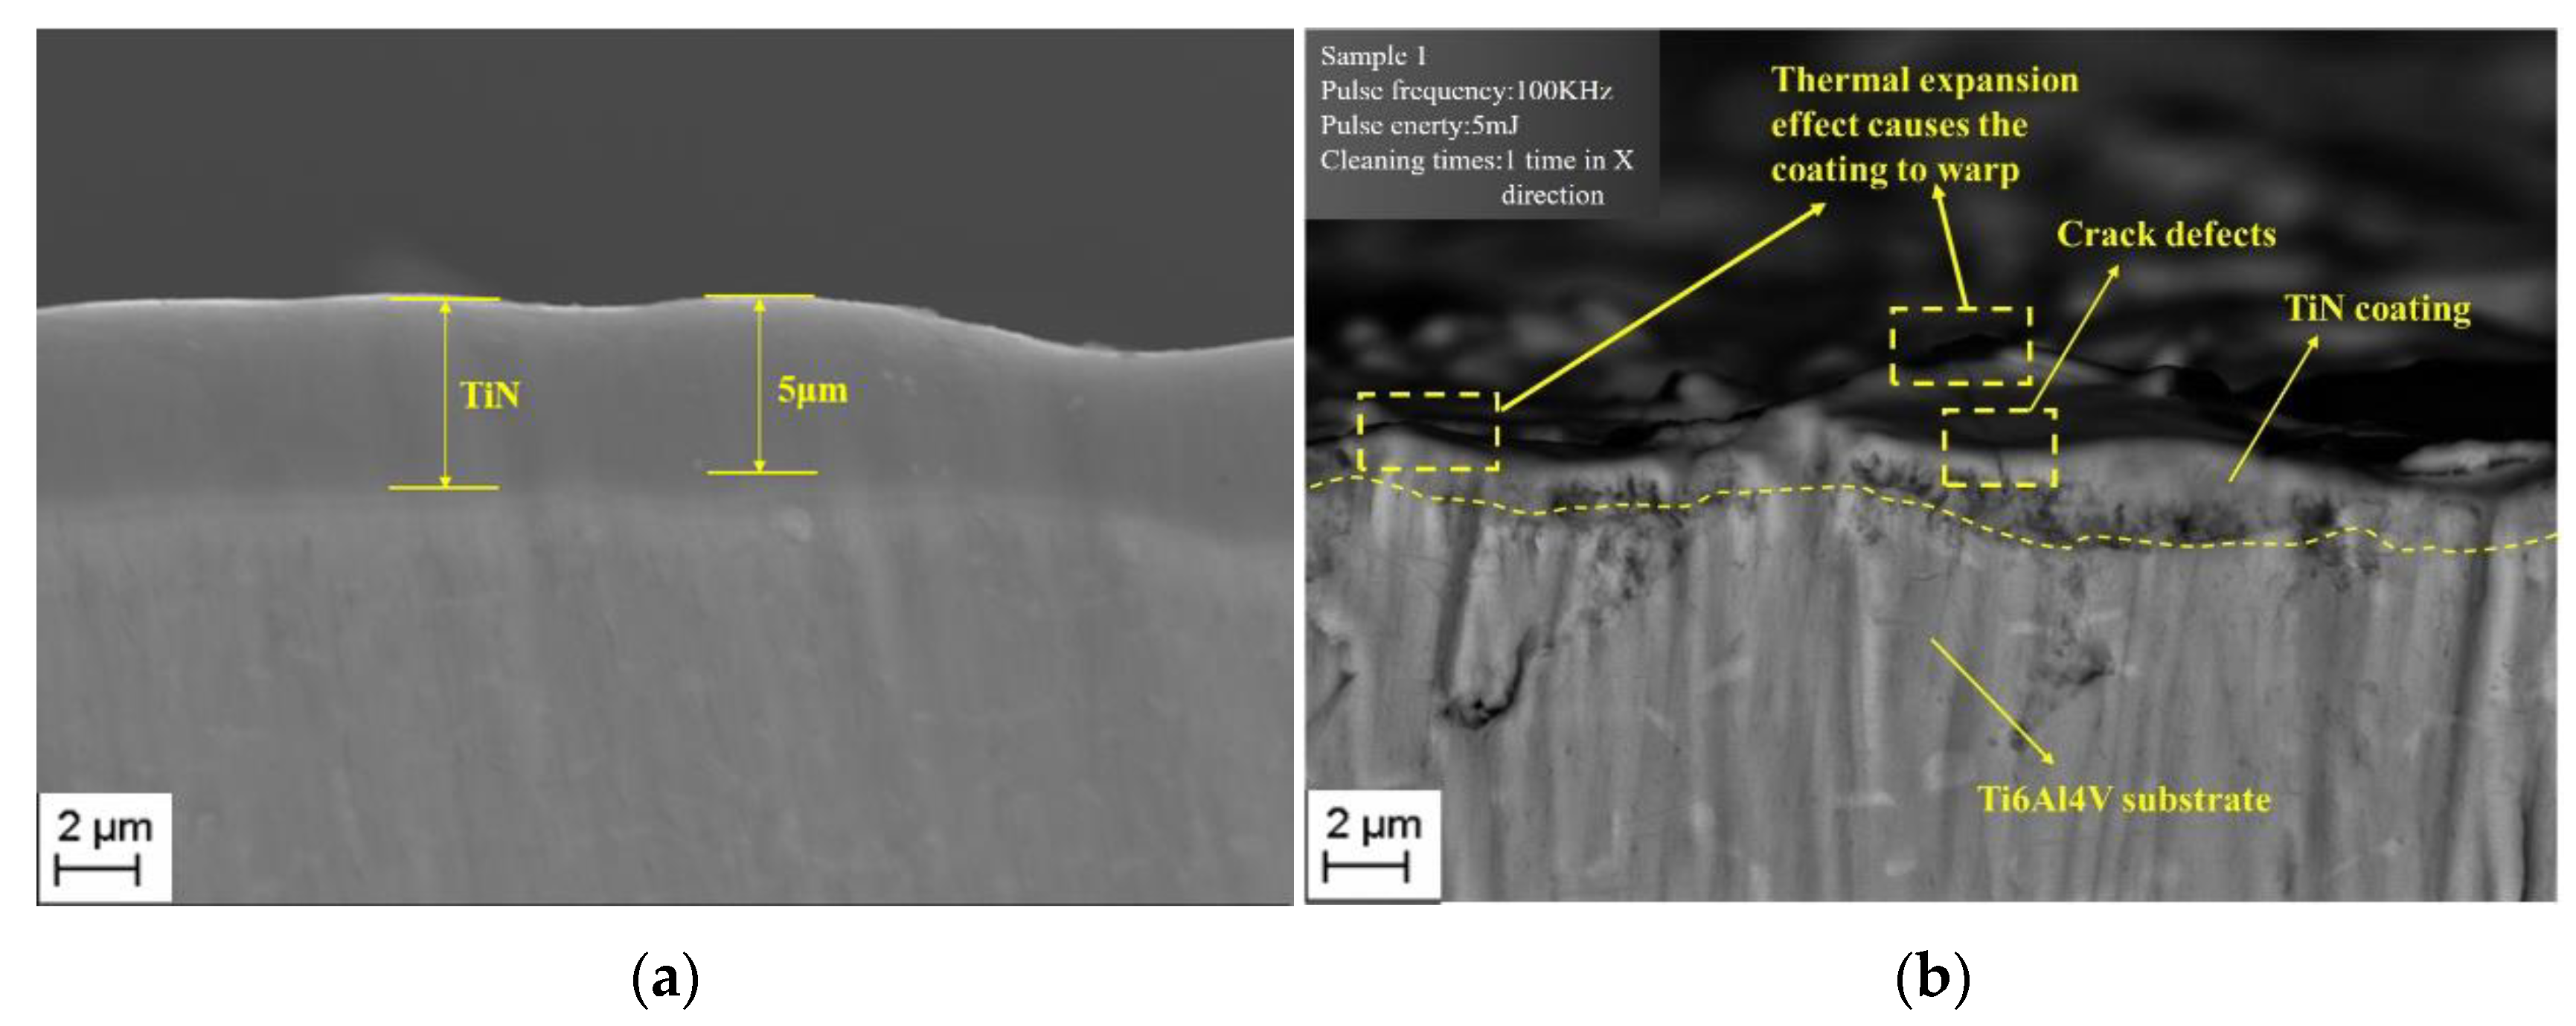
Figure 4 displays the cross-sectional view of the interface between the substrate and the coating of the sample. Figure 4a is a cross-sectional view of the sample before laser cleaning. From Figure 4a, the difference between the coating and the substrate at the cross section of the sample can be obviously seen, and the coating thickness can also be measured to be about 5 μm.
Figure 4b is the cross-sectional view of sample 1 after laser cleaning. It can be observed from the figure that at the junction of the coating and the substrate, many gaps are generated between the coating and the substrate and accompanied by the warpage of the coating, and cracks appear on the surface of the coating. After cleaning, the coating thickness becomes smaller (about 3 μm) and the coating surface becomes rougher than before cleaning. This is due to the difference between the thermal expansion properties of the coating and the substrate, when the coating and the substrate are heated by the laser under the action of a low pulse frequency laser, which causes the two to expand differently and the coating warps, resulting in the coating separated from the substrate.
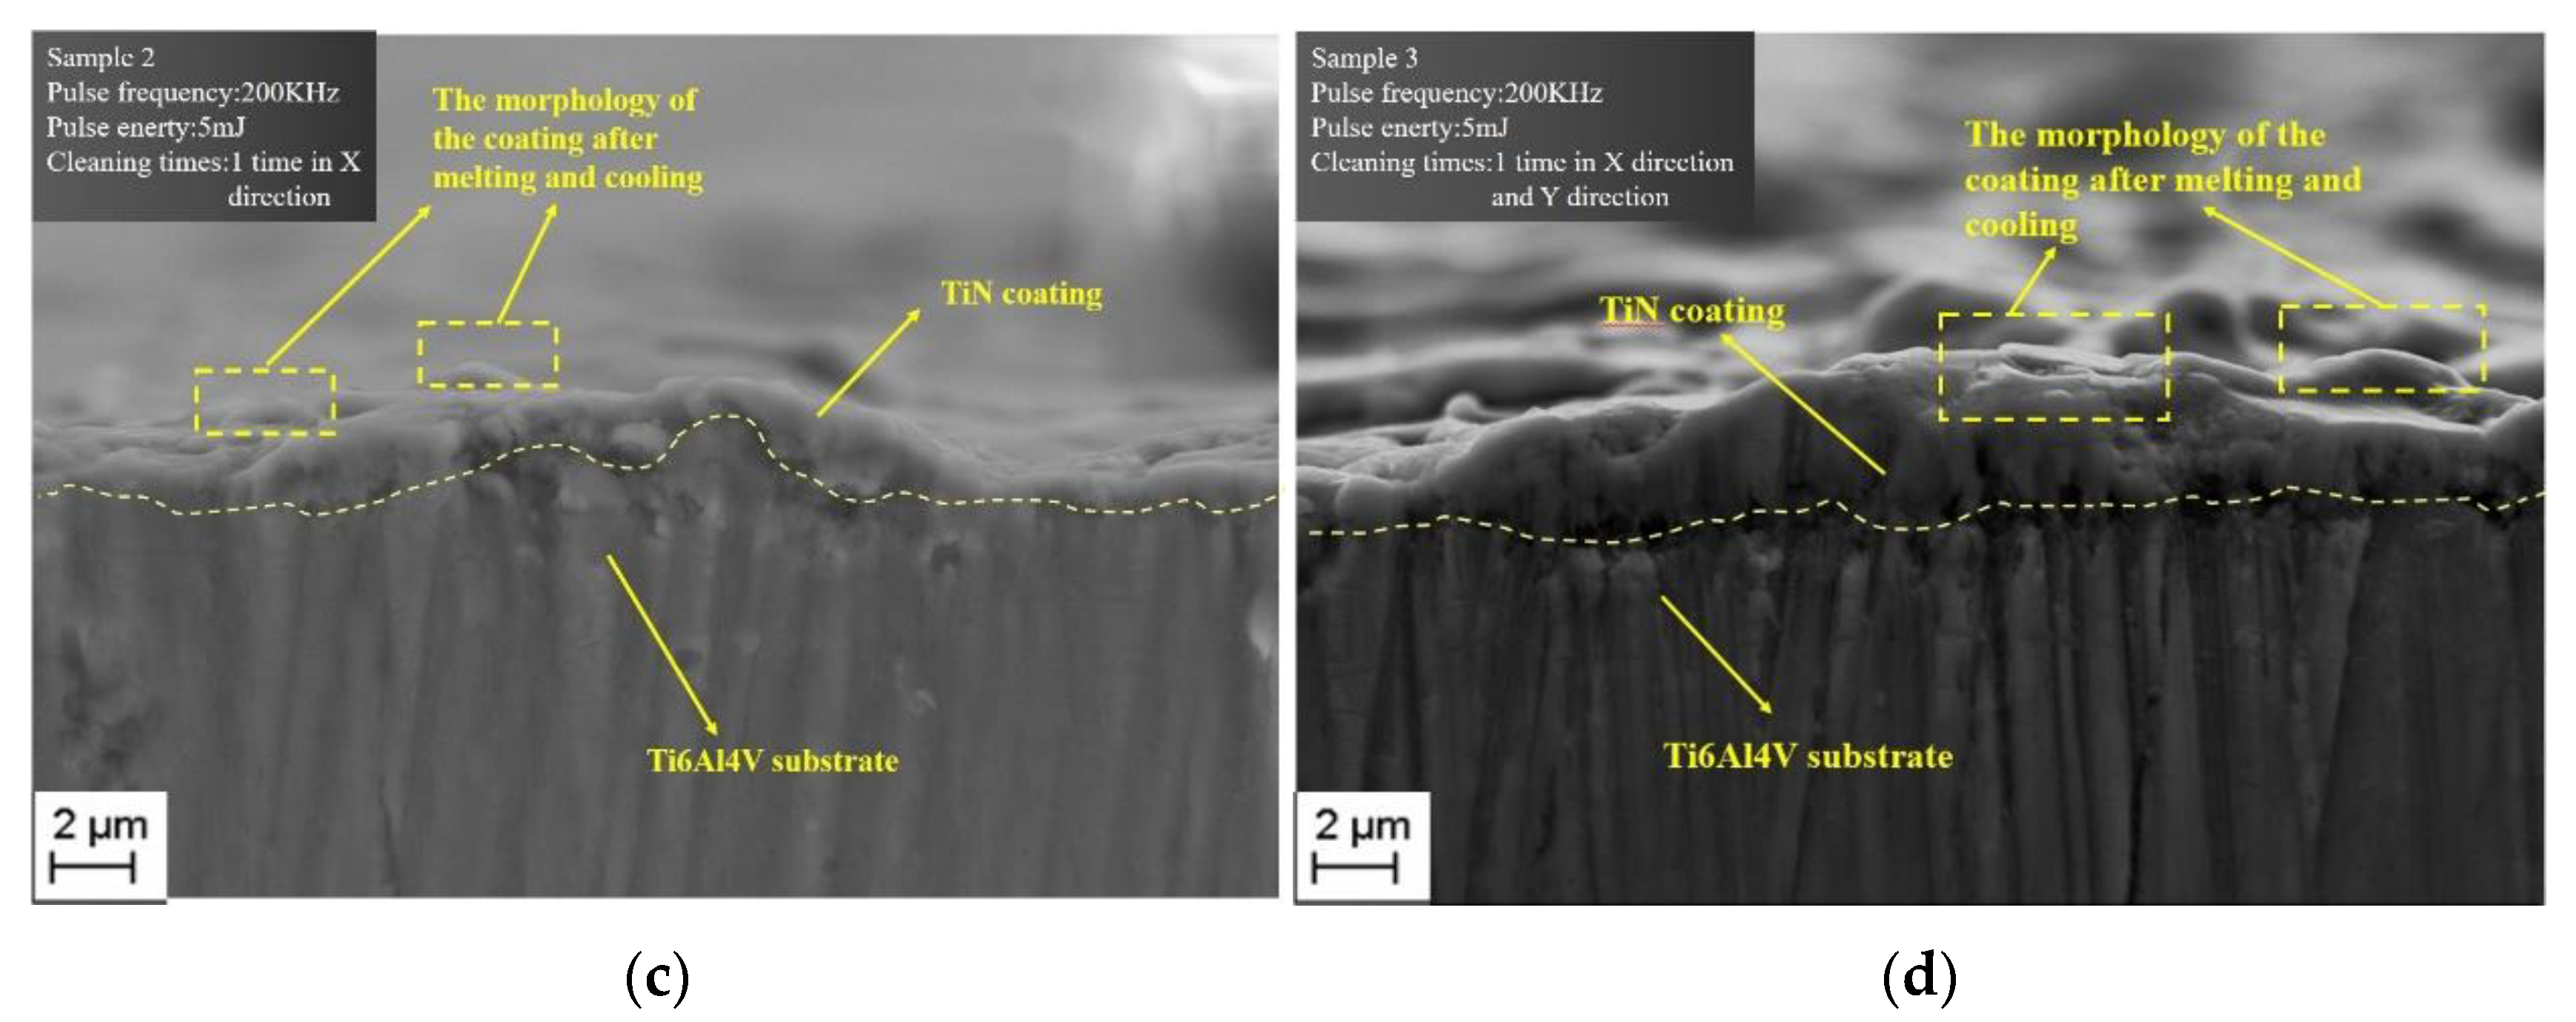
Figure 4c shows the cross-sectional view of sample 2 after laser cleaning. In the figure, the surface of the sample becomes rougher and there are some spherical convex parts on the surface of the sample. Compared with sample 1, the coating thickness of sample 2 is significantly reduced (the thicker area is 2–3 μm, the thinner area is only 1–2 μm).Compared with Figure 4a, in the part where the substrate is separated from the coating in Figure 4c, the morphology of the substrate is very irregular, with protrusions and pits. The reason for this phenomenon is that after the separation between the coating and the substrate due to thermal expansion, the laser pulse frequency increased from 100 to 200 KHz, and the sample received more heat transferred by the laser at the same time. At this time, since the melting point of Ti6Al4V is lower than TiN, the substrate melts before the coating. After cleaning and cooling, the substrate returns from the molten state to a solid state, but due to the thermal expansion of the coating, the distribution of the substrate under the coating is irregular.
Figure 4d is a cross-sectional view of sample 3 after laser cleaning. When the laser cleans the sample from the X and Y directions, the sample receives more heat transferred by the laser. It can be seen from the figure that the roughness of the coating surface and the spherical convex part further is increased. In addition, at the interface between the coating and the substrate, the separation of the coating and the substrate is more obvious. The thickness of the coating is also highly uneven (some areas are only about 1 μm, while the thicker areas can reach up to 3 μm). When the sample receives more heat, both the coating and the substrate melt. Owing to the thermal expansion effect, the coating thickness distribution after cooling is uneven.
Through the electron microscope, we can observe the surface morphology of the sample after laser cleaning as shown in Figure 5. Figure 5a is the surface morphology of sample 1 after magnification of 500 times. It can be seen from the figure that the sample surface still maintains a relatively intact and flat morphology, but there is a faintly visible light spot profile left after laser cleaning, and it is accompanied by certain pit defects. By zooming in on the selected area in Figure 5a, we get a picture of the surface morphology after a magnification of 2000 times, as shown in Figure 5b. In Figure 5b, the pit defects on the surface of the sample are more obvious, and its size is about 5~10 μm. At the same time, crack defects appeared on the surface of the sample, but the size of the crack was small, and the outline of the spot left by the laser scanning surface was also clearer.
Figure 5c is the surface morphology of sample 2 after magnification of 500 times. The outline of the light spot in the figure is more obvious, and it can be clearly seen that the material composition distributed along the outline of the light spot is inconsistent with the inside of the light spot. At the same time, the surface of sample 2 also has pit defects. Figure 5d is the surface morphology of sample 2 after magnification of 2000 times. By comparing with Figure 5b, we can see that the scale of the cracks on the surface of sample 2 becomes larger, and the pit defects are also more obvious, and the number is also increased. In addition, on the surface of sample 2, the traces left by the laser spot scanning are also more obvious and regularly distributed.
Figure 5e shows the surface morphology of sample 3 after magnification of 500 times. It can be seen from the figure that the surface of the sample still retains a more obvious spot profile. However, the distribution of these traces is messier and irregular compared with the traces in Figure 5c, and the edges of the tracks have the distribution of spattered branches. The selected part in Figure 5e is magnified by 2000 times to obtain Figure 5f. As can be seen from Figure 5f, compared with Figure 5b,d, the sample crack defects on the surface are reduced, and pit defects are also significantly reduced. However, the sputter-like branches of the spot profile are more obvious, and the distribution is extremely irregular. Since sample 3 was cleaned in the X and Y directions, the distance between the spot profiles on the surface of sample 2 is smaller than that of sample 2’s surface.

3.3. Analysis of Sample Surface Composition after Laser Cleaning

To explore the difference between the material composition distributed along the edge of the spot outline in Figure 5 and the material composition inside the spot, the content and distribution of the surface elements of the sample were measured using an energy spectrometer. Because the sample adopts the structure with Ti6Al4V as the matrix and TiN as the coating, it is only necessary to observe the content and distribution of N element when exploring the cleaning status of the coating.
Figure 6 shows the distribution of N elements in a selected area of the sample surface. As shown in Figure 6a, a large amount of N elements is still distributed on the surface of sample 1, and there are no voids in the distribution. In Figure 6b, although a large amount of N elements is distributed on the surface of the sample, some voids appear in the figure, and the shape and distribution of these voids are generally consistent with the outline of the light spot. In Figure 6c, the area and number of such voids increased, and their distribution is no longer consistent with the spot contour tracks.
Table 6 is the proportion of the surface N element content of the sample after laser cleaning, and Figure 7 is the Energy spectrogram of the surface element of the sample. From Table 6 and Figure 7, it can be seen that from sample 1 to sample 3, the N element content is gradually decreasing. Combining the surface morphology of the sample in Figure 5, and the distribution of N elements on the sample surface in Figure 6, it can be concluded that the material inside the outline of the light spot in Figure 5 is the residual TiN coating, and the material distributed along the outline of the light spot is the Ti6Al4V matrix.

3.4. Analysis of the Surface Profile of the Sample after Laser Cleaning

Figure 8 is the surface profile of the sample after laser cleaning, and Table 7 is the surface roughness. In Figure 8a, the surface roughness of the sample is small, and the shape of the surface profile is regular, which is consistent with the conclusions drawn from the electron microscope photo and the light microscope photo. In Figure 8b, the sample surface contour shape begins to appear irregular, and the roughness begins to increase, while in Figure 8c, the flatness of the sample surface contour is very poor, and the surface roughness is also very big.

3.5. Laser Cleaning Mechanism of TiN Coating

To observe the morphology of the surface of the sample after cleaning more clearly, and to determine the difference between the substance distributed along the outline of the spot and the substance inside the spot, the surface morphology of the sample is now observed under the light microscope. Figure 9 shows the surface morphology of the three samples under the light microscope. Figure 9a is the surface morphology of the surface of sample 1 magnified 560 times. It can be seen that the surface of the sample is covered with golden yellow material, and the flatness of the sample surface is poor with obvious cracks and pit defects. Figure 9b is the surface morphology of sample 2’s surface magnified 560 times. From this figure, it can be clearly observed that the black material surrounded by the golden material appears on the surface of the sample, and the cracks and pit defects are more obvious [34]. Figure 9c is the surface morphology of sample 3 magnified 560 times. It can be seen from the figure that a large amount of black material is exposed on the surface of the sample, and the flatness of the surface is extremely poor, while the golden material is distributed in the depressions between the black materials.
With reference to Figure 6 and Table 6, it can be possible to conclude that the golden substance on the surface of the sample in Figure 9 is TiN, and the black substance is the Ti6Al4V matrix. It can be seen from Figure 4b and Figure 9a that the coating has not been removed, only a large area of cracks and a few pit defects were generated on the surface of the coating, and no Ti6Al4V was exposed. However, as the laser energy increases, as can be seen in Figure 4d and Figure 9b, the cracks and pit defects of the coating increased, and a small amount of Ti6Al4V was exposed, but most of the coating is still not washed away. In addition, in Figure 9b, while Ti6Al4V is exposed, it loses its original flat morphology and assumes a point-like convex shape. This is explained by the fact that sample 1 was cleaned with a lower energy laser, and the coating and the substrate only experienced thermal expansion. The thermal expansion caused the coating to crack and a small amount of TiN was peeled off on the surface of the sample pit defects are generated [34]. After the laser energy increases, the melting point of TiN is higher than that of Ti6Al4V, so the substrate melts before the coating [31,35]. At the same time, the cracks on the surface of the coating also gradually increased, and the size of the pits gradually increased. The molten Ti6Al4V oozed out of the pits and cracks, and after cooling, the morphology shown in Figure 9 was formed.
It can be seen from Figure 4f that irregularly distributed substances appear on the surface of the sample. Combining Figures 4c and Figure 9c, it can be concluded that these irregularly distributed substances are the matrix Ti6Al4V. Comparing Figure 9b,c, it can be seen that the golden yellow TiN morphology is destroyed, and TiN is distributed in the depressions and cracks between Ti6Al4V. The reason for the appearance as shown in Figure 9c is that when sample 3 is subjected to laser cleaning, the same laser parameters as sample 2 are used for cleaning, but the cleaning is performed from both X and Y directions. Although the energy of a single laser is not different, the increase in the number of cleanings causes the laser to transfer more heat to the sample surface. At this time, TiN and Ti6Al4V will melt. When the heat transferred by the laser is low, the sample first thermally expands, and at this time, the coating surface has cracks and depressions [33,34,35]. Subsequently, the laser transmission energy increases, and the underlying Ti6Al4V melts first, but this time the TiN coating continues to expand, and cracks and pits gradually increase [22]. Under the force of thermal expansion, a small amount of molten Ti6Al4V overflowed from the cracks and pits, and the coating also peeled off. When the laser energy is increased again, both the coating and the substrate are melted, and more Ti6Al4V is exposed. After cleaning, TiN and Ti6Al4V cooled to form the morphology shown in Figure 9c.

4. Conclusions

The TiN coating is deposited on the Ti6Al4V substrate by the PVD method. Cleaning experiments with different laser parameters and cleaning parameters were carried out. The surface morphology after cleaning was analyzed to study the cleaning mechanism of the coating. The results can draw the following conclusions:
  • When the laser average energy destiny is 2.54 × 10³ W/mm2 and the laser frequency is 100 KHz, the thermal expansion phenomenon occurs on both the TiN coating and the Ti6Al4V substrate. At this time, cracks and pit defects appear on the coating surface.
  • When the heat transferred by the laser energy can melt Ti6Al4V, the melting point of TiN is higher than that of Ti6Al4V, which causes the TiN coating to be subjected only to thermal expansion. Therefore, the crack size on the coating surface becomes larger and the number of pits gradually increases. However, the Ti6Al4V matrix began to melt, and the molten Ti6Al4V overflowed from the cracks and pits under the action of thermal expansion.
  • When the laser average energy destiny is increased to 5.08 × 10³ W/mm2 and the laser frequency increased to 200 KHz, both the TiN coating and the Ti6Al4V matrix are melted, the surface of the sample is severely damaged, TiN and Ti6Al4V are mixed together, and after cooling, the surface morphology of the TiN distributed in the pits between Ti6Al4V is formed.

Author Contributions

Conceptualization, G.H. and Z.Y.; methodology, J.C.; validation, Z.F.; data curation, Z.Z.; writing—original draft preparation, C.H.; writing—review and editing, G.H. All authors have read and agreed to the published version of the manuscript.

Funding

This research was funded by National Science and Technology Major Project (2017-VII-0012-0107).

Acknowledgments

The authors would like to acknowledge Xi’an Jiaotong University.

Conflicts of Interest

The authors declare that they have no conflict of interest.

References

  1. Chen, J.; Geng, M.; Li, Y.; Yang, Z.; Chai, Y.; He, G. Erosion Resistance and Damage Mechanism of TiN/ZrN Nanoscale Multilayer Coating. Coatings 2019, 9, 64. [Google Scholar] [CrossRef] [Green Version]
  2. Liang, C.G.; Li, X.M. Effect of spraying distance on erosion resistance of plasma sprayed WC-12Co coating. China Surf. Eng. 2017, 30, 111–121. [Google Scholar]
  3. Zhang, H.; Li, Z.; He, W.; Liao, B.; He, G.; Cao, X.; Li, Y. Damage evolution and mechanism of TiN/Ti multilayer coatings in sand erosion condition. Surf. Coat. Technol. 2018, 353, 210–220. [Google Scholar] [CrossRef]
  4. Sharma, S.; Padenko, E.; Bijwe, J.; Wetzel, B.; Friedrich, K. Erosive and sliding wear of polybenzimidazole at elevated temperatures. J. Mater. Sci. 2016, 51, 262–270. [Google Scholar] [CrossRef]
  5. He, G.; Li, Y.; Chai, Y.; Zhang, Y.; Wang, G. Review of key issues on coating against sand erosion of aero-engine compressor blade. Acta Aeronaut. Astronaut. Sin. 2015, 36, 1733–1743. [Google Scholar]
  6. Bromark, M.; Larsson, M.; Hedenqvist, P.; Hogmark, S. Wear of PVD Ti/TiN multilayer coatings. Surf. Coat. Technol. 1997, 90, 217–223. [Google Scholar] [CrossRef]
  7. Borawski, B.; Todd, J.A.; Singh, J.; Wolfe, D.E. The influence of ductile interlayer material on the particle erosion resistance of multilayered TiN based coatings. Wear 2011, 271, 2890–2898. [Google Scholar] [CrossRef]
  8. Yang, Q.; Mckellar, R. Nanolayered CrAlTiN and Multilayered CrAlTiN-AlTiN Coatings for Solid Particle Erosion Protection. Tribol. Int. 2014, 83, 12–20. [Google Scholar] [CrossRef]
  9. Sulonen, M.S.; Korhonen, A.S. TiN-Coatings Deposited by Triode ion Plating on Tools and Dies. CIRP Ann. Manu. Technol. 1986, 35, 133–136. [Google Scholar] [CrossRef]
  10. Tilly, G.P. Erosion Caused by Impact of Solid Particles. Treatise Mater. Sci. Technol. 1979, 13, 287–319. [Google Scholar]
  11. Randhawa, H.; Johnson, P.C. Technical note: A review of cathodic arc plasma deposition processes and their applications. Surf. Coat. Technol. 1987, 31, 303–318. [Google Scholar] [CrossRef]
  12. DeMasi-Marcin, J.T.; Gupta, D.K. Protective coatings in the gas turbine engine. Surf. Coat. Technol. 1994, 68, 1–9. [Google Scholar] [CrossRef]
  13. Fang, Z.; Chen, J.; He, W.; Yang, Z.; Yuan, Z.; Geng, M.; He, G. Study on damage mechanism of TiN/Ti coatings based on multi-directional impact. Coatings 2019, 9, 76. [Google Scholar] [CrossRef] [Green Version]
  14. Olmez-Hanci, T.; Arslan-Alaton, I.; Basar, G. Multivariate analysis of anionic, cationic and nonionic textile surfactant degradation with the H2O2/UV-C process by using the capabilities of response surface methodology. J. Hazard. Mater. 2011, 185, 193–203. [Google Scholar] [CrossRef]
  15. Chen, P.J.; Rosenfeldt, E.J.; Kullman, S.W.; Hinton, D.E.; Linden, K.G. Biological assessments of a mixture of endocrine disruptors at environmentally relevant concentrations in water following UV / H2O2 oxidation. Sci. Total Environ. 2007, 376, 18–26. [Google Scholar] [CrossRef] [PubMed]
  16. Reis, A.R.D.; Tabei, K.; Sakakibara, Y. Oxidation mechanism and overall removal rates of endocrine disrupting chemicals by aquatic plants. J. Hazard. Mater. 2014, 265, 79–88. [Google Scholar] [CrossRef] [Green Version]
  17. Neves, P.; Arronte, M.; Vilar, R.; do Rego, A.B. KrF excimer laser dry and steam cleaning of silicon surfaces with metallic particulate contaminants. Appl. Phys. A 2002, 74, 191–199. [Google Scholar] [CrossRef]
  18. Mateo, M.P.; Nicolas, G.; Piñon, V.; Ramil, A.; Yañez, A. Laser cleaning: An alternative method for removing oil-spill fuel residues. Appl. Surf. Sci. 2005, 247, 333–339. [Google Scholar] [CrossRef]
  19. Kim, J.; Na, S. Metal thin film ablation with femtosecond pulsed laser. Opt. Laser. Technol. 2007, 39, 1443–1448. [Google Scholar] [CrossRef]
  20. Turner, M.W.; Crouse, P.L.; Li, L. Comparison of mechanisms and effects of Nd:YAG and CO2 laser cleaning of titanium alloys. Appl. Surf. Sci. 2006, 252, 4792–4797. [Google Scholar] [CrossRef]
  21. Lu, Y.F.; Song, W.D.; Low, T.S. Laser cleaning of micro-particles from a solid surface-theory and applications. Mater. Chem. Phys. 1998, 54, 181–185. [Google Scholar] [CrossRef]
  22. Tam, A.C.; Leung, W.P.; Zapka, W.; Ziemlich, W. Laser-cleaning techniques for removal of surface particulates. J. Appl. Phys. 1992, 71, 3515–3523. [Google Scholar] [CrossRef]
  23. Oltra, R.; Yavaş, O.; Cruz, F.; Boquillon, J.P.; Sartori, C. Modelling and diagnostic of pulsed laser cleaning of oxidized metallic surfaces. Appl. Surf. Sci. 1996, 96, 484–490. [Google Scholar] [CrossRef]
  24. Zapka, W.; Ziemlich, W.; Tam, A.C. Efficient pulsed laser removal of 0.2 μm sized particles from a solid surface. Appl. Phys. Lett. 1991, 58, 2217–2219. [Google Scholar] [CrossRef]
  25. Zhou, X.; Imasaki, K.; Furukawa, H.; Umino, H.; Sakagishi, K.; Nakai, S.; Yamanaka, C. A study of the surface products on zinc-coated steel during laser ablation cleaning. Surf. Coat. Technol. 2001, 137, 170–174. [Google Scholar] [CrossRef]
  26. Wang, Z.M.; Zeng, X.Y.; Huang, W.L. Parameters and surface performance of laser removal of rust layer on A3 steel. Surf. Coat. Technol. 2003, 166, 10–16. [Google Scholar] [CrossRef]
  27. Chen, X.; Feng, Z.M. Effectiveness of laser cleaning for grinding wheel loading. Key Eng. Mater. 2003, 238, 289–294. [Google Scholar] [CrossRef]
  28. Ragusich, A.; Taillon, G.; Meunier, M.; Martinu, L.; Klemberg-Sapieha, J.E. Selective pulsed laser stripping of TiAlN erosion-resistant coatings: Effect of wavelength and pulse duration. Surf. Coat. Technol. 2013, 232, 758–766. [Google Scholar] [CrossRef]
  29. Antonov, M.; Hussainova, I.; Sergejev, F.; Kulu, P.; Gregor, A. Assessment of gradient and nanogradient PVD coatings behaviour under erosive, abrasive and impact wear conditions. Wear 2009, 267, 898–906. [Google Scholar] [CrossRef]
  30. Zhang, Z.; Chen, J.; He, G.; Yang, Z.; Yang, G. Fatigue and Mechanical Behavior of Ti-6Al-4V Alloy with CrN and TiN Coating Deposited by Magnetic Filtered Cathodic Vacuum Arc Process. Coatings 2019, 9, 689. [Google Scholar] [CrossRef] [Green Version]
  31. Watkins, K.G.; Curran, C.; Lee, J.M. Two new mechanisms for laser cleaning using Nd:YAG sources. J. Cult. Herit. 2003, 4, 59–64. [Google Scholar] [CrossRef]
  32. Watkins, K.G. Mechanisms of laser cleaning. Proc SPIE Int. Soc. Opt. Eng. 2000, 3888, 165–174. [Google Scholar]
  33. Tam, A.C.; Zupka, W.; Ziemliech, W. Dry laser cleaning of anodized aluminum. SPIE 1991, 1598, 13–18. [Google Scholar]
  34. Marimuthu, S.; Kamara, A.M.; Whitehead, D.; Mativenga, P.; Li, L. Laser removal of TiN coatings from WC micro-tools and in-process monitoring. Opt. Laser Technol. 2010, 42, 1233–1239. [Google Scholar] [CrossRef]
  35. Yue, L.Y.; Wang, Z.B.; Li, L. Material morphological characteristics in laser ablation of alpha case from titanium alloy. Appl. Surf. Sci. 2012, 258, 8065–8071. [Google Scholar] [CrossRef]
  36. Yang, S.K. Laser Cleaning as A Conservation Technique for Corroded Metal Artifacts. Ph.D. Thesis, Luleå University of Technology, Luleå, Sweden, 2006. [Google Scholar]
Figure 1. Laser cleaning principle.
Coatings 10 00683 g001
Figure 2. Schematic diagram of laser cleaning parameter setting.
Coatings 10 00683 g002
Figure 3. Scratch morphology and back scattered-electron image and scratch experiment acoustic signal image of TiN coating. (a) scratch experiment acoustic signal image; (b) back scattered-electron image.
Coatings 10 00683 g003
Figure 4. Section of the interface between the coating and the substrate: (a) before laser cleaning, (b) sample 1, (c) sample 2, (d) sample 3.
Coatings 10 00683 g004aCoatings 10 00683 g004b
Figure 5. Electron microscope surface morphology of the sample after cleaning: (a) 500× magnification for sample 1, (b) 2000× magnification for sample 1, (c) 500× magnification for sample 2, (d) 2000× magnification for sample 2, (e) 500× magnification for sample 3, (f) 2000× magnification for sample 3.
Coatings 10 00683 g005
Figure 6. Surface N element distribution of the sample after cleaning (ac are the surface N element distribution of samples 1, 2, and 3, respectively).
Coatings 10 00683 g006
Figure 7. Energy spectrogram of the surface of the sample after cleaning (ac are the energy spectrogram of samples 1, 2, and 3, respectively).
Coatings 10 00683 g007
Figure 8. Surface profile of the specimen (ac represent samples 1, 2, and 3 respectively).
Coatings 10 00683 g008
Figure 9. Light microscope morphology after sample cleaning: (a) 560× magnification for sample 1, (b) 560× magnification for sample 2, (c) 560× magnification for sample 3.
Coatings 10 00683 g009
Table 1. Chemical composition of the Ti6Al4V titanium alloy.
ElementTiAlVFeCONH
Content (%)Bal5.704.000.100.020.05<0.01<0.001
Table 2. Deposition parameters of TiN coating [30].
StepSourceBias VoltageAre CurrentDurationNitrogen Flow RateTemperature
Ion implantation Ti (99.95%)10 kV-40 min-400 °C
Buffer layerTi (99.95%)250 V110 A 30 min-600 °C
Coating depositionTi (99.95%)250 V110 A30 min35 sccm600 °C
Table 3. Laser cleaning machine parameters.
Focal LengthSpot DiameterWorking DistanceCleaning SpeedLaser Level
F = 254 mm50 μm364 mm50–3000 mm/s4
Table 4. Laser cleaning parameters.
Laser ParametersSample 1Sample 2Sample 3
Spot Diameter0.05 mm0.05 mm0.05 mm
Spot overlap rate40%40%40%
Linear interval0.02 mm0.02 mm0.02 mm
Pulse frequency100 KHz200 KHz200 KHz
Pulse width80 ns80 ns80 ns
Pulse energy5 mJ5 mJ5 mJ
Cleaning timesWash 1 time in X directionWash 1 time in X direction Wash 1 time each in X and Y direction
Table 5. Laser energy.
Energy ParameterSample 1Sample 2Sample 3
Peak power6.25 × 104 W 6.25 × 10 4   W 6.25 × 10 4   W
Peak power density7.95 × 104 W/cm27.95 × 104 W/cm27.95 × 104 W/cm2
Average power500 W1000 W1000 W
Average power density2.54 × 103 W/mm25.08 × 103 W/mm25.08 × 103 W/mm2
Energy density2.54 J/cm22.54 J/cm22.54 J/cm2
Table 6. N content on the surface of each sample.
N Element ContentSample 1Sample 2Sample 3
Apparent concentration23.9621.378.22
wt.%38.8436.3818.35
wt.% Sigma0.910.901.70
Table 7. Surface roughnessof each sample and TiN coatings and Ti6Al4V.
RoughnessSample 1Sample 2Sample 3TiN Coatings
Ra0.421.171.870.35
Rz2.817.5812.432.13

