Article

Reactive Sputtering Deposition of Epitaxial TiC Film on Si (100) Substrate

1
Department of Materials Science and Engineering, National Chiao Tung University, Hsinchu 30010, Taiwan
2
Taiwan Instrument Research Institute, National Applied Research Laboratories, Hsinchu 30076, Taiwan
*
Authors to whom correspondence should be addressed.
Coatings 2020, 10(7), 647; https://doi.org/10.3390/coatings10070647
Submission received: 9 June 2020 / Revised: 27 June 2020 / Accepted: 3 July 2020 / Published: 5 July 2020
(This article belongs to the Special Issue Epitaxial Thin Films: Properties and Applications)

Abstract

:
Epitaxial (100) TiC film deposition on Si (100) substrate by direct current magnetron reactive sputtering of a metallic Ti target with 3%–6% CH4 in Ar gas was investigated. X-ray diffraction and cross-sectional scanning transmission electron microscopy (STEM) reveal that epitaxial cubic TiC can be grown on the Si substrate by domain matching epitaxy in 5/4 ratio with the epitaxial relationship of TiC (100)[0 1 ¯ 1] // Si (100)[0 1 ¯ 1]. For sputtering with 3% and 4% CH4, the deposited films are found to consist of both TiC and metallic Ti phases. Increasing the CH4 flow ratio to 5% results in a deposited film completely consisting of TiC without metallic Ti phase. The crystallinity of the deposited TiC is also improved with increasing the CH4 ratio to 5%. X-ray photoelectron spectroscopy shows that the [C]/[Ti] atomic ratio in TiC is nearly close to 1 for growth with 5% CH4 flow ratio and above. The measured electrical resistivities of the deposited films also increase from 41 to 153 μΩ·cm with increasing the CH4 ratio from 3% to 6%. With film growth beyond 50 nm thickness, it is shown that some disoriented TiC grains are formed.

1. Introduction

Titanium carbide (TiC), as one of the transition metal carbides, has excellent properties such as high melting point, high hardness, low resistivity, high thermal stability, and chemical inertness, as well as good resistance to corrosion and oxidation [1,2]. TiC has a rock salt structure (a = 4.328 Å) and maintains its structure in an extremely broad range of composition (TiCx, 0.47 ≤ x ≤ 0.99) [1,2,3]. Owing to those superior properties, polycrystalline TiC films can be used as wear-resistant coating, passive layers, electrodes, field emission cathodes, and metal contact for semiconductor devices [4,5,6,7,8,9,10]. Moreover, applications for epitaxial TiC in the field of high power electronic devices, buffer layers, and seeding layers have been recently reported [11,12,13,14,15].
TiC coatings have been prepared by physical vapor deposition and chemical vapor deposition processes, including magnetron sputtering, pulsed laser deposition, evaporation, and plasma-assisted chemical vapor deposition [16,17,18,19,20,21]. Among these methods, reactive sputtering has several advantages such as high deposition rate, low impurity content, and it has been widely used for cost-effective industrial production [22].
To obtain epitaxial TiC films, single crystals of MgO, SiC, and Al2O3 which are expensive in large area have been used as substrates [14,17,18,20,23]. However, Si wafers which are easily available in large size with low cost may be able to be used as the substrate for epitaxial growth of TiC to extend its applications in many fields. Even though the lattice mismatch between TiC and Si is ~20% which is much larger than that for conventional heteroepitaxy which requires a small value usually less than 9%, it is still possible for epitaxial growth of TiC on Si by domain matching epitaxy (DME) as already demonstrated in many material systems such as TiN on Si [24].
Epitaxial growth of TiC films by reactive magnetron sputtering at relatively high temperature may be beneficial for obtaining high crystalline film quality [18,23]. However, epitaxial growth of TiC on Si substrate by reactive magnetron sputtering, as well as the influence of CH4 flow ratio, has rarely been reported in the literatures [25]. For growth of epitaxial TiC on Si at higher temperature, a few issues have to be addressed such as SiC formation in competition with TiC under carbon-rich conditions in addition to the reaction of Ti with Si to form silicides or Ti–Si–C compound above 1000 °C [26,27,28]. Also, it is known that the formation of graphite and amorphous C may occur by reactive sputtering with carbon-containing gas in high concentration [29].
In this study, we present the results of heteroepitaxial growth of TiC film on Si (100) substrates by reactive magnetron sputtering at high deposition temperature. The influence of the CH4 flow ratio on crystalline quality, surface morphology, elemental composition, and electrical resistivity of TiC film on Si is investigated. Also, the characteristics of the TiC/Si interface and the evolution of film microstructure with thickness are presented.

2. Material and Methods

TiC films were deposited on 1 × 1 cm2 p-type (100) Si substrates by reactive direct current (DC) magnetron sputtering of a metallic Ti target in a discharge of Ar (99.9999% purity) and CH4 (99.999% purity) atmosphere. The Ti target of 99.995% purity (Summit-Tech, Taiwan) was fabricated from vacuum melting technique and had a disk shape in a size of 2 inches in diameter and 6 mm thickness. The Si substrates were cut from 6 inch p-type Si (100) wafers in 600 μm thickness (1–5 Ω·cm resistivity). The substrates were cleaned in ultrasonic baths of acetone, methanol, and ethanol. The Si surface oxide layer was removed by using a 6% hydrofluoric acid aqueous solution, followed by blown dry with dry N2 gas before placing it into the vacuum chamber. After evacuation to a pressure <2.66 × 10⁻⁴ Pa, the stage was heated to 870 °C for 30 min to reduce the residual gas contamination in the chamber.
Prior to deposition, pre-sputtering of the Ti target was first carried out with pure Ar plasma to remove any surface contamination, and a clean vacuum condition was consequently obtained due to the gettering effect of sputtered Ti atoms. The gas mixture of CH4 and Ar was then used for sputtering, and the flow ratio of CH4/(Ar + CH4) was varied from 3% to 6% (hereinafter referred to as “CH4 flow ratio” or “CH4 ratio”). The deposition time for all conditions was 15 min, and an additional sample was prepared in the condition for 5% CH4 and 6 min. The working pressure was maintained at 0.4 Pa. For all the sputtering conditions, the distance between the Ti target and Si substrate was set at 6 cm, the applied DC power was fixed at 50 W, and the deposition temperature was 870 °C.
Structural properties of the deposited films were investigated with X-ray diffraction (XRD) (D8 DISCIVER, BRUKER, Billerica, MA, USA). For general XRD characterization, Cu Kα radiation was used for 2θ-ω scan with step size of 0.02°, in-plane scan with 0.002°, and ϕ-scan with 0.5°. For high-resolution XRD, monochromatic X-ray of Cu Kα1 was used for 2θ-ω and ω (X-ray rocking curve) scans with step size of 0.002°. Surface morphologies of the deposited films were examined with scanning electron microscopy (SEM) (JSM-7800F Prime, JEOL, Akishima, Tokyo, Japan). X-ray photoelectron spectroscopy (XPS) (PHI QuanteraII, ULVAC-PHI, Chigasaki, Kanagawa, Japan) with a monochromatic Al Kα radiation source was used to determine chemical compositions. Electrical resistivities of the deposited films were measured by using four-point probe. Microstructural characterization of the films was examined with cross-sectional transmission electron microscopy (TEM) and scanning transmission electron microscopy (STEM) (ARM200F, JEOL, Akishima, Tokyo, Japan) at 200 kV. Cross-sectional TEM specimens were prepared by Ga+ focused ion beam (FIB) (NX2000, HITACHI, Chiyoda, Tokyo, Japan).

3. Results and Discussion

3.1. Influence of the CH4 Flow Ratio on Film Characteristics

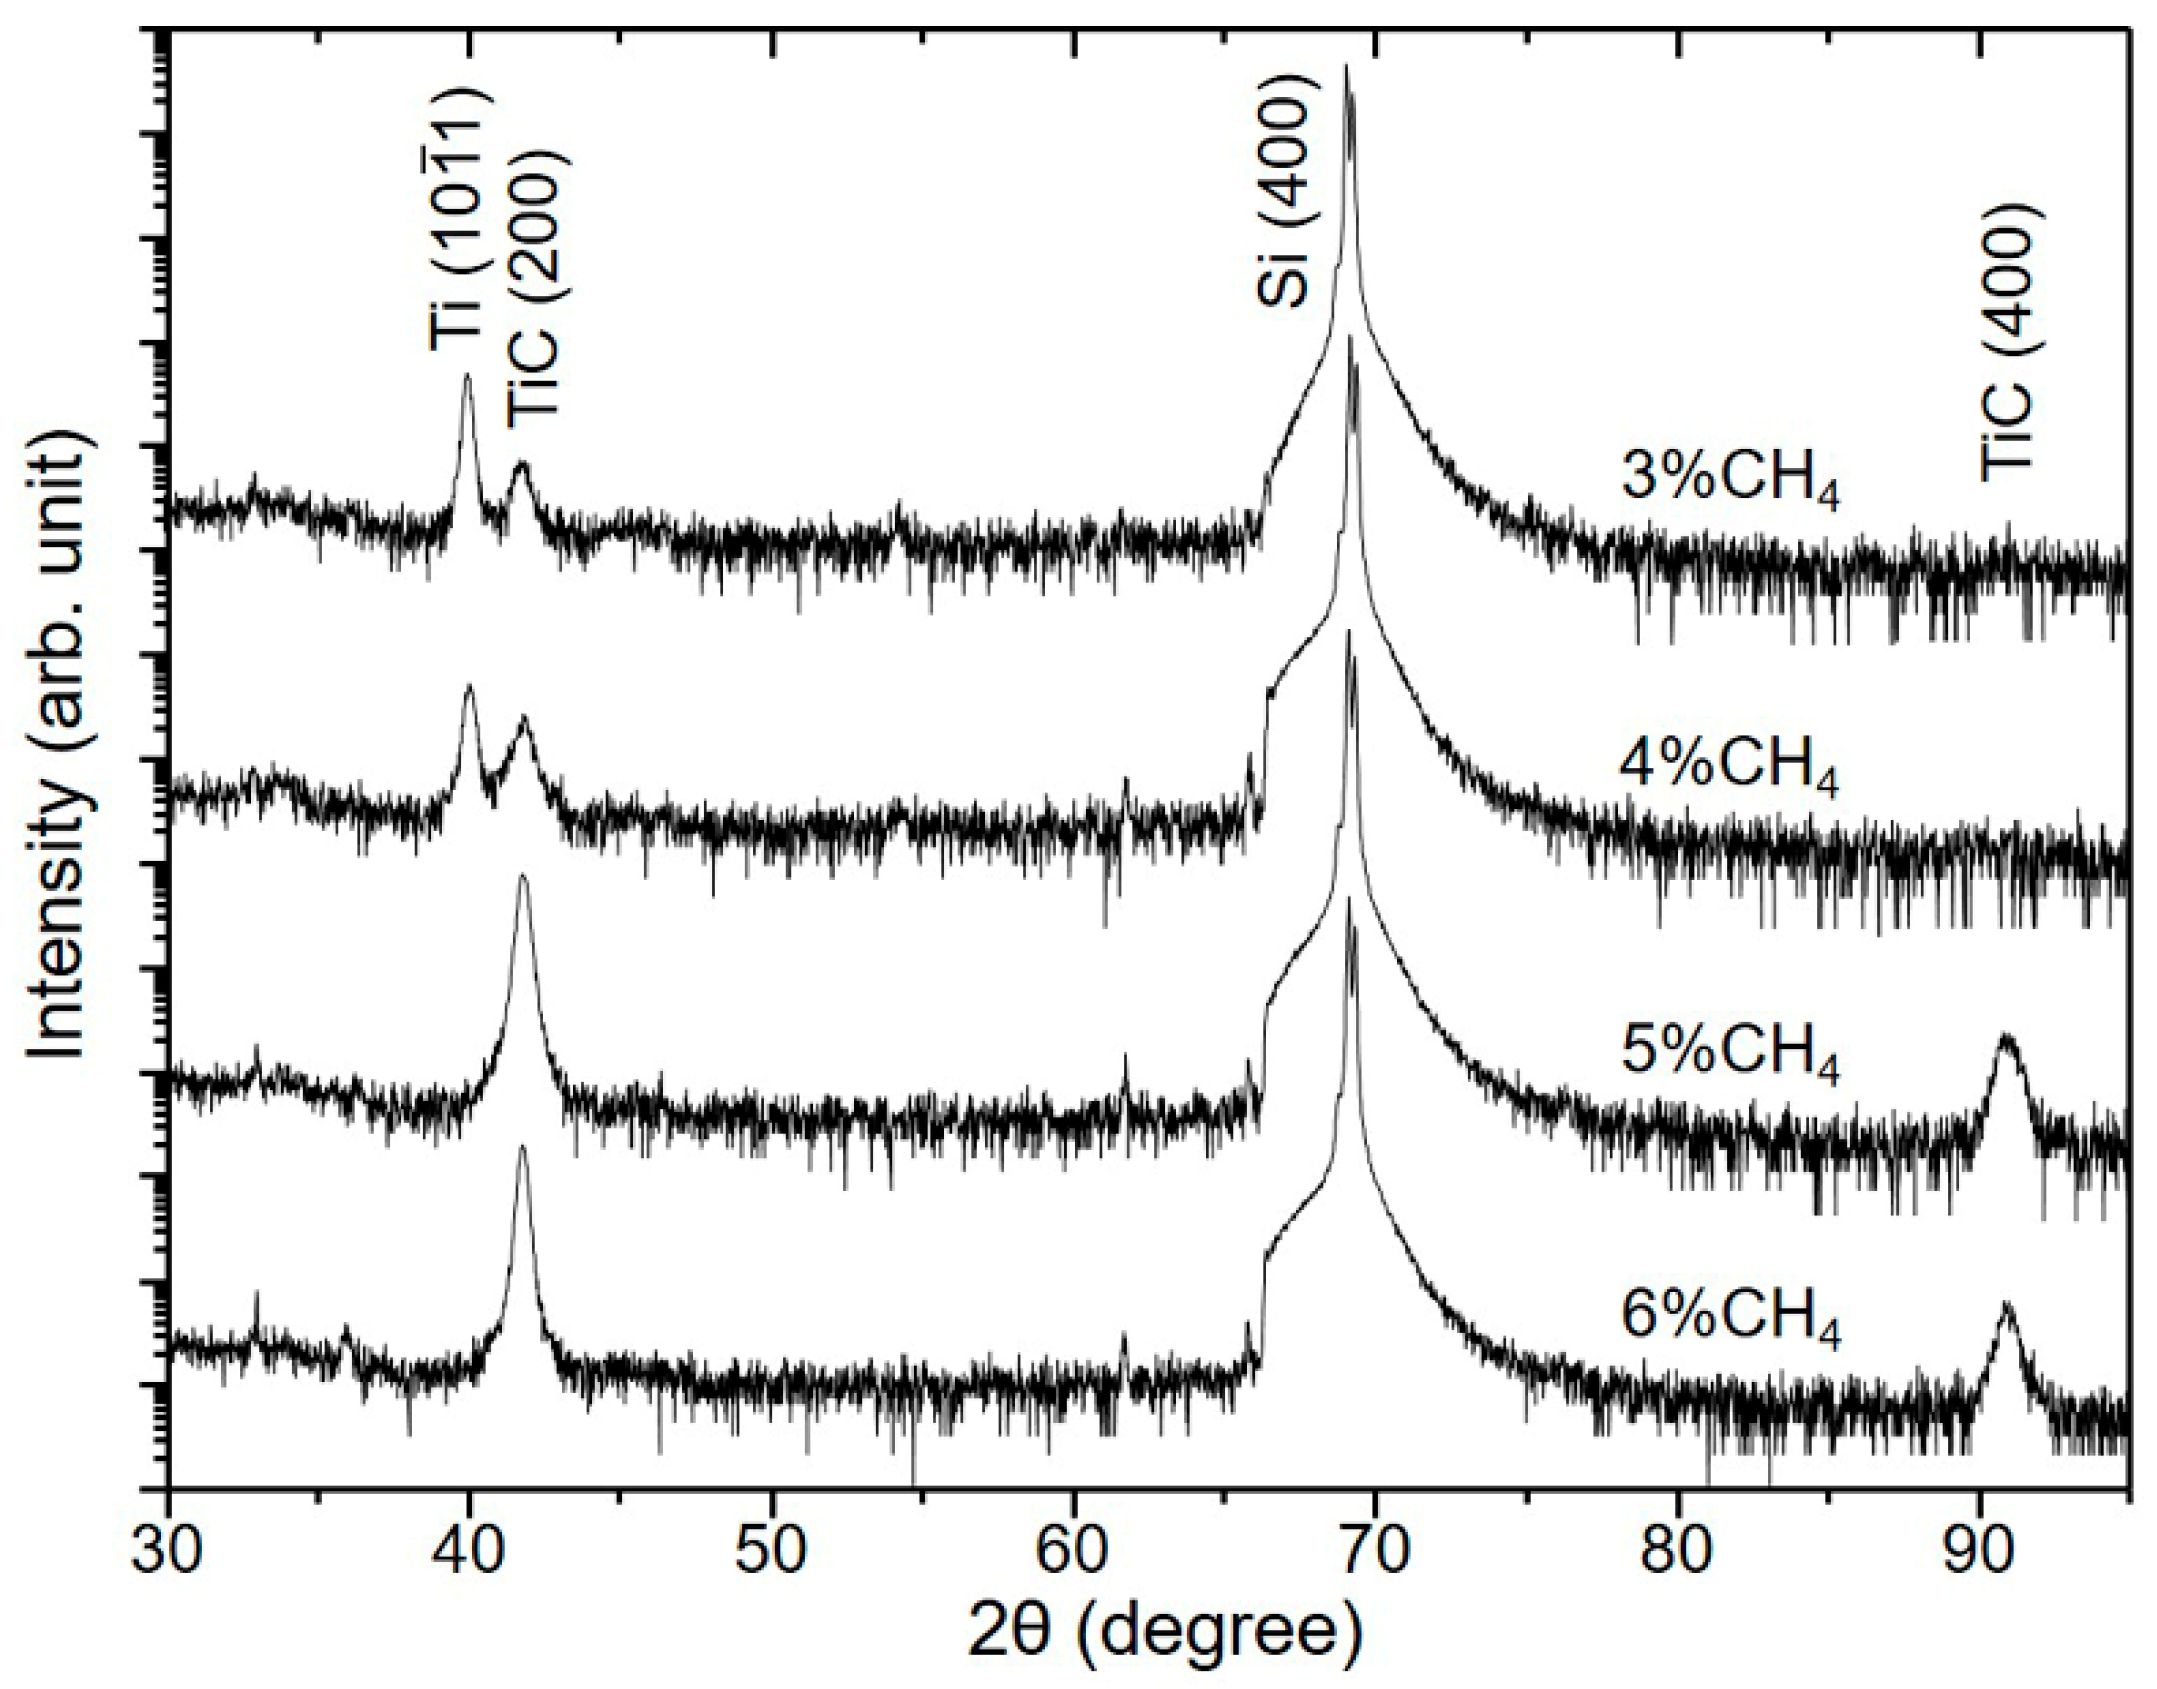
Figure 1 shows typical XRD 2θ-ω patterns of the deposited films grown on Si (100) substrates for 15 min with the CH4 flow ratio varying from 3% to 6%. The diffraction peaks identified at 2θ values ~41.7°and ~90.8° are corresponding to TiC 200 and TiC 400 reflections, respectively [30], in addition to Si 400 at 69.129°. The additional peak at 40.17° which is only observed for the CH4 flow ratio of 3% and 4% is from 10 1 ¯ 1 reflection of hexagonal-close-packed (hcp) Ti. While the intensity of the Ti (10 1 ¯ 1) peak decreases with the CH4 flow ratio, the TiC (200) peak is seen to have an increased intensity. The results suggest that more C atoms may be available for reaction with Ti to form TiC when the CH4 flow ratio is increased.
As the XRD patterns show that TiC in each deposited film only exhibits 200 and 400 reflections, the deposited TiC is obviously in <100> orientation on (100) Si substrate. XRD ϕ-scans of all the TiC films deposited on Si (100) substrate were then performed with Si 311 and TiC 311 reflections to determine the orientation relationship of TiC with Si. All the ϕ-scan patterns of the TiC films exhibit the same characteristics as typically shown in Figure 2 obtained from the condition with 5% CH4. Each pattern shows four peaks separated by 90° at the same ϕ angles for both TiC and Si, indicating that TiC is in epitaxy with Si. The orientation relationship is shown to be TiC (100)[0 1 ¯ 1] // Si (100)[0 1 ¯ 1].
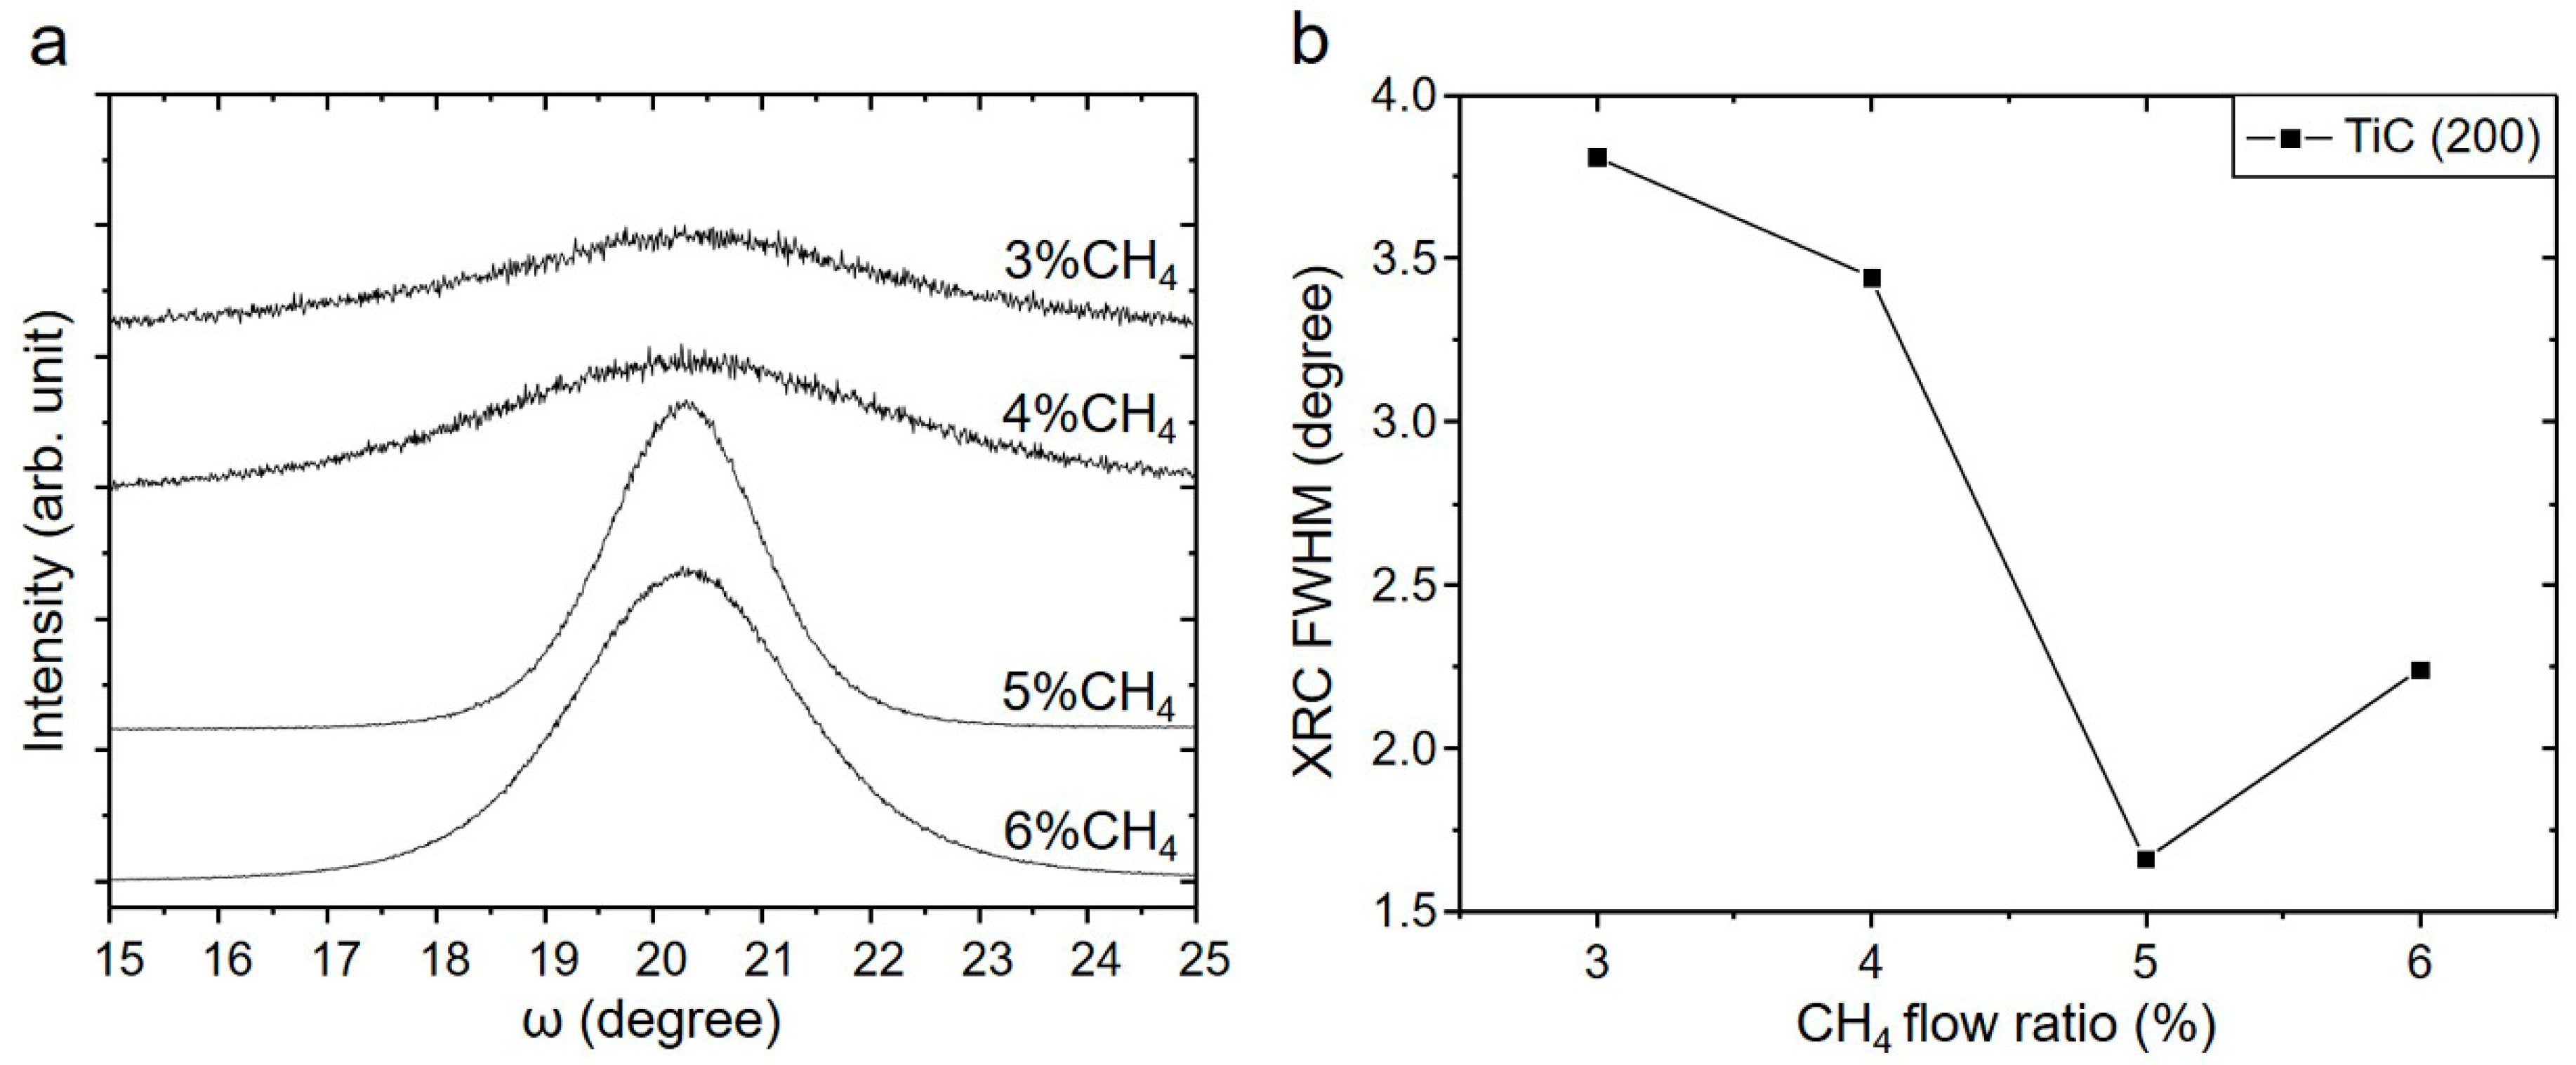
Figure 3a shows the variation of the TiC (200) X-ray rocking curves (XRC) with CH4 flow ratio from which the full width at half maximum (FWHM) for 3%, 4%, 5%, and 6% CH4 is 3.81°, 3.44°, 1.66°, and 2.24°, respectively, as plotted in Figure 3b. The FWHM results suggest that the crystalline quality of TiC may be improved with increasing CH4 flow ratio.
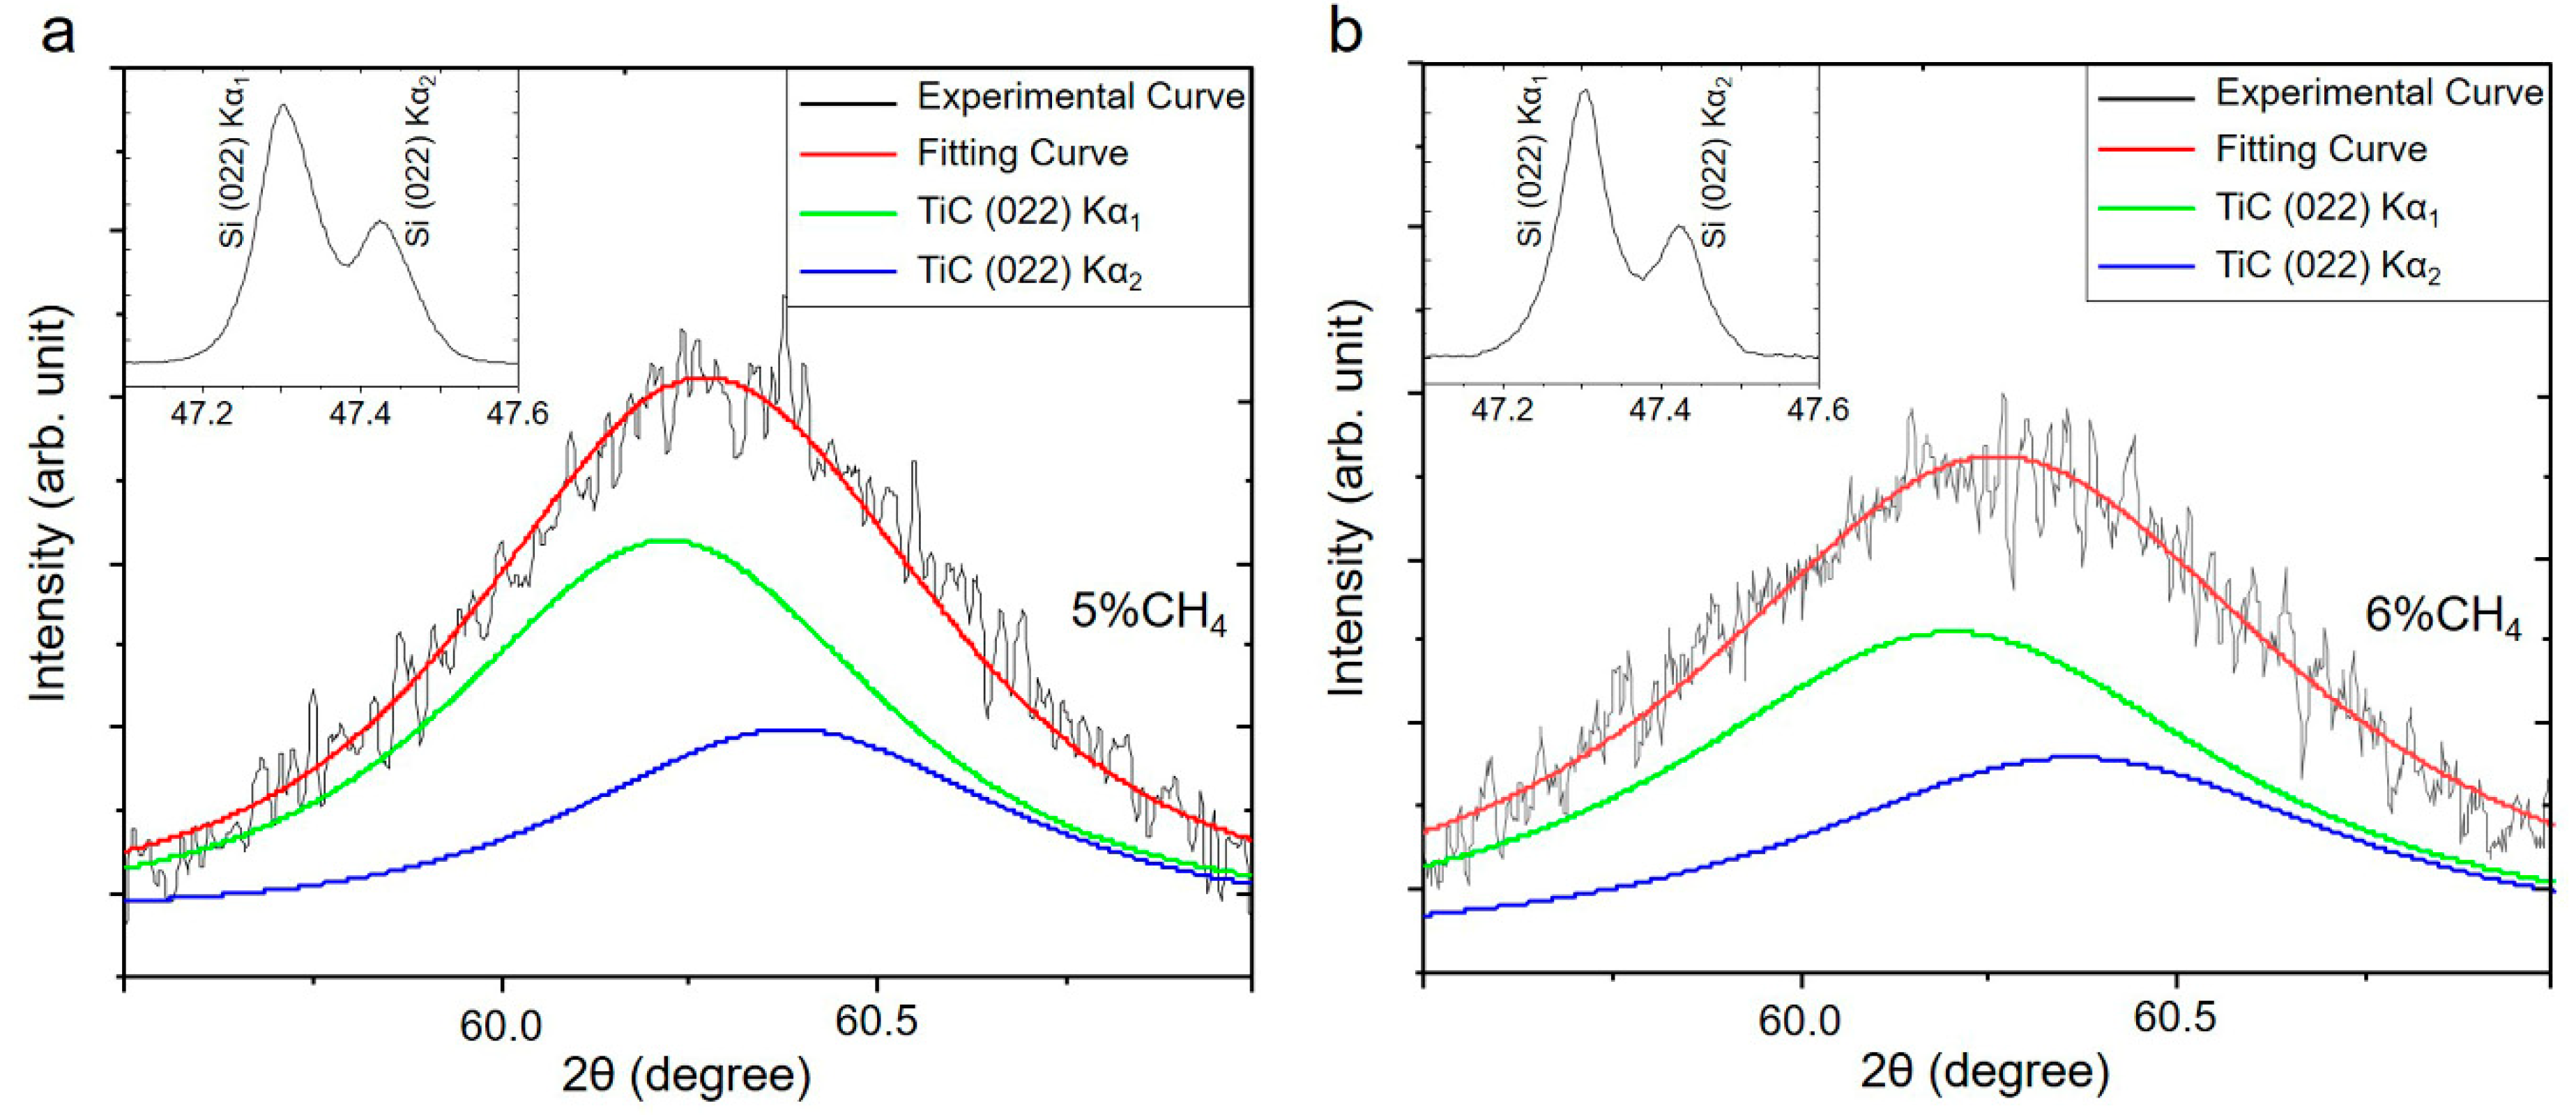
For the samples deposited with 5% and 6% CH4, the peak position of TiC 200 reflection from high resolution XRD is at the 2θ value of 41.766° and 41.780°, respectively, and for TiC 400 reflection at the 2θ value of 90.907° and 90.982° after calibration with Si 004 peak from Cu Kα1 X-ray. From those 2θ values with the corresponding interplanar spacings determined from the Bragg’s law, the out-of-plane (a) lattice parameter is 4.323 ± 0.001 Å for 5% CH4 and 4.321 ± 0.001 Å for 6% CH4, showing that it shifts to a slightly lower value with CH4 flow ratio. In order to determine the relaxed lattice constant (ao), in-plane diffraction of TiC 022 reflection has been carried out to deduce the in-plane (a) lattice parameter. To perform in-plane diffraction scan, the samples were tilted to a χ angle of 89°, 2θ and ω angles were aligned with Si 022 reflections from Cu Kα1 and Kα2 X-rays. After the alignment procedure, 2θ-ω scans were performed from 45° to 65° to obtain TiC 022 reflection as shown in Figure 4.
As can be seen, the TiC peak appears almost at the same 2θ angle in both in-plane patterns within experimental error after calibration with Si peaks. Also, the corresponding interplanar spacing of TiC (022) can be obtained after curve fitting to deconvolute the contribution from Cu Kα1 and Kα2 X-rays. Thus, the in-plane (a) lattice parameter is determined to be 4.343 ± 0.002 Å for both 5% and 6% CH4 cases. For a cubic structure, the relaxed lattice parameter, ao, can be determined from Equation (1) [31]
a 0 = a ( 1 2 v ( a a ) a ( 1 + v ) )
where ν is the Poisson’s ratio, and the equation can be derived by Formula (1.23) in [32]. From the literature, 0.19 is used for v [1]. After substituting the values of a and a into Equation (1), ao is calculated to be 4.329 and 4.328 Å for 5% and 6% CH4 samples, respectively. It is known that TiCx is a substoichiometric compound with x ≤ 0.99 as illustrated in the equilibrium Ti−C binary phase diagram, and its lattice parameter decreases with increased x in the range of 0.85 ≤ x ≤ 0.99 [1]. Hence, the lattice parameter of 4.329 Å for TiCx may correspond to x = 0.96, and the value of 4.328 Å for x = 0.99. For sputtering with 6% CH4 condition, it may be reasonable for the TiC film to be enriched with C, i.e., x is closer to 1 in comparison with the 5% CH4 condition which has less C available during sputtering. Also, the slightly smaller TiC lattice parameter for the 6% CH4 sample leads to a larger deviation from the 5/4 DME ratio between TiC and Si [(4.328 × 5)/(5.431 × 4) = 0.9961 is further away from 1 than (4.329 × 5)/(5.431 × 4) = 0.9964], such that it may result in a lower film quality as shown with a larger XRC FWHM value than that for 5% CH4.
SEM micrographs as shown in Figure 5 reveal the surface morphology for different CH4 flow ratios. With increasing the CH4 ratio, the coalescence of the film is more complete with a smooth surface morphology without cavities. The film thickness determined by cross-sectional SEM observations for 3%, 4%, 5%, and 6% CH4 ratio is 246, 167, 130, and 148 nm, respectively (not shown). The thickness significantly reduces from 246 nm to 130 nm when the CH4 ratio is increased from 3% to 5%. Further increasing the CH4 ratio to 6% slightly increases the thickness. For the decrease of the deposition rate with CH4 ratio (3% to 5%), it can be reasoned with carbide formation on the target surface with lower sputter yield similar to compound formation on the metallic target for reactive sputtering with oxygen and nitrogen [33,34]. However, in the case of CH4/Ar system, an additional carbon layer may further form with the carbide layer on the target surface under a high CH4 condition. As the carbon layer has a higher sputter yield than carbide, it may raise the deposition rate for further increasing the CH4 ratio from 5% to 6% [35,36].
For the samples deposited with 3% and 4% CH4, XPS spectra for C-1s and Ti-2p after sputtering etching for 6.5 min are shown in Figure 6. In Figure 6a, the C-1s peak of binding energy at 281.6 eV can be attributed to the Ti−C bonds in TiC, and the absence of sp2 C peak at 284.6 eV clearly indicates that formation of graphitic and amorphous carbon phases in the deposited film can be neglected. In Figure 6b, the Ti 2p3/2 and 2p1/2 peaks can be deconvoluted into those of metallic Ti and TiC after curve fitting as the following. The peaks at 453.8 eV and 454.6 eV represent Ti-2p3/2 from metallic Ti and TiC, and the peaks at 459.8 eV and 460.6 eV are associated to Ti-2p1/2 from metallic Ti and TiC [37,38], respectively. The results confirm the presence of metallic Ti in the deposited films for 3% and 4% CH4 conditions shown in the above XRD results. Also, several studies have reported that the Ti 2p3/2 binding energy of TiCx (x = 0.86–0.97) increases with increasing x [39,40]. With respect to the binding energies of metallic Ti, the shift of 2p3/2 binding energies in TiCx is shown to be 0.8 eV for both of 3% and 4% CH4 conditions, which can be corresponding to x = 0.95.
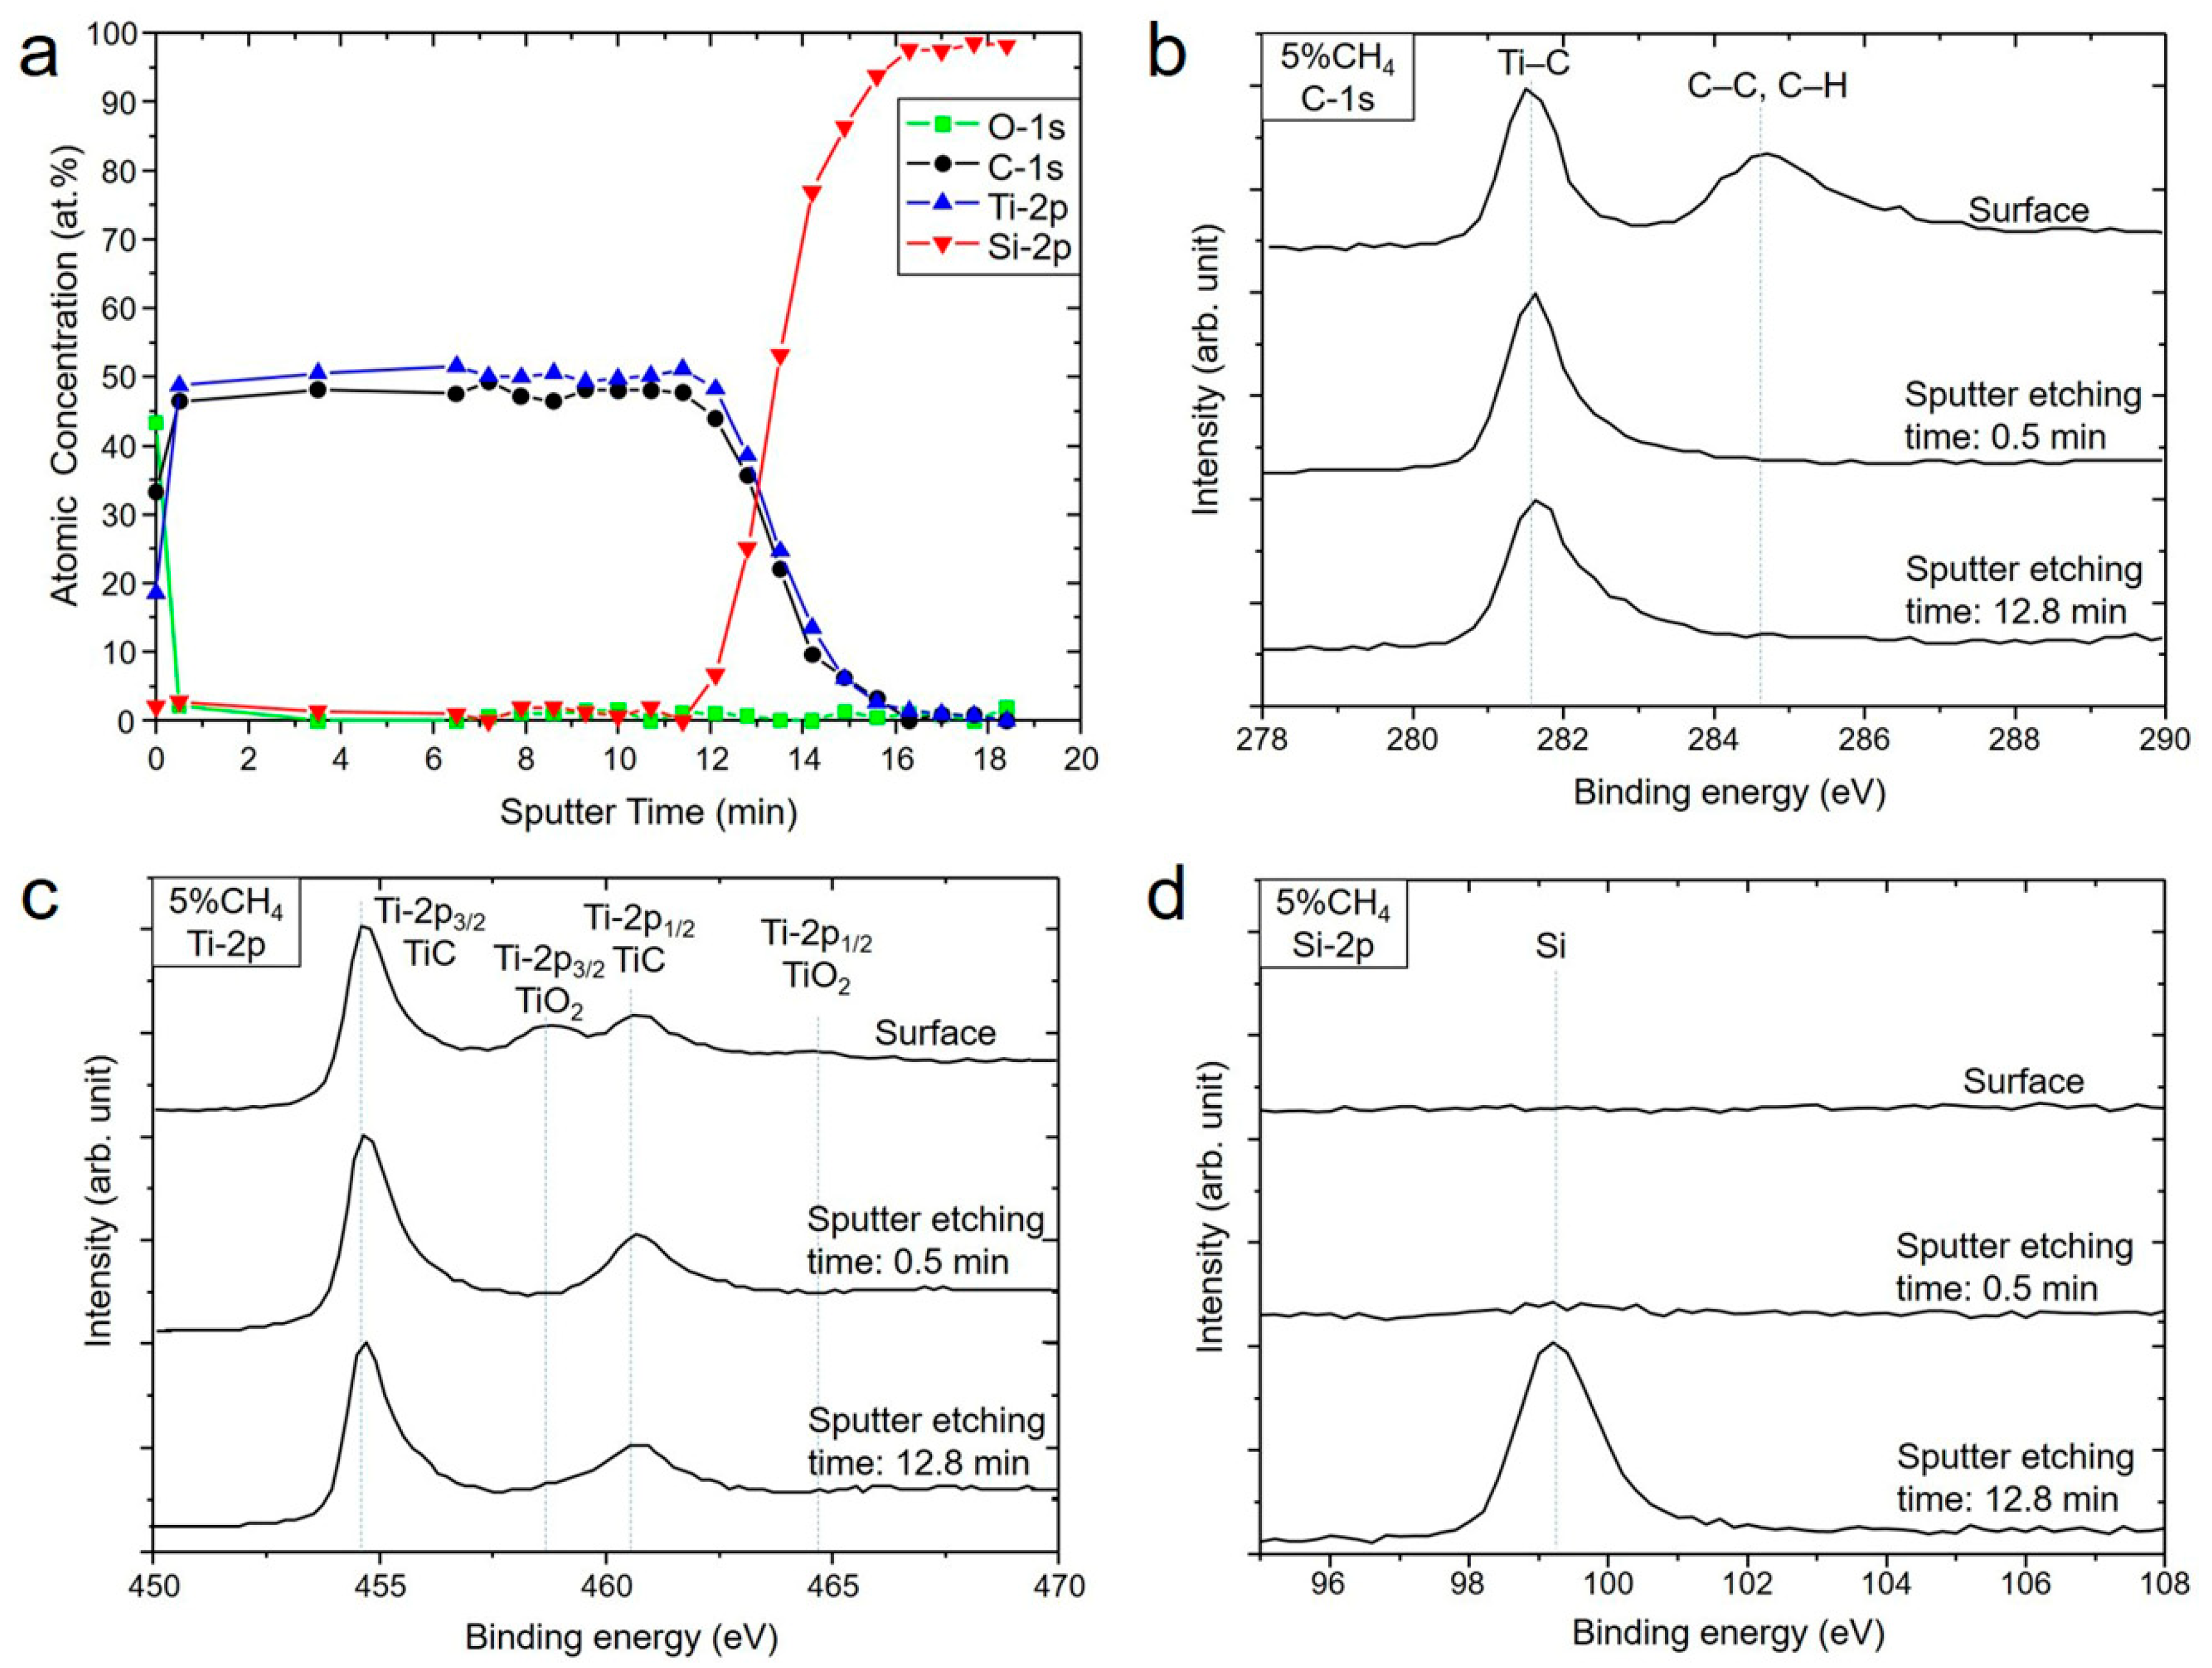
For 5% and 6% CH4 conditions, the XPS results can show that the deposited films are fully consisted of TiC as shown in Figure 7 for the depth profile and spectra of C, Ti, and Si obtained at different depth (6% not shown). The XPS depth profile in Figure 7a shows that nearly 43% oxygen concentration on the surface, suggesting that TiC has been partially oxidized. The thickness of the surface oxide is estimated to be less than 5 nm. The [C]/[Ti] ratio in relative atomic fraction is almost constant with depth in the film, implying that the film composition is uniform. Figure 7b–d show C-1s, Ti-2p, and Si-2p XPS spectra from the same sample with different sputter etching time corresponding to different depths. In Figure 7b, the C-1s spectra for 5% CH4 show the same characteristic of Ti–C binding energy at 281.6 eV as those of the 3% and 4% CH4 samples (Figure 6a), suggesting that only the TiC phase is present in the film without graphitic and amorphous carbon phases. In Figure 7c, the Ti-2p spectrum obtained before surface cleaning exhibits two groups of Ti-2p3/2 and Ti-2p1/2. In addition to the binding energies at 454.6 and 460.6 eV for Ti–C bonds in TiC, the Ti-2p3/2 component at 458.6 eV corresponds to Ti–O bond in TiO2, and it is not observed after Ar sputtering for 0.5 min [41,42]. The co-existence of both TiO2 and TiC on the film surface suggests that the TiC film has been partially oxidized after exposure to air. Moreover, all the Ti binding energies in the spectra obtained after Ar sputtering for 0.5 min and 12.8 min can be attributed to TiC instead of metallic Ti. The evidence supports the XRD results that the film consists of TiC phase only. The Si-2p spectrum recorded around the interface (after 12.8 min of sputter etching) as shown in Figure 7d, reveals only one peak at 99.2 eV which corresponds to Si–Si binding energy without Si–C one, suggesting that no SiO2, SiC, Ti silicide, and TiSiC form at the TiC/Si interface. Compared with standard formation enthalpy of β-SiC (ΔH298 = −28.03 kJ/mol), it can be understood that TiC (ΔH298 = −184.6 kJ/mol) is more thermodynamically stable [26,43]. In addition, it has been reported that the formation of Ti5Si3 and Ti3SiC2 often occurs above 1000 °C [44,45]. Therefore, no binding signals from SiC and Ti-related silicide at the TiC/Si interface can be observed in XPS spectra shown above.
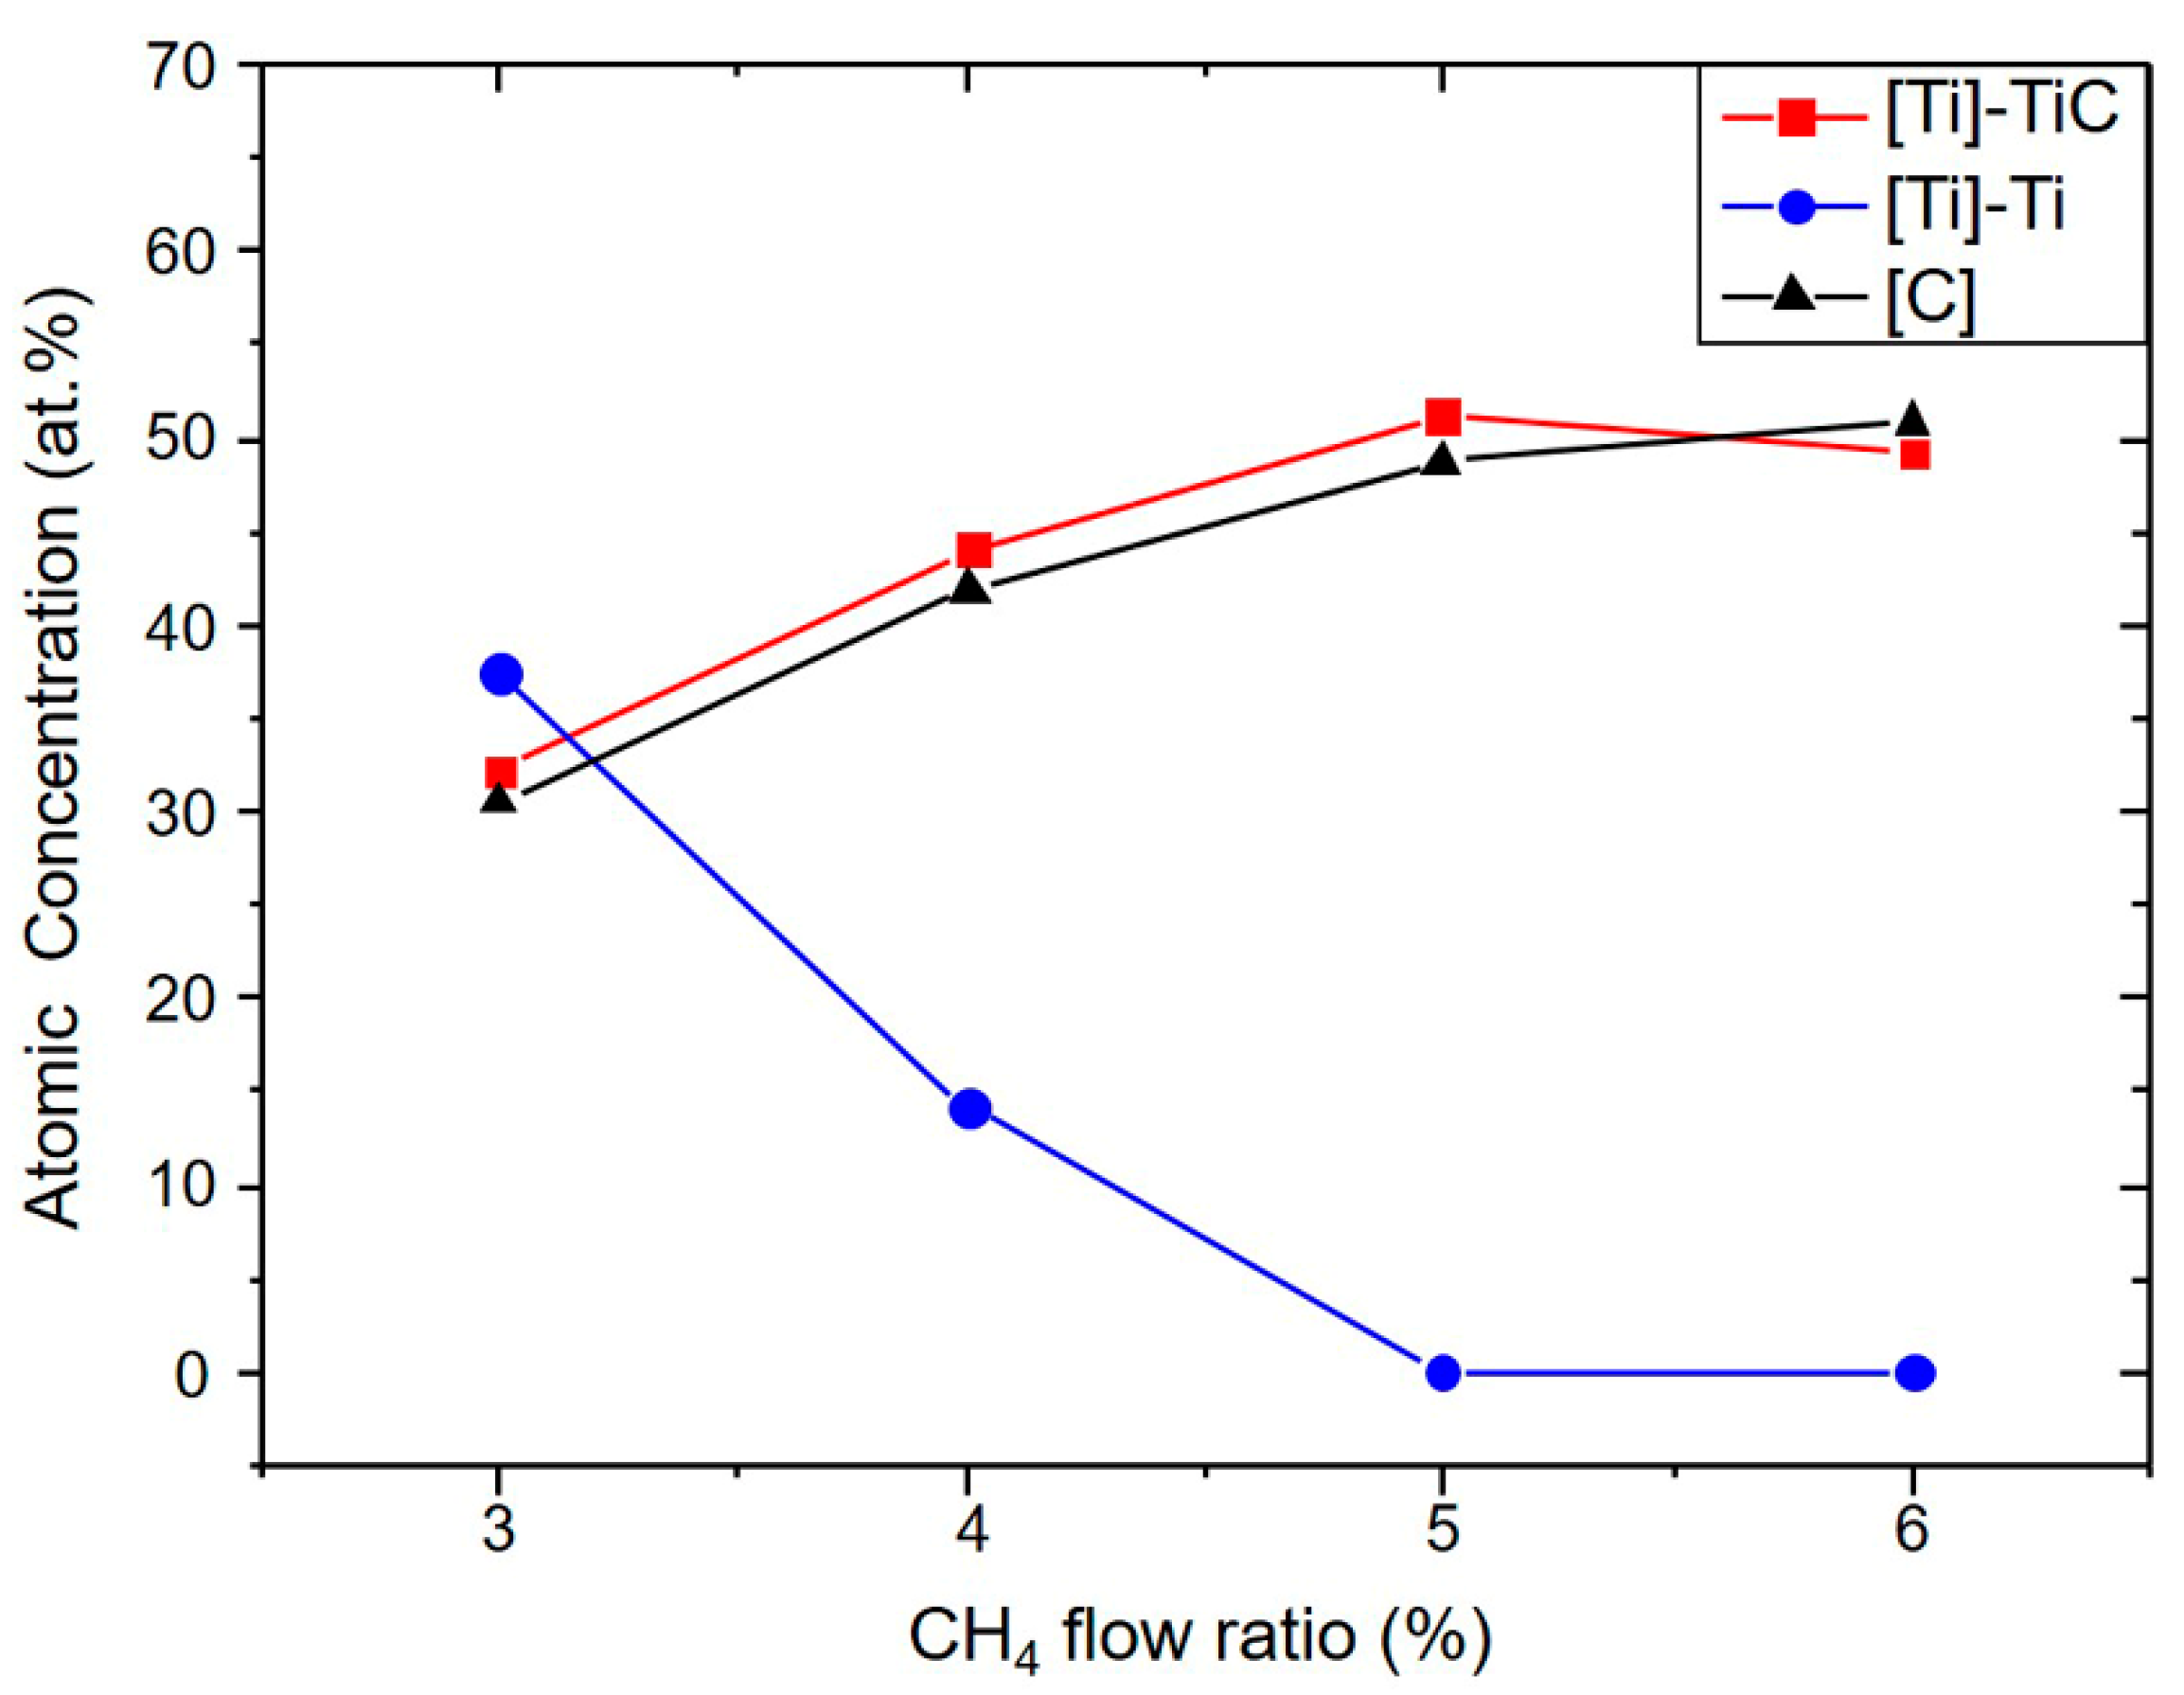
From the XPS results obtained from all the films, the elemental compositions of the TiC films in relative atomic fraction versus CH4 flow ratio are presented in Figure 8. The atomic fraction of titanium [Ti] for metallic Ti and TiC was determined from the ratio of the integrated intensity for Ti-2p3/2 peaks in Figure 6. The relative [C]/[Ti] ratio is nearly close to 1 in TiC, and the [Ti] of metallic Ti decreases and disappears with increasing the CH4 ratio from 3% to 6%. The higher [C]/[Ti] ratio for 6% CH4 than that for 5% CH4 is consistent with the composition deduced from lattice parameter. From the above results, formation of TiC by sputtering deposition requires a CH4-rich condition, and more CH4 can result in higher stoichiometry (i.e., increase in x).
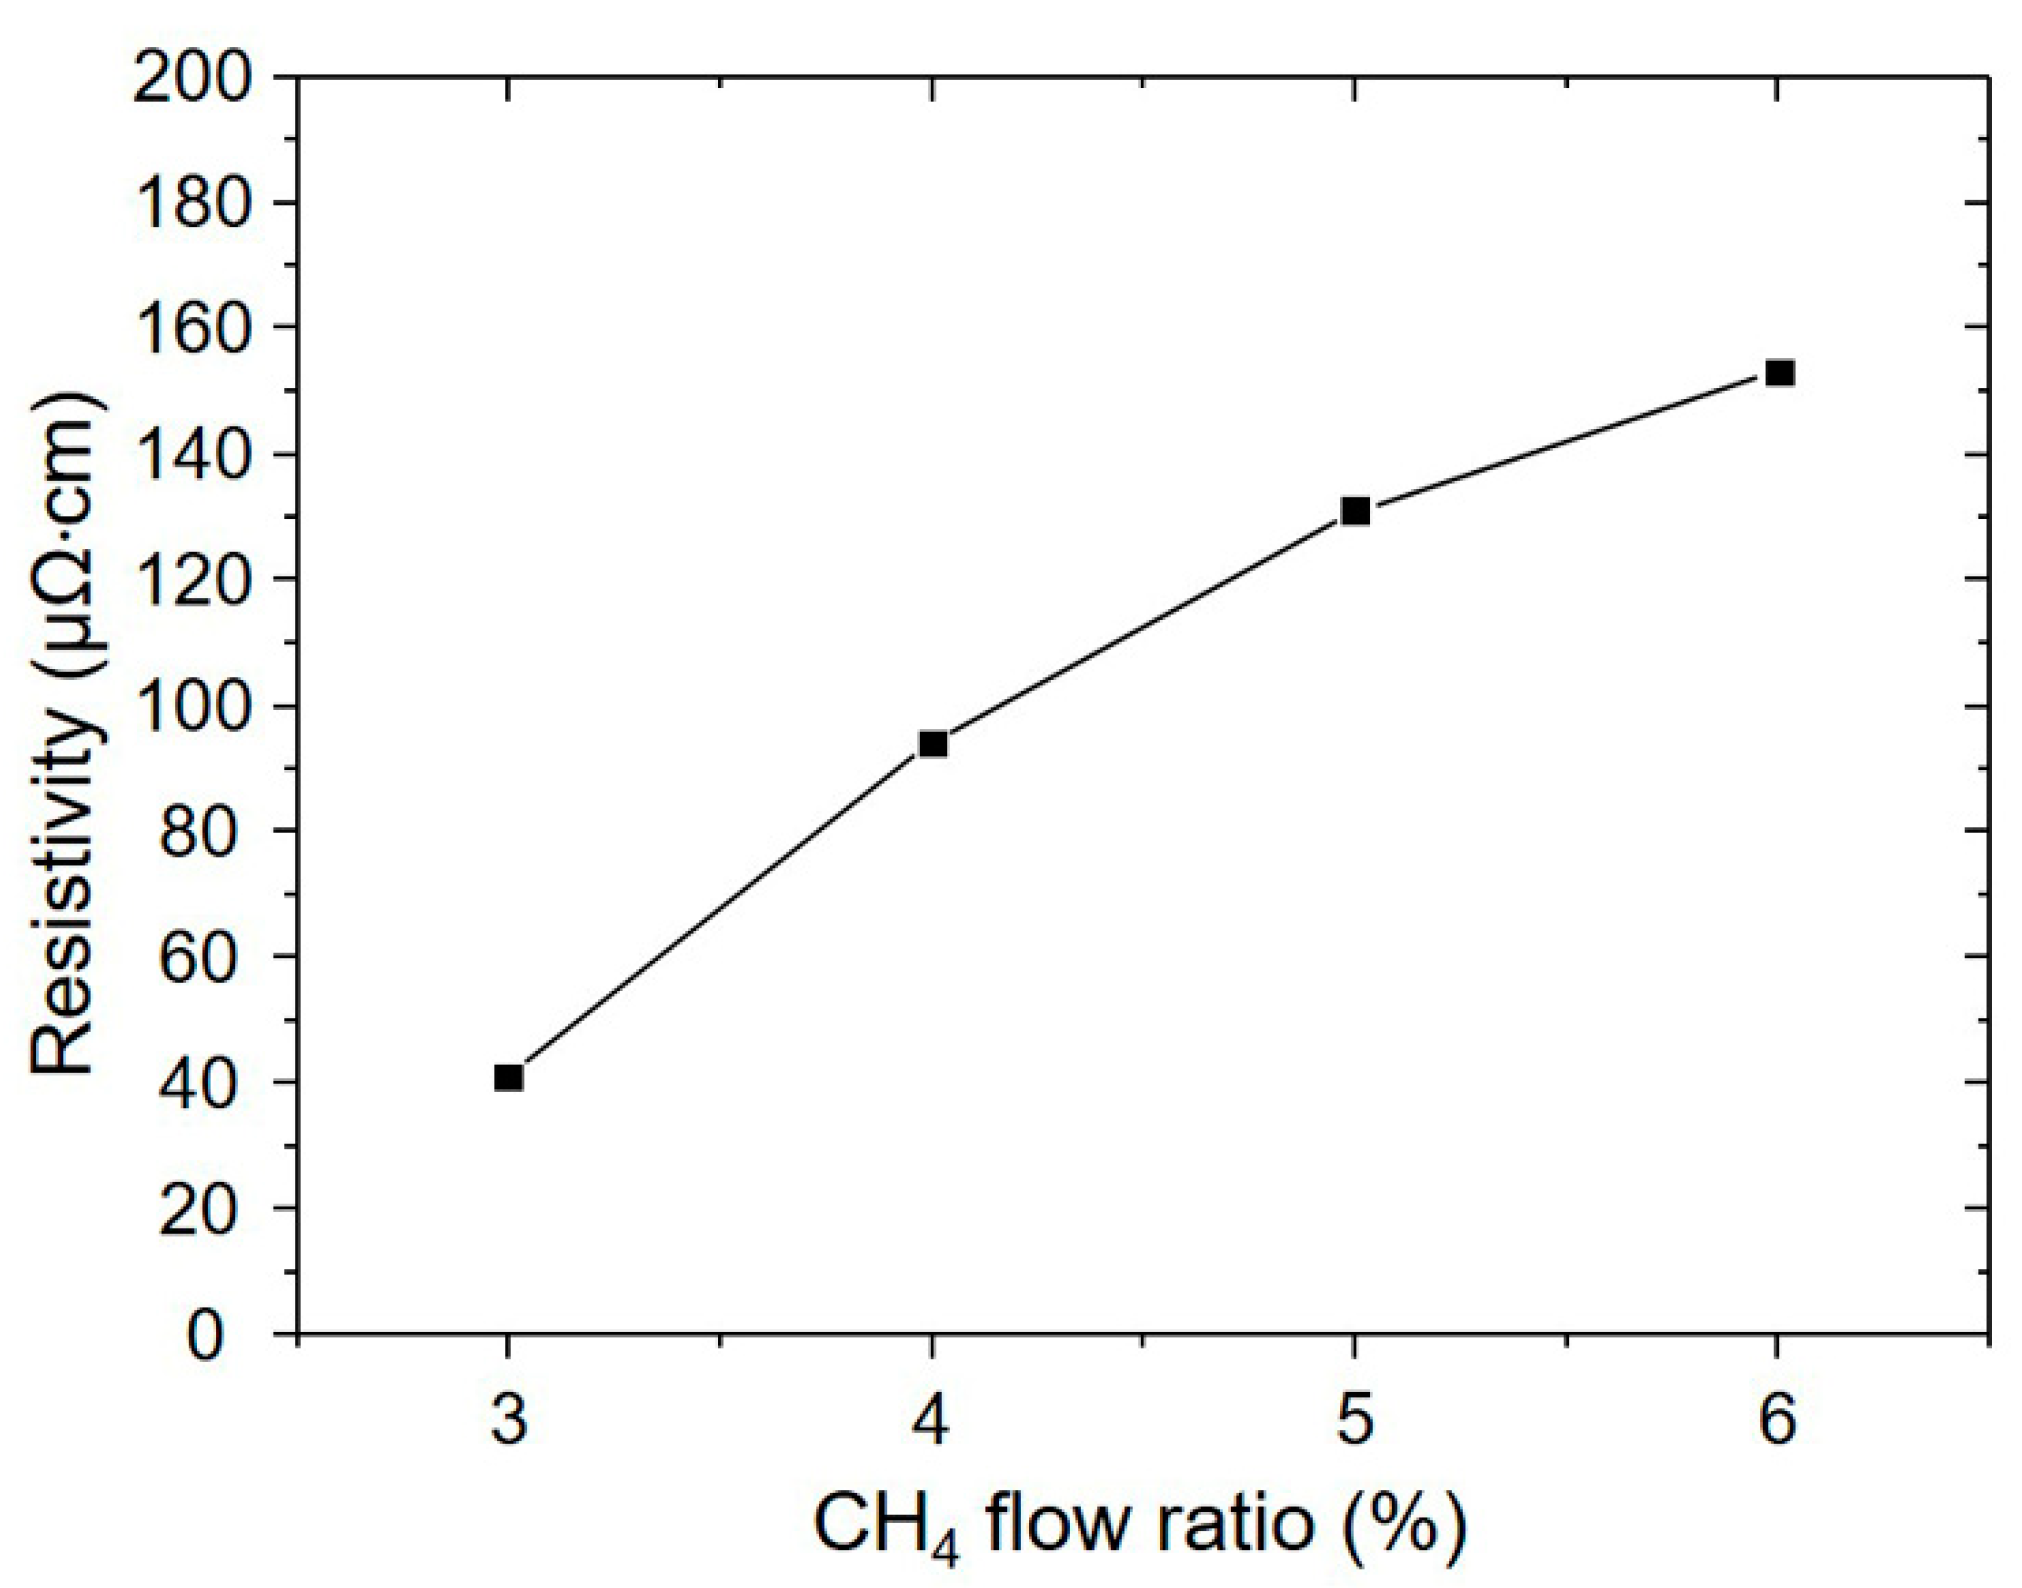
Figure 9 shows that the electrical resistivity of the film deposited with different CH4 flow ratio increases from 41 to 153 μΩ·cm with increasing the CH4 ratio. The low resistivity is clearly due to the presence of the Ti metal as shown from the XPS and XRD results. Without metallic Ti, the film resistivity of TiC compound is above 120 μΩ·cm similar to the values of epitaxial TiC film and single crystal TiC reported by [23,46,47]. Also, by comparison of the resistivities of both films deposited with 5% and 6% CH4, it is shown that better film quality (lower XRC FWHM) results in a lower resistivity.

3.2. Evolution of Microstructure with Film Thickness

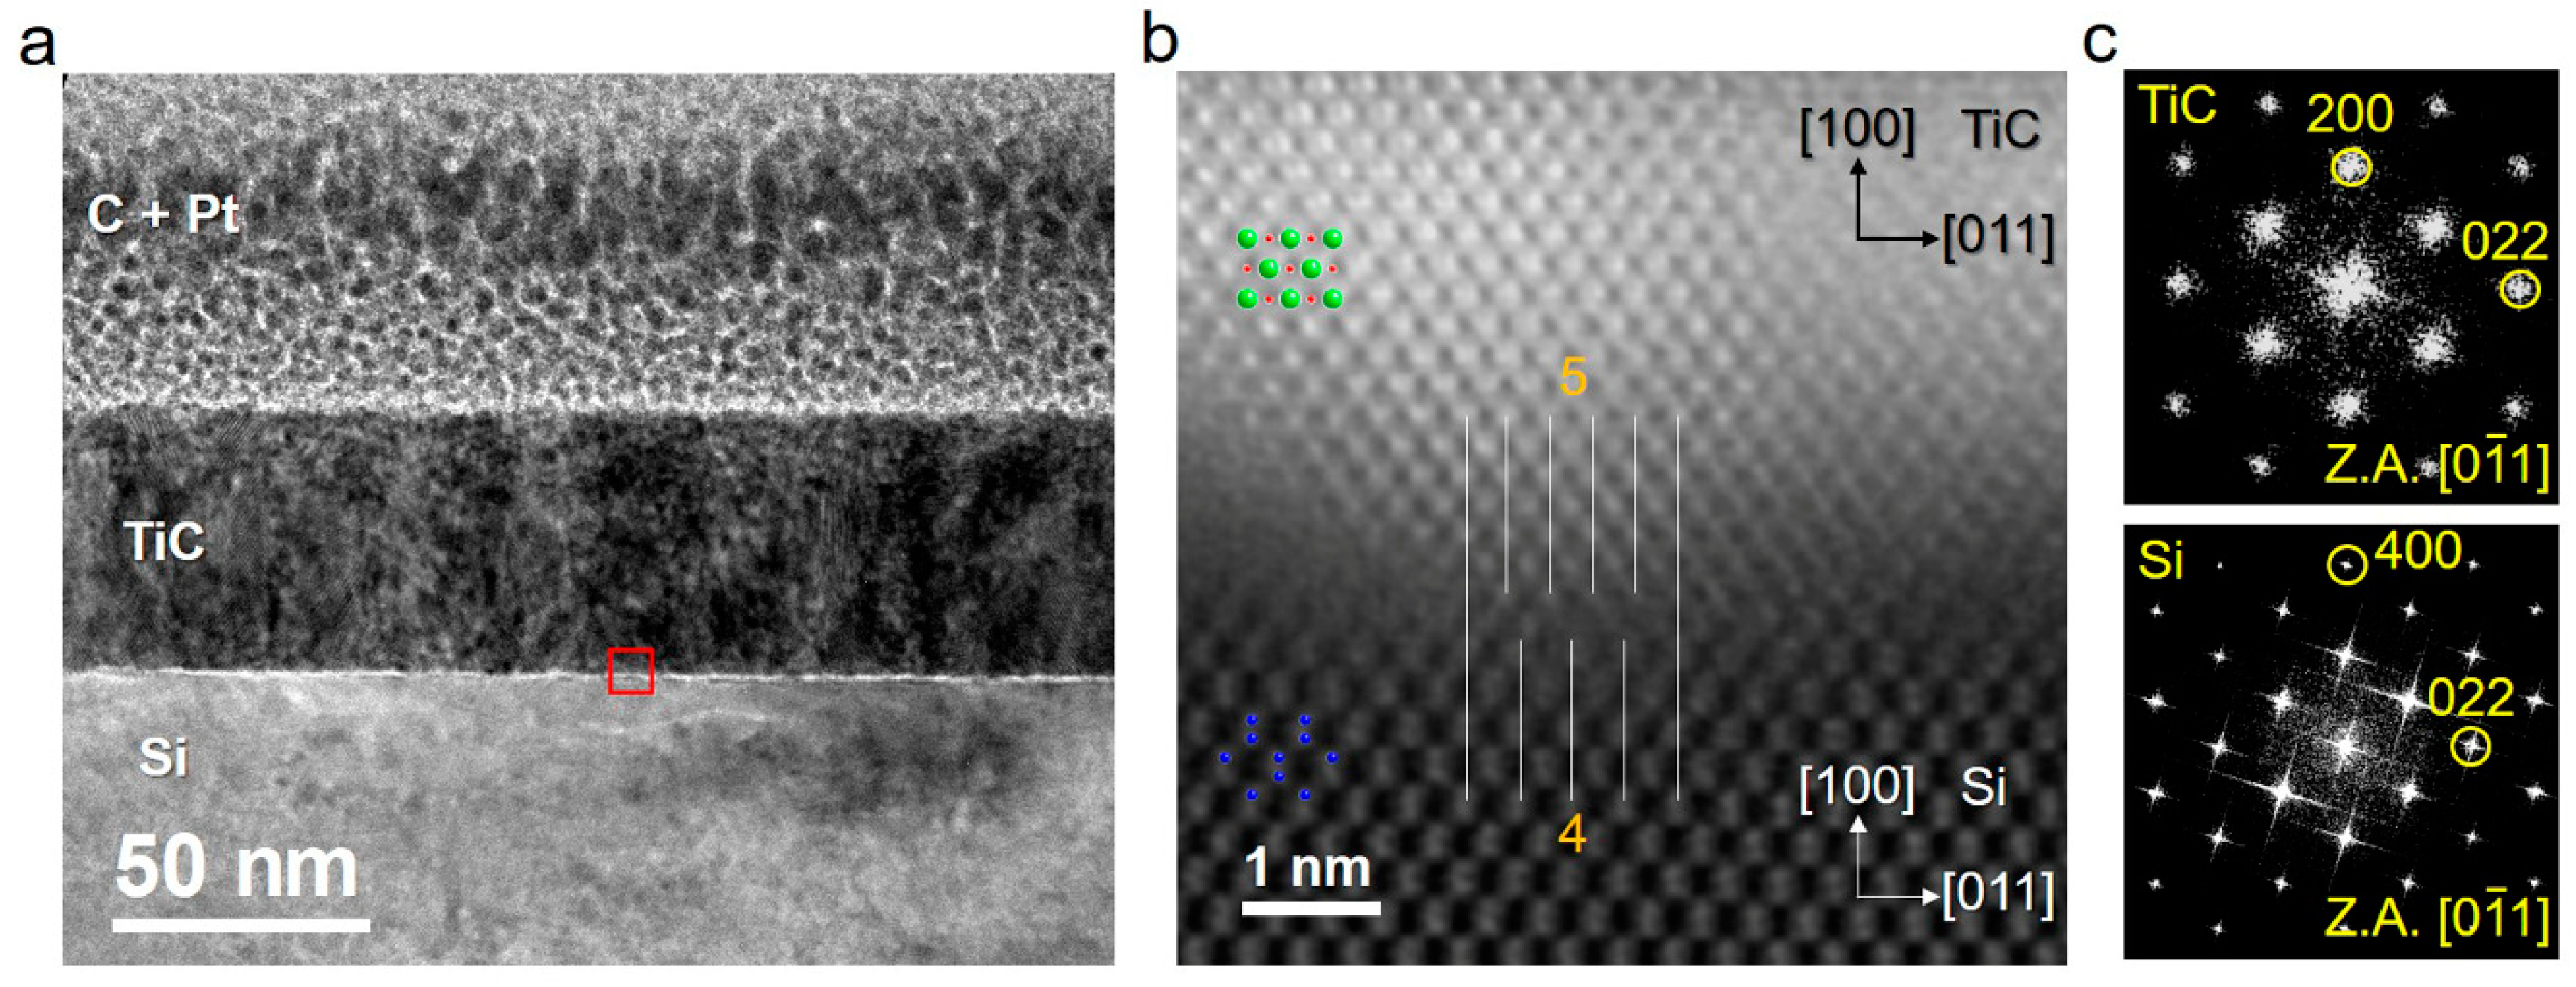
The samples grown with 5% CH4 which exhibit better crystallinity are chosen for further study of the effect of film thickness on the microstructure. For the sample with deposition time for 6 min, the XRD 2θ-ω pattern (not shown) is similar to that of the sample for 15 min deposition in Figure 1, exhibiting only 200 and 400 TiC reflections, and the ϕ-scan shows TiC in epitaxy with Si as well. Furthermore, the measured TiC (200) XRC FWHM is 1.95°, and the electrical resistivity is 97 μΩ·cm. Figure 10a shows a typical cross-sectional bright field (BF) TEM image taken along the Si [0 1 ¯ 1] zone axis from the 6 min sample. From image contrast, three layers corresponding to the surface coating of C and Pt, TiC, and Si from top to bottom can be clearly identified, respectively. The thickness of TiC is approximately 50 nm, which gives an average deposition rate about 8 nm/min. The image contrast in the TiC film is uniform, implying that TiC of the whole area is grown in the same orientation. Figure 10b is a typical annular dark field (ADF) STEM image (Z-contrast) of the TiC/Si interface in atomic resolution (enlarged from the red framed region in Figure 10a) after applying the Wiener filter to reduce image noise. It shows the Z-contrast across the TiC/Si interface, where the bright and gray dots correspond to Ti and Si atomic columns, respectively. The projected atomic configurations of TiC and Si structure models are also illustrated in the image. As can be seen, the TiC/Si interface structure is seen to be flat with steps of one and two atomic layers. According to the arrangement of Ti and Si atomic columns in the ADF-STEM image, five {022} spacings (Ti atomic columns) in TiC match with four {022} spacings in Si as the white lines drawn in Figure 10b. Thus, even though there is a large lattice mismatch of about 20% between TiC [011] (d011 = 3.071 Å) and Si [011] (d011 = 3.840 Å), the epitaxial growth of TiC on Si can be reasoned with DME [24] in the ratio close to 5/4. Figure 10c shows the fast Fourier transform (FFT) patterns from TiC and Si, indicating TiC [0 1 ¯ 1] // Si [0 1 ¯ 1] with TiC (100) // Si (100) in consistence with the epitaxial relationship deduced from the XRD results.
Figure 11a presents a typical cross-sectional BF TEM image of the sample with deposition time for 15 min. The thickness of TiC layer is about 130 nm. For the film growth to about 50 nm thickness, the image contrast and atomic resolution ADF-STEM image observations near the TiC/Si interface (not shown) exhibit similar characteristics to those shown in Figure 10. However, for the film regions above 50 nm thickness, it is clearly seen that diffraction contrast of the image in the TiC layer are varied. The bright regions in a shape like an inverted triangle may be highly tilt or misoriented grains of TiC for which they do not show any reflections in the XRD pattern. In Figure 11b, a typical high resolution TEM image obtained from one of such grains as shown in Figure 11 with the corresponding FFT pattern (Figure 11c) illustrates that it is in an orientation approximately inclined with ~15° from <111>. Such highly misoriented grains may not be observed in the XRD patterns. The appearance of those misoriented grains after growth of a thicker film can be reasoned with relaxation of increased stresses in the film [48,49,50,51,52,53]. It has been often observed in growth of <100> transition metal nitrides of rock salt structure including TiN for which formation of <111> oriented grains occurs after a thicker film is grown with the accumulated film stress in a large extent [54,55,56]. Therefore, the higher electrical resistivity of the thicker film is likely caused by those misoriented grains.

4. Conclusions

Heteroepitaxial growth of TiC film on Si (100) substrate can be achieved by DC reactive magnetron sputtering with 3%–6% CH4 in Ar. A cube-on-cube epitaxial relationship of TiC (100)[0 1 ¯ 1] // Si (100)[0 1 ¯ 1] exists between TiC and Si with 5/4 ratio for domain match across the interface. The relatively smooth surface morphology can be obtained by increasing CH4 flow ratio. At lower CH4 flow ratio, the metallic hcp Ti phase is present in the deposited films which can have a resistivity as low as 41 μΩ·cm, and it is not observed for growth with high CH4 flow ratio which results in the fully formed TiC films exhibiting a high resistivity more than 120 μΩ·cm. Also, the crystalline qualities of epitaxial TiC can be improved by increasing the CH4 flow ratio as shown with the XRC FWHM of TiC (200) from which for the film grown with 5% CH4 exhibits the best quality with a minimum of 1.66°. For the film growth to the thickness exceeding 50 nm, some highly misoriented TiC grains are observed.

Author Contributions

Conceptualization, Y.-S.F. and L.C.; Data curation, Y.-S.F., K.-A.C., and W.-C.C.; Formal analysis, Y.-S.F., T.H.D. and K.-A.C.; Funding Acquisition, W.-C.C. and L.C.; Methodology, Y.-S.F.; Software, T.H.D.; Supervision, L.C.; Validation, Y.-S.F.; Writing—original draft, Y.-S.F.; Writing—review & editing, L.C. All authors have read and agreed to the published version of the manuscript.

Funding

This work was supported by the Ministry of Science and Technology Taiwan, R.O.C. under contract of MOST 107-2221-E-009-009-MY2, 108-2221-E-492-017, and 108-2622-E-492-029-CC3.

Conflicts of Interest

The authors declare no conflict of interest.

References

  1. Pierson, H.O. Handbook of Refractory Carbides and Nitrides; Noyes Press: Park Ridge, NJ, USA, 1996; pp. 71–72. [Google Scholar]
  2. Perry, D.L. Handbook of Inorganic Compounds, 2nd ed.; CRC Press: Boca Raton, FL, USA, 2011; p. 431. [Google Scholar]
  3. Lipatnikov, V.N.; Zueva, L.V.; Gusev, A.I.; Kottar, A. Disorder-order phase transformations and electrical resistivity of nonstoichiometric titanium carbide. Phys. Solid State 1998, 40, 1211–1218. [Google Scholar] [CrossRef]
  4. Oakes, J.J. A comparative evaluation of HfN, Al2O3, TiC and TiN coatings on cemented carbide tools. Thin Solid Films 1983, 108, 173. [Google Scholar] [CrossRef]
  5. Boving, H.J.; Zintermann, H.E. Wear-resistant hard titanium carbide coatings for space applications. Tribol. Int. 1990, 23, 129–133. [Google Scholar] [CrossRef]
  6. Shanaghi, A.; Chu, P.K.; Rouhaghdam, A.R.S.; Xu, R.; Hu, T. Structure and corrosion resistance of Ti/TiC coatings fabricated by plasma immersion ion implantation and deposition on nickel–titanium. Surf. Coat. Technol. 2013, 229, 151–155. [Google Scholar] [CrossRef]
  7. Palma, R.H.; Sepúlveda, A.H.; Espinoza, R.A.; Montiglio, R.C. Performance of Cu-TiC alloy electrodes developed by reaction milling for electrical-resistance welding. J. Mater. Process. Technol. 2005, 169, 62–66. [Google Scholar] [CrossRef]
  8. Gao, Y.; Presser, V.; Zhang, L.; Niu, J.J.; McDonough, J.K.; Pérez, C.R.; Lin, H.; Fong, H.; Gogotsi, Y. High power supercapacitor electrodes based on flexible TiC-CDC nano-felts. J. Power Sources 2012, 201, 368–375. [Google Scholar] [CrossRef]
  9. Pan, L.; Shoji, T.; Nagataki, A.; Nakayama, Y. Field emission properties of titanium carbide coated carbon nanotube arrays. Adv. Eng. Mater. 2007, 9, 584–587. [Google Scholar] [CrossRef]
  10. Qin, Y.; Hu, M. Characterization and field emission characteristics of carbon nanotubes modified by titanium carbide. Appl. Surf. Sci. 2008, 254, 3313–3317. [Google Scholar] [CrossRef]
  11. Lee, S.-K.; Zetterling, C.-M.; Östling, M.; Palmquist, J.-P.; Jansson, U. Low resistivity ohmic contacts on 4H-silicon carbide for high power and high temperature device applications. Microelectron. Eng. 2002, 60, 261–268. [Google Scholar] [CrossRef]
  12. Wilhelmsson, O.; Palmquist, J.-P.; Lewin, E.; Emmerlich, J.; Eklund, P.; Persson, P.O.A.; Hogberg, H.; Li, S.; Ahuja, R.; Eriksson, O.; et al. Deposition and characterization of ternary thin films within the Ti–Al–C system by DC magnetron sputtering. J. Cryst. Growth 2006, 291, 290–300. [Google Scholar] [CrossRef]
  13. Palmquist, J.-P.; Jansson, U.; Seppänen, T.; Persson, P.O.A.; Birch, J.; Hultman, L.; Isberg, P. Magnetron sputtered epitaxial single-phase Ti3SiC2 thin films. Appl. Phys. Lett. 2002, 81, 835. [Google Scholar] [CrossRef]
  14. Eklund, P.; Högberg, H.; Hultman, L. Epitaxial TiC/SiC multilayers. Phys. Status Solidi Rapid Res. Lett. 2007, 1, 113–115. [Google Scholar] [CrossRef]
  15. Zhao, Y.; Wang, Y.; Cheng, X.; Dong, L.; Zhang, Y.; Zang, J. Platinum nanoparticles supported on epitaxial TiC/nanodiamond as an electrocatalyst with enhanced durability for fuel cells. Carbon 2014, 67, 409–416. [Google Scholar] [CrossRef]
  16. Zhao, Q.H.; Parsons, J.D.; Chen, H.S.; Chaddha, A.K.; Wu, J.; Kruaval, G.B.; Downham, D. Single crystal titanium carbide, epitaxially grown on zincblend and wurtzite structures of silicon carbide. Mater. Res. Bull. 1995, 30, 761–769. [Google Scholar] [CrossRef]
  17. Qi, Q.; Zhang, W.Z.; Shi, L.Q.; Zhang, W.Y.; Zhang, W.; Zhang, B. Preparation of single-crystal TiC (111) by radio frequency magnetron sputtering at low temperature. Thin Solid Films 2012, 520, 6882–6887. [Google Scholar] [CrossRef]
  18. Braic, M.; Zoita, N.C.; Danila, M.; Grigorescu, C.E.A.; Logofatu, C. Hetero-epitaxial growth of TiC films on MgO (001) at 100 °C by DC reactive magnetron sputtering. Thin Solid Films 2015, 589, 590–596. [Google Scholar] [CrossRef]
  19. Ferro, D.; Rau, J.V.; Albertini, V.R.; Generosi, A.; Teghil, R.; Barinov, S.M. Pulsed laser deposited hard TiC, ZrC, HfC and TaC films on titanium: Hardness and an energy dispersive X-ray diffraction study. Surf. Coat. Technol. 2008, 202, 1455–1461. [Google Scholar] [CrossRef]
  20. Norin, L.; McGinnis, S.; Jansson, U.; Carlsson, J.-O. Low temperature deposition of epitaxial titanium carbide on MgO (001) by co-evaporation of C60 and Ti. J. Vac. Sci. Technol. A 1997, 15, 3082. [Google Scholar] [CrossRef]
  21. Archer, N.J. The plasma-assisted chemical vapour deposition of TiC, TiN and TiCxN1−x. Thin Solid Films 1981, 80, 221–225. [Google Scholar] [CrossRef]
  22. Sarkar, J. Sputtering Materials for VLSI and Thin Film Devices; William Andrew Publishing: Boston, MA, USA, 2010; pp. 93–170. [Google Scholar]
  23. Zoita, N.C.; Braic, V.; Danila, M.; Vlaicu, A.M.; Logofatu, C.; Grigorescu, C.E.A.; Braic, M. Influence of film thickness on the morphological and electrical properties of epitaxial TiC films deposited by reactive magnetron sputtering on MgO substrates. J. Cryst. Growth 2014, 389, 92–98. [Google Scholar] [CrossRef]
  24. Narayan, J.; Larson, B.C. Domain epitaxy: A unified paradigm for thin film growth. J. Appl. Phys. 2003, 93, 278. [Google Scholar] [CrossRef]
  25. Sheu, W.-H.; Wu, S.-T. Epitaxial Growth of TiC (002) on Si (001) by Reactive Magnetron Sputtering at Low Temperatures. Jpn. J. Appl. Phys. 1998, 37, 6094–6097. [Google Scholar] [CrossRef]
  26. Haase, V.; Kirschstein, G.; List, H.; Ruprecht, S.; Sangster, R.; Schröder, F.; Töpper, W.; Vanecek, H.; Heit, W.; Schlichting, J. Gmelin Handbook of Inorganic and Organometallic Chemistry: Si Silicon; Springer: Berlin/Heidelberg, Germany, 1985; pp. 1–5. [Google Scholar]
  27. Wakelkamp, W.J.J.; van Loo, F.J.J.; Metselaar, R. Phase Relations in the Ti-Si-C System. J. Eur. Ceram. Soc. 1991, 8, 135–139. [Google Scholar] [CrossRef] [Green Version]
  28. Bandyopadhyay, D. The Ti-Si-C system (Titanium-Silicon-Carbon). J. Phase Equilibria Diffus. 2004, 25, 415–420. [Google Scholar] [CrossRef]
  29. Gulbiński, W.; Mathur, S.; Shen, H.; Suszko, T.; Gilewicz, A.; Warcholiński, B. Evaluation of phase, composition, microstructure and properties in TiC/a-C:H thin films deposited by magnetron sputtering. Appl. Surf. Sci. 2005, 239, 302–310. [Google Scholar] [CrossRef]
  30. Riley, D.P.; Connor, D.J.O.; Dastoor, P.; Brack, N.; Pigram, P.J. Comparative analysis of Ti3SiC2 and associated compounds using X-ray diffraction and X-ray photoelectron spectroscopy. J. Phys. D 2002, 35, 1603. [Google Scholar] [CrossRef]
  31. Shin, C.-S.; Gall, D.; Kim, Y.-W.; Desjardins, P.; Petrov, I.; Greene, J.E. Epitaxial NaCl structure δ-TaNx(001): Electronic transport properties, elastic modulus, and hardness versus N/Ta ratio. J. Appl. Phys. 2001, 90, 2879. [Google Scholar] [CrossRef] [Green Version]
  32. Adachi, S. Properties of Semiconductor Alloys: Group-IV, III–V and II–VI Semiconductors; John Wiley & Sons Ltd.: Gumma, Japan, 2009; p. 36. [Google Scholar]
  33. Suhail, M.H.; Mohan Rao, G.; Mohan, S. Dc reactive magnetron sputtering of titanium-structural and optical characterization of TiO2 films. J. Appl. Phys. 1992, 71, 1421. [Google Scholar] [CrossRef]
  34. Combadiere, L.; Machet, J. Study and control of both target-poisoning mechanisms and reactive phenomenon in reactive planar magnetron cathodic sputtering of TiN. Surf. Coat. Technol. 1996, 82, 145–157. [Google Scholar] [CrossRef]
  35. Nyberga, T.; Högberg, H.; Greczynski, G.; Berg, S. A simple model for non-saturated reactive sputtering processes. Thin Solid Films 2019, 688, 137413. [Google Scholar] [CrossRef]
  36. Sundgren, J.-E.; Johansson, B.-O.; Karlsson, S.-E. Mechanisms of reactive sputtering of titanium nitride and titanium carbide I: Influence of process parameters on film composition. Thin Solid Films 1983, 105, 353–366. [Google Scholar] [CrossRef]
  37. Kisi, E.H.; Crossley, J.A.A.; Myhra, S.; Barsoum, M.W. Structure and crystal chemistry of Ti3SiC2. J. Phys. Chem. Solids 1998, 59, 1437–1443. [Google Scholar] [CrossRef]
  38. Chan, C.-M.; Trigwell, S.; Duerig, T. Oxidation of an NiTi alloy. Surf. Interface Anal. 1990, 15, 349–354. [Google Scholar] [CrossRef]
  39. Johansson, L.I.; Hagström, A.L.; Jacobson, B.E.; Hagström, S.B.M. ESCA studies of core level shifts and valence band structure in nonstoichiometric single crystals of titanium carbide. J. Electron Spectros. Relat. Phenom. 1977, 10, 259–271. [Google Scholar] [CrossRef]
  40. Ramqvist, L.; Ekstig, B.; Källne, E.; Noreland, E.; Manne, R. X-ray study of inner level shifts and band structure of TiC and related compounds. J. Phys. Chem. Solids 1969, 30, 1849–1860. [Google Scholar] [CrossRef]
  41. Liu, B.; Zhao, X.; Zhao, Q.; Li, C.; He, X. The effect of O2 partial pressure on the structure and photocatalytic property of TiO2 films prepared by sputtering. Mater. Chem. Phys. 2005, 90, 207–212. [Google Scholar] [CrossRef]
  42. Biesinger, M.C.; Lau, L.W.M.; Gerson, A.R.; Smart, R.S.C. Resolving surface chemical states in XPS analysis of first row transition metals, oxides and hydroxides: Sc, Ti, V., Cu and Zn. Appl. Surf. Sci. 2010, 257, 887–898. [Google Scholar] [CrossRef]
  43. Holt, J.B.; Munir, Z.A. Combustion synthesis of titanium carbide: Theory and experiment. J. Mater. Sci. 1986, 21, 251–259. [Google Scholar] [CrossRef]
  44. Barsoum, M.W. The MN+1AXN phases: A new class of solids: Thermodynamically stable nanolaminates. Prog. Solid State Chem. 2000, 28, 201–281. [Google Scholar] [CrossRef]
  45. Yang, S.; Sun, Z.M.; Hashimoto, H. Synthesis of Ti3SiC2 powder from 1Ti/(1+x)Si/2TiC powder mixtures. J. Alloys Compd. 2004, 368, 318–325. [Google Scholar] [CrossRef]
  46. Otani, S.; Tanaka, T.; Ishizawa, Y. Electrical resistivities in single crystals of TiCx and VCx. J. Mater. Sci. 1986, 21, 1001–1014. [Google Scholar] [CrossRef]
  47. Morelli, D.T. Thermal conductivity and thermoelectric power of titanium carbide single crystals. Phys. Rev. B 1991, 44, 5453–5458. [Google Scholar] [CrossRef]
  48. Petrov, I.; Barna, P.B.; Hultman, L.; Greene, J.E. Microstructural evolution during film growth. J. Vac. Sci. Technol. A 2003, 21, 117–128. [Google Scholar] [CrossRef]
  49. McKenzie, D.R.; Bilek, M.M.M. Electron diffraction from polycrystalline materials showing stress induced preferred orientation. J. Appl. Phys. 1999, 86, 230–236. [Google Scholar] [CrossRef]
  50. Djafer, A.Z.A.; Saoula, N.; Madaoui, N.; Zerizer, A. Deposition and characterization of titanium carbide thin films by magnetron sputtering using Ti and TiC targets. Appl. Surf. Sci. 2014, 312, 57–62. [Google Scholar] [CrossRef]
  51. Wang, H.; Zhang, S.; Li, Y.; Sun, D. Bias effect on microstructure and mechanical properties of magnetron sputtered nanocrystalline titanium carbide thin films. Thin Solid Films 2008, 516, 5419–5423. [Google Scholar] [CrossRef]
  52. Su, Y.; Wang, X.; Wang, H.; Wen, M.; Zheng, W. Grain-size effect on the preferred orientation of TiC/α-C:H thin films. Appl. Surf. Sci. 2012, 258, 6800–6806. [Google Scholar] [CrossRef]
  53. Lee, C.W.; Nam, S.W.; Chun, J.S. Effect of experimental parameters on the preferred orientation of chemically vapor deposited TiC on cemented carbides. J. Vac. Sci. Technol. 1982, 21, 42–46. [Google Scholar] [CrossRef]
  54. Pelleg, J.; Zevin, L.Z.; Lungo, S.; Croitoru, N. Reactive-sputter-deposited TiN films on glass substrates. Thin Solid Films 1991, 197, 117–128. [Google Scholar] [CrossRef]
  55. Oh, U.C.; Je, J.H. Effects of strain energy on the preferred orientation of TiN thin films. J. Appl. Phys. 1993, 74, 1692. [Google Scholar] [CrossRef]
  56. Je, J.H.; Noh, D.Y.; Kim, H.K.; Liang, K.S. Preferred orientation of TiN films studied by a real time synchrotron X-ray scattering. J. Appl. Phys. 1997, 81, 1692. [Google Scholar] [CrossRef] [Green Version]
Figure 1. X-ray diffraction (XRD) 2θ-ω patterns of TiC films deposited on Si (100) substrates for different CH4 flow ratios.
Coatings 10 00647 g001
Figure 2. XRD φ-scan patterns of TiC 311 and Si 311 reflections for 5% CH4.
Coatings 10 00647 g002
Figure 3. (a) X-ray rocking curves (XRC) of TiC 200 reflection for different CH4 flow ratios and (b) variation of the XRC full width at half maximum (FWHM) with CH4 flow ratio.
Coatings 10 00647 g003
Figure 4. In-plane XRD 2θ-ω patterns of TiC 022 reflection with inset showing the corresponding pattern of Si 022 reflection. (a) 5% CH4 and (b) 6% CH4. Curve fitting showing the peaks of TiC from Cu Kα1 and Kα2 X-rays in a 2/1 ratio for the corresponding integrated intensity.
Coatings 10 00647 g004
Figure 5. Scanning electron microscopy (SEM) micrographs of the samples grown with different CH4 flow ratios. (a) 3%, (b) 4%, (c) 5%, and (d) 6%.
Coatings 10 00647 g005
Figure 6. X-ray photoelectron spectroscopy (XPS) spectra for (a) C-1s and (b) Ti-2p after sputter etching for 6.5 min. The intensity has been normalized.
Coatings 10 00647 g006
Figure 7. XPS data for 5% CH4. (a) Depth profile, and spectra showing (b) C-1s, (c) Ti-2p, and (d) Si-2p at different depth in the TiC film. The intensity has been normalized.
Coatings 10 00647 g007
Figure 8. Relative atomic concentration of Ti and C in deposited films as a function of CH4 flow ratio.
Coatings 10 00647 g008
Figure 9. Electrical resistivity versus CH4 flow ratio.
Coatings 10 00647 g009
Figure 10. (a) Cross-sectional BF TEM image of the TiC layer on Si for the 5% CH4/6 min sample; (b) Atomic resolution scanning transmission electron microscopy (STEM)-ADF image of the TiC/Si interface (the red box in Figure 10a) (after Wiener filtering) showing Z-contrast. Bright and gray dots correspond to Ti and Si atomic columns, respectively. Projected atomic configurations of TiC and Si structure models are shown in the image. The white lines illustrating the domain matching epitaxy (DME) relationship with 5/4 ratio. Zone axis // TiC [0 1 ¯ 1] // Si [0 1 ¯ 1]; and (c) fast Fourier transform (FFT) patterns of TiC and Si.
Coatings 10 00647 g010
Figure 11. (a) Cross-sectional bright field (BF) STEM image of the TiC layer on Si for the 5% CH4/15 min sample; (b) STEM-ADF image from a top bright disoriented grain in (a) with the FFT pattern shown in (c).
Coatings 10 00647 g011