Material Allowable Generation and AM Process Parameters Effect on Porosity


Abstract
:1. Introduction
1.1. Problem
1.2. AM Part Qualification
1.3. Machine Process and Modality (LPBF, EBM)
1.4. Allowable Generation
2. Methodology
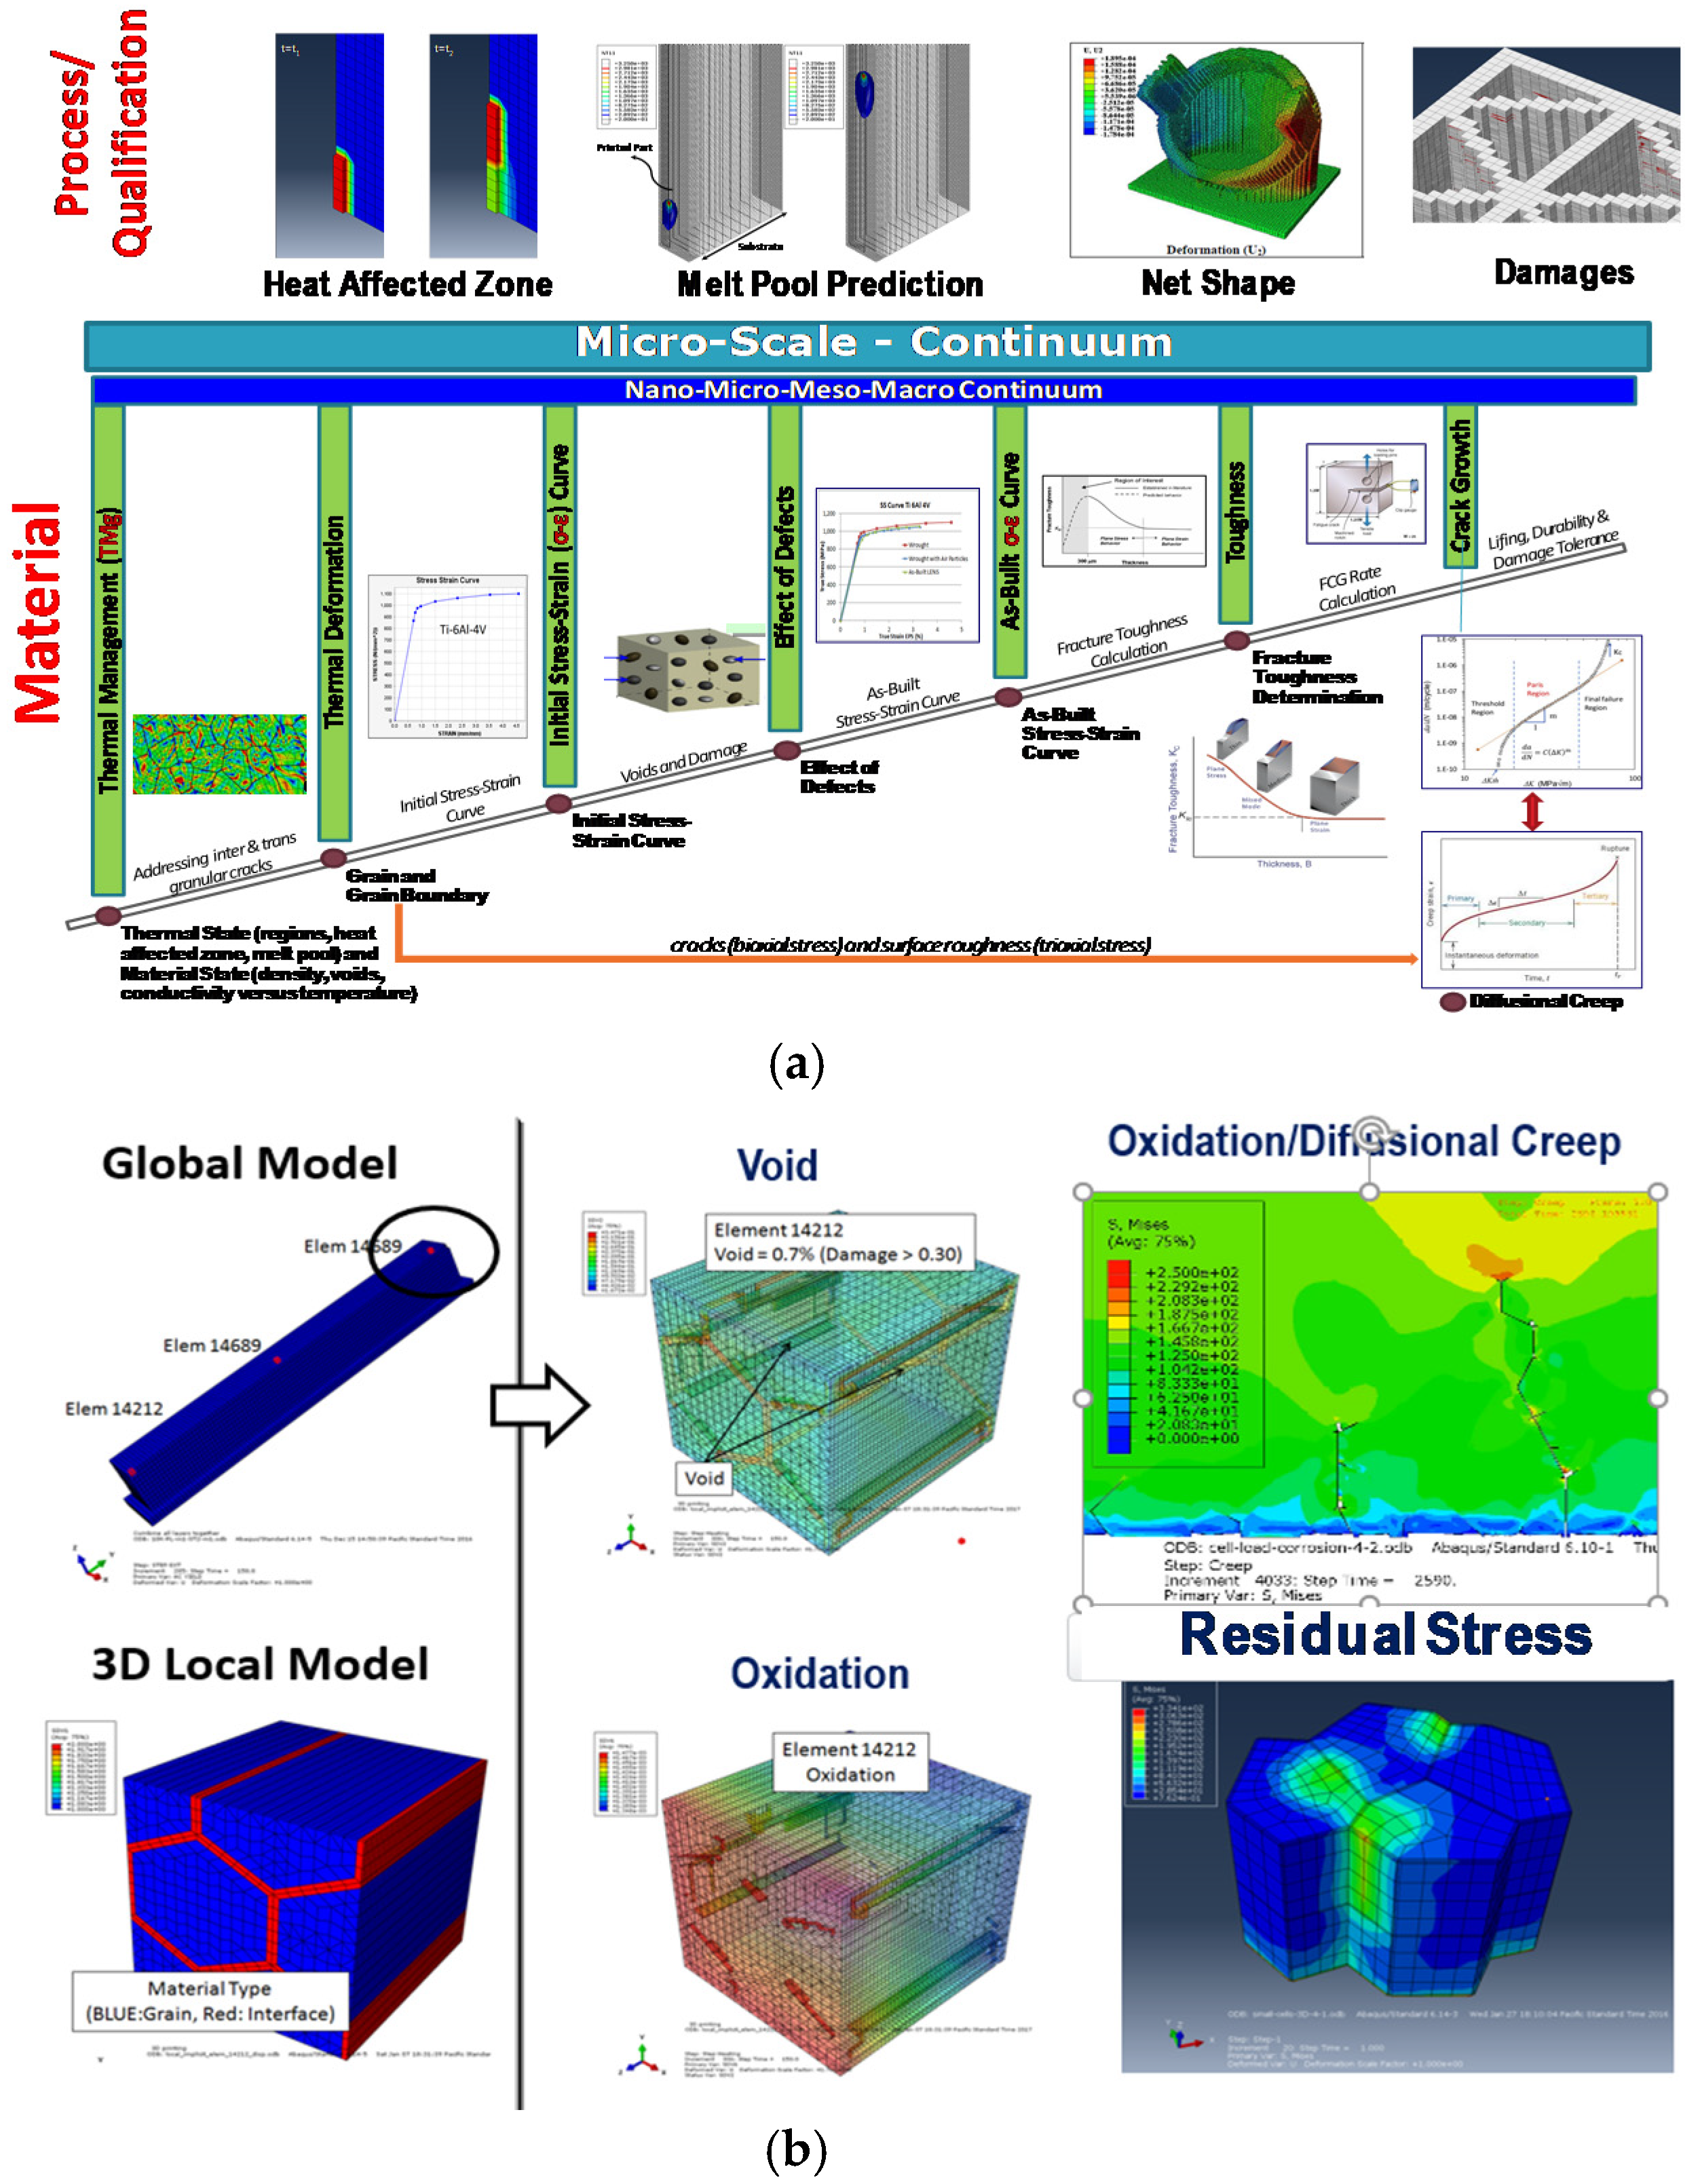
2.1. ICME Simulation Elements
2.2.1. Surface Roughness—Creep Intergranular Damage and Multisite Crack Evolution Model
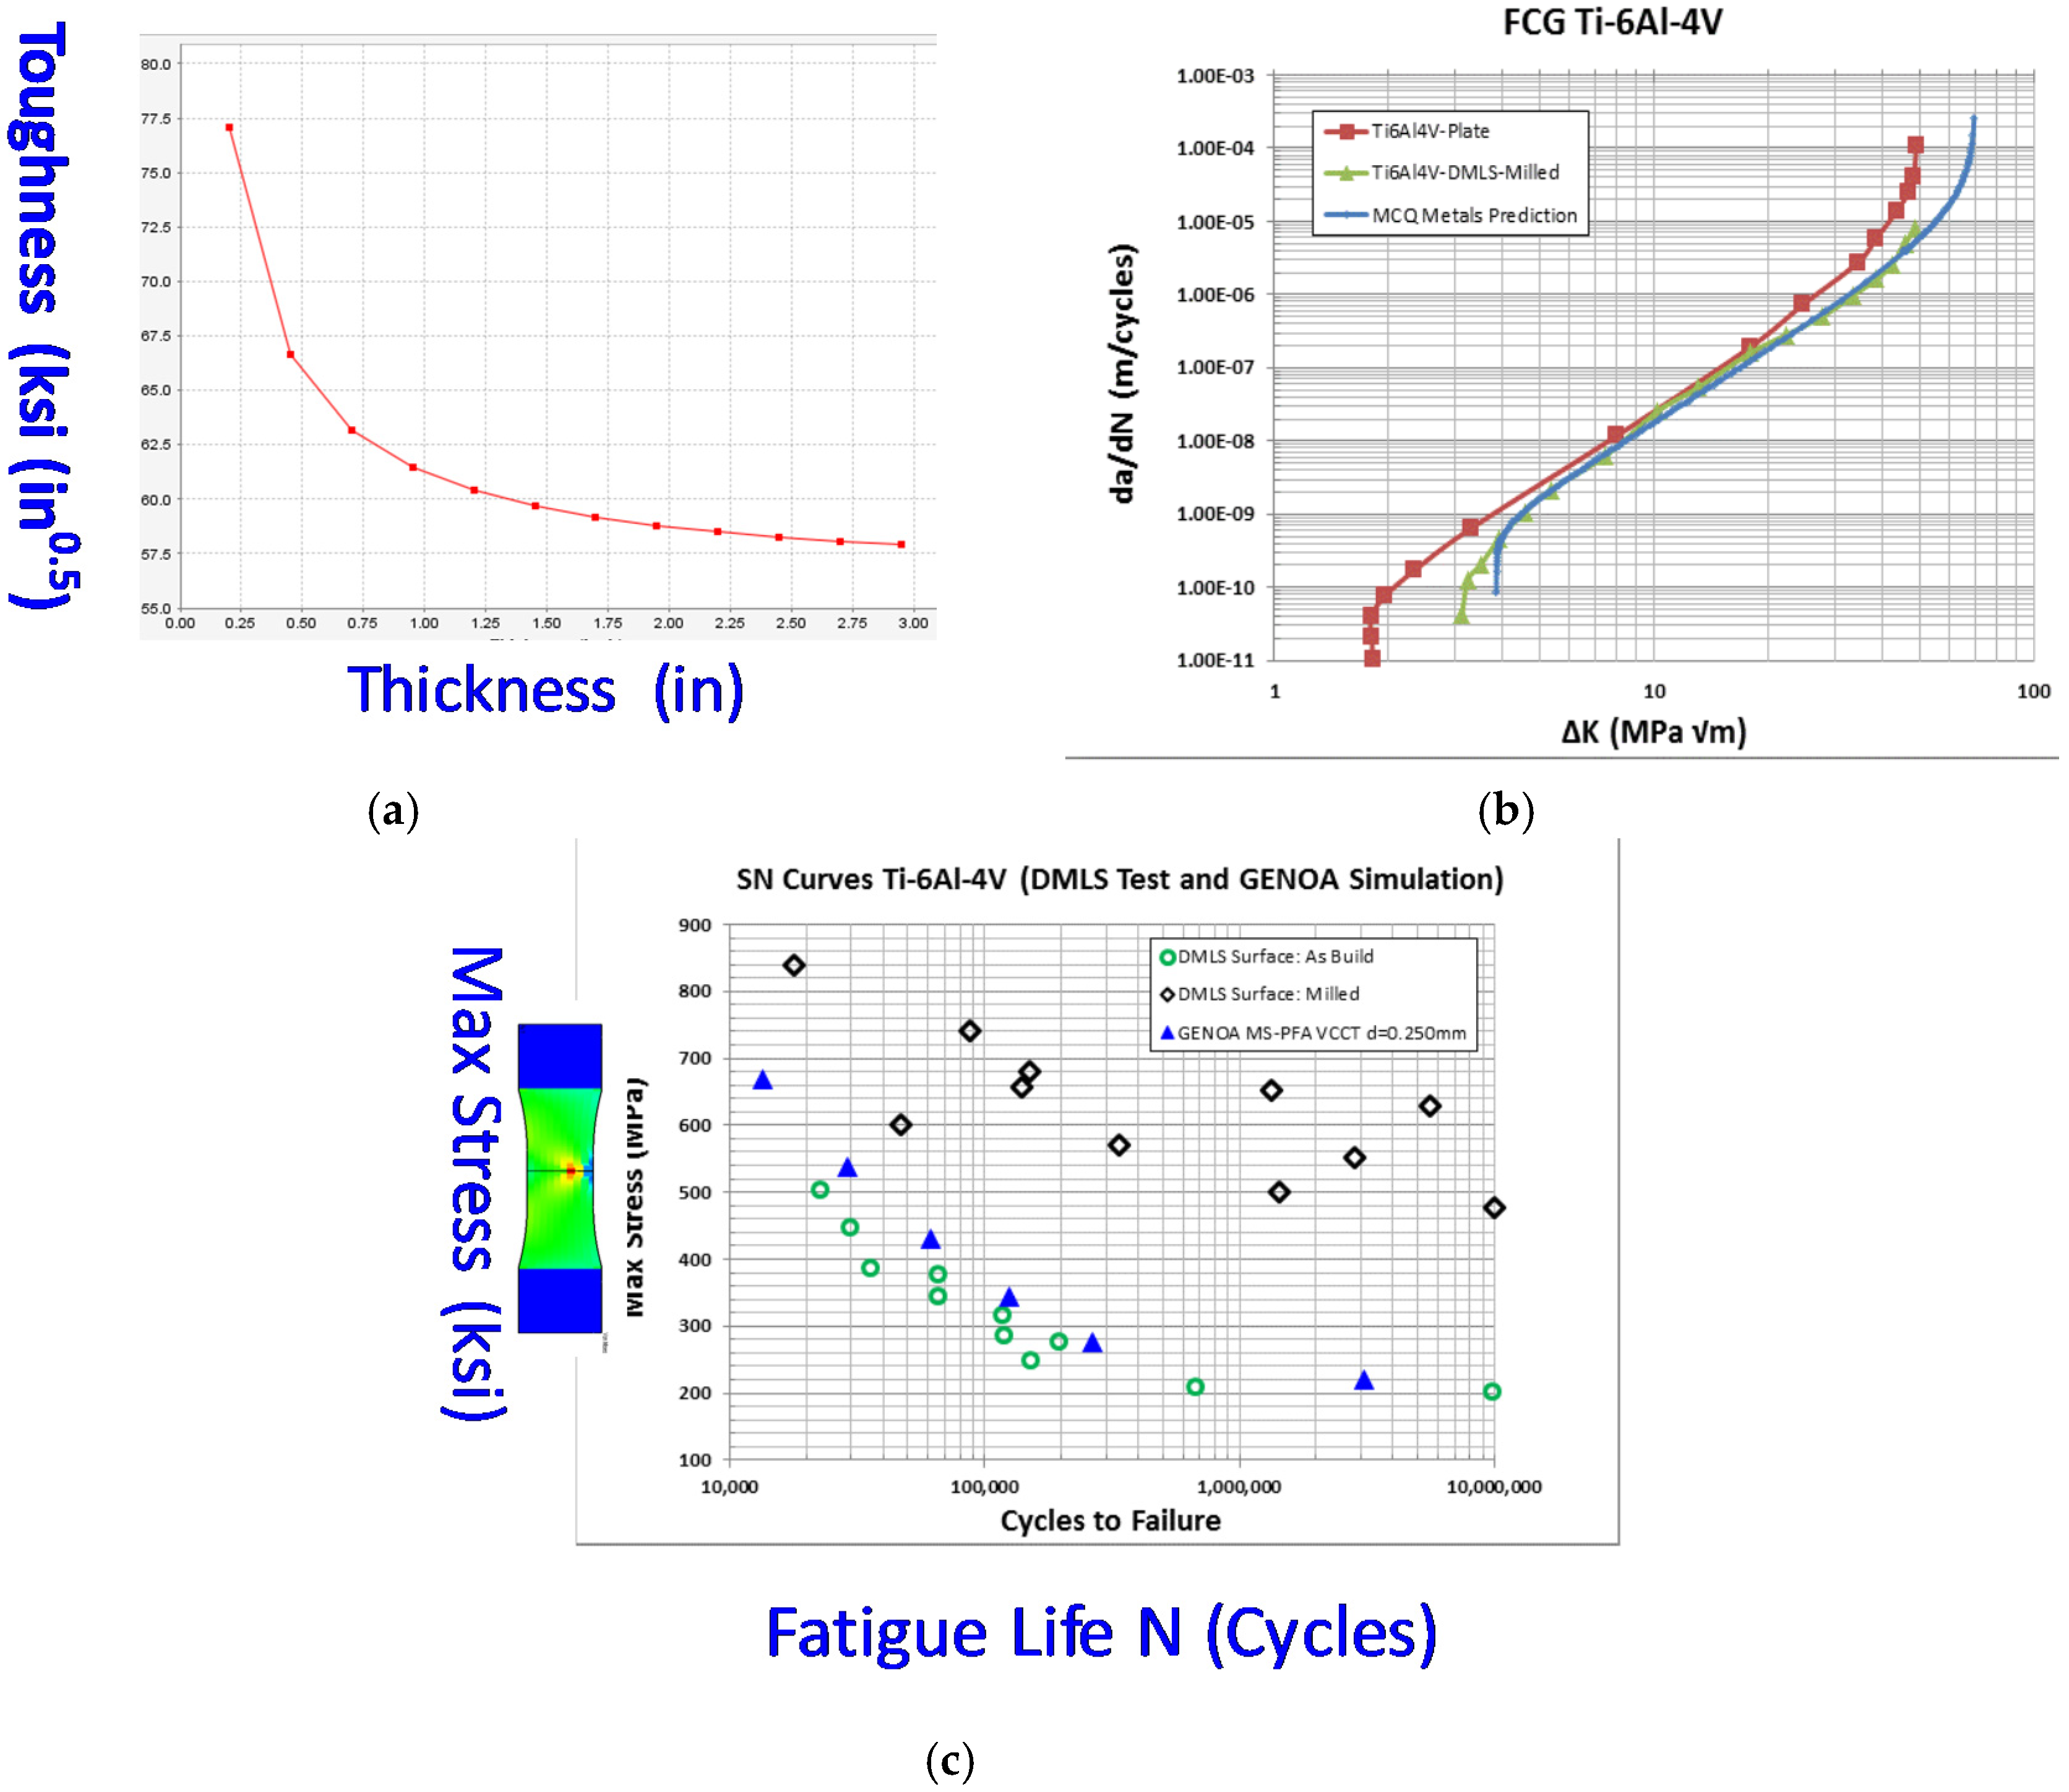
2.2.2. Fracture Toughness and Fatigue Crack Growth Model
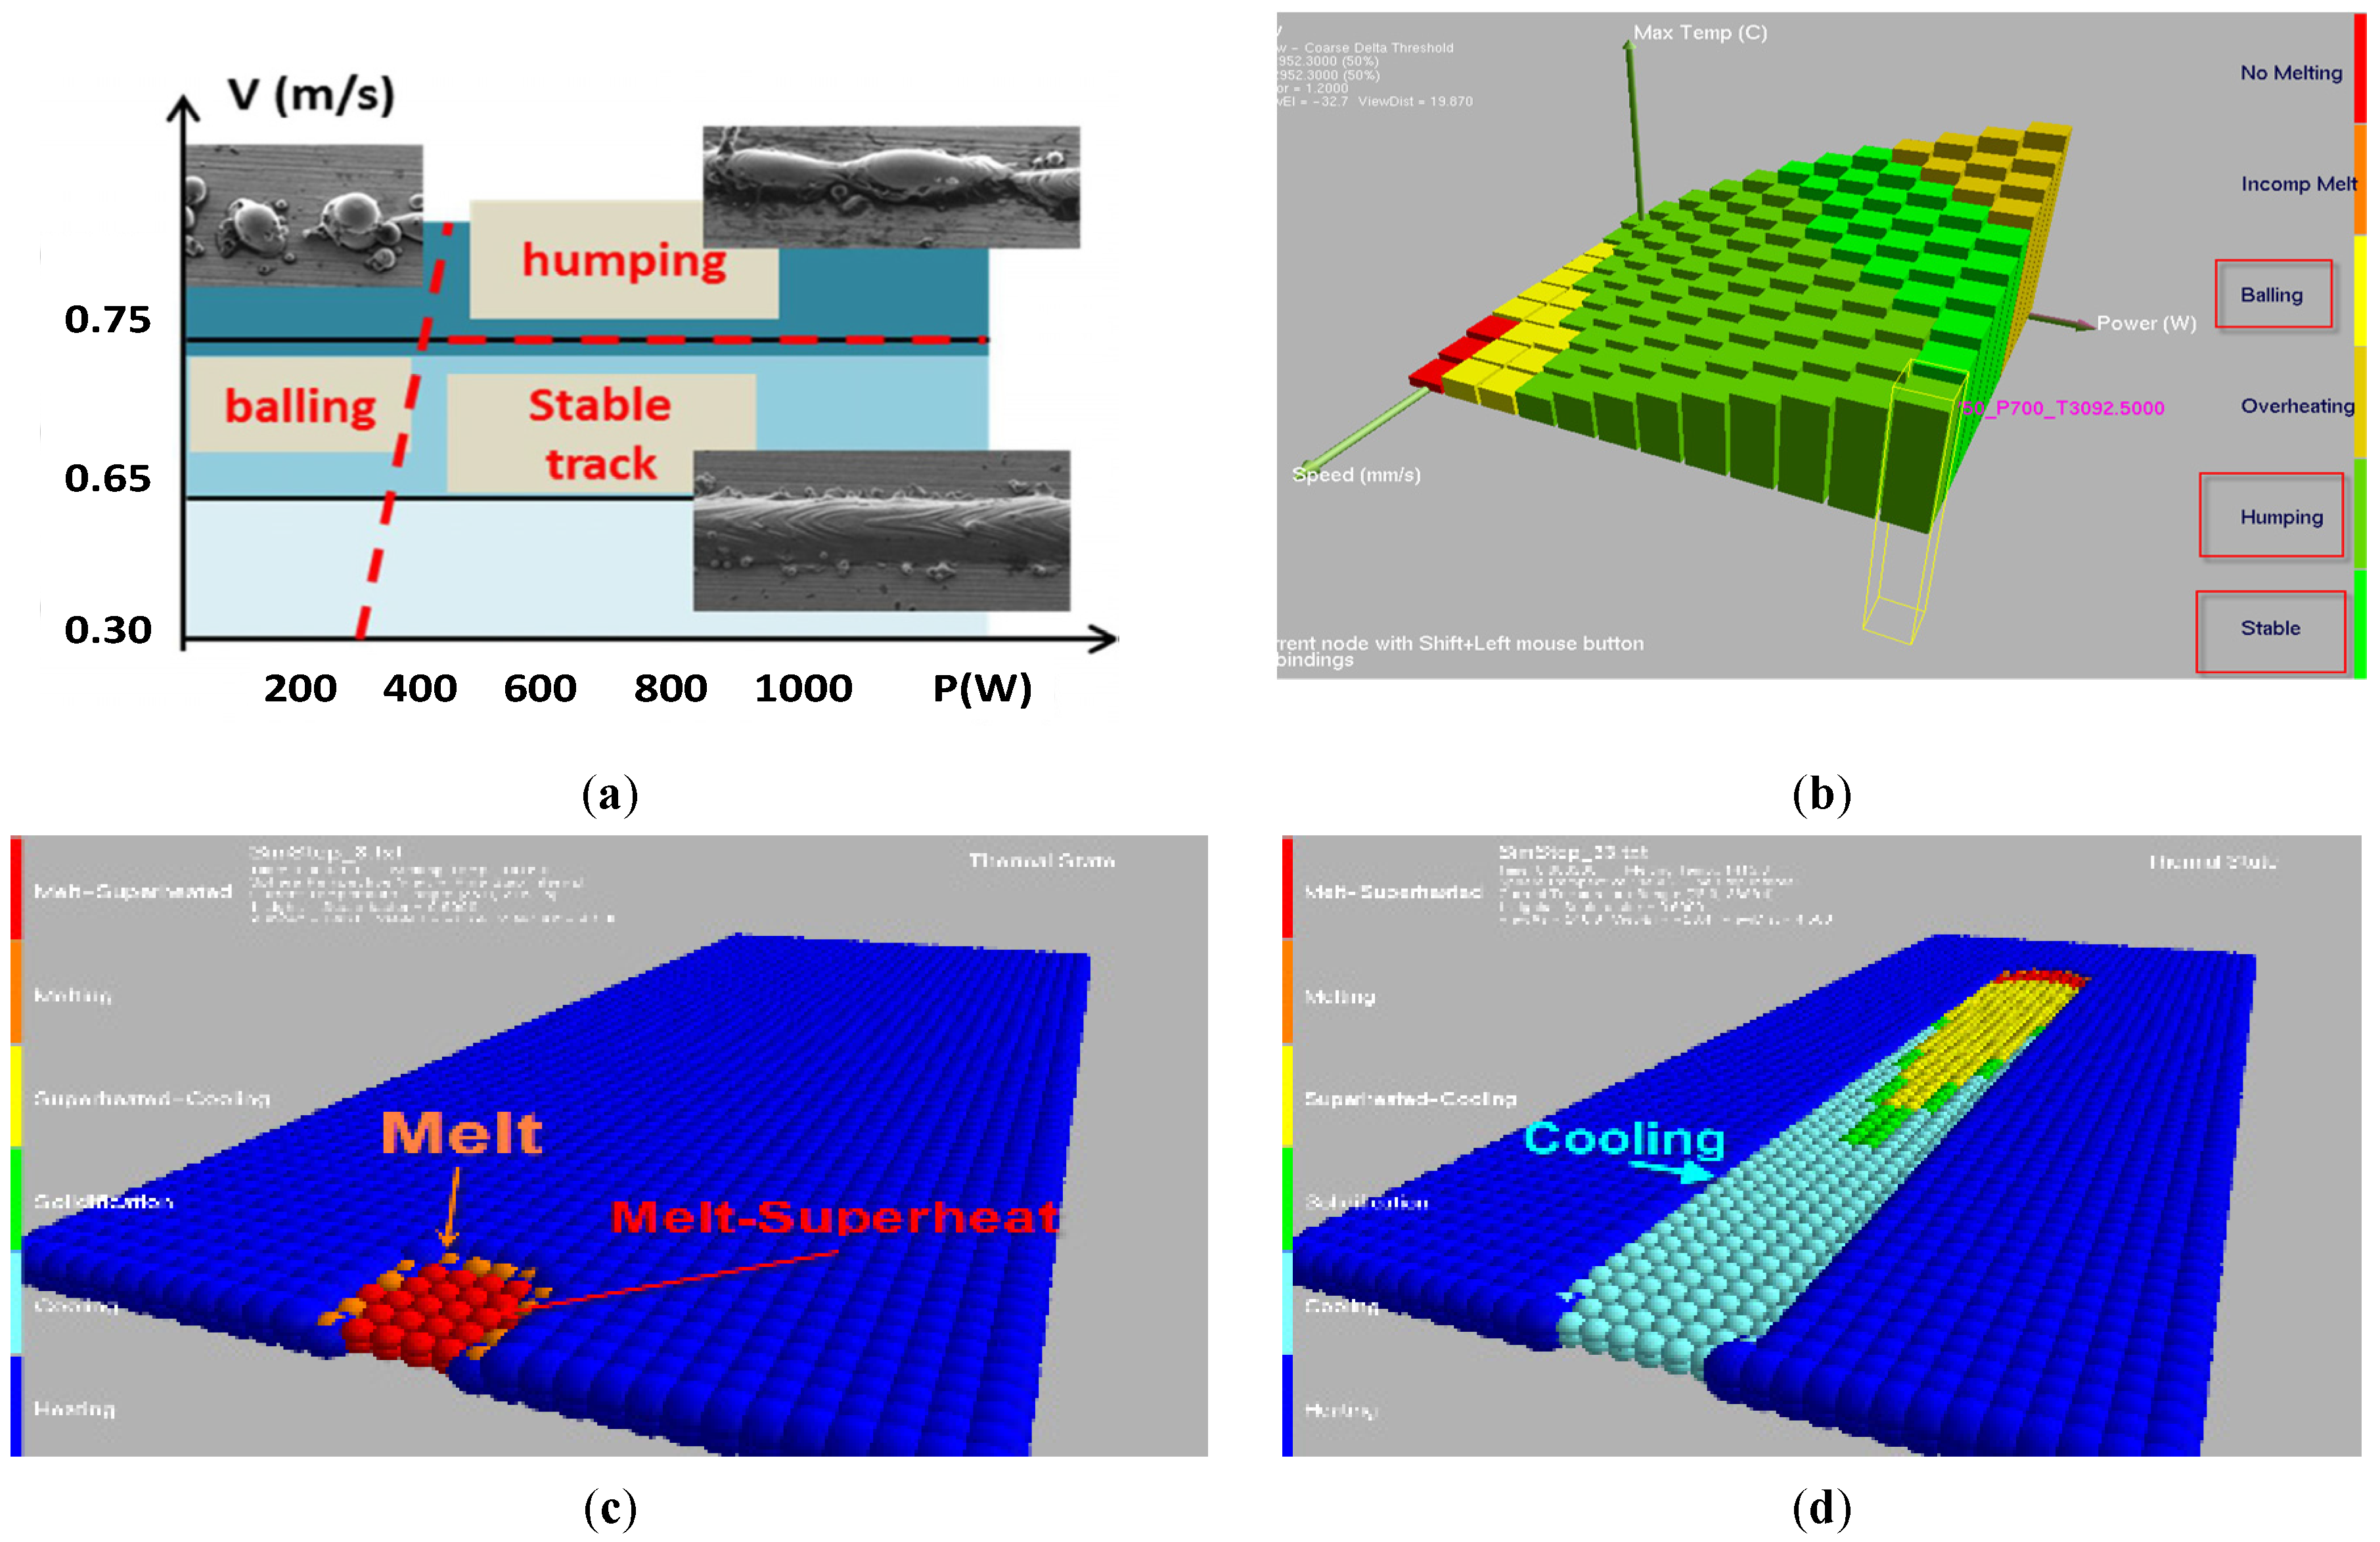
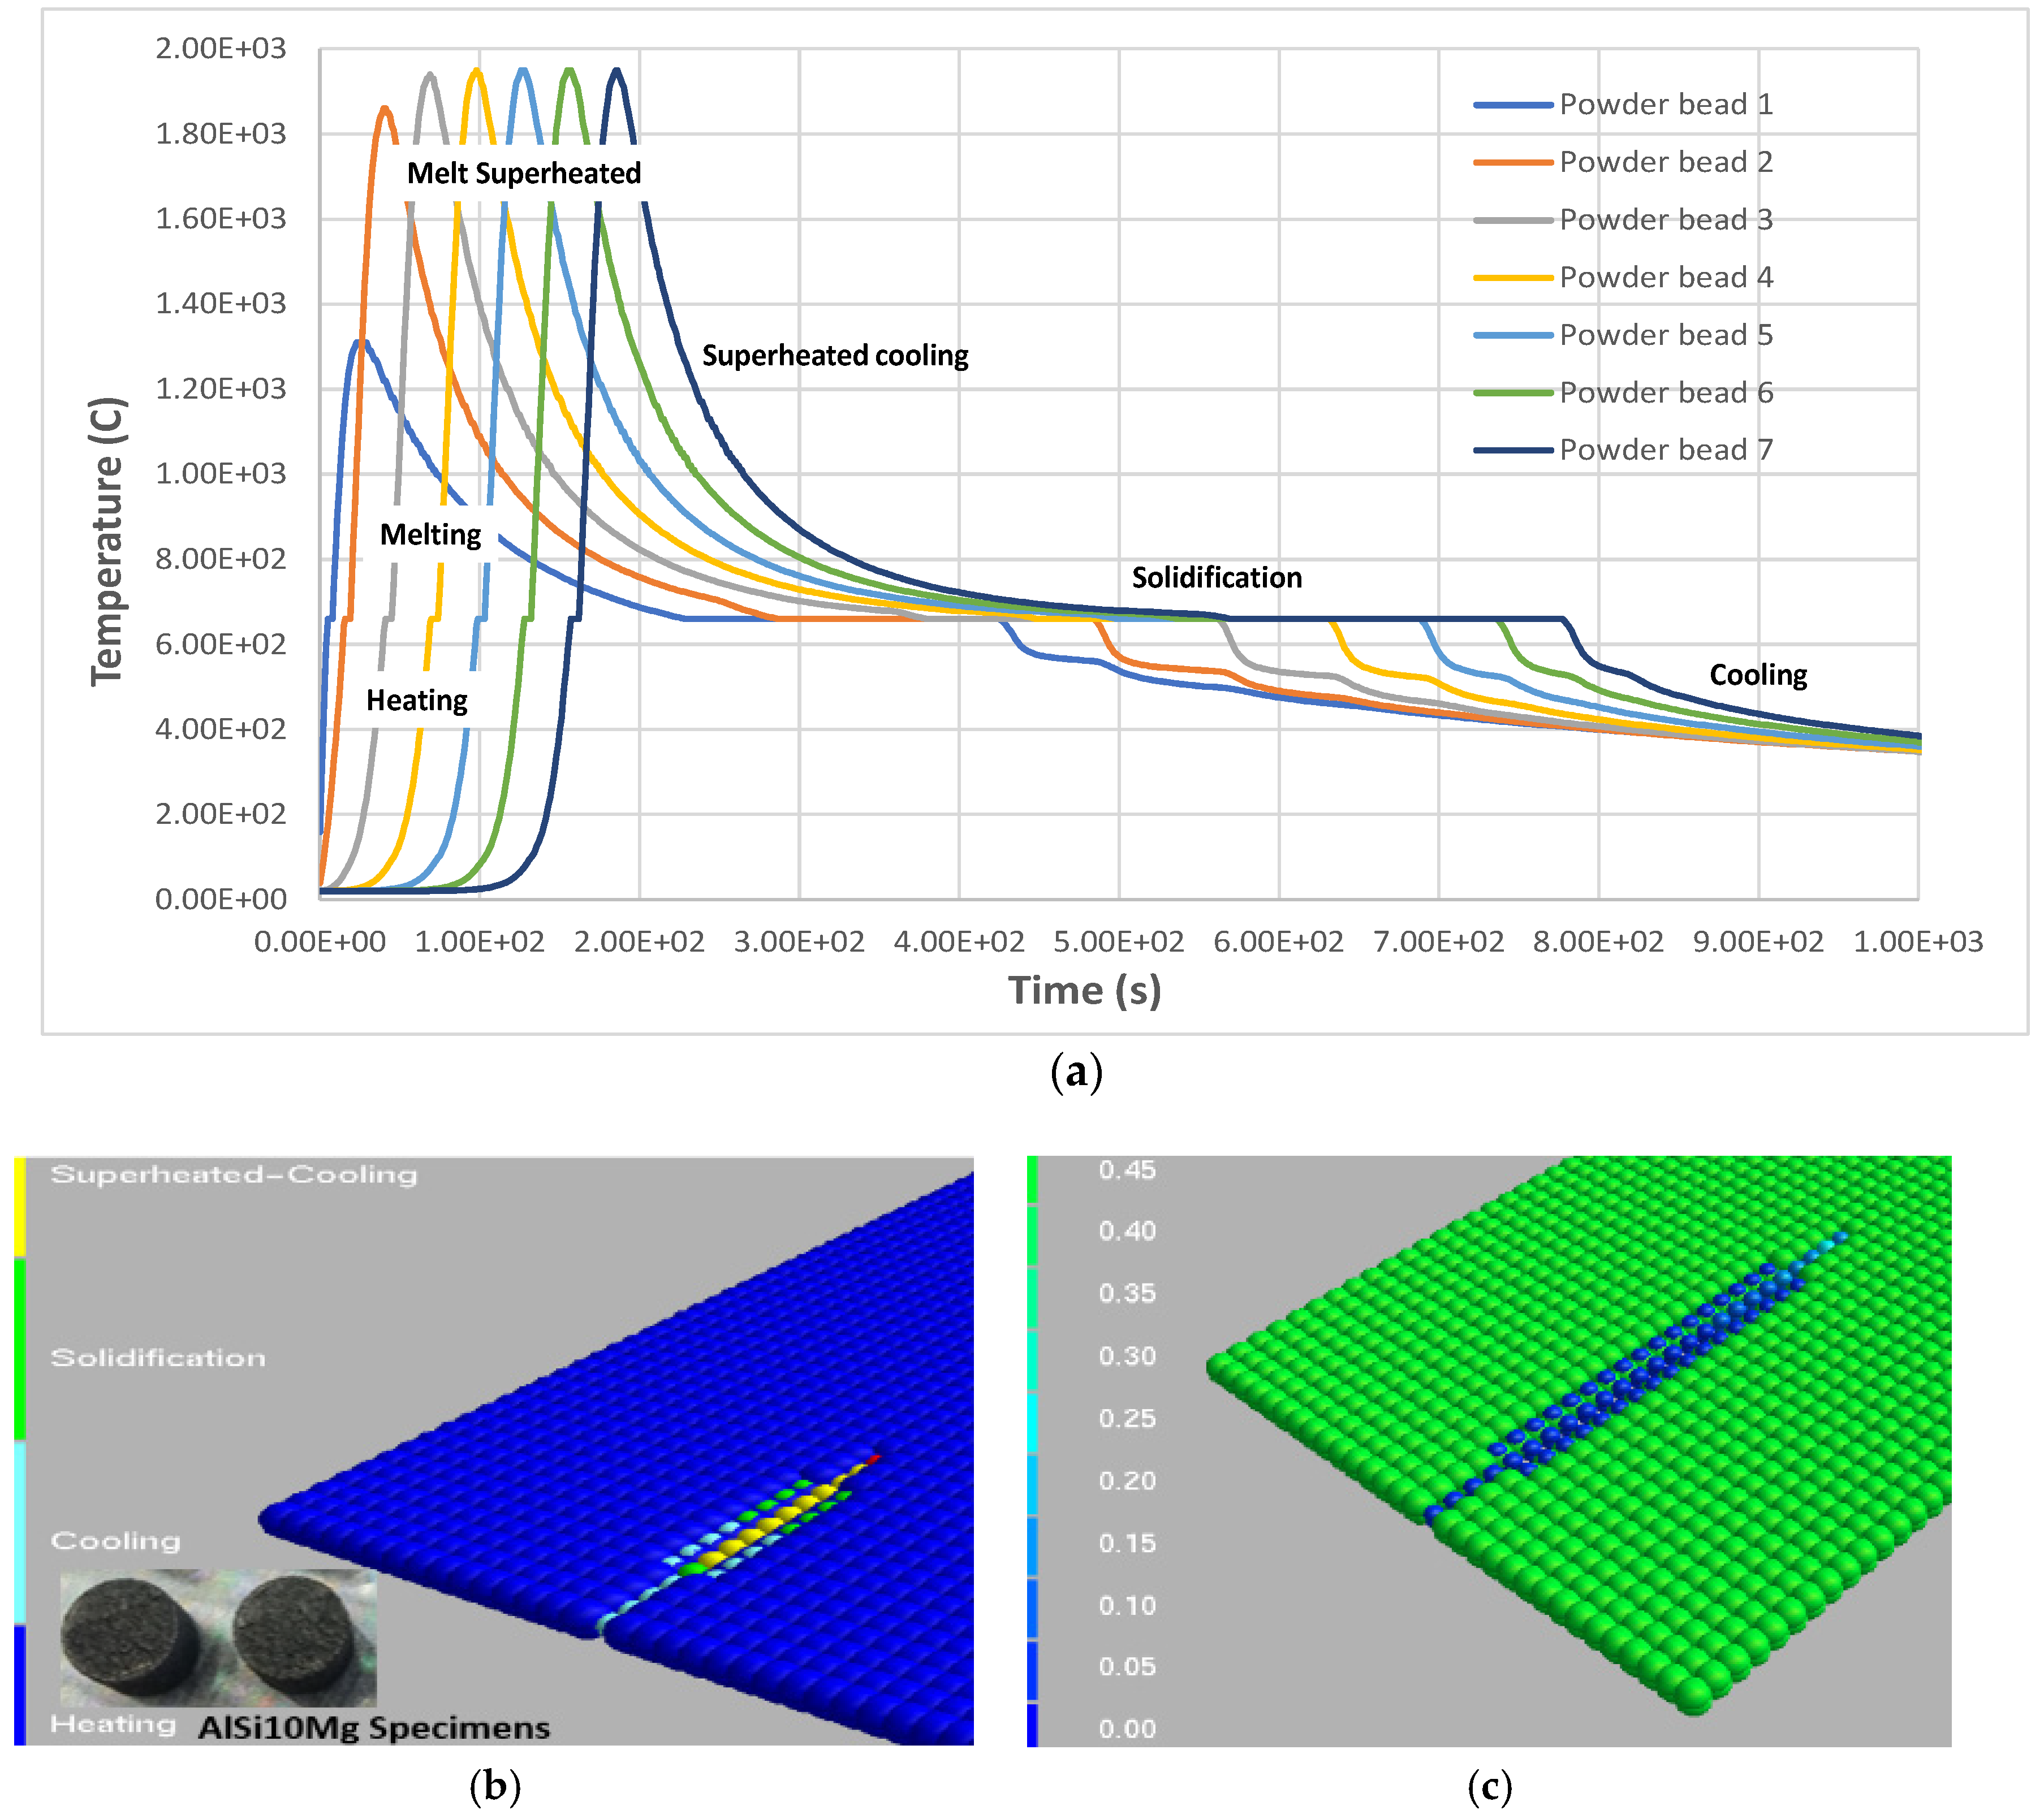
2.2.3. Thermal Management—Micro-Thermal Management (TMg)
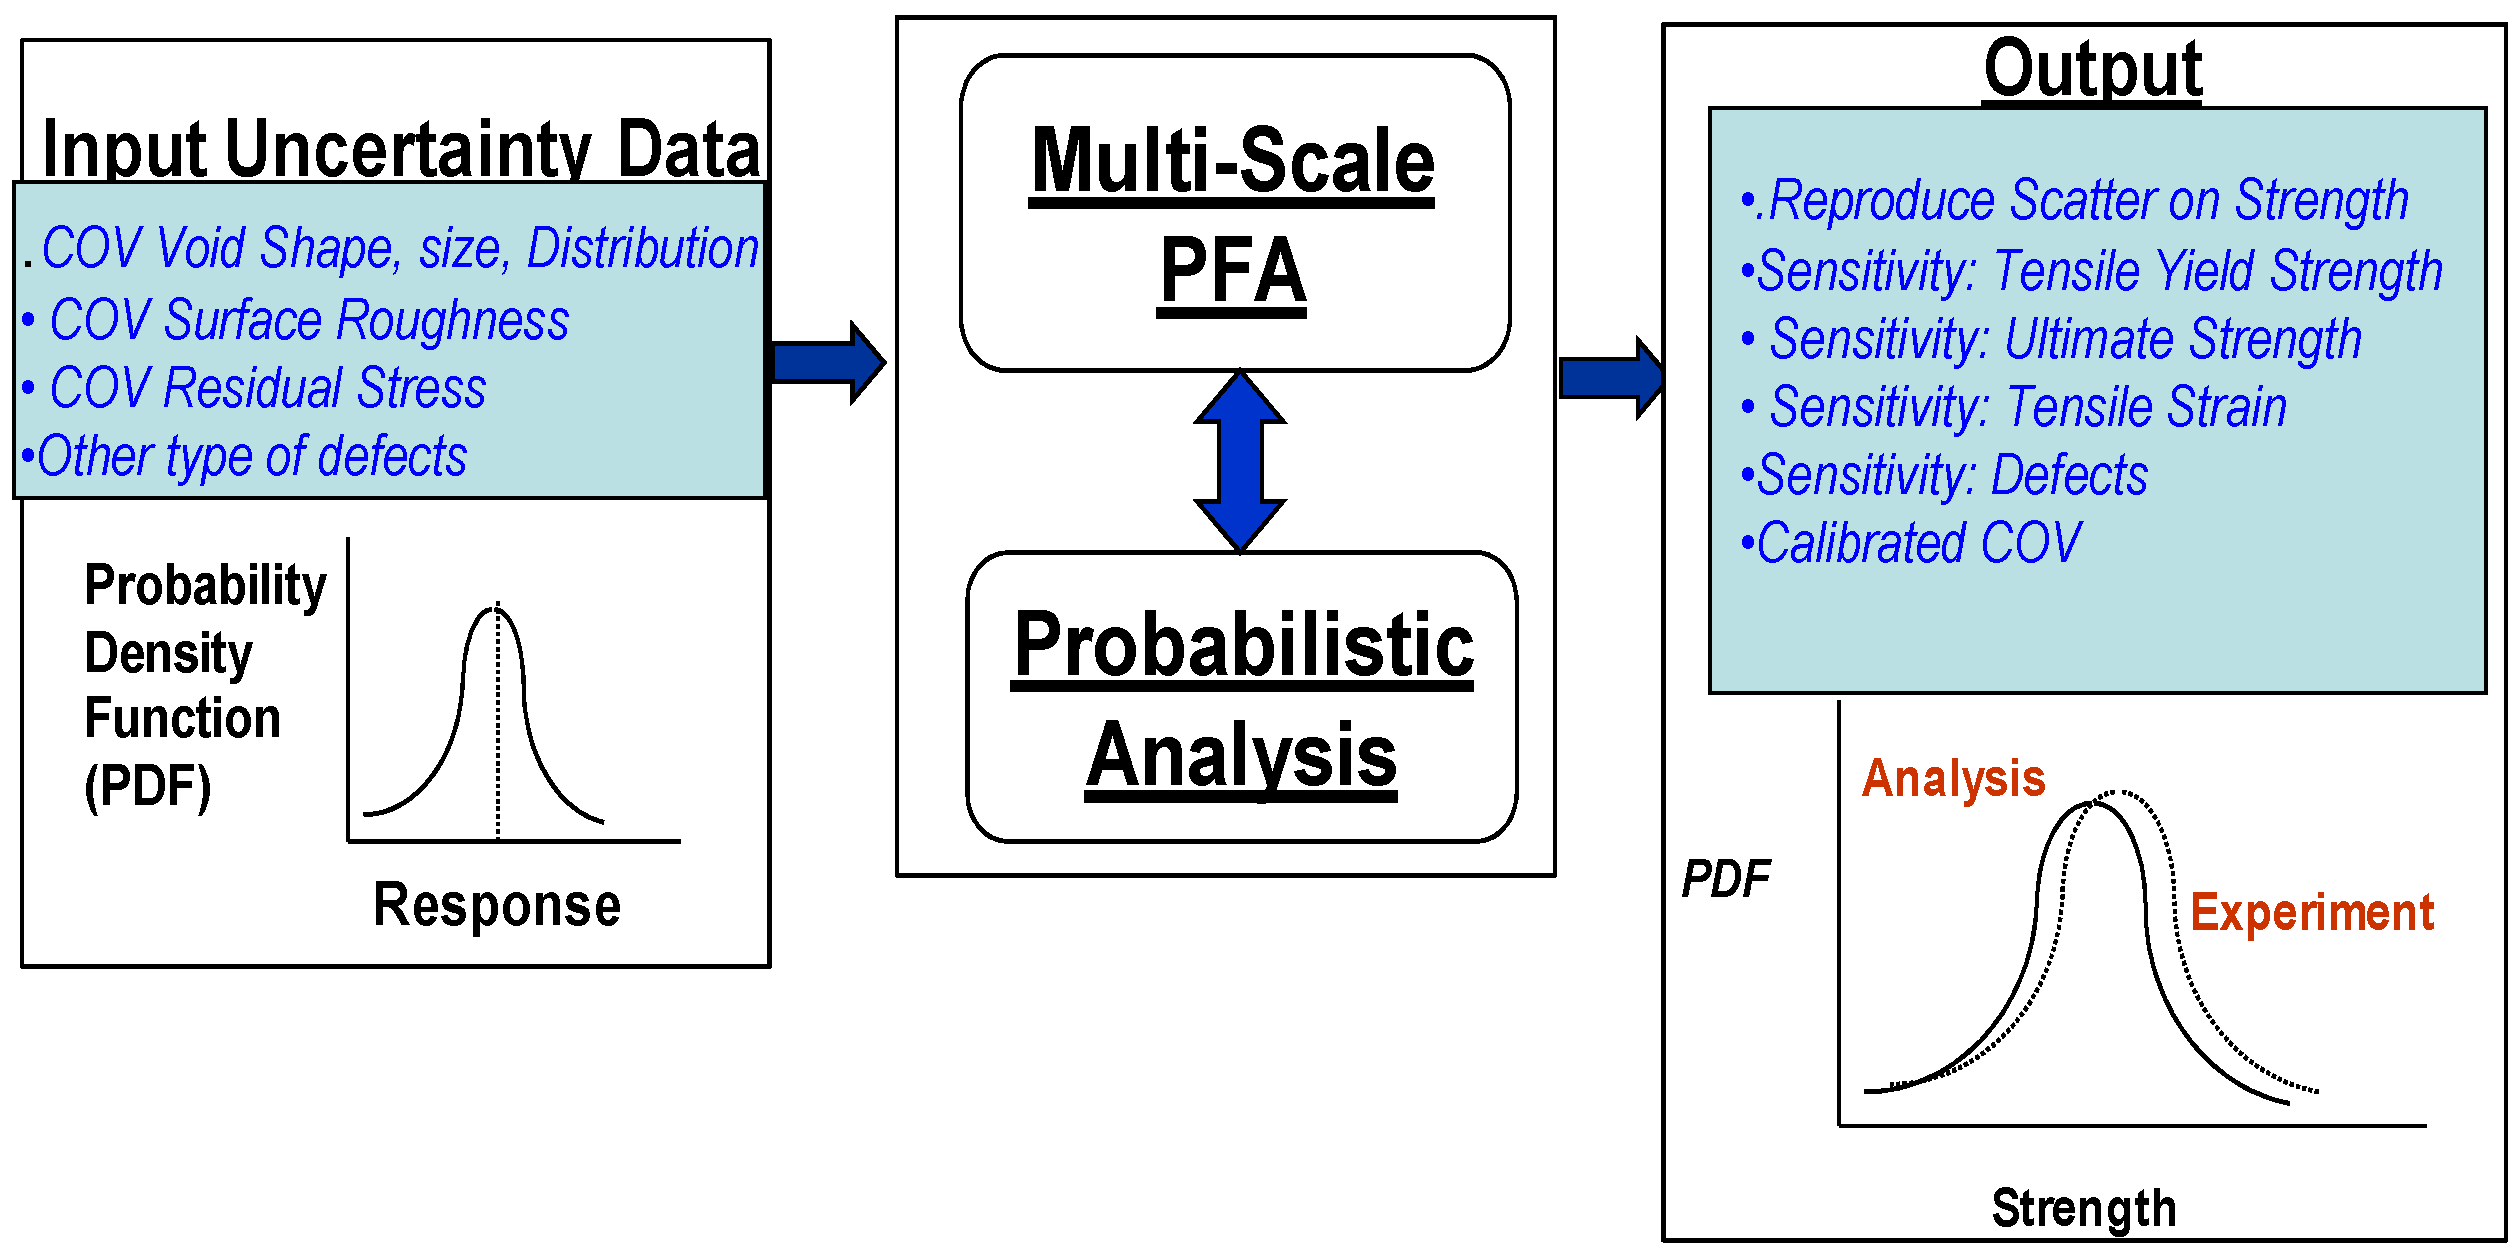
2.2.4. Scatter and Uncertainty Evaluation and Allowable Generation
3. Results and Discussion
3.1. Material Modeling—Strength Characterization, Qualification, Experimental Procedure
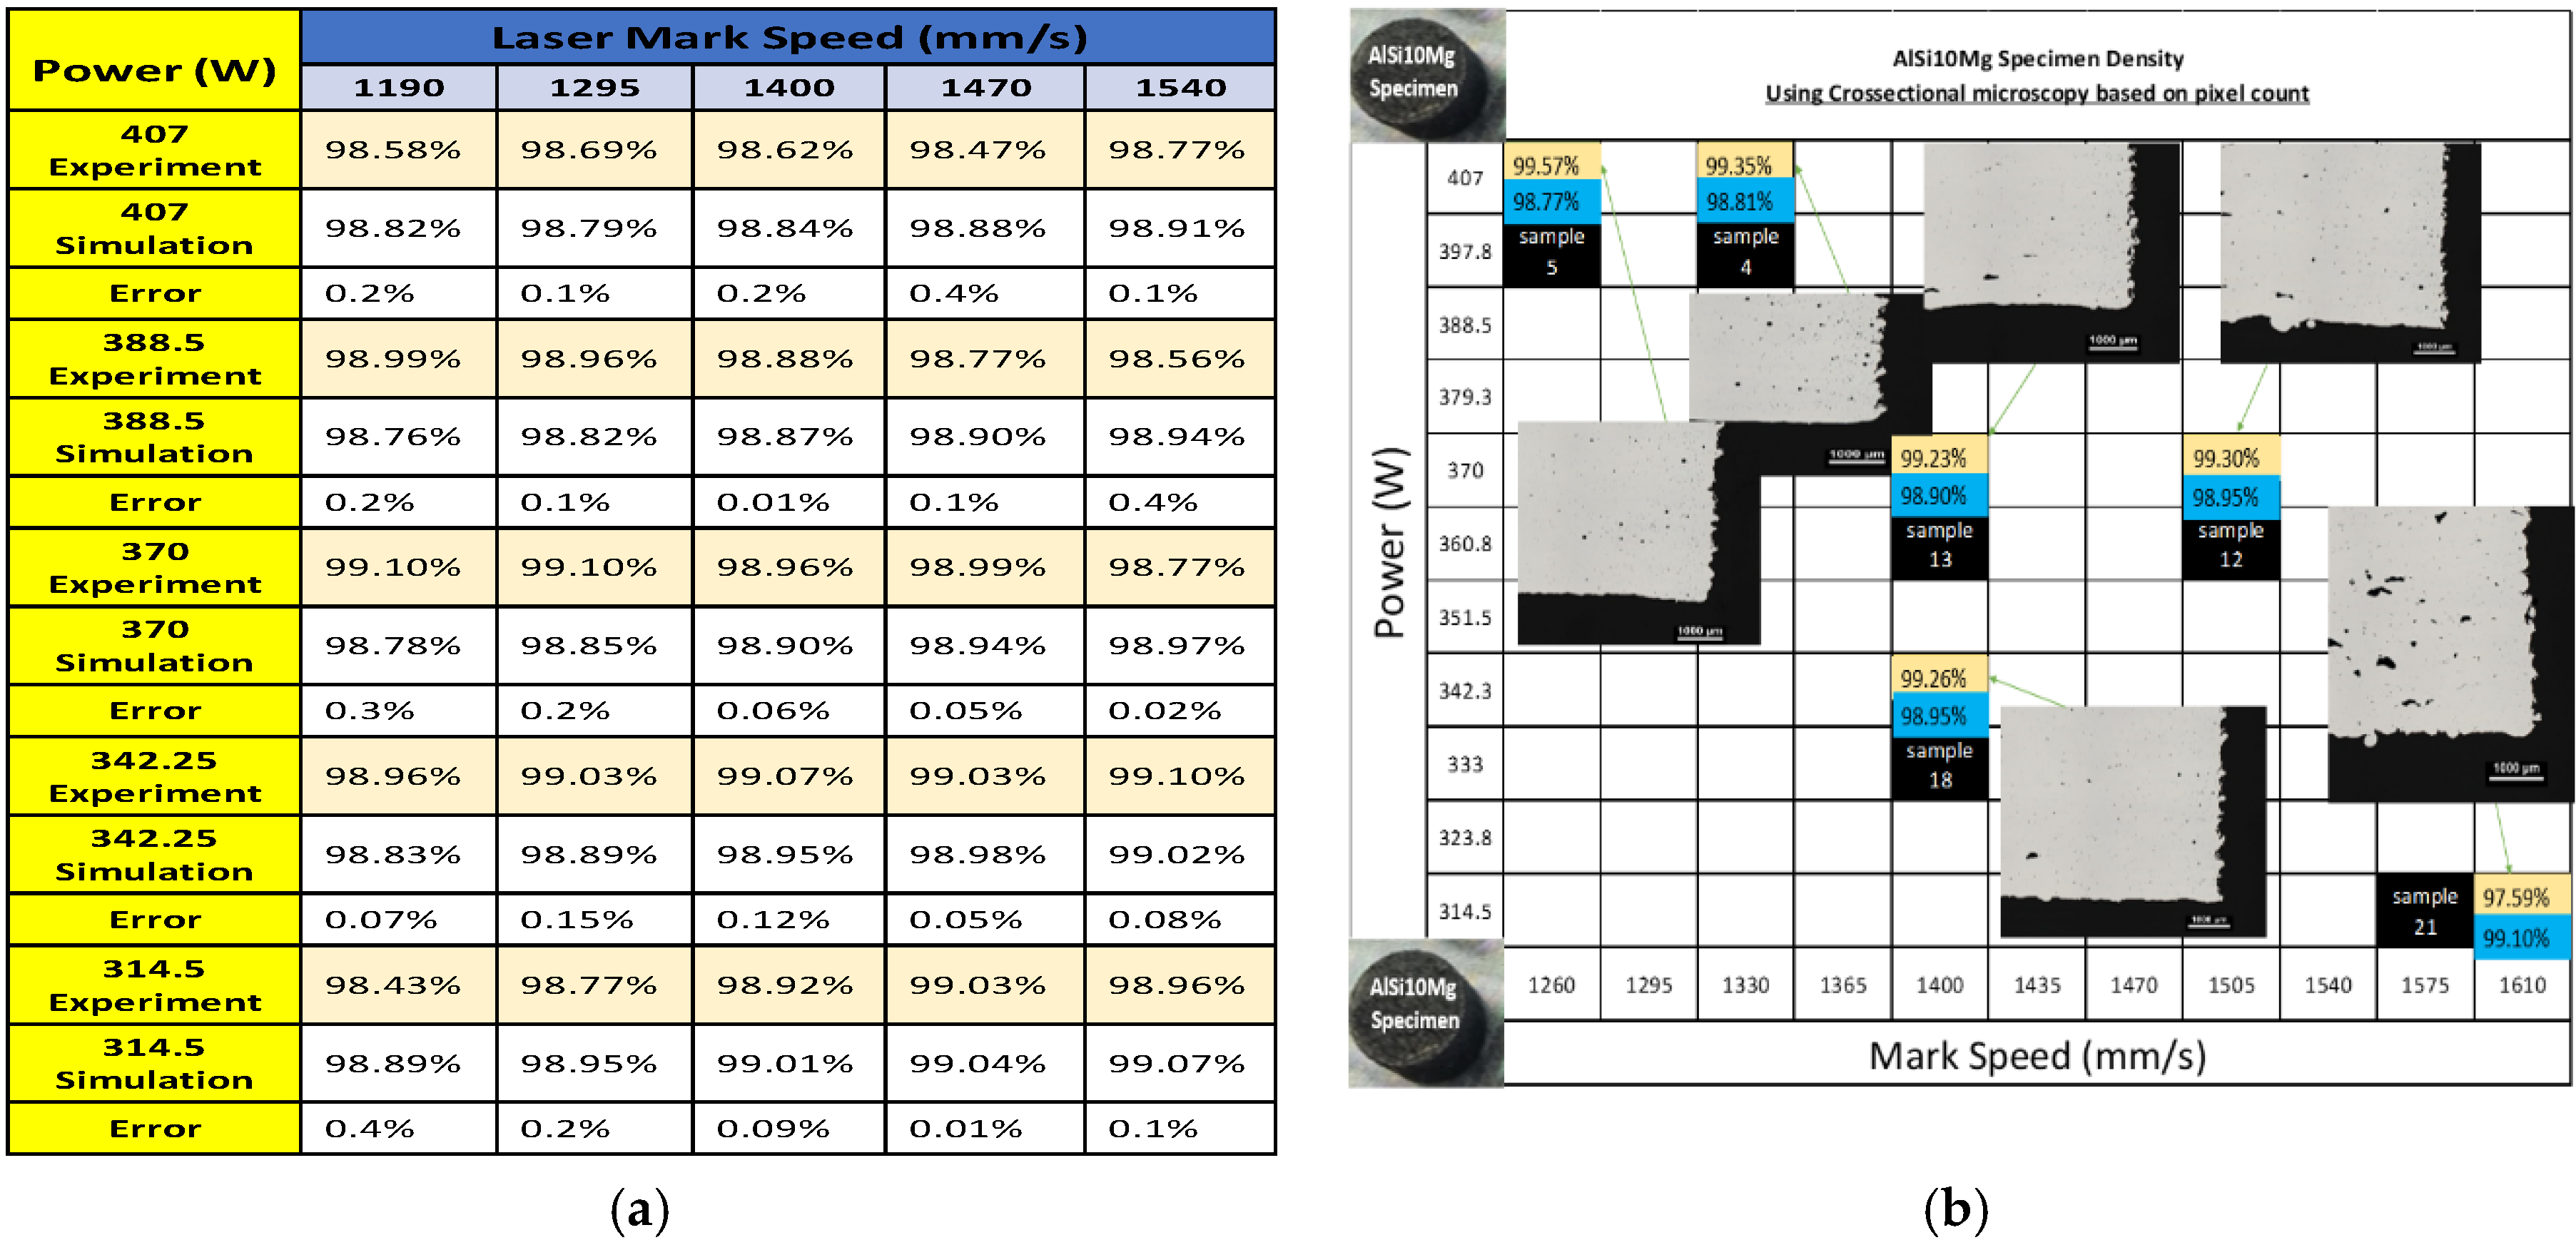
3.1.1. AlSi10Mg Coin Specimen and LBFP Process
3.1.2. Experimental and Simulation Results for Porosity in AlSi10Mg
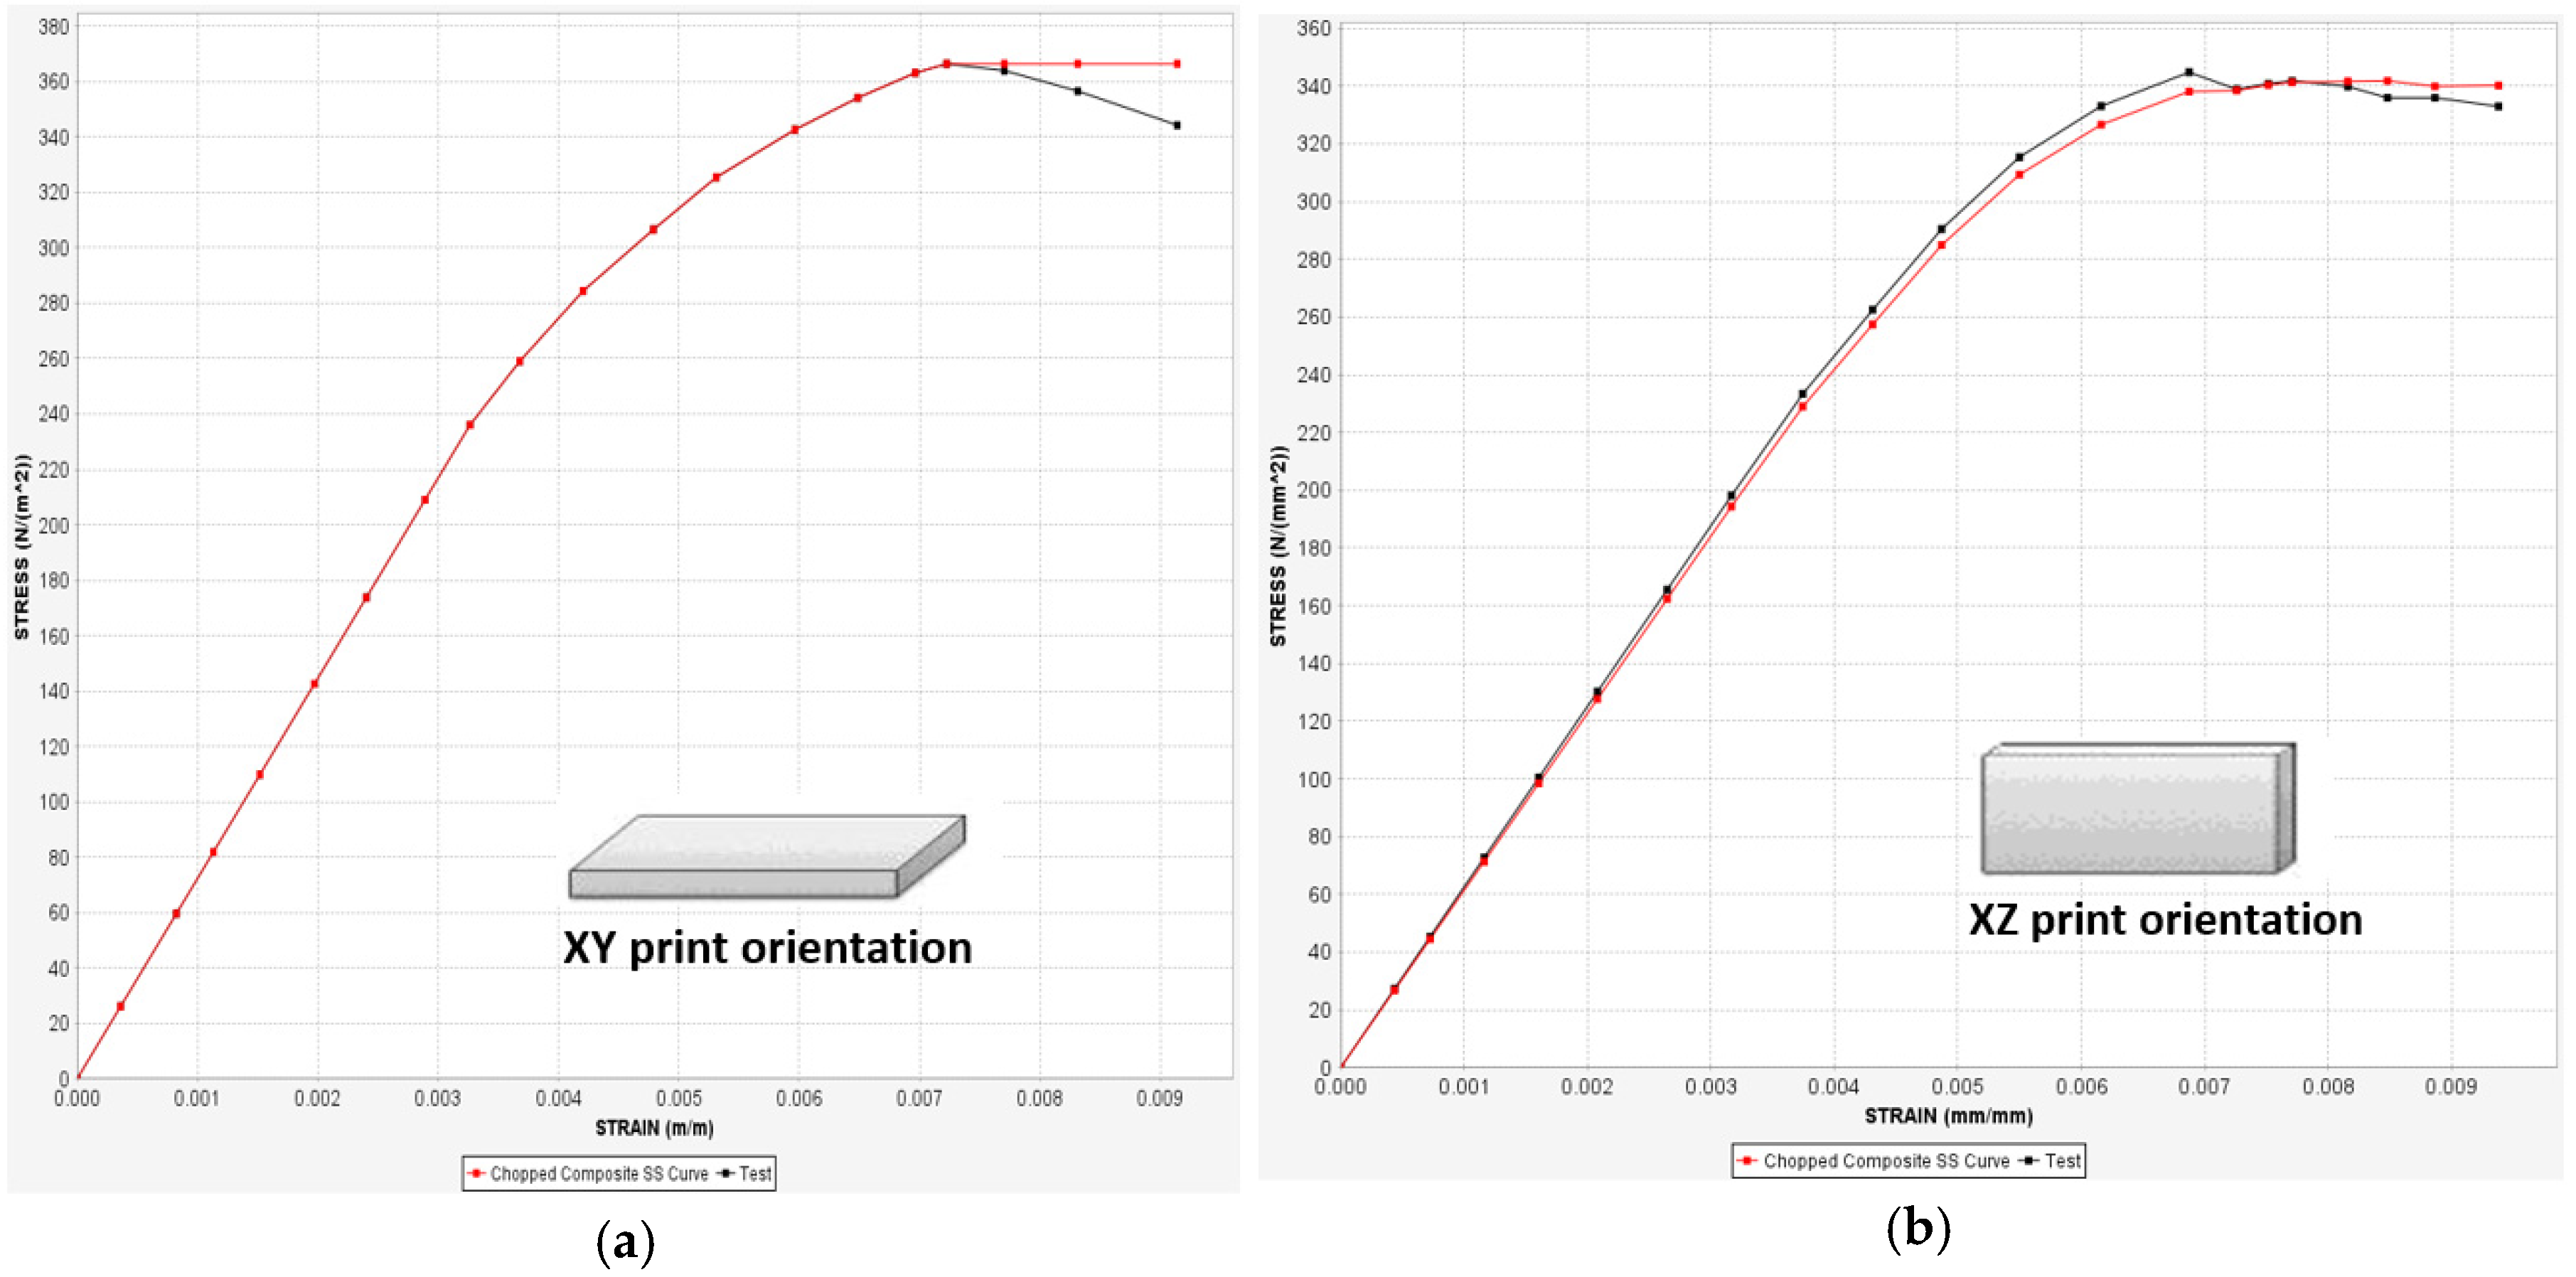
3.1.3. Tensile Data Related to Build Orientation.
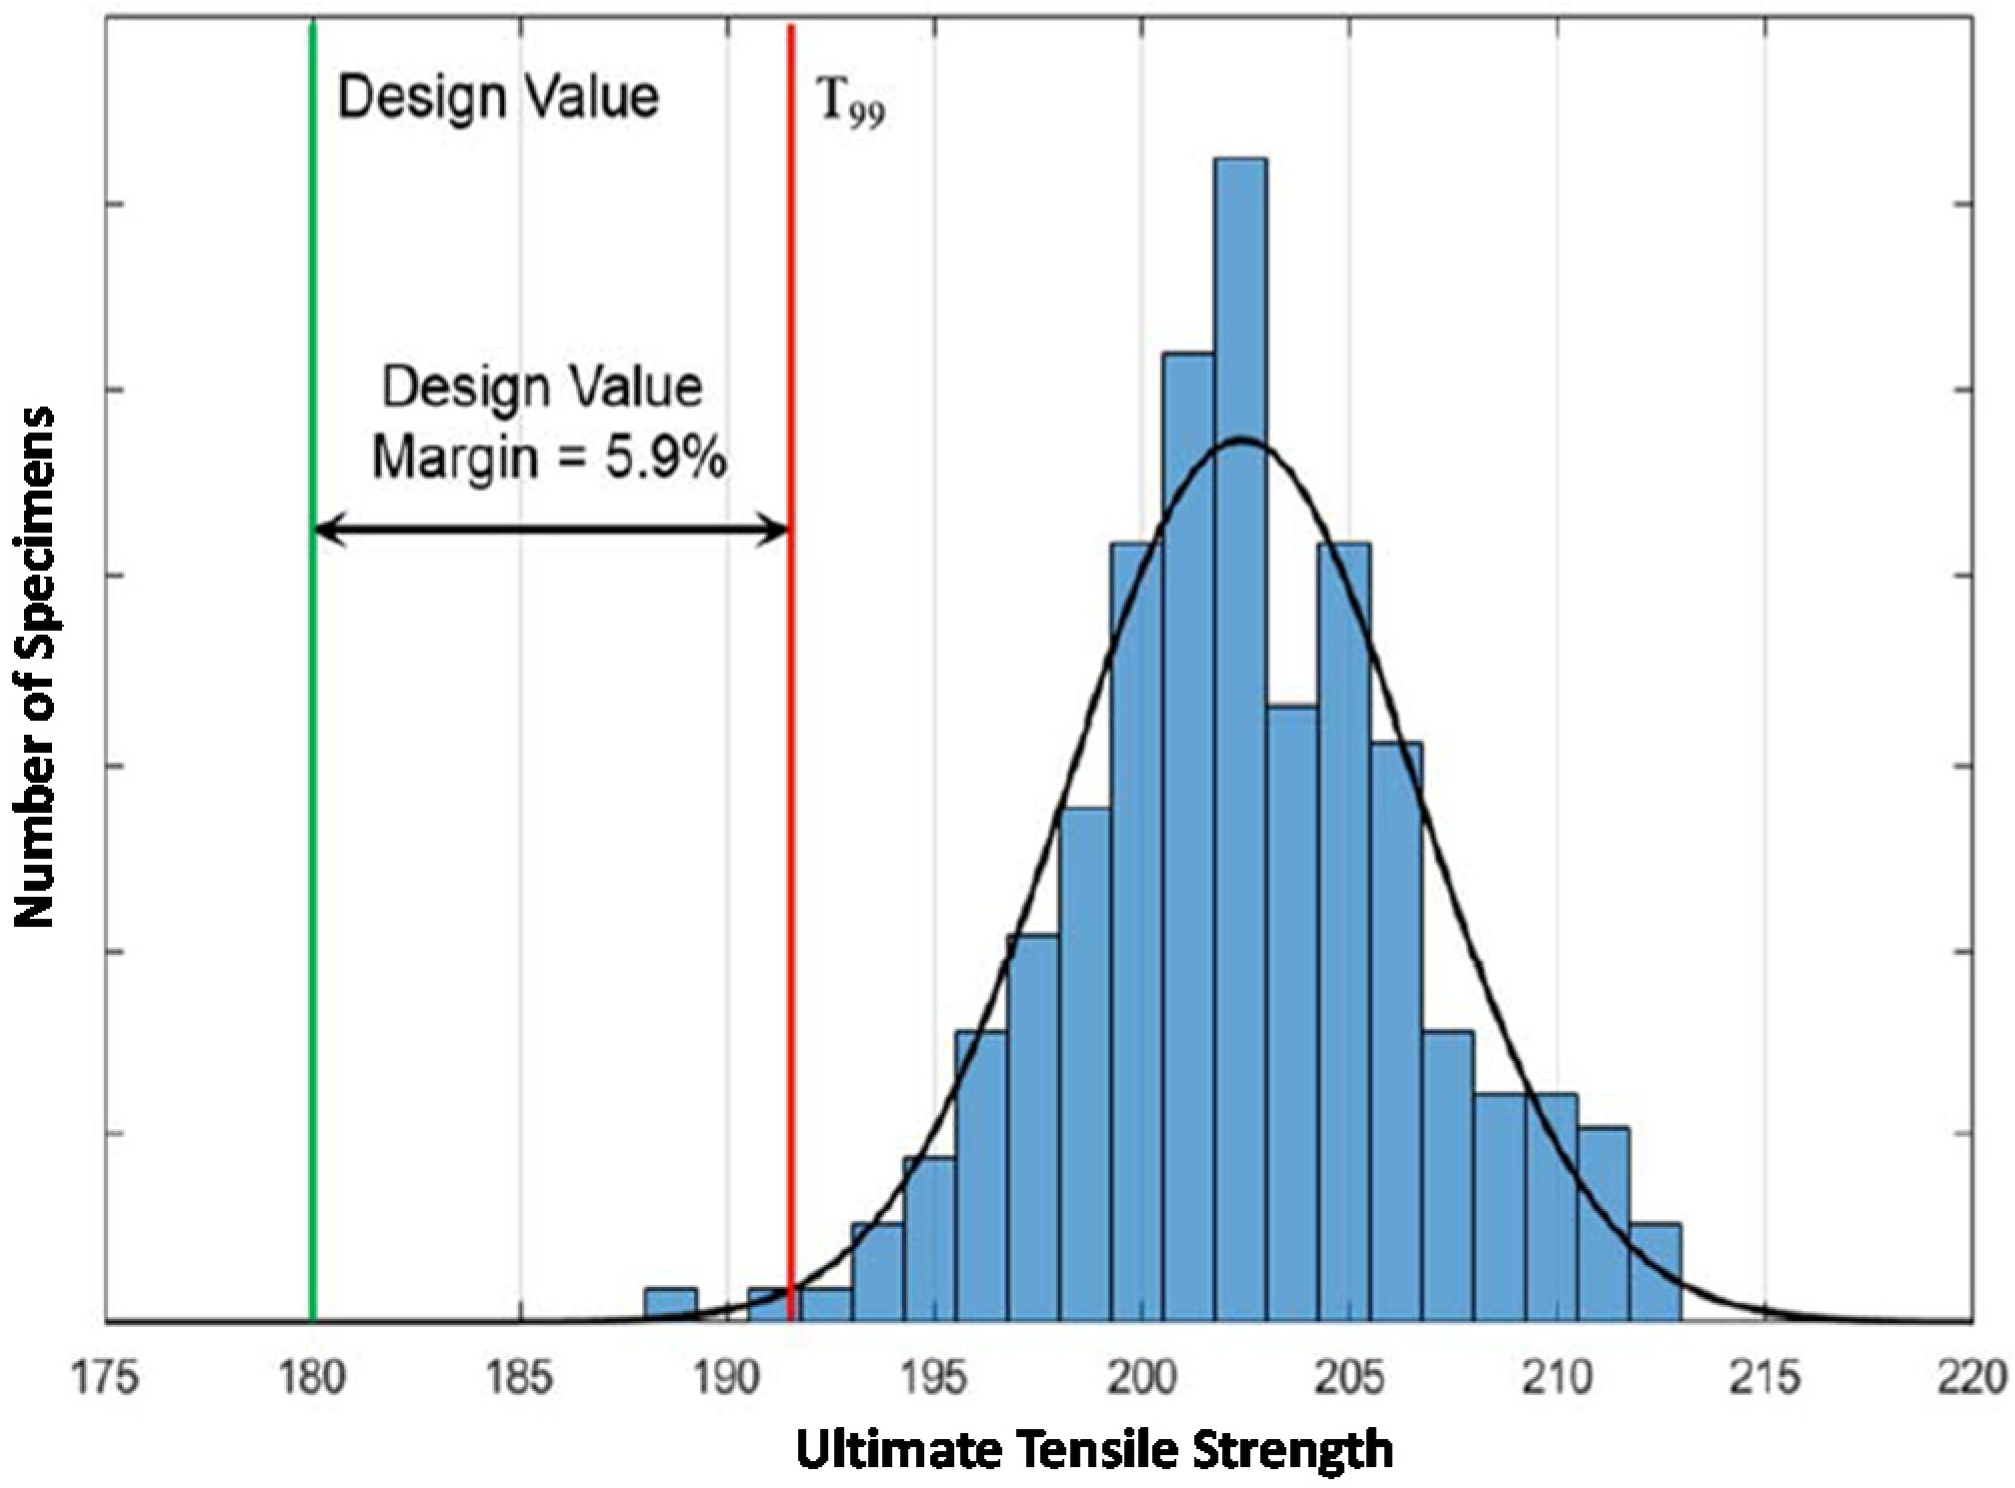
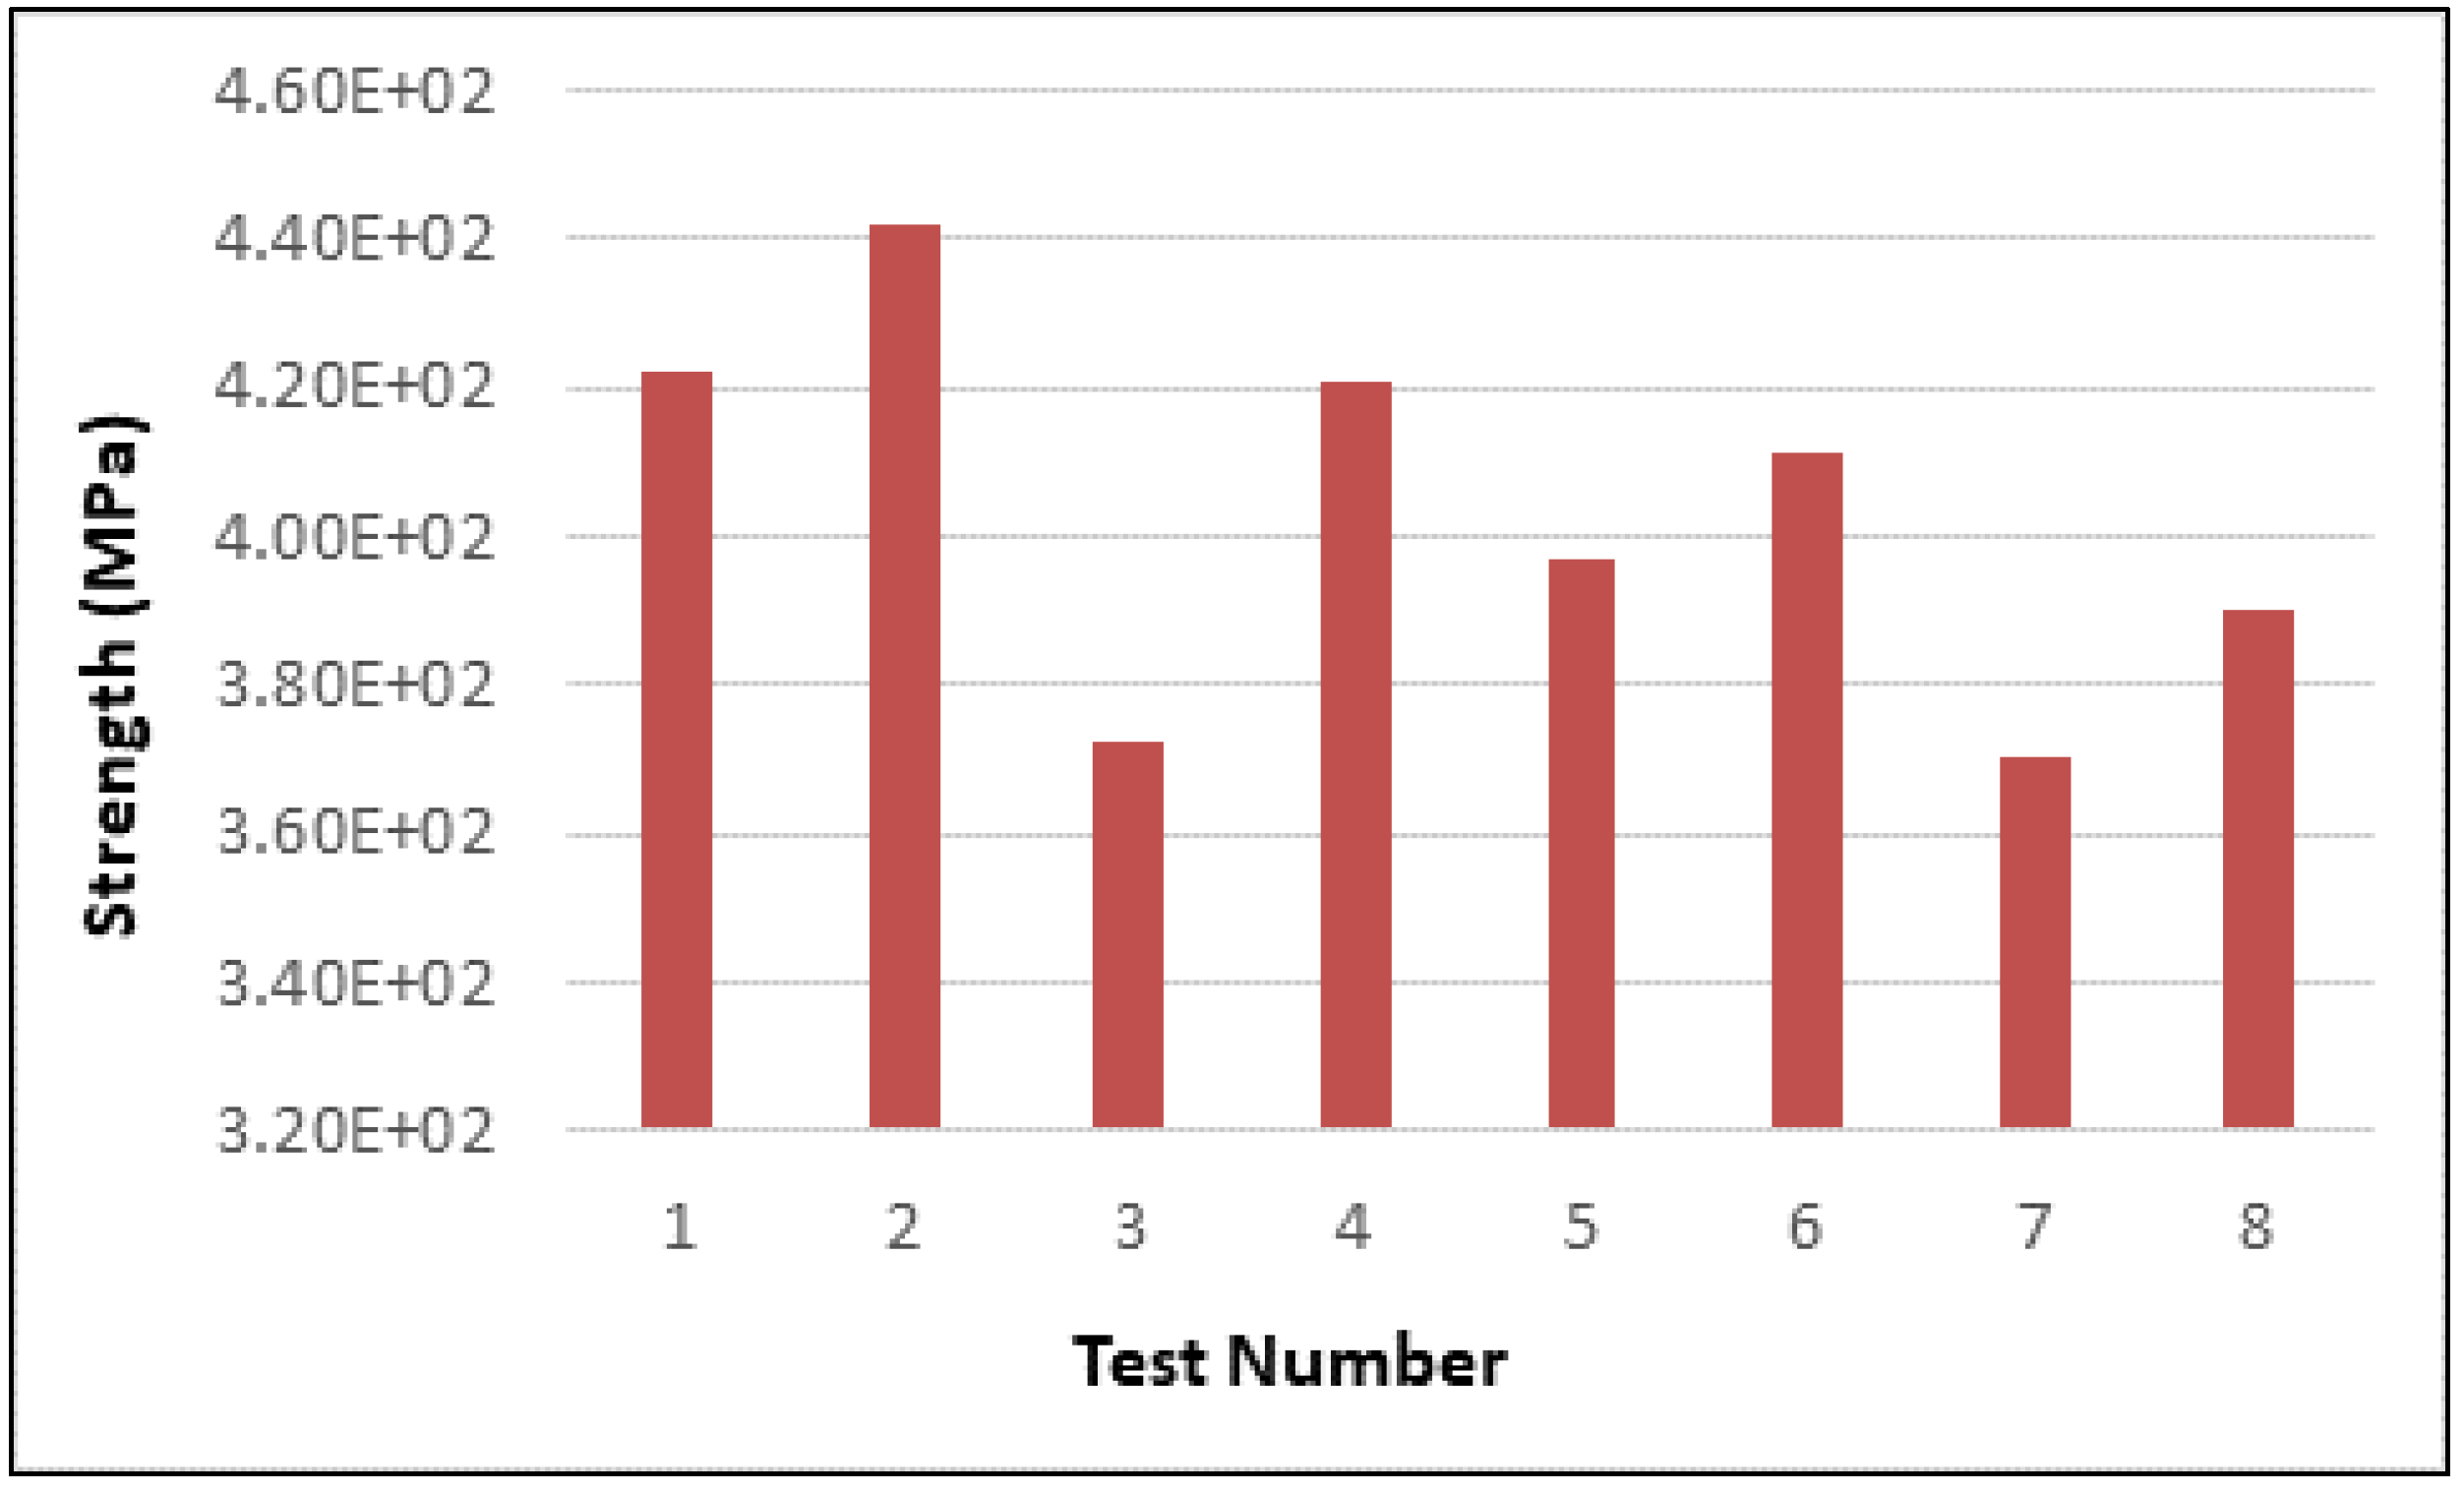
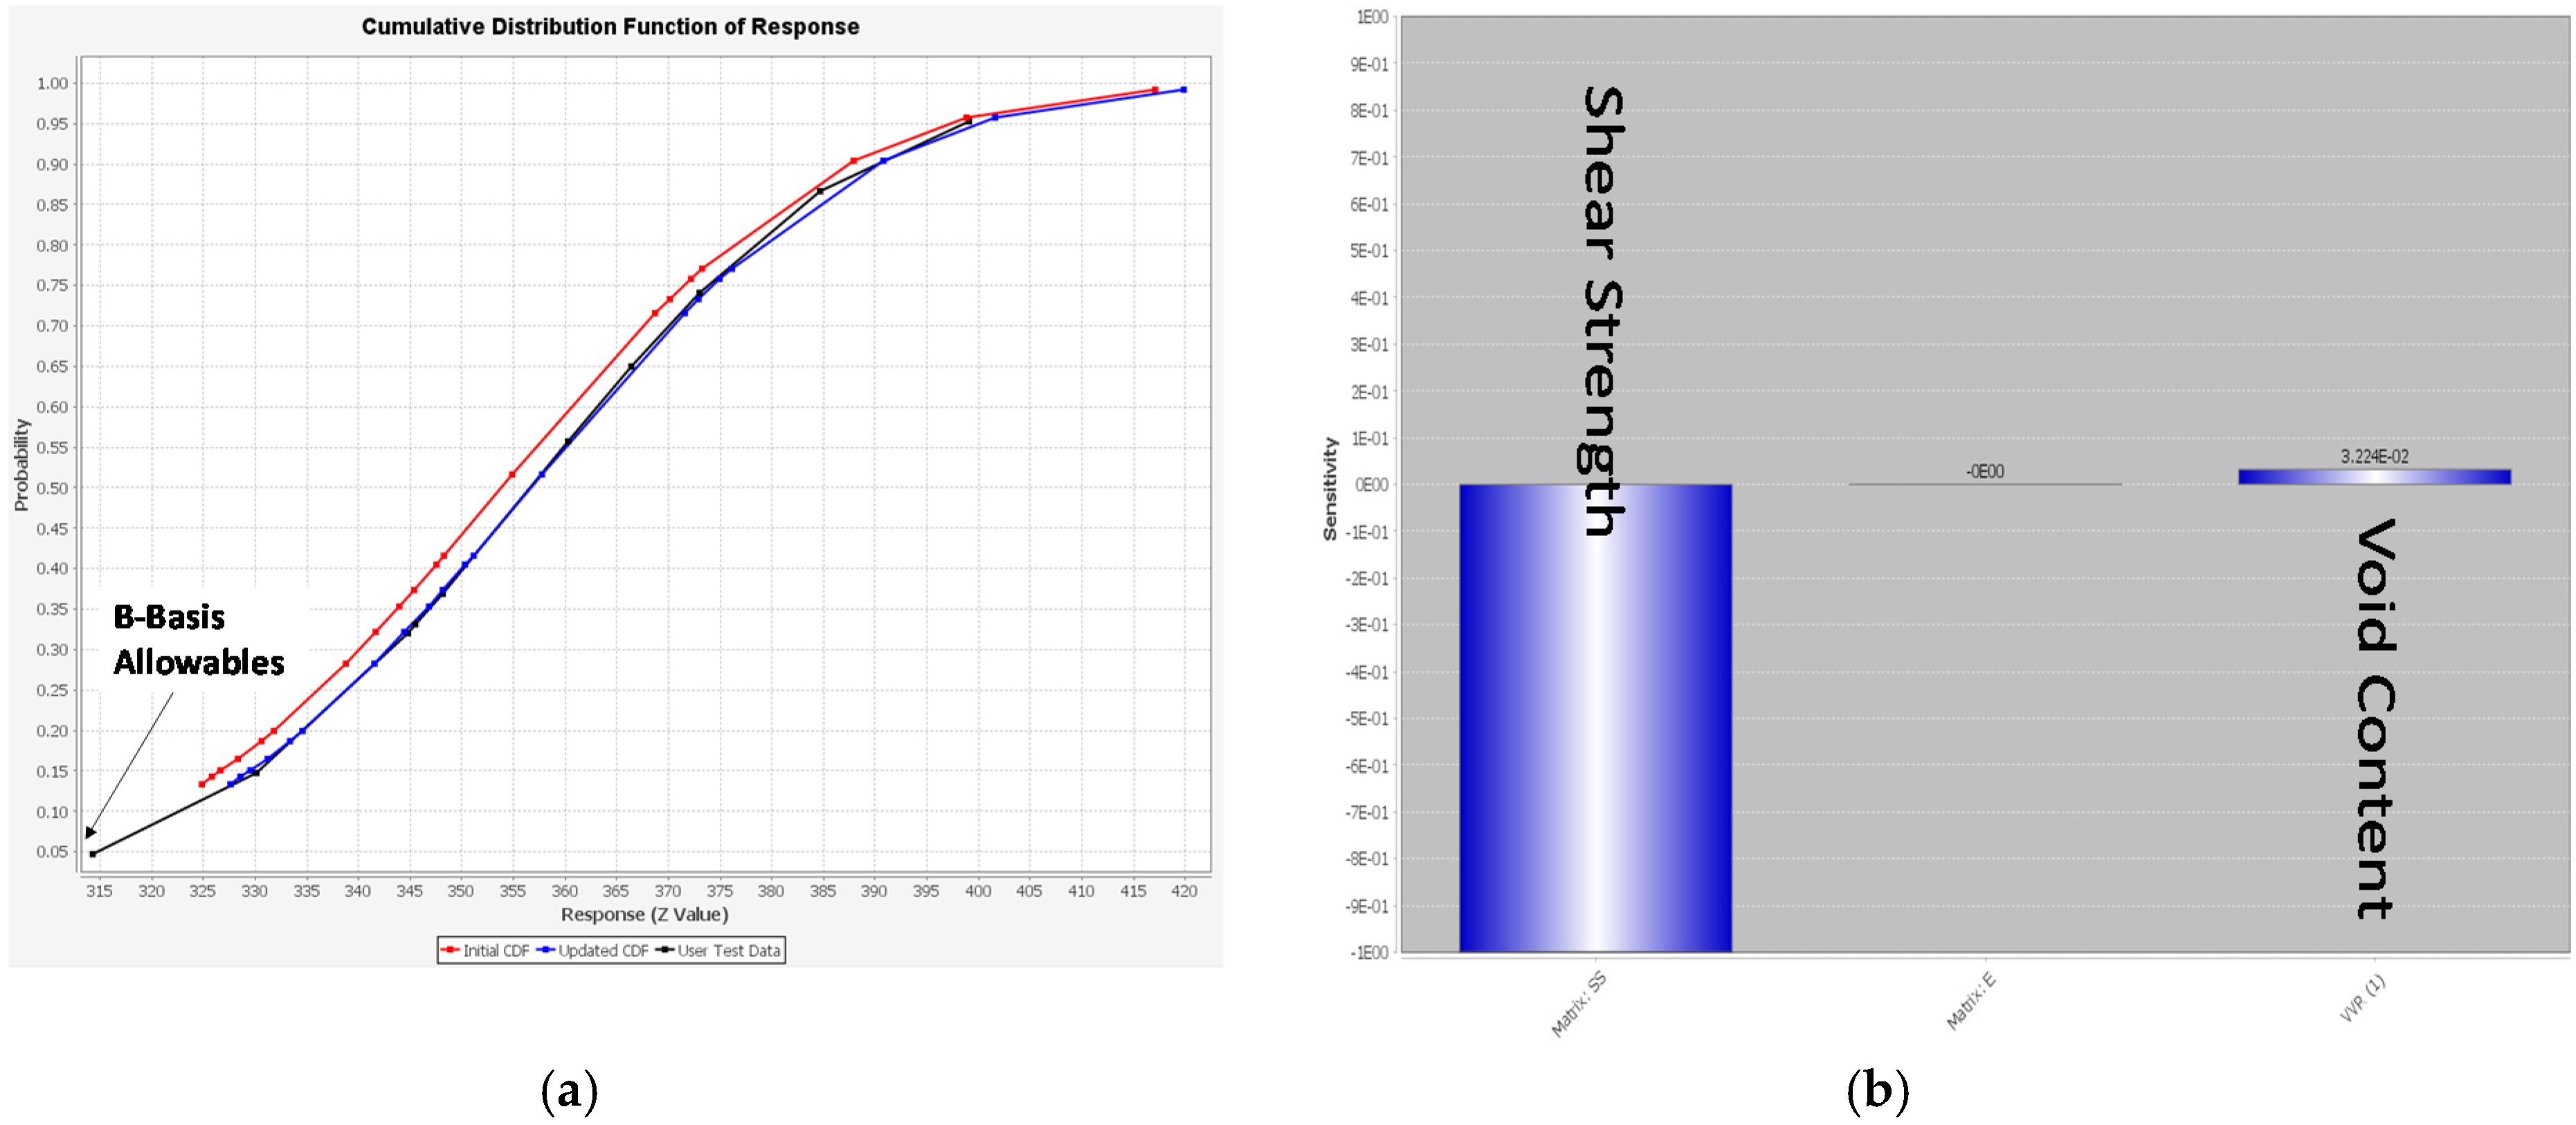
3.1.4. A-B Basis AlSi10Mg Strength Allowable and Sensitivity Analysis to Variations of Material Properties
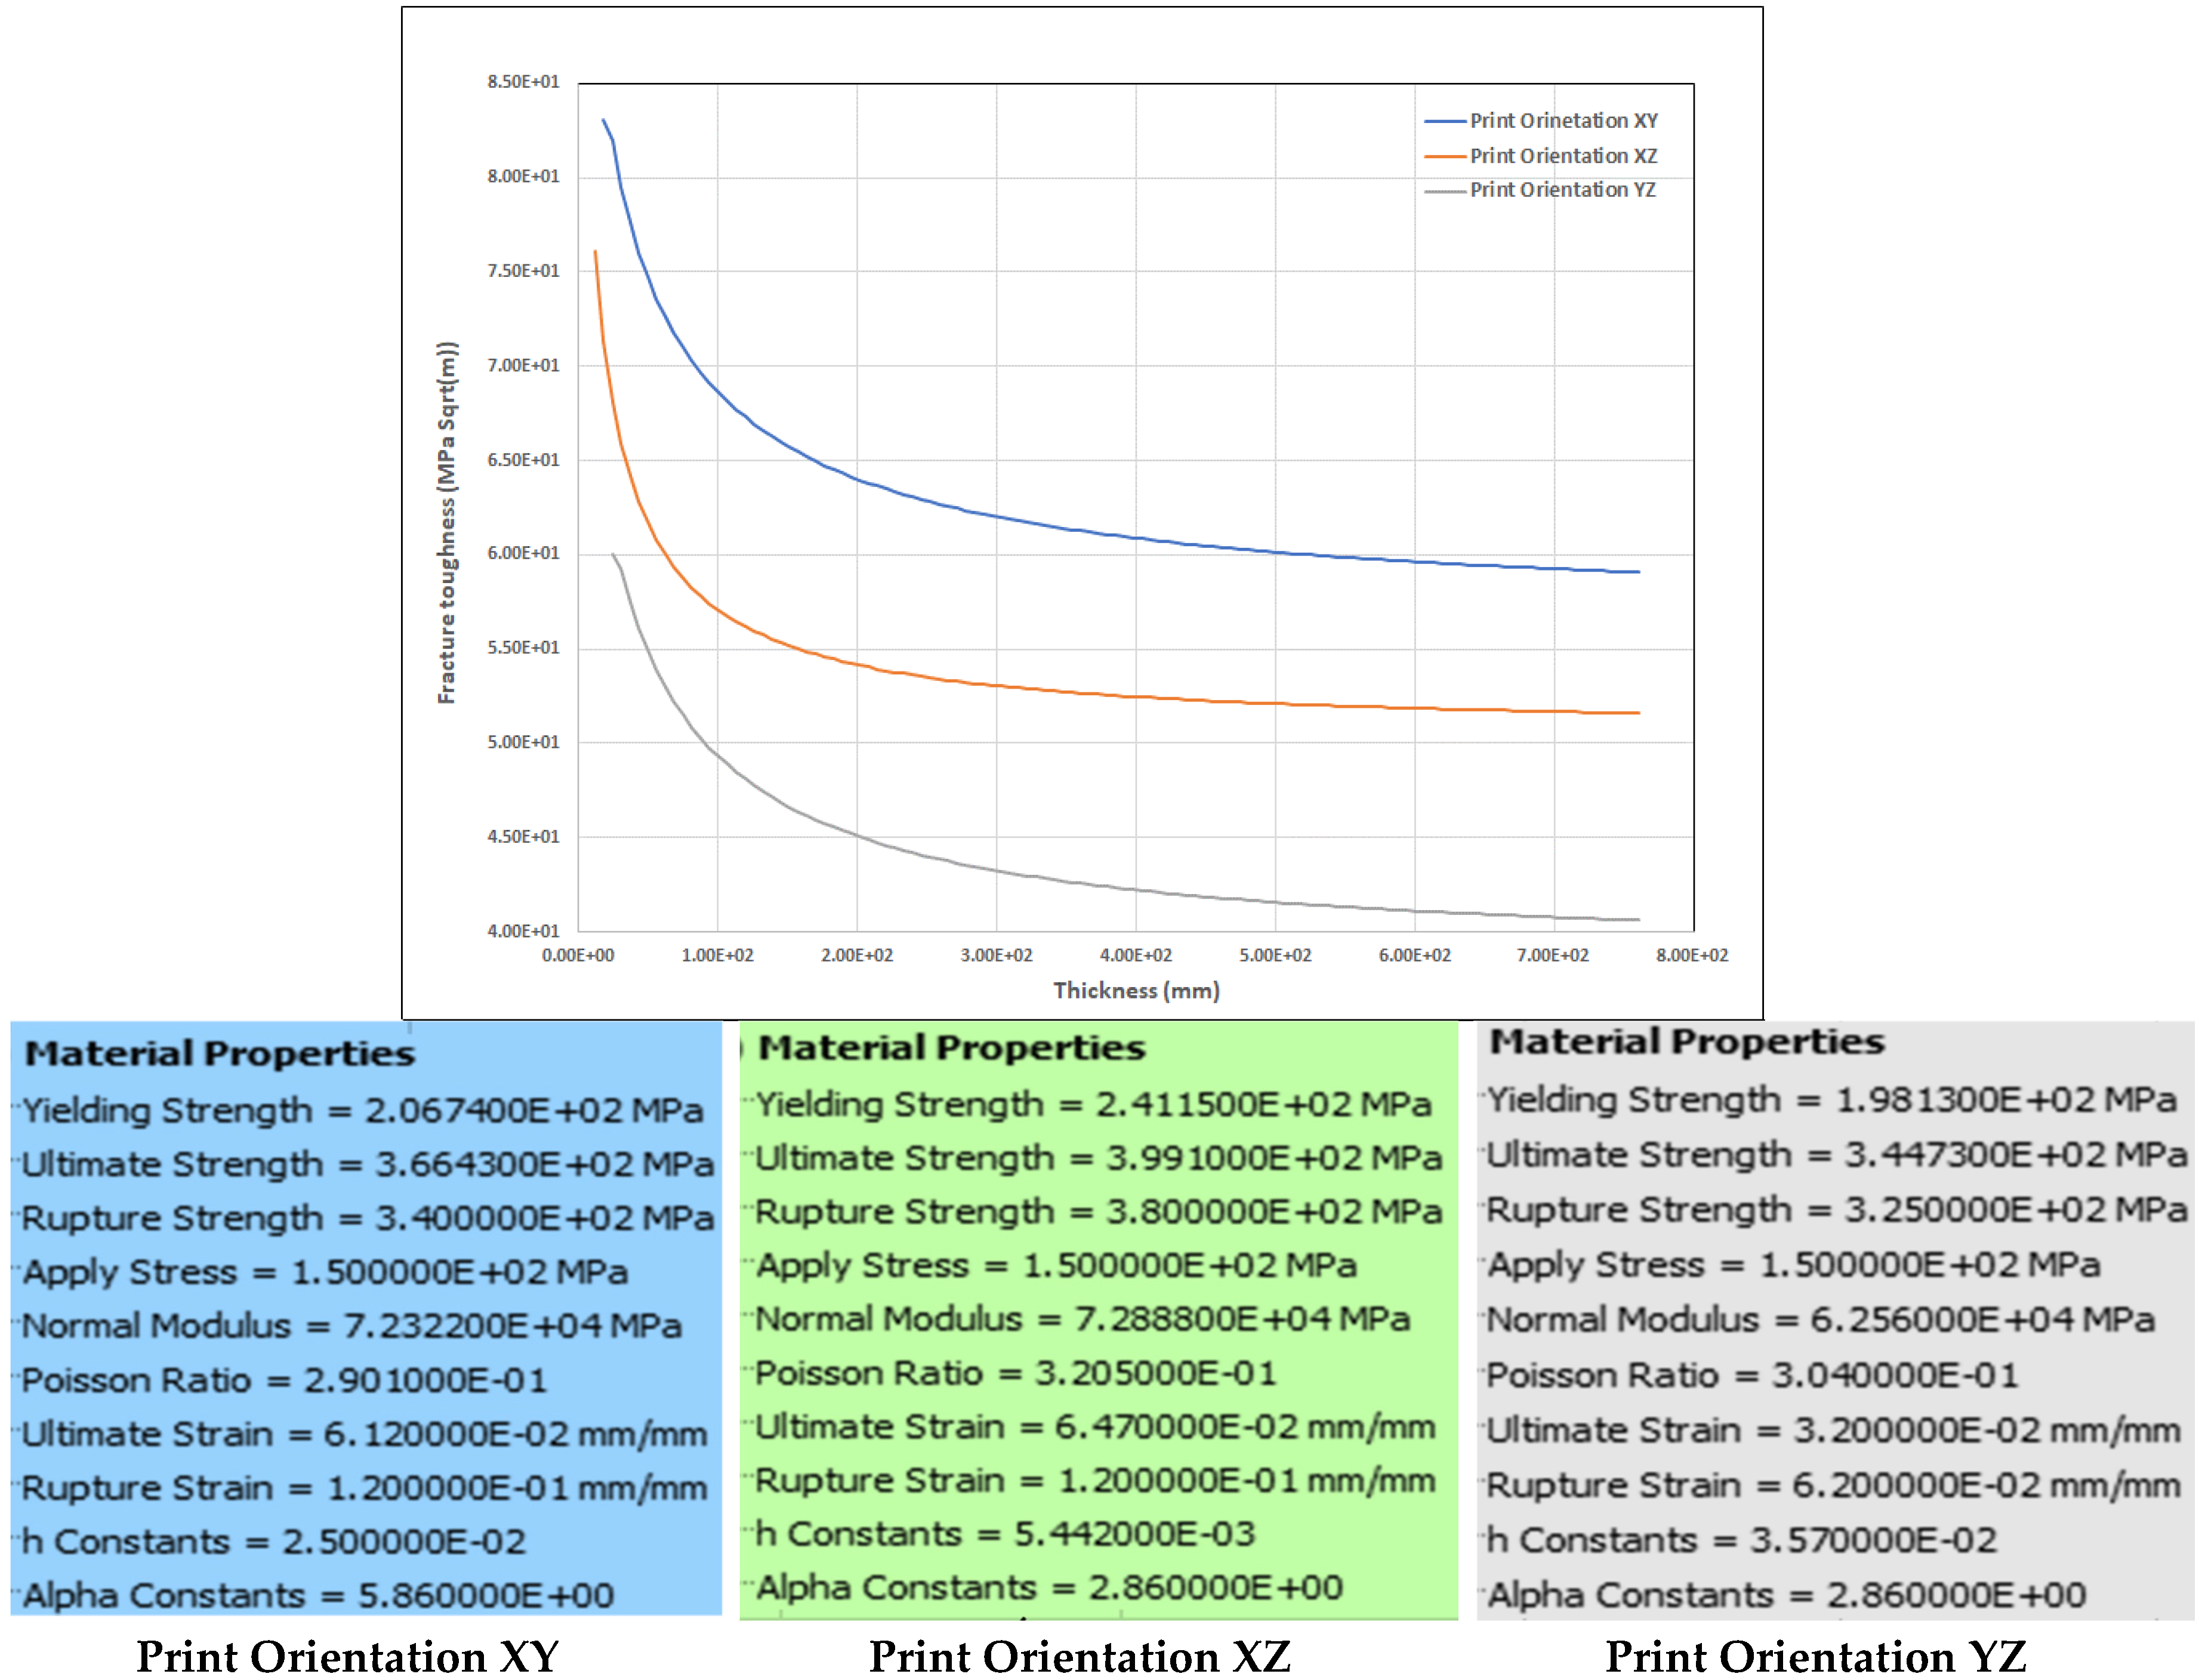
3.1.5. Fracture Toughness Determination and Fatigue Crack Growth for AlSi10Mg
3.2. Allowable Generation of Ti64Al4V and EBM Process
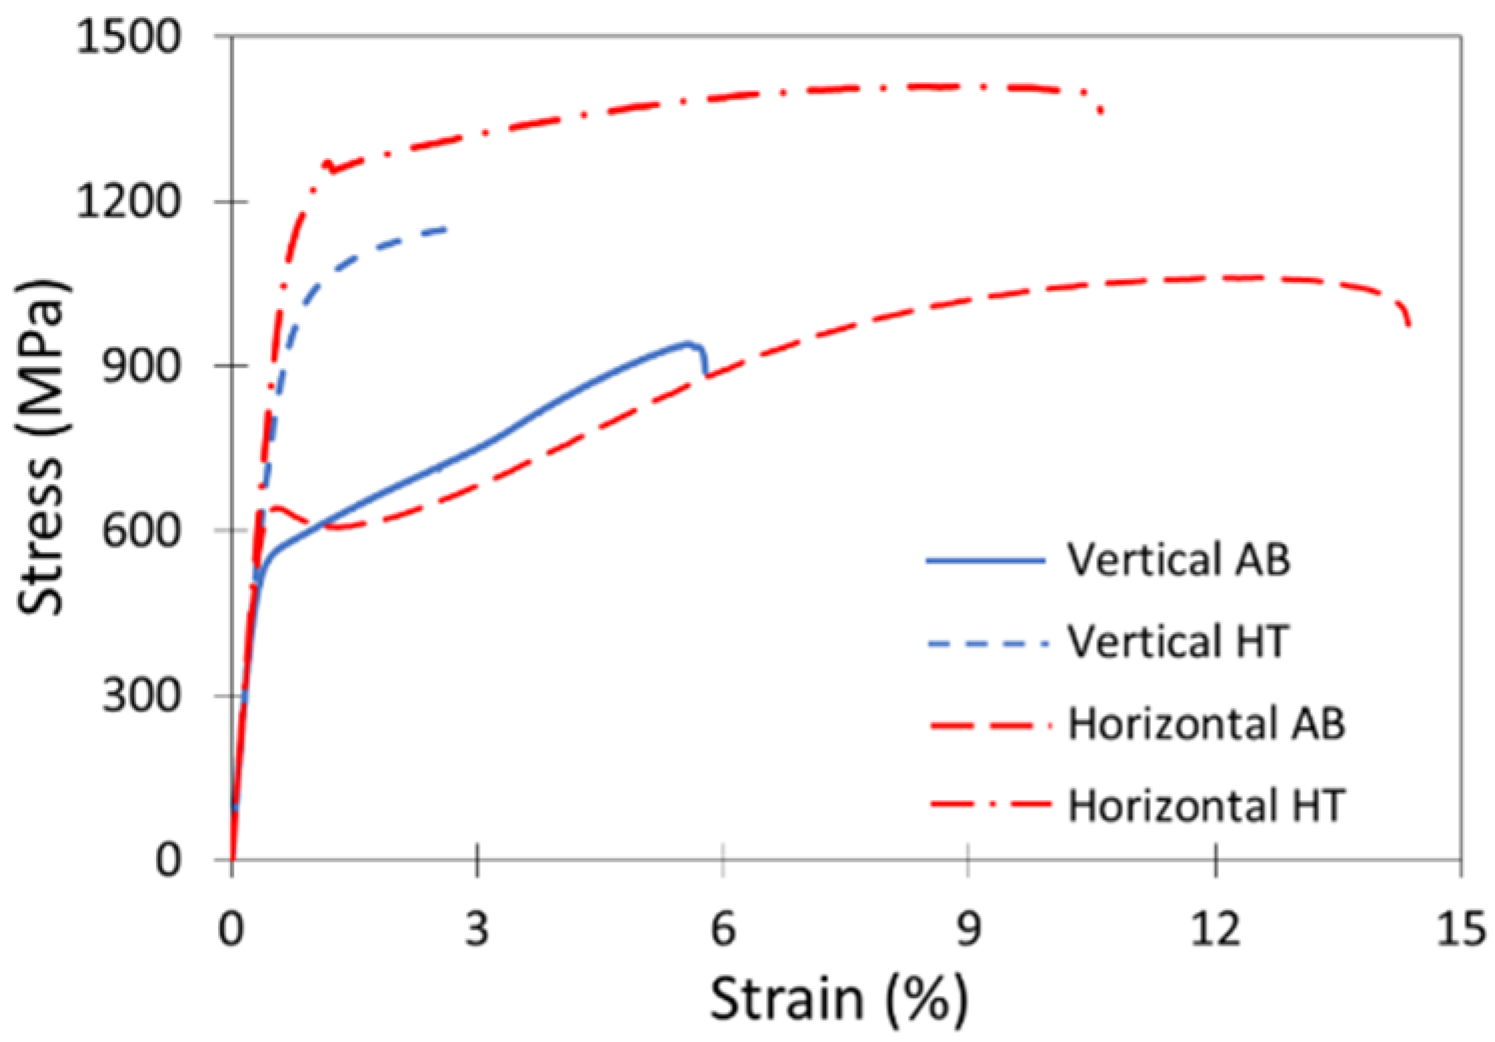
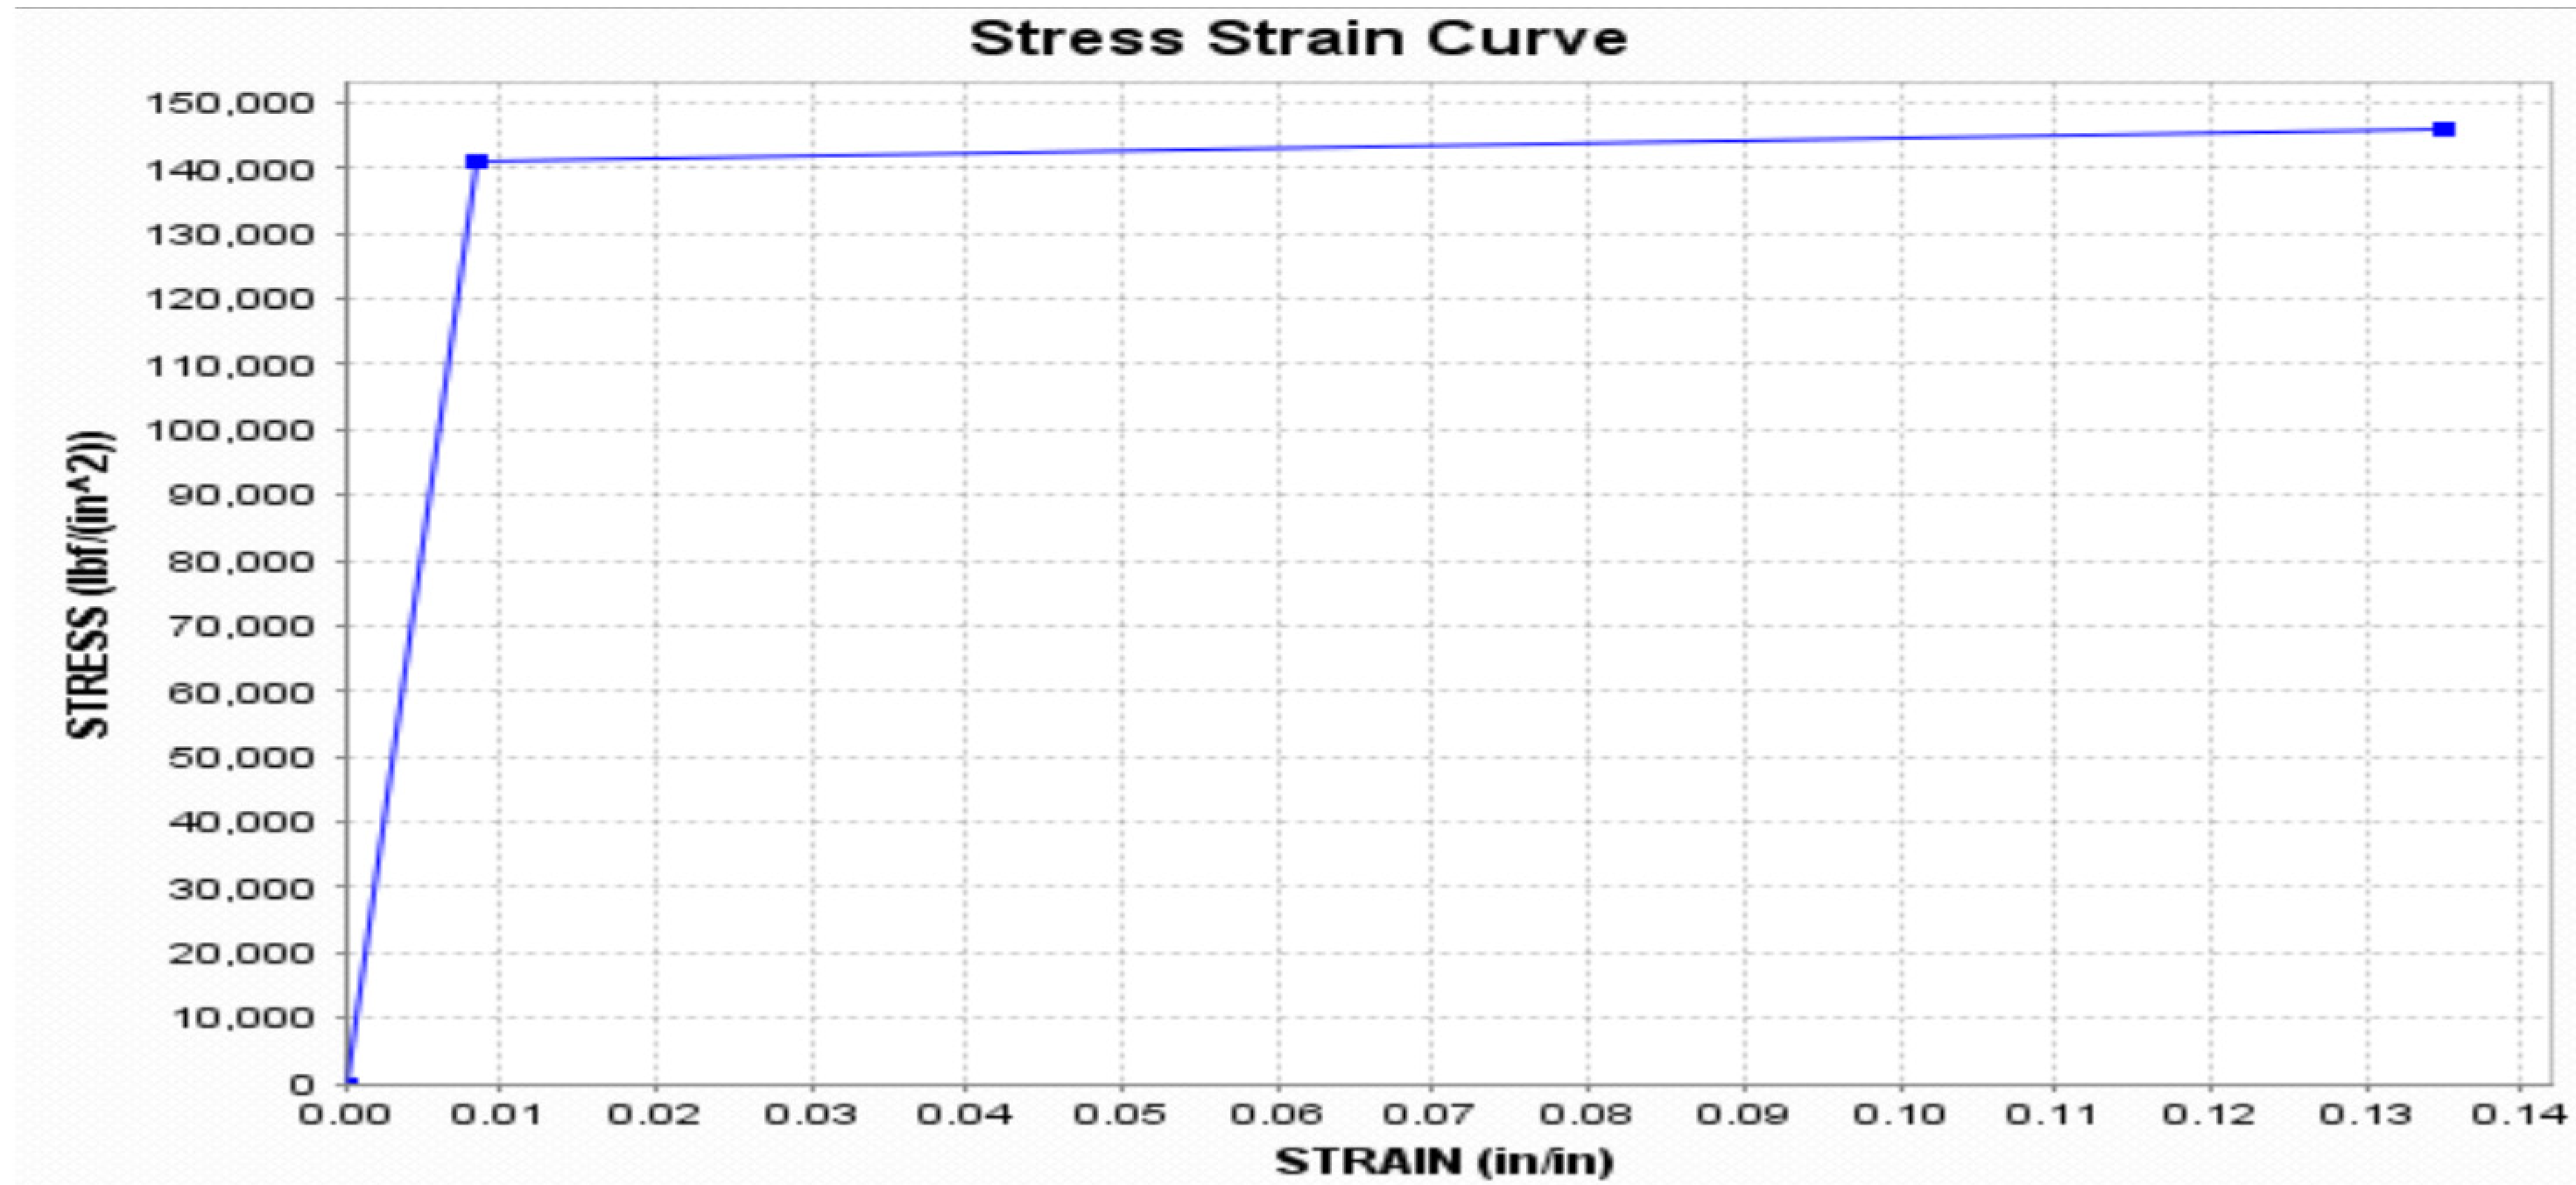
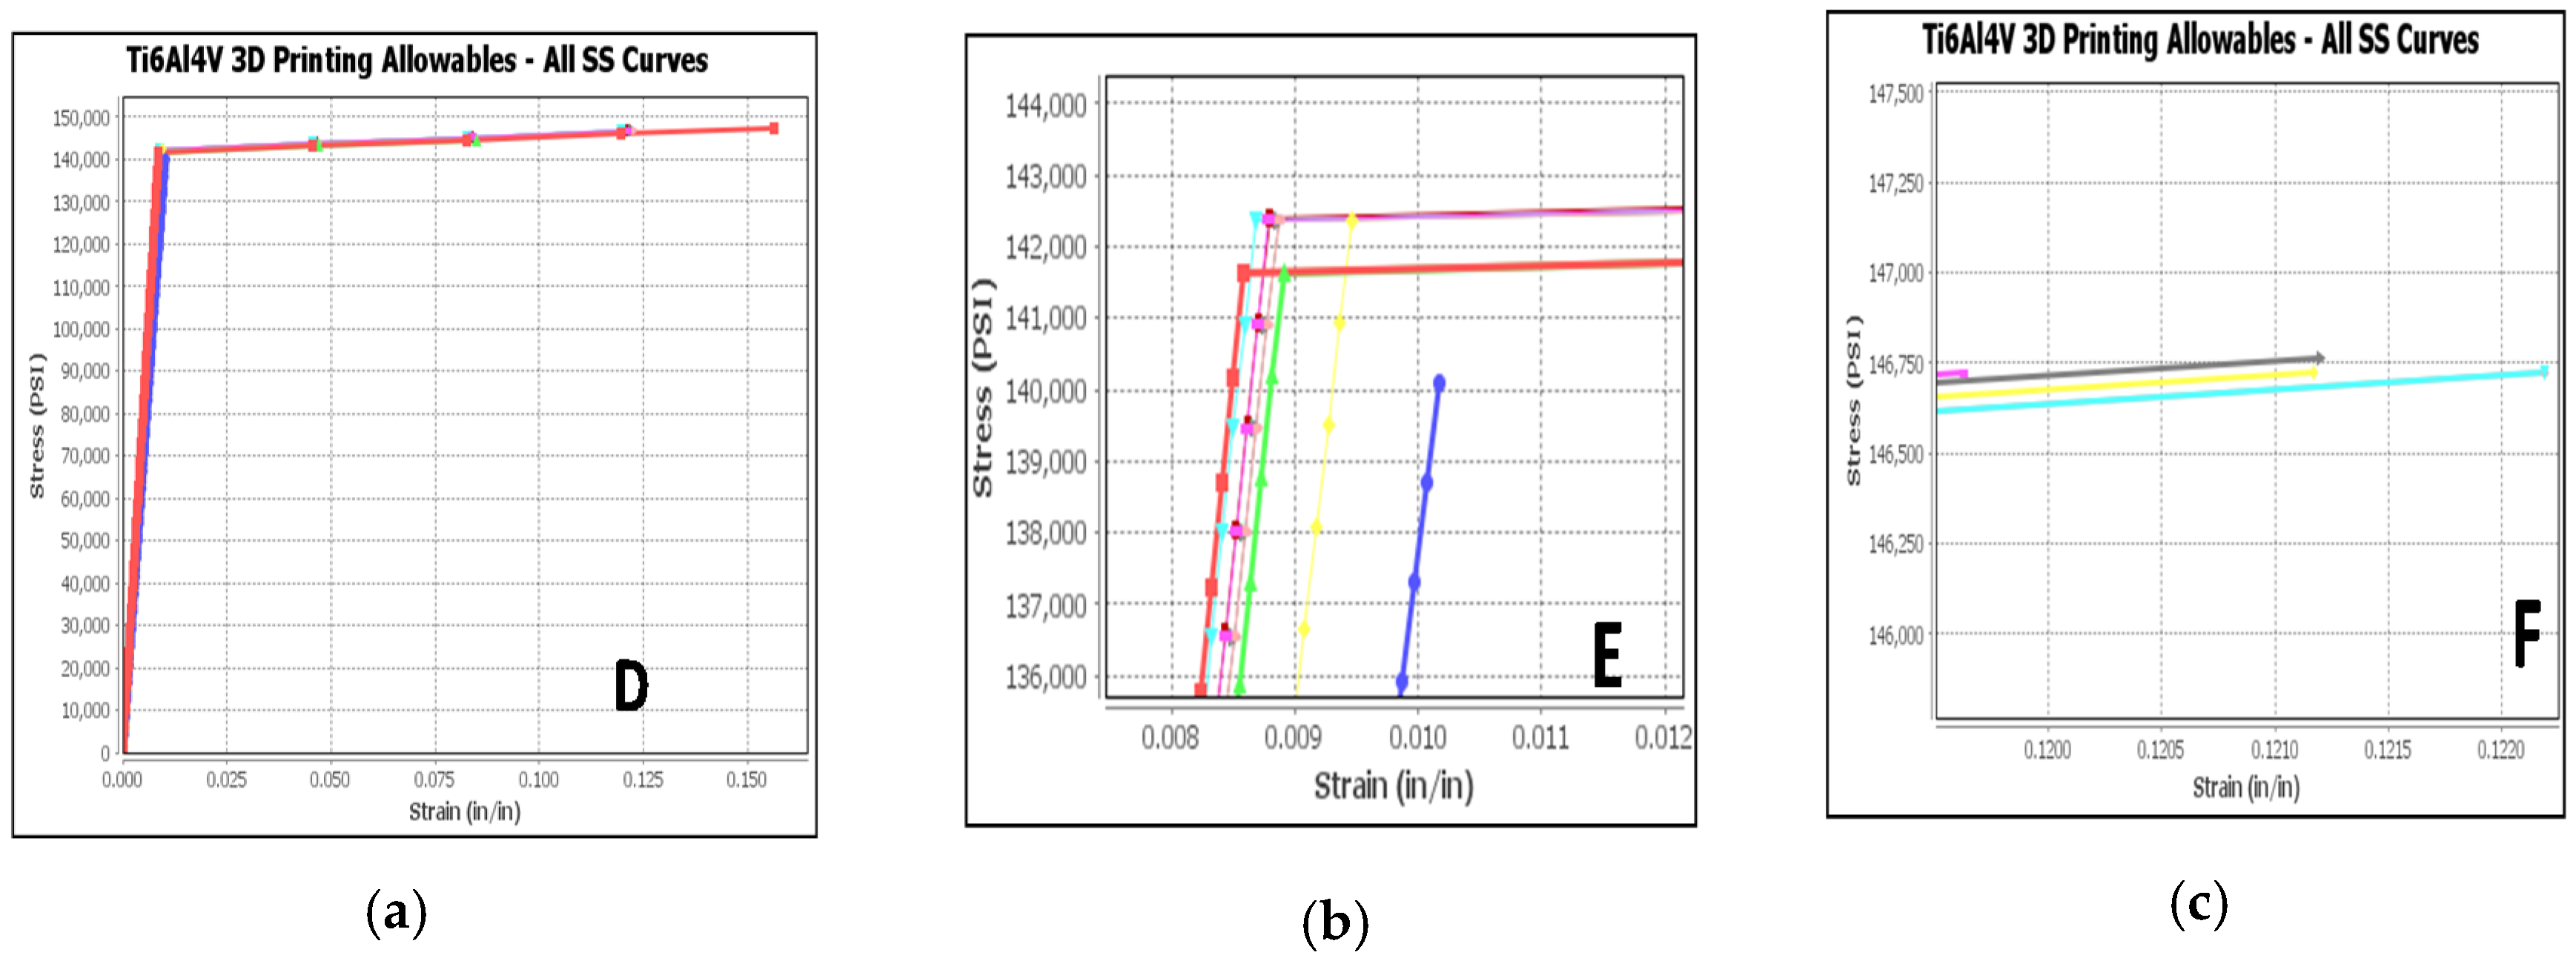
3.2.1. Print Orientation Effect on Tensile Strength and Strain
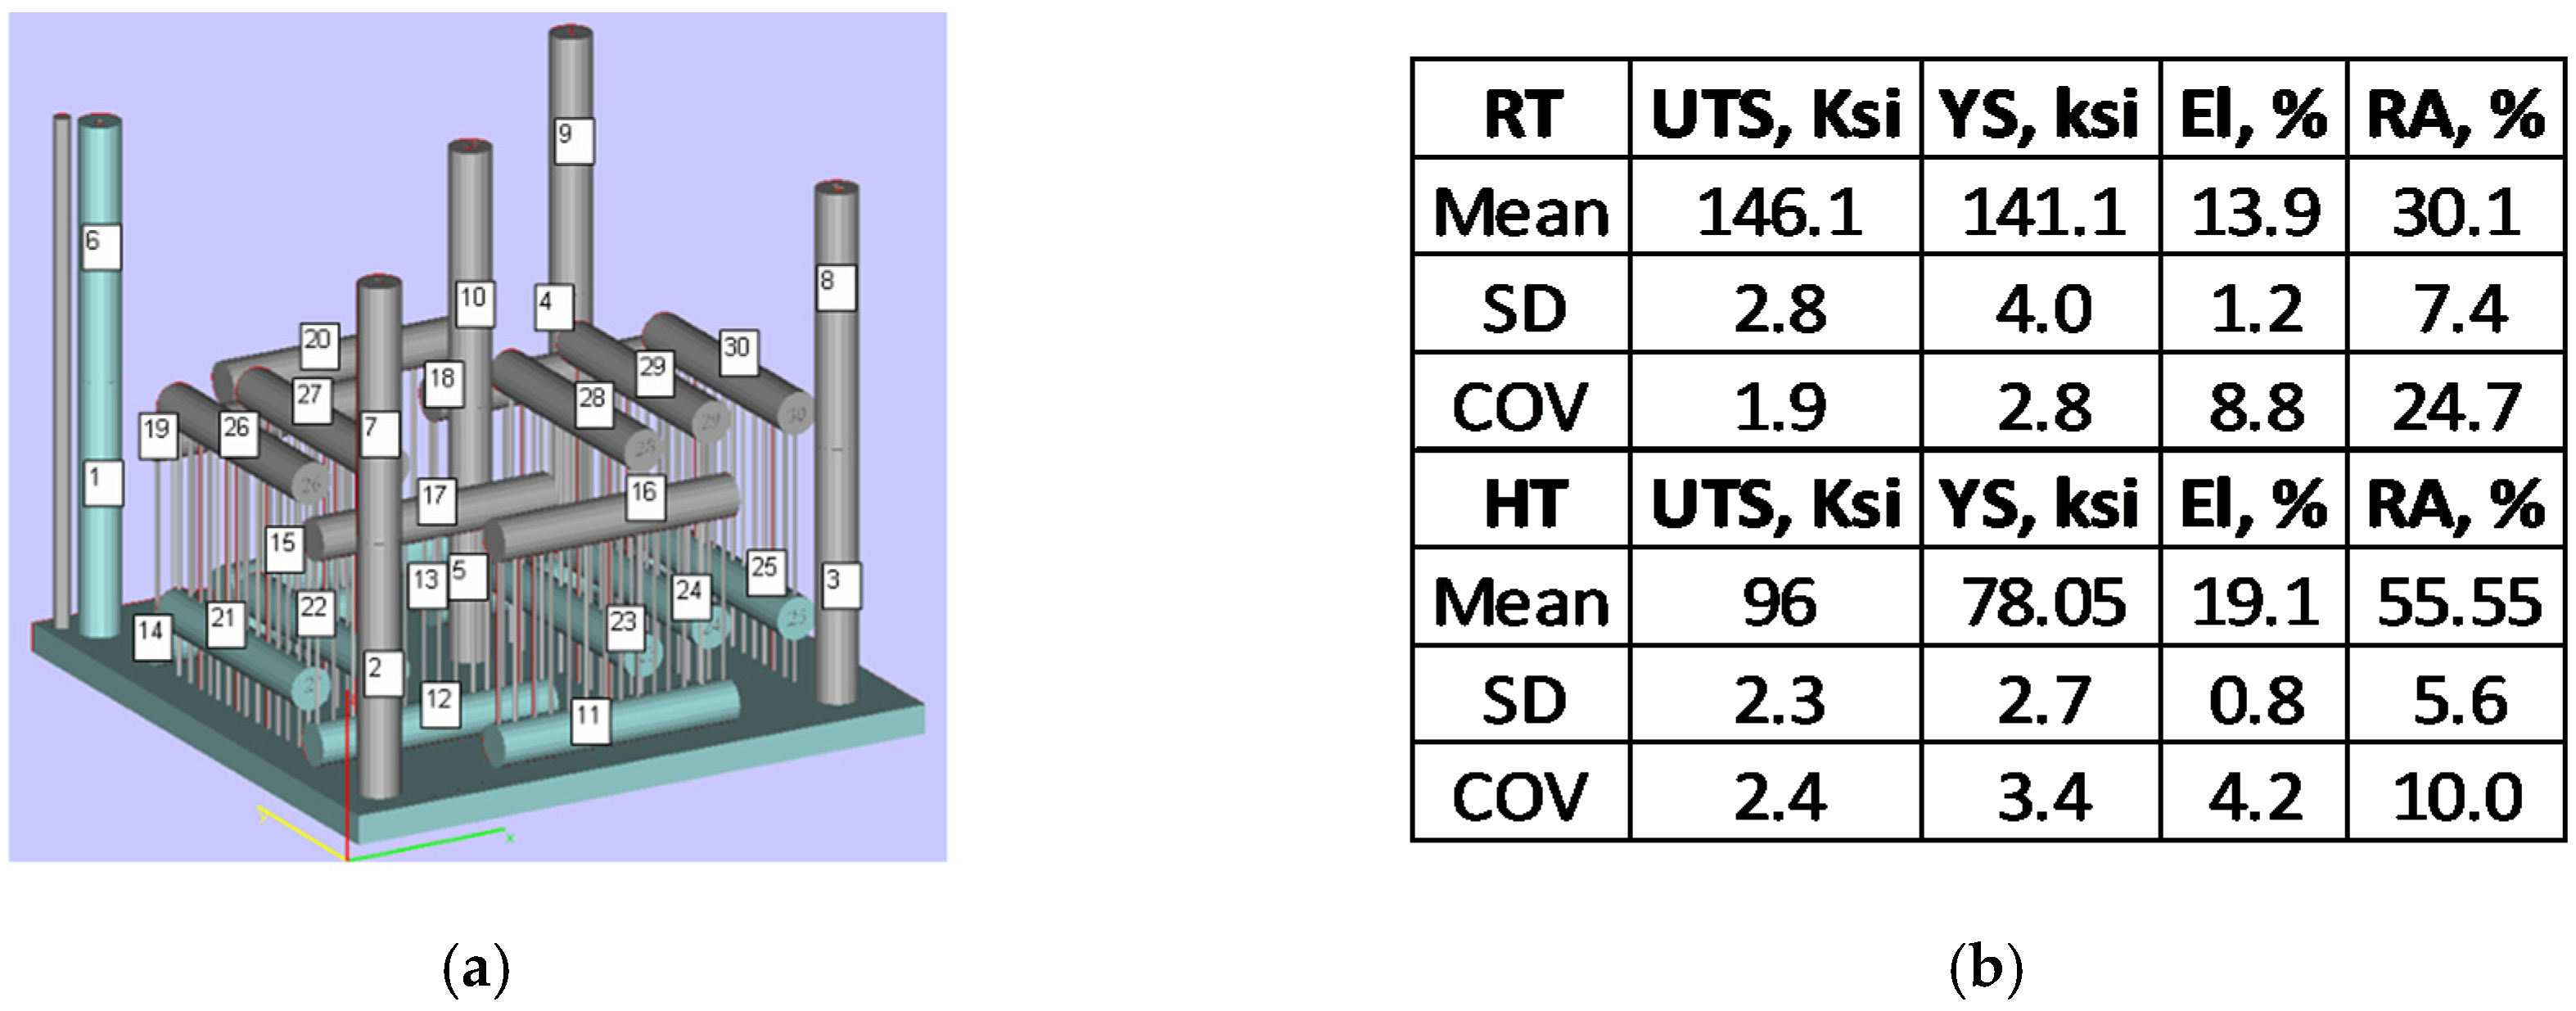
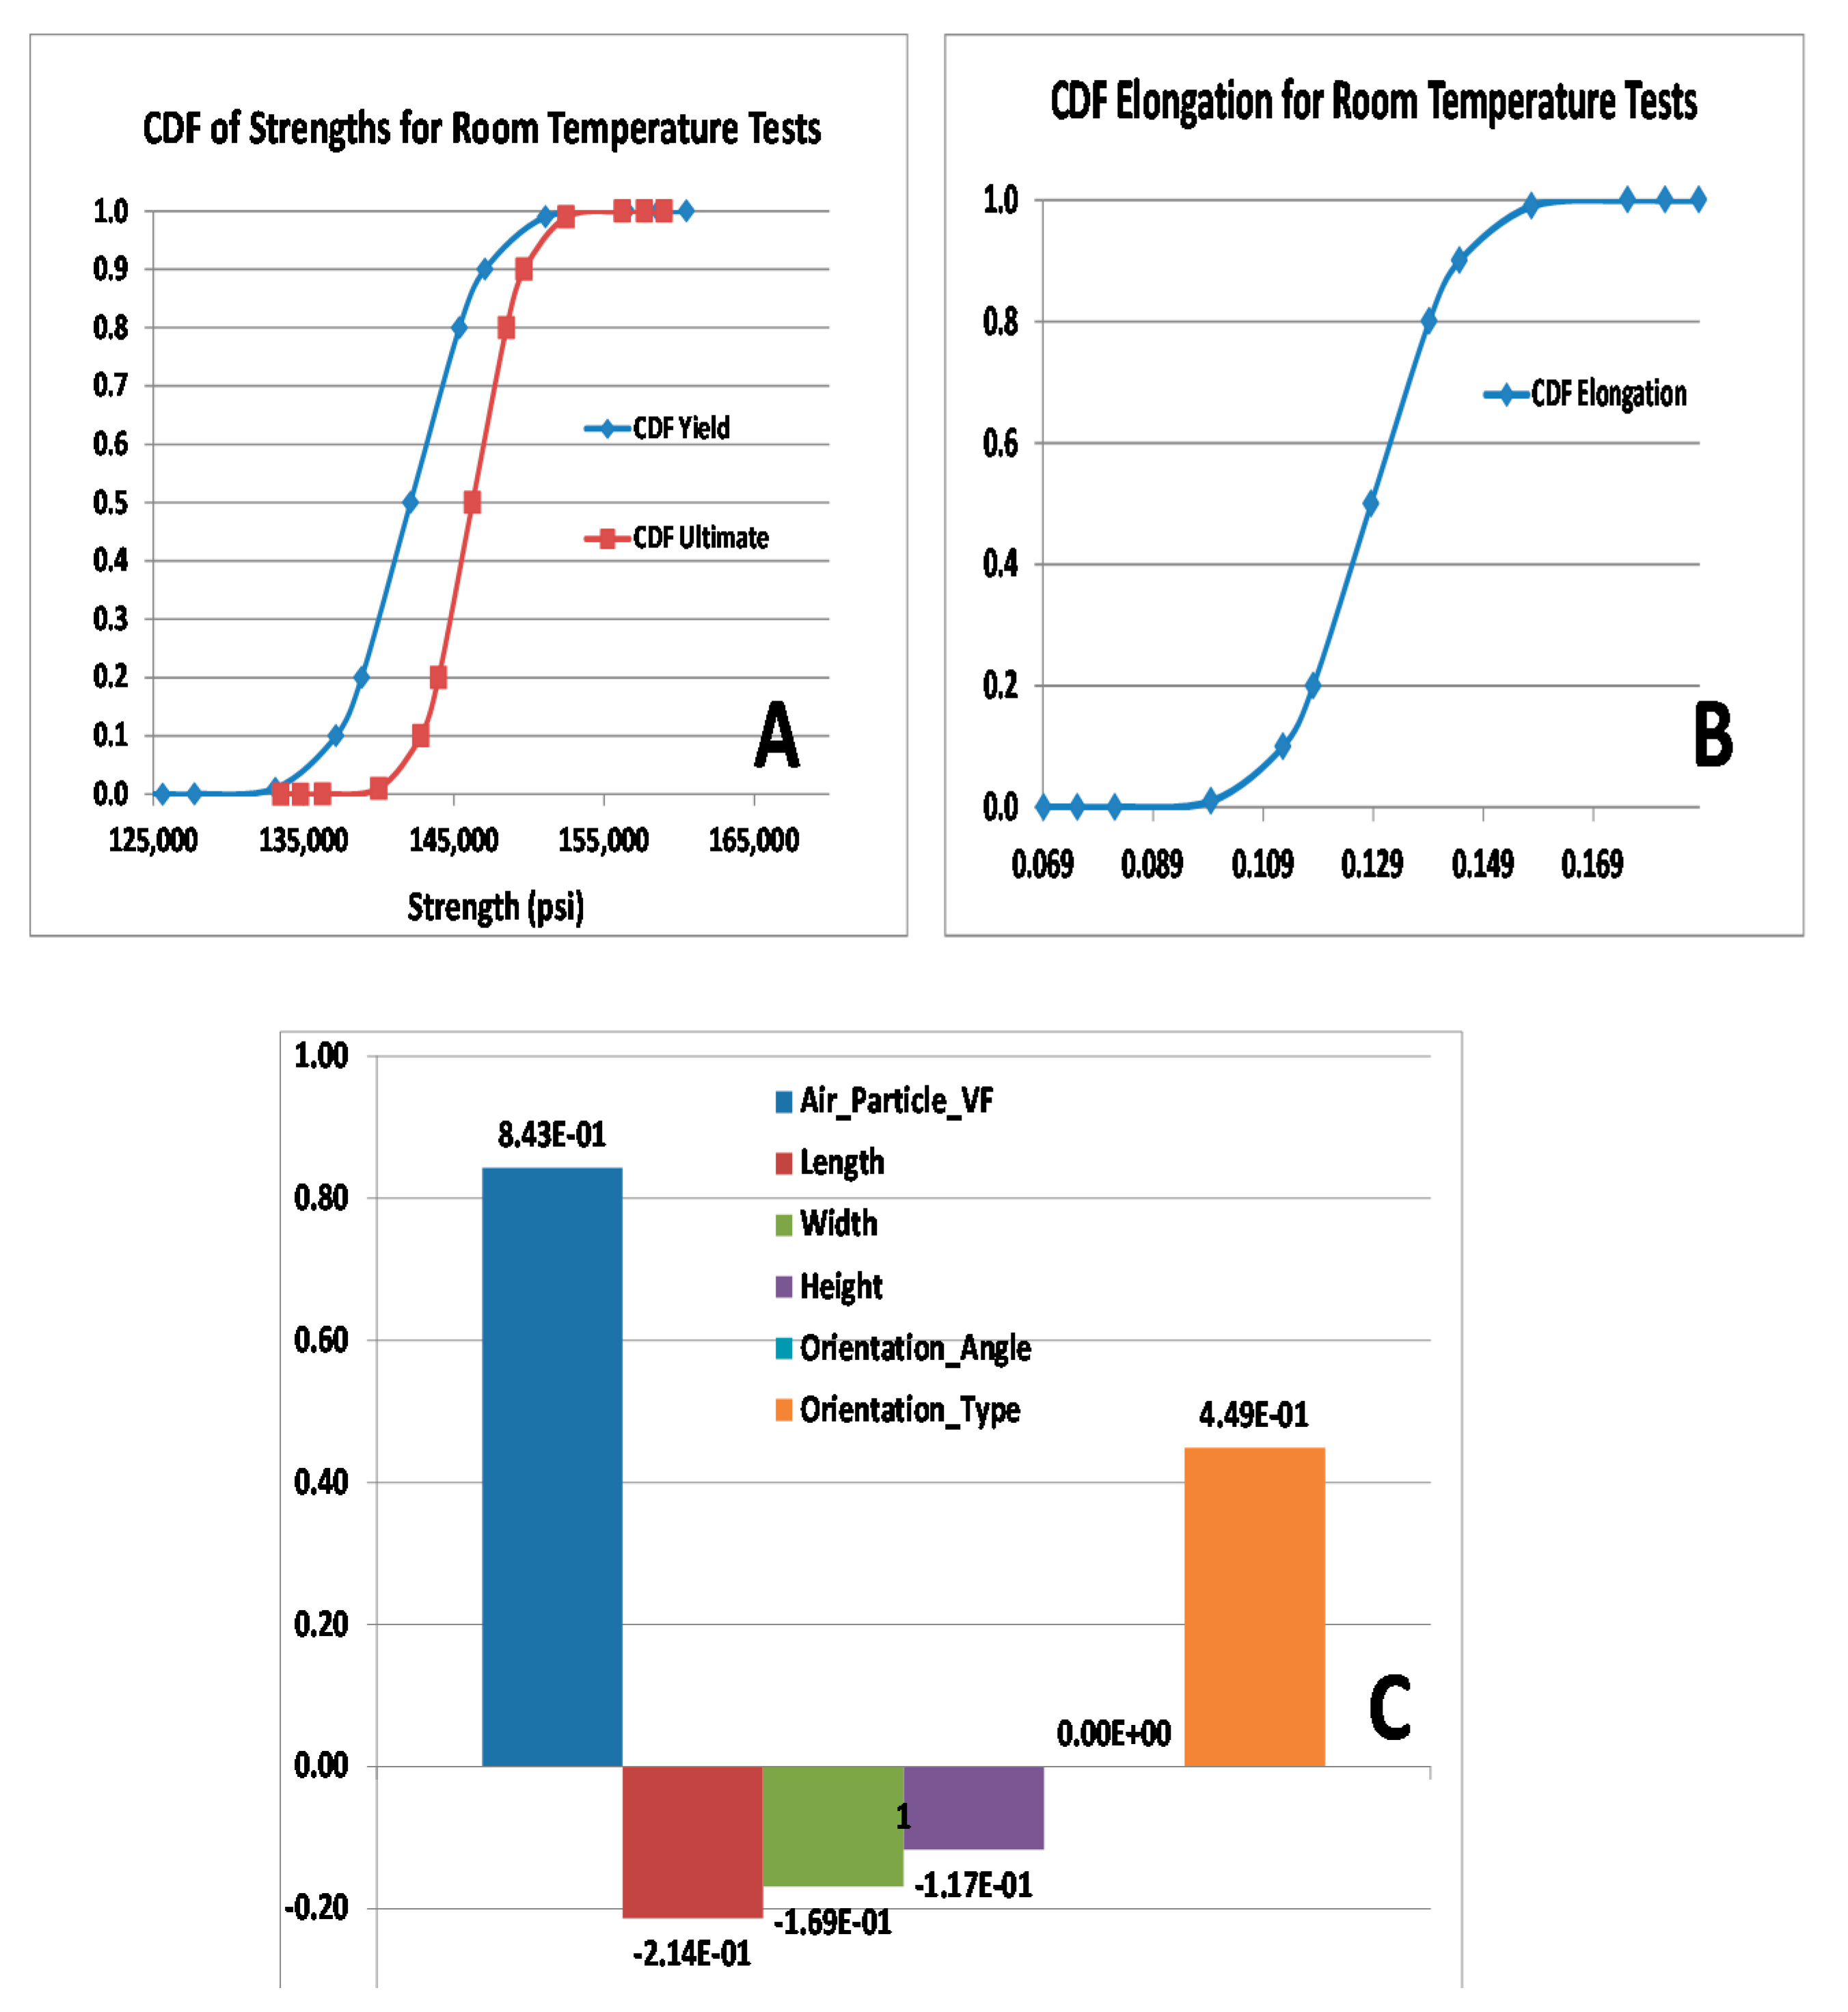
3.2.2. Scatter of Titanium Properties at Room (RT) and High Temperature (HT)
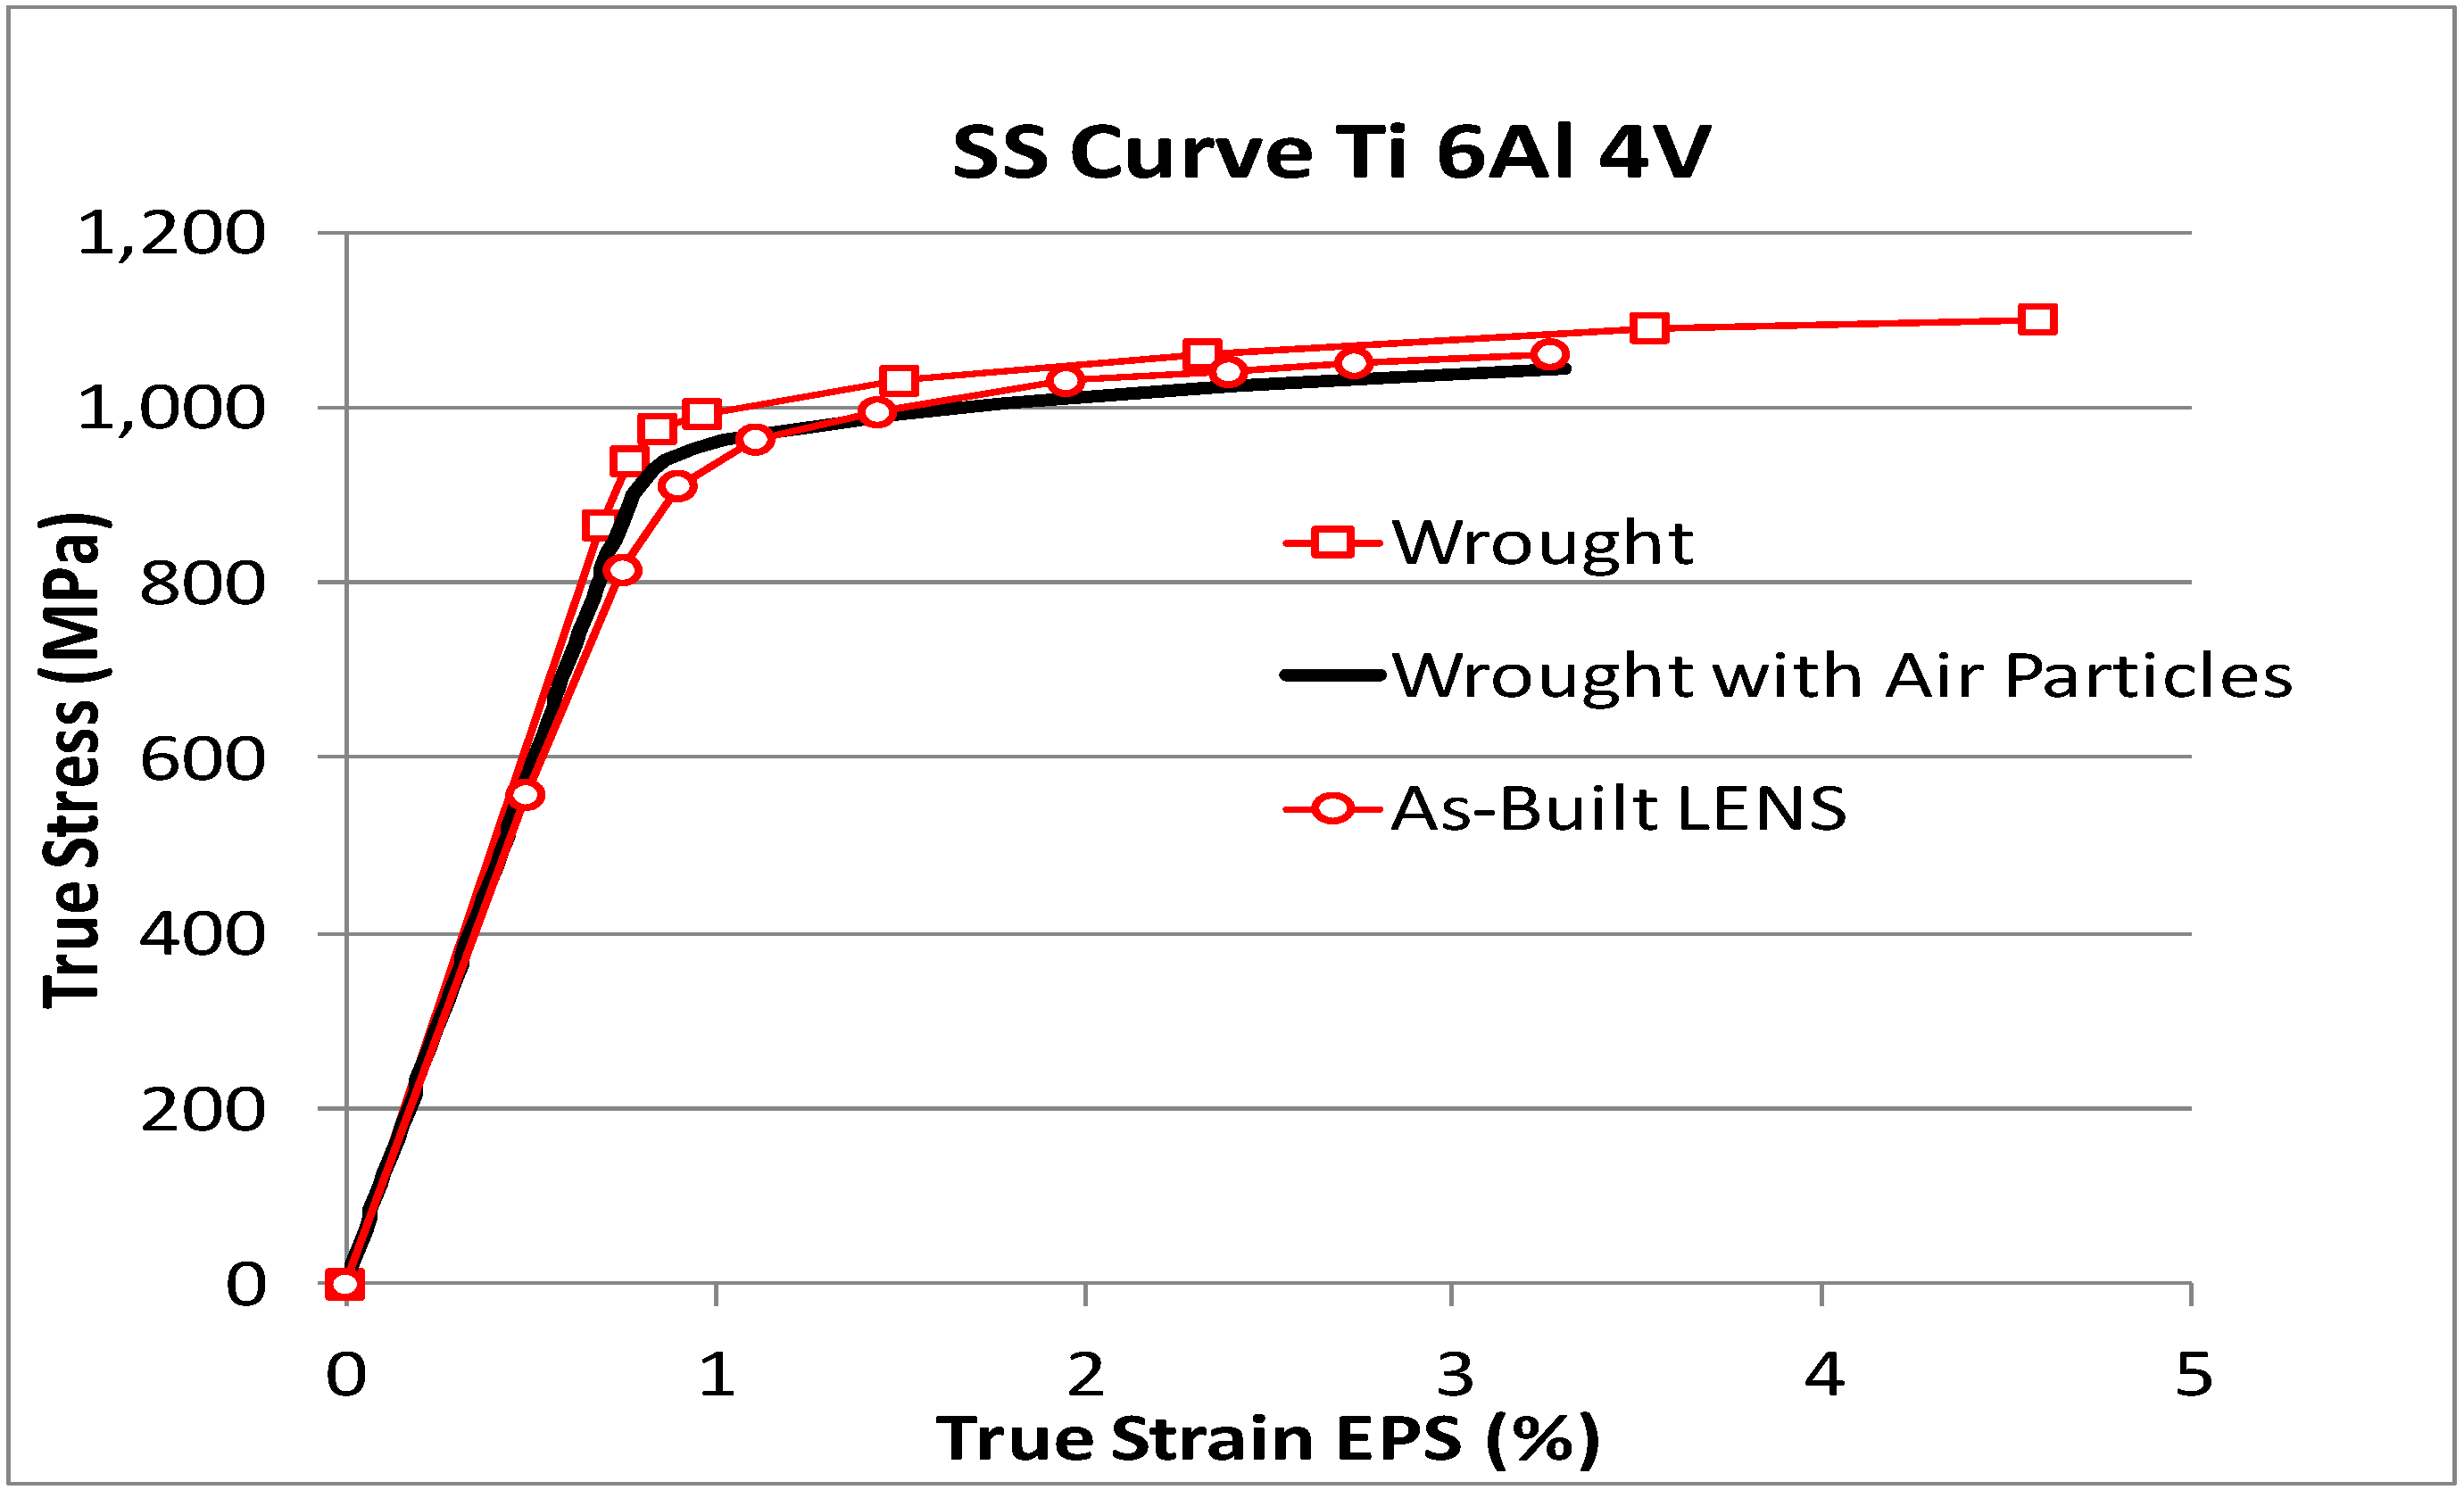
3.2.3. Material Modeling and the Integrated Computational Material Engineering (ICME)
3.2.4. Material Modeling—Source of Scatter and Uncertainties for EBM Process
4. Conclusions
Author Contributions
Funding
Acknowledgments
Conflicts of Interest
Nomenclature
| AM | Additive manufacturing |
| CDF | Cumulative Distribution Function |
| da/dn-K | crack growth rate/Cycle Vs. stress intensity |
| D&DT | Durability and Damage Tolerance |
| DED | Direct Energy Deposition |
| DMLS | Direct metal laser sintering |
| DOE | Design of Experiment |
| FTD | Fracture toughness Determination |
| FCG | Fatigue Crack Growth |
| HT | High temperature |
| ICME | Integrated Computational Materials Engineering |
| EBAM® | Electron Beam Additive Manufacturing |
| EBM | Electron Beam |
| LENS | Laser Engineering Net Shape |
| LMD-p | Laser Metal Deposition-powder |
| LMD-w | Laser Metal Deposition-wire |
| Probability Density Function | |
| PBF | Powder Bed Fusion |
| RS | Residual Stress |
| RT | Room Temperature |
| SLM | Selective Laser Melting |
| SLS | Selective Laser Sintering |
| S-N | Strength-Life |
References
- Audit of DoD’s. Use of Additive Manufacturing for Sustainment Parts; Report No. DODIG-2020-003, Project No. D2019-D000AT-0057.000; Office of Inspector General, US Department of Defense: Washington, DC, USA, 2019.
- Rice, R.C.; Goode, R.; Bakuckas, J.; Thompson, S. Development of MMPDS Handbook aircraft design allowables. In Proceedings of the 7th Joint DOD/FAA/NASA Conference on Aging Aircraft, New Orleans, LA, USA, 8–11 September 2003. [Google Scholar]
- Air Force Space Command. SMC Standard SMC-S-016 Test Requirements for Launch, Upper-stage and Space Vehicles; Air Force Space Command: El Segundo, CA, USA, 2014. [Google Scholar]
- Spears, T.G.; Gold, S.A. In-process sensing in selective laser melting (SLM) additive manufacturing. Integr. Mater. Manuf. Innov. 2016, 5, 16–40. [Google Scholar] [CrossRef] [Green Version]
- ASTM International. ASTM Committee F42 Standard Terminology for Additive Manufacturing Technologies; ASTM International: West Conshohocken, PA, USA, 2012. [Google Scholar]
- William, E.F. Metal additive manufacturing: A review. J. Mater. Eng. Perform. 2014, 23, 1917–1928. [Google Scholar] [CrossRef]
- Mani, M.; Feng, S.; Lane, B.; Donmez, A.; Moylan, S.; Fesperman, R. Measurement Science Needs for Real-time Control of Additive Manufacturing Powder Bed Fusion Processes; U.S. Department of Commerce: Washington, DC, USA, 2015. [CrossRef]
- Yadollahi, A.; Shamsaei, N.; Thompson, S.M.; Elwany, A.; Bian, L. Effects of building orientation and heat treatment on fatigue behavior of selective laser melted 17-4 PH stainless steel. Int. J. Fatigue 2017, 94, 218–235. [Google Scholar] [CrossRef]
- Godines, C.; DorMohammdi, S.; Frank Abdi, D.; Huang, I.; Roche, R. 3D print -material and process model and effect of defects on part performance. In Proceedings of the Science in the Age of Experience Simulia User Conference, Boston, MA, USA, 18–21 June 2018. [Google Scholar]
- Abdi, F.; Garg, M. Characterization of Nanocomposites Technology and Industrial Applications; CRC Press: Boca Raton, FL, USA, 2017; ISBN 978-1-315-36489-6. [Google Scholar]
- ASTM International. STP 1450 Probabilistic Aspect of Life Prediction; ASTM International: West Conshohocken, PA, USA, 2004. [Google Scholar]
- Nikbin, K.; Smith, D.J.; Webster, G. A prediction of creep crack growth from uniaxial creep data. Proc. R. Soc. A Math. Phys. Eng. Sci. 1984, 396, 183–197. [Google Scholar]
- Saxena, A. Creep and creep–fatigue crack growth. Int. J. Fract. 2015, 191, 31–51. [Google Scholar] [CrossRef] [Green Version]
- Abdi, F.; Miraj, R.; Tam, C.; Rios, I.R.; Harik, V. AM part qualification by icme analysis and real time NDE monitoring. Model Based Enterp. Summit (MBE 2020) 2020, 2020, 5–203. [Google Scholar]
- Abdi, F.; Tam, C.; Anderson, S.; Moazami, N.; Nikbin, K.; Godines, C.; Tandon, G.; Harik, V.; Miraj, R. Sensory real-time in-situ monitoring toolset for additive manufactured parts. SAMPE J. 2019. Available online: https://app.robly.com/archive?id=0084c0f99444b04fc70dfa722c734f37&v=true (accessed on 28 June 2020).
- Torries, B.; DorMohammadi, S.; Abdi, F.; Thompson, S.; Shamsaei, N. Topology optimization of an additively manufactured beam. In Proceedings of the Annual International Solid Freeform Fabrication Symposium (SFF Symp 2017), Austin, TX, USA, 7 August 2017. [Google Scholar]
- Abdi, F.; Clarkson, E.; Godines, C.; DorMohammadi, S.; de Fenza, A. A-B Basis Allowable Test Reduction Approach and Composite Generic Basis Strength Values; AIAA SciTech: Reston, VA, USA, 2016. [Google Scholar]
- Hitzler, L.; Hirsch, J.; Schanz, J.; Heine, B.; Merkel, M.; Hall, W.; Öchsner, A. Fracture toughness of selective laser melted AlSi10Mg. Proc. Inst. Mech. Eng. Part L J. Mater. Design Appl. 2019, 233, 615–621. [Google Scholar] [CrossRef]
- Greitemeier, D.; Holzinger, V.; Dalle Donne, C.; Eufinger, J.; Melz, T. Fatigue prediction of additive manufactured Ti-6Al-4V for aerospace: Effect of defects, surface roughness. In Proceedings of the 28th ICAF Symposium, Helsinki, Finland, 3–5 June 2015. [Google Scholar]

| Qualification Category | Description |
|---|---|
| 1-Micro defects | Micro voids/Density during thermal history, super melting sintering and solidification |
| 2-Macro defects | Macro porosity: Printing error around hole and boundary |
| 3-Surface roughness | Diffusional creep, Triaxial stress |
| 4-Intergranular cracks | Diffusional creep, Biaxial stress |
| 5-Scatter in material properties | Stress-strain relation (yield stress, ultimate/plastic strain) due to voids (micro/macro) and cracks |
| 6-Fracture control plan | Characterization of fracture properties, fatigue crack growth, stress intensity curve |
| 7-Warpage | Evaluation of support, Residual stress |
| 8-Net shape | Residual stress, Baseplate removal |
| 9-As-built performance | In-service loading |
| 10-Post heat treatment | Grain growth, lower strain; thermal analysis |
| Item | Parameter | Description | Controlled or Predefined |
|---|---|---|---|
| 1 | Average Power, P | Total Energy Output of Laser | Controlled |
| 2 | Scan Velocity, v | Velocity of laser across surface | Controlled |
| 3 | Scan Spacing, Ss | Distance between neighboring passes | Controlled |
| 4 | Scan Strategy | Pattern of laser scanning (spirals, zig-zag) | Controlled |
| 5 | Deposition System Parameters | Recoater velocity, pressure, type, dosing | Controlled |
| 6 | Layer Thickness, L | Height of single powder | Controlled |
| 7 | Powder bed temperature, Tp | Build temperature of powder bed | Controlled |
| 8 | Oxygen Level, %O2 | Likely most important environment parameter | Controlled |
| 9 | Gas Flow Velocity, vg | Influences convective cooling | Controlled |
| 10 | Ambient Temperature, Tinf | Affecting cooling, rehear and residual stress | Controlled |
| Parameters | Value | Range | Build |
|---|---|---|---|
| Max Strength | 4.22 KN | 0.2 kN | 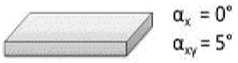 |
| Ultimate Displacement | 210 mm | 30 mm | |
| Max Strength | 3.72 kN | 0.5 kN |  |
| Ultimate Displacement | 145 mm | 55 mm | |
| Max Strength | 3.7 kN | 0.2 kN | 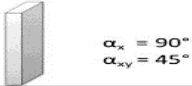 |
| Ultimate Displacement | 235 mm | 65 mm |
| Orinetation | KIC (MPa ) | Standard Deviation (MPa ) | Genoa Predictions (MPa ) | Print Orientation |
|---|---|---|---|---|
| XY | 59.06 | 1.43 | 59.06 | 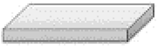 |
| XZ | 51.6 | 1.79 | 51.6 |  |
| YZ | 40.63 | 1.25 | 40.63 |  |
| Ti-6Al-4V | Cast | Wrought (Annealed) | EBM-As Deposited | EBM-HIP’d |
|---|---|---|---|---|
| UTS, ksi (MPa) | 145 (1000) | 135 (930) | 150 (1037) | 139 (957) |
| YS, ksi (MPa) | 130 (896) | 128 (895) | 137 (948) | 131 (905) |
| EI, % | 8 | 12 | 15 | 17 |
| RA, % | – | – | 44 | 57 |
| MOR # | Oxygen % | Density, g/cc | S/N | UTS, ksi | YS, ksi | EI, % | RA, % |
|---|---|---|---|---|---|---|---|
| 221 | 0.19 | 4.3818 | Z Coupon | 139 | 131 | 16 | 19 |
| X-Y Coupon | 136 | 128 | 16 | 35 | |||
| 222 | 0.19 | 4.3837 | Z Coupon | 141 | 133 | 21 | 46 |
| X-Y Coupon | 134 | 126 | 19 | 36 | |||
| 233 | 0.14 | 4.3918 | Coupon | 139 | 132 | 20 | 43 |
| X-Y Coupon | 139 | 131 | 20 | 49 | |||
| 234 | 0.15 | 4.3728 | Z Coupon | 143 | 132 | 18 | 50 |
| X-Y Coupon | 139 | 131 | 11 | 16 | |||
| 242 | 0.20 | 4.3674 | Z Coupon | 144 | 134 | 16 | 38 |
| X-Y Coupon | 142 | 131 | 16 | 34 | |||
| 249 | 0.13 | 4.4087 | Z Coupon | 148 | 138 | 16 | 38 |
| X-Y Coupon | 143 | 133 | 15 | 37 | |||
| Requiment | Max 0.2% | None | – | Min 130 | Min 119 | Min 5 | None |
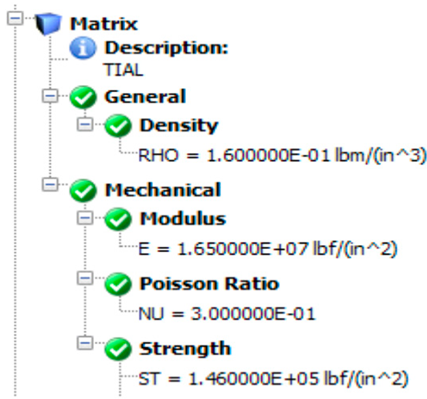 | 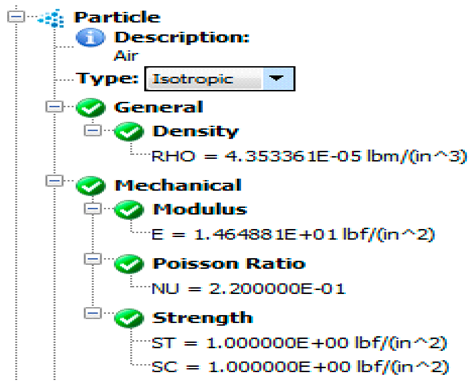 | 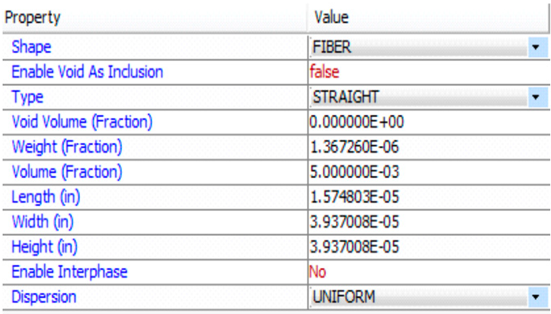 |
| (a) Ti6Al4V (Wrought) | (b) Inclusion Air | (c) Inclusion Air |
| RV Name | Mean Value | Standard Deviation | Distribution Type | COV |
|---|---|---|---|---|
| Air Particle VF | 5.00 × 10⁻³ | 2.50 × 10⁻⁴ | Normal | 0.05 |
| Length | 1.57 × 10⁻⁵ | 7.85 × 10⁻⁷ | Normal | 0.05 |
| Width | 3.94 × 10⁻⁵ | 1.97 × 10⁻⁶ | Normal | 0.05 |
| Height | 3.94 × 10⁻⁵ | 1.97 × 10⁻⁶ | Normal | 0.05 |
| Orientation Angle | 0 | 0 | Normal | 0.05 |
| Orientation Type | 3.00 | 1.50 × 10⁻¹ | Normal | 0.05 |
| RT | YS, Ksi | MCQ | %Diff | UTS, Ksi | MCQ | %Diff | EI, % | MCQ | %Diff |
|---|---|---|---|---|---|---|---|---|---|
| Mean | 141.1 | 142.1 | –0.7 | 146.1 | 146.2 | –0.1 | 13.9 | 12.6 | 9.4 |
| SD | 3.96 | 3.86 | 2.4 | 2.81 | 2.68 | 4.5 | 1.22 | 1.25 | –2.6 |
| COV (%) | 2.81 | 2.72 | 3.1 | 1.92 | 1.83 | 4.6 | 8.78 | 9.76 | –11.1 |
| HT | YS, Ksi | MCQ | %Diff | UTS, Ksi | MCQ | %Diff | EI, % | MCQ | %Diff |
| Mean | 78.1 | 75.3 | 3.5 | 96.0 | 87.7 | 8.6 | 19.1 | 18.2 | 4.9 |
| SD | 2.83 | 2.79 | 1.4 | 2.46 | 2.55 | –3.8 | 0.84 | 0.91 | –7.4 |
| COV (%) | 3.63 | 3.71 | –2.2 | 2.56 | 2.91 | –13.6 | 4.42 | 4.98 | –12.9 |
© 2020 by the authors. Licensee MDPI, Basel, Switzerland. This article is an open access article distributed under the terms and conditions of the Creative Commons Attribution (CC BY) license (http://creativecommons.org/licenses/by/4.0/).
Share and Cite
Abdi, F.; Yavari, P.; Harik, V.; Godines, C. Material Allowable Generation and AM Process Parameters Effect on Porosity. Coatings 2020, 10, 625. https://doi.org/10.3390/coatings10070625
Abdi F, Yavari P, Harik V, Godines C. Material Allowable Generation and AM Process Parameters Effect on Porosity. Coatings. 2020; 10(7):625. https://doi.org/10.3390/coatings10070625
Chicago/Turabian StyleAbdi, Frank, Parviz Yavari, Vasyl Harik, and Cody Godines. 2020. "Material Allowable Generation and AM Process Parameters Effect on Porosity" Coatings 10, no. 7: 625. https://doi.org/10.3390/coatings10070625
APA StyleAbdi, F., Yavari, P., Harik, V., & Godines, C. (2020). Material Allowable Generation and AM Process Parameters Effect on Porosity. Coatings, 10(7), 625. https://doi.org/10.3390/coatings10070625