Article

Effect of SiC/Fly Ash Reinforcement on Surface Properties of Aluminum 7075 Hybrid Composites

by
Namdev Ashok Patil
1,
Srinivasa Rao Pedapati
1,*,
Othman Bin Mamat
1 and
Abdul Munir Hidayat Syah Lubis
2
1
Department of Mechanical Engineering, Universiti Teknologi PETRONAS, Bandar Seri Iskandar, Perak 32610, Malaysia
2
Department of Mechanical Engineering Technology, Universiti Teknikal Malaysia Melaka, Durian Tunggal, Melaka 76100, Malaysia
*
Author to whom correspondence should be addressed.
Coatings 2020, 10(6), 541; https://doi.org/10.3390/coatings10060541
Submission received: 8 March 2020 / Revised: 27 May 2020 / Accepted: 1 June 2020 / Published: 2 June 2020

Abstract

:
Friction stir processing (FSP) has emerged as a valuable technique in the surface metal matrix composite fabrication field. In this process, solid-state processing mostly avoids the formation of detrimental phases inside composites. Despite having a high specific strength, further extensive Al alloy applications are limited due to their poor surface properties. A hybrid reinforcement approach can be used to improve surface properties. In this study, industrial waste fly ash material is mixed with hard SiC ceramic particles. The main focus of this research is to improve wear resistance under dry sliding conditions and microhardness of aluminum 7075-T651 by dispersion of silicon carbide-fly ash (SiC/fly ash) powder in a base alloy by FSP. The parameters used for this investigation are: tool rotation rpm (500, 1000 and 1500), the tool traverse mm/min (20, 30 and 40), the reinforcement’s hybrid ratio HR (60:40, 75:25 and 90:10) and the volume percentage vol.% (4%, 8% and 12%). The influence of these parameters on the resultant composite’s microstructure, dry sliding wear rate and micro-hardness was studied. By using response surface methodology (RSM), desirable ranges of process parameters for lower wear rate and higher microhardness were obtained. The interaction effect of SiC/fly ash volume percentage and hybrid ratio had the most influential effect on the wear rates, as well as microhardness of composites. Moreover, microhardness increased with an increase in the volume percentage of SiC/fly ash powders towards high SiC content in hybrid ratio. Interestingly, among stirring parameters, tool traverse speed was found to be more influential than tool rotational speed. The minimum wear rate was observed for the Run 20 sample (w: 1000 rpm, v: 40 mm/min, HR: 75:25, vol.%: 8). A maximum microhardness of 241.20 HV was achieved for Run 15 (w: 500 rpm, v: 40 mm/min, HR: 90:10, vol.%: 12) sample. Mainly, reinforcement distribution—in accordance with the stirring action generated by the tool—had a major role in controlling the surface properties of the resultant composites.

1. Introduction

Ceramic materials possess high hardness, high temperature stability and mechanical stability as important inherent properties. Hence, these materials have been successfully utilized as reinforcements in structural applications in the automobile, aerospace, etc. industries, in the form of metal matrix composites (MMCs). However, due to the higher density of ceramic reinforcements, the overall density of MMCs becomes higher than the base alloys. In addition, ceramic reinforcements are more expensive, due to the required synthesis processes. These issues can be addressed with a multiple reinforcement approach into the metal base alloys that produces resultant hybrid composites [1,2]. This approach is commonly known as the hybrid reinforcement approach. In this approach, the primary ceramic powder—along with secondary materials like fly ash, rice husk ash, red mud, etc.—can be added as reinforcements into the base alloys. Nowadays, the hybrid reinforcement approach of utilizing industrial wastes is gaining more importance. The advantages of utilizing industrial waste like fly ash are mainly related to a decrease in overall densities of the hybrid composites and lower cost, as these waste materials are readily available in ample amounts [3]. Fly ash as an industrial waste material contains inherent silica and alumina content. Power generation by utilizing coal as fuel generates a huge amount of fly ash as a waste by-product [4]. The accumulation and its disposal leads to contamination of water and soil. These environmental issues demand evaluation on the possibilities of utilizing fly ash as a reinforcing material in various applications that may help to avoid pollution-related problems [5]. The density of fly ash material is less than commonly used ceramic reinforcement materials like silicon carbide, aluminum oxide, etc. Hence, because of its rich silica content and comparatively lower density than the ceramic powders, fly ash material has a high potential as a reinforcement material for producing metal matrix composites for various applications [6].
Many researchers have studied the potentials and disadvantages of using industrial waste materials as reinforcements. Rao et al. have observed that the increasing the volume of fly ash as reinforcing particles in the aluminum matrix results in a reduction in overall density, improvement in hardness and compressive strength of aluminum matrix composites [7]. In another study, Rao et al. observed enhancement of mechanical properties for fly ash-reinforced aluminum matrix composites over base alloys [8]. In their investigations with fly ash reinforced aluminum composites, Dinaharan et al. revealed that wear resistance in dry sliding conditions improved over base alloys [9].
Reddy and Srinivas et al. found that mechanical and wear properties improved using a hybrid reinforcement approach for Al6082-SiC/fly ash composites produced using stir casting methods [10]. Prabhakar et al. report enhanced microhardness of the aluminum alloy by reinforcing the fly ash particles through friction stir processing [11]. In other studies, the hardness of 5A06Al and Al 1050 alloys were found to be improved significantly by encapsulating SiC particles into the base alloys using FSP [12,13]. Miranda et al. mentions that the consolidated mechanically mixed layers of ceramic reinforcements via FSP were responsible for the improvement in hardness of the resultant AA5083–(SiC or Al2O3) composites [14]. Rana and Badheka observed that the wear resistance of 7075-T651 aluminum alloy was improved by addition of B4C particles through friction stir process [15].
According to Dursun and Soutis [16], among Al alloys, AA7075 has been utilized for many structural applications in the automotive and aerospace industries because of its high specific strength. Poor surface properties restrict its utilization in much wider applications [17]. Sharma et al. have emphasized one FSP technique as an efficient approach to develop hybrid surface metal matrix composites for enhancement in tribological, as well as mechanical properties of metal alloys [18]. Recently, hybrid reinforcement approaches in which industrial, agricultural waste materials are utilized along with ceramic material have gained popularity among researchers. However, research attempts in which optimization of both FSP machine and reinforcement strategy are investigated together are lacking. Attempts to incorporate hard SiC nanoparticles and fly ash to strengthen AA7075 as a base alloy utilizing FSP have not yet been reported in order to improve its surface properties. Therefore, in this study, systematic efforts to enhance tribological surface properties of aluminum 7075 alloys by dispersing SiC and fly ash particles through stir processing are carried out. The optimization of tool travel and rotation speed, SiC/fly ash reinforcement’s hybrid ratio and volume percentage is carried out through planned experiments for maximization of dry sliding wear resistance and microhardness of the resultant materials.

2. Experimental Methodology

2.1. Materials

The 7075-T651 aluminum base alloy samples were cut with the measurements of (150 mm × 110 mm × 6.35 mm). The heat-treated aluminum 7075-T651 alloy with composition (Al: 87.1–91.4%, Zn: 5.1–6.1%, Mg: 2.1–2.9%, Cu: 1.2–2%, etc.) was used in this research study. The industrial waste fly ash (FA) with a particles size range of 1–10 μm and the SiC ceramic powder with a particle size range of 200 nm–2 μm were utilized as reinforcements.
The SiC/fly ash reinforcement particles were blended together using a tubular mixture to produce their well-mixed ratios. For each hybrid reinforcement level, the reinforcements were operated with 5 h mixing in the tubular mixer. The color of the hybrid reinforcing blends was different from that of the initial SiC and fly ash powders.

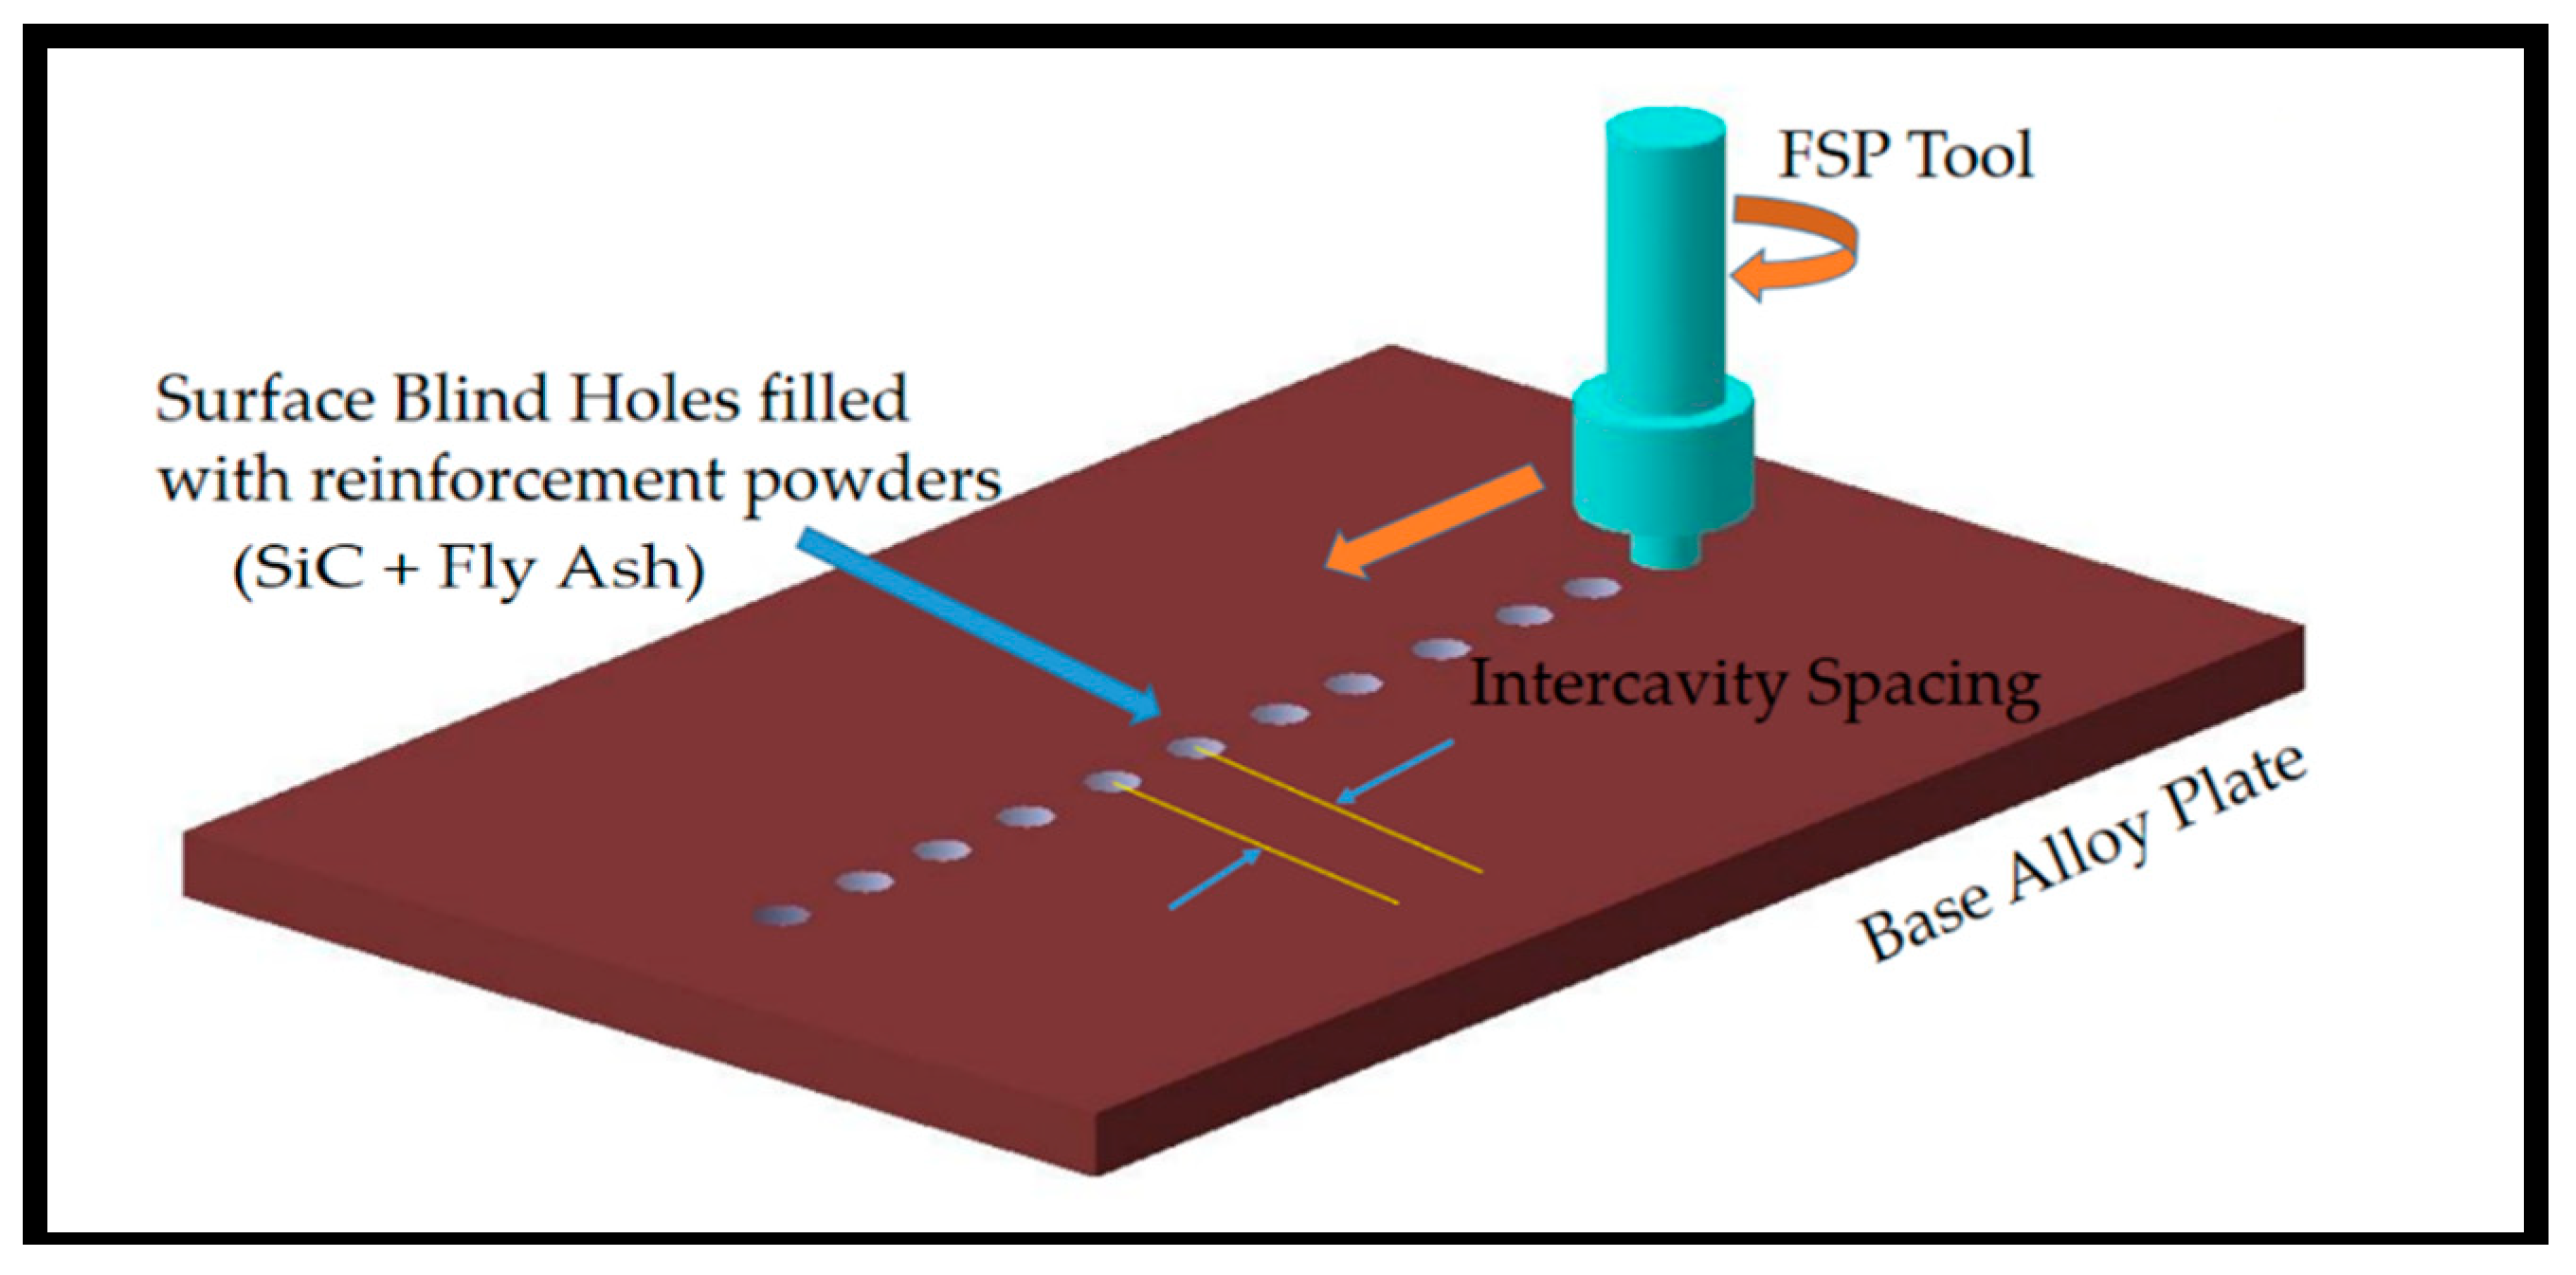
2.2. Deposition Method and Processing

The method of surface blind holes was utilized to pre-place these reinforcement’s powder into the aluminum alloy plates before processing. The graphical layout of the deposition process is shown in Figure 1. The holes with a radius of 1 mm and a depth of 4 mm were made on the aluminum alloy plates using vertical turret milling machine. The inter-cavity spacing kept was (2, 4 and 6 mm) for regulating the volume proportions of SiC/fly ash inside the base aluminum plates.
The inter-cavity spacing was maintained less than diameter of FSP tool pin for ensuring the consistent distribution of SiC/fly ash particles and continuity of the composites. Initially, the reinforcing mixtures were added to the surface cavities via sufficient compaction. Following proper compaction, capping passes were performed using the pinless flat tool. The capped pass fully sealed the surface cavities and locked the reinforcing particles within. It means no escape of reinforcement particles while performing the main FSP operation. Upon completion of the capping passes, a single FSP pass for each sample was carried out using the CNC FSW automated machine (Beijing FSW Technology Co., Ltd., Beijing, China). The tool profile of FSP tool utilized was straight-cylindrical with pin length 4.5 mm and pin diameter of 6 mm. Following the preliminary studies, the limits of process variables were determined, and experiments were planned using the response surface methodology (RSM) with the central composite design (CCD) approach in the Design-Expert software (10.0.4.0). The parameters and their levels used in this experimentation are given in Table 1. The parameter reinforcement hybrid ratio (HR) in the Table 1 denotes the ratio of SiC with fly ash powder.

2.3. Wear and Microhardness Tests

The dry sliding wear tests as per the ASTM G-99 standards [19] were performed for all composite samples. The procedure for the wear and microhardness tests was carried out in line with previous study [20] and with details given below. A wire EDM machine (Mitsubishi, Tokyo, Japan) was utilized to cut the wear samples in sizes (L: 10 mm, W: 6 mm, T: 6 mm) from composites processed zones. The pin-on disc system uses such samples as pins. For these experiments, disks of mild steel were used. Tribology Trainer TM-260, developed by Gunt Humburg (Barsbuttel, Germany), is the pin-on-disc system used in these tests. At a speed of 150 rpm and loads of 20 N, each sample can run for 10 minutes. The wear loss was calculated in reactions to each 27 samples. The loss of wear is measured as a difference in weight before and after the test.
The 20 mm square cross-sectional samples were cut using wire cut electro-discharge machine. The specimens have been assembled and polished with silicon carbide paper of 600, 800 and 1200 through grain. For every change in silicon carbide paper, the sample was rotated to 90°. The diamond slurry with 3 and 6 μm were used to further polish the microstructure samples. For etching with immersion periods of 10 s, Keller’s reagent was used and subsequently washed and dried. The Field-emission electron microscopy (FESEM, Phenom Pro-X, Eindhowen, The Netherlands) has been used to track dispersal and interface microscopic images of the base alloy with reinforcements within SZ. For further testing and study of the presence and dispersion of the reinforcement within the stir field, energy dispersive X-rays (EDX, Phenom Pro-X) and FESEM mapping facility have been used.
Before Vickers micro-hardness (Lecon LM-247AT, St. Joseph, MI, USA) tests, the flash that was developed in the FSP was extracted by diamond files to level specimen surface. The specimens were tested at 1000 gf of load with 15 s of dwell time as parameters. Five measurements were conducted for each composite sample in the stir region (SZ). For further analysis, the average value of microhardness obtained for each composite sample is used.

3. Results and Discussion
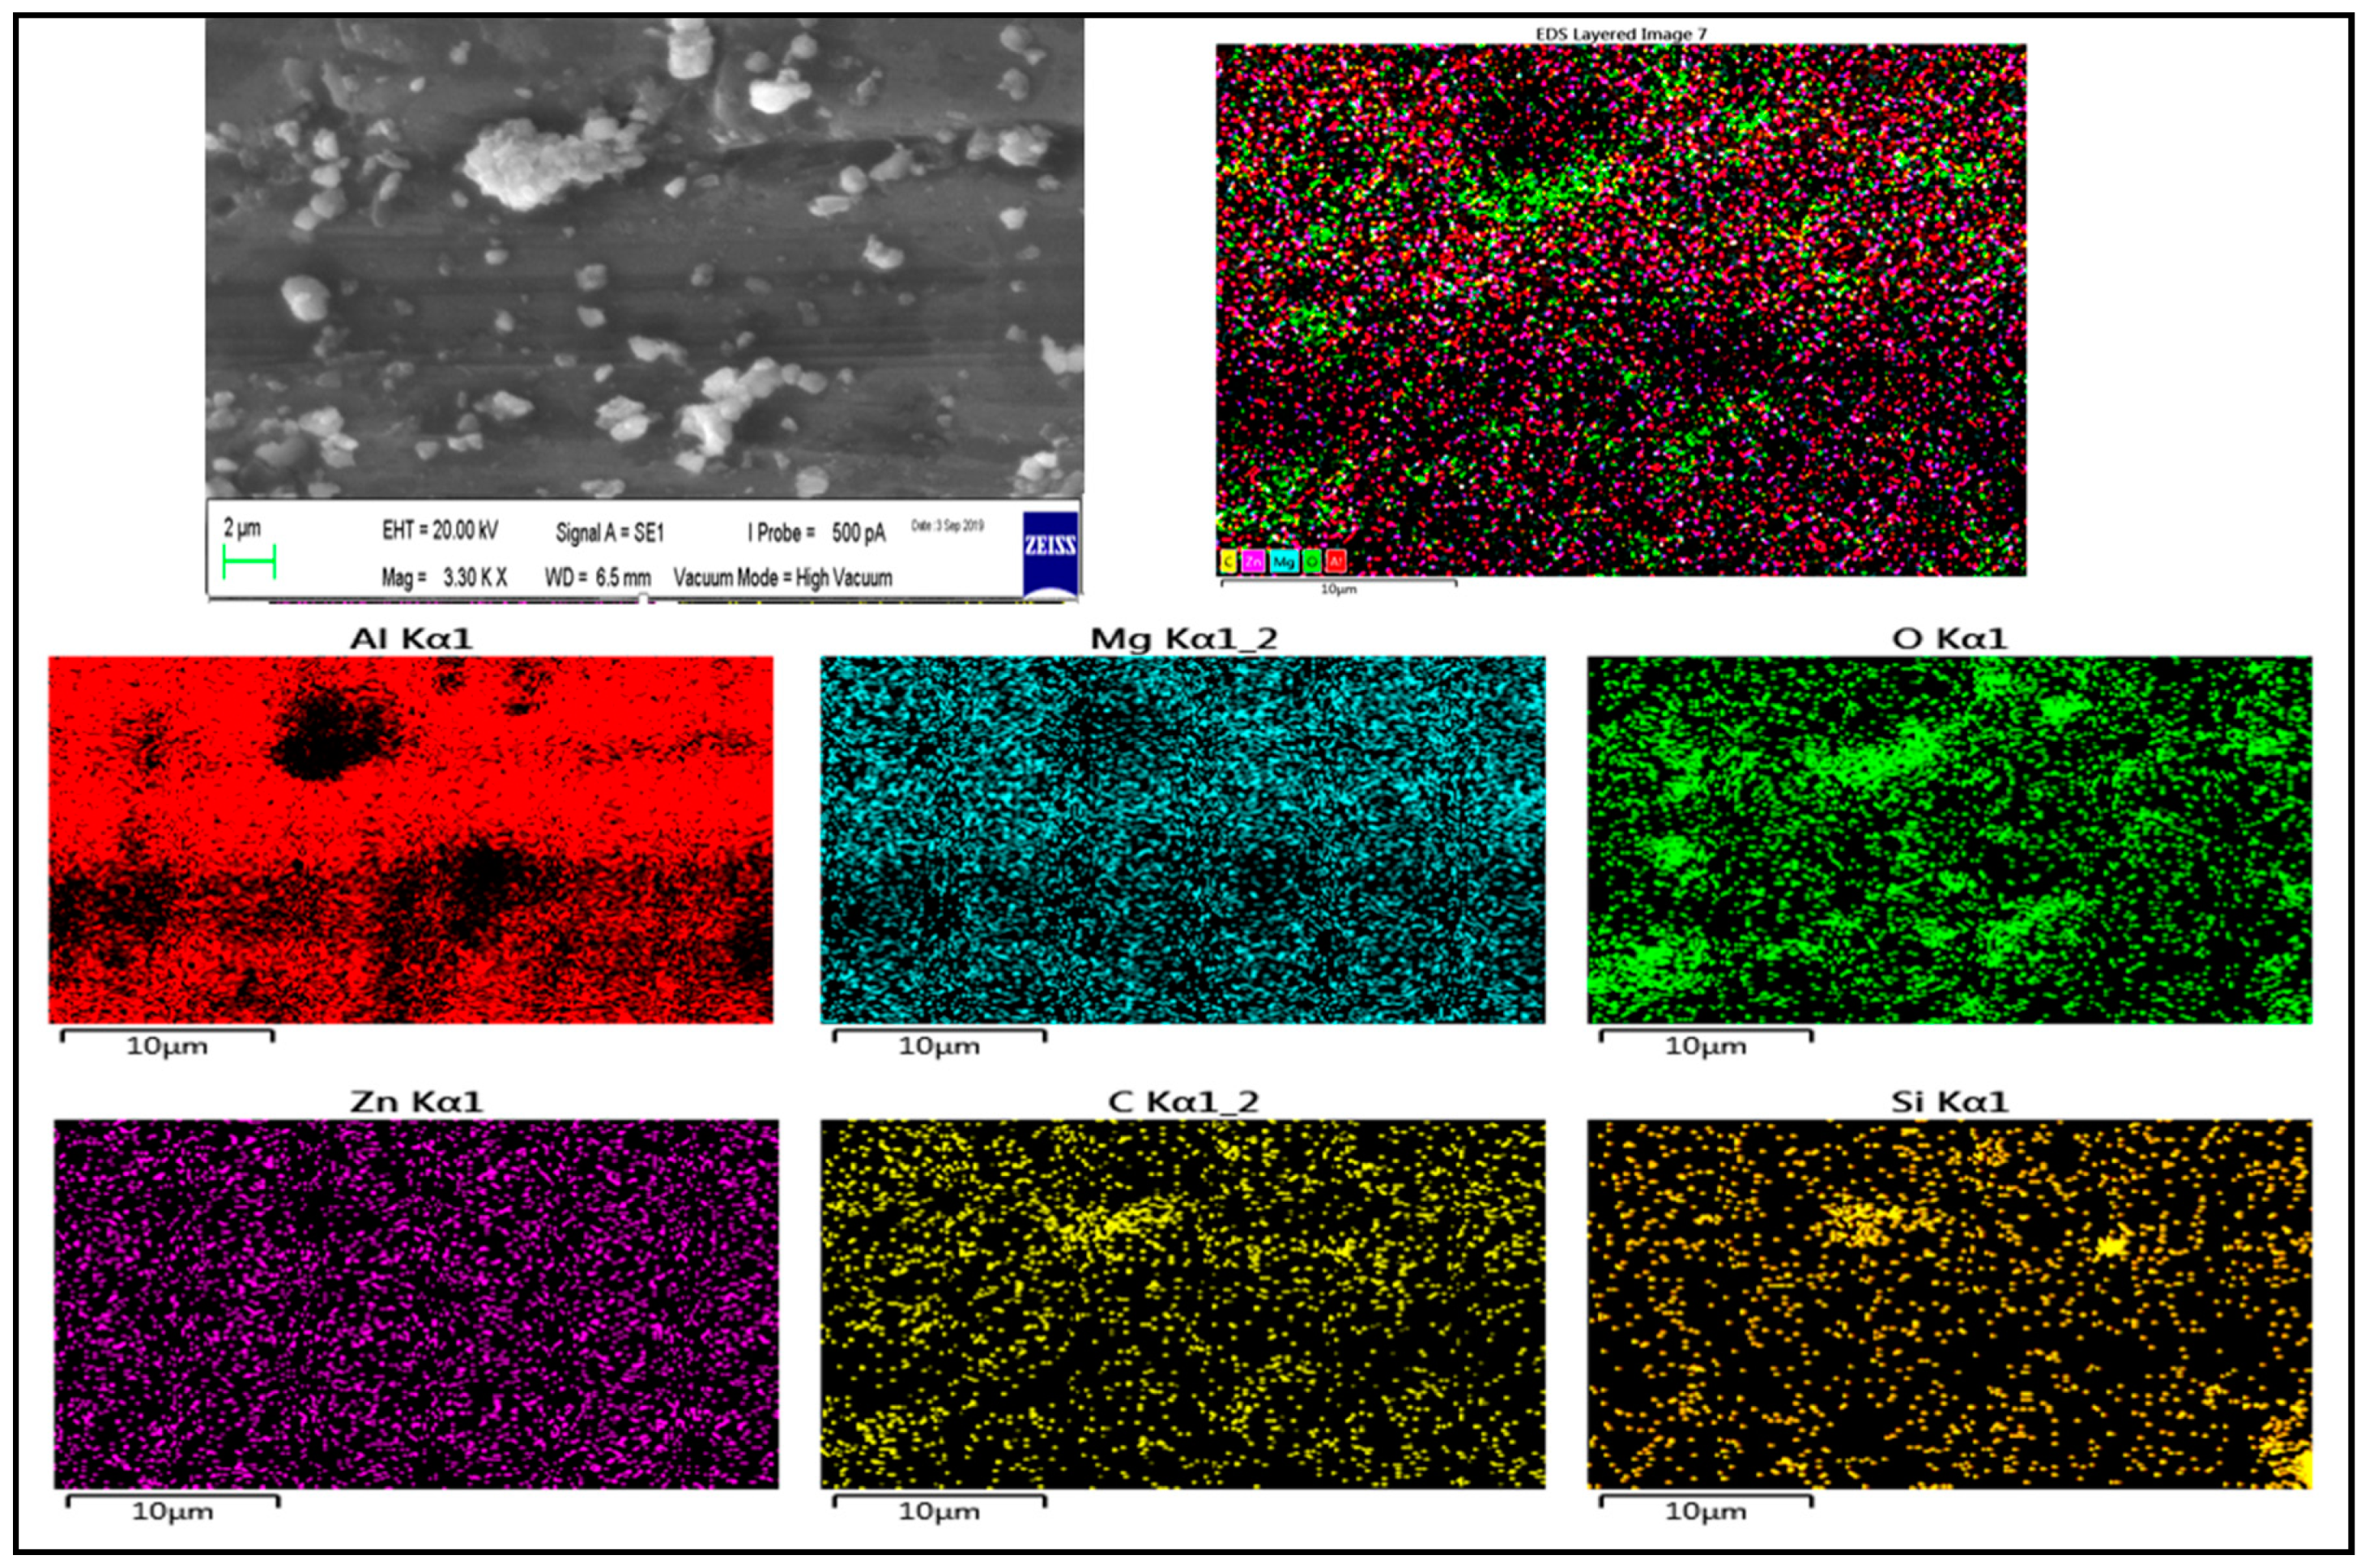
3.1. Microstructure

Aluminum (7075-SiC/fly ash) surface composites were produced effectively using FSP method. In microstructural characterization, the Al 7075-SiC/fly ash surface composites with the minimum and maximum wear rate were chosen for investigations. The lowest wear rate (mg/m) was observed for Run 20 with fabrication parameters as-(w: 1000 rpm, v: 40 mm/min, HR: 75:25 and vol.%: 8). On the other side, the Run 9 parameters surface composite fabricated with parameters (w: 500 rpm, v: 20 mm/min, HR: 60:40 and vol.%: 12) showed maximum wear rate among all 27 samples.
The SiC and fly ash particle distribution inside the Al7075 base alloy matrix is shown in Figure 2, Figure 3 and Figure 4, through the FESEM and SEM micrographs. The presence of SiC/fly ash particles in the Run 20 surface composite was confirmed through energy-dispersive x-ray and mapping through scanning electron microscope as shown in Figure 5 and Figure 6. Fly ash mainly consists of silica (SiO2) and other oxides like mullite, hematite along with some carbonaceous content [10]. The elements like C-carbon, O-oxygen and Si-silicon—along with Al-aluminum—in both EDX spectrum and mapping confirm the presence of SiC and fly ash inside the matrix as shown in Figure 5 and Figure 6. Generally in FSP ex-situ fabrication of composites, interfacial reaction products are not generated due to processing under the melting point temperatures of the respective base metal alloys. The FESEM micrographs in Figure 2 were taken in the processed zone, where the SiC/FA particles have distributed well inside a matrix. In the stir zone of the Runs 9 and 20 surface composite, the SiC and fly ash particles were fragmented and dispersed since the stirring action generated by the FSP tool found dominant to have good processed material movement. The intense plastic strain produced by the tool movement assists in changing the size and shape of the reinforcement’s prior dispersion inside the matrix [9].
In Figure 3a denotes the stir zone cross-section of Run 9 surface composite. From this image, the agglomeration of SiC/fly ash reinforcement particles has been observed less in the advancing side (AS), middle region and more dominantly in the retreating side (RS) zone. In Figure 3b,c, the agglomeration of reinforcements in the center region was observed through SEM imaging. The stirring action applied by the FSP tool has to perform a very important role in the dispersion of reinforcement particles inside the matrix. The FSP tool movement parameters have direct control over the intensity of plasticization [21]. Kumar et al. have mentioned that the temperature obtained in the FSP process wasn’t higher than that of melting point temperature of the base alloy, rather it has to be around 0.7–0.8 T of the base alloy [22]. From the agglomeration patterns of Run 9, it was noted that the plasticized material movement under the shoulder until half of the pin length was high enough to disperse the reinforcements, so the agglomeration was not observed dominantly in the upper half portion. On the other side, the intensity of stirring action was unable to overcome the base alloy flow stresses in the middle and lower regions of the stir zone intensively. Thus, the reinforcements were agglomerated in high proportions and were observed to be detrimental in the functionality of this composite’s for wear behavior.
The volume percentage of reinforcements was 12% for the Run 9 composite, and this high amount of powder was not been dispersed uniformly inside the base alloy due to the inability of stirring action generated by the tool. The SiC/fly ash reinforcement particles clustered and grain boundaries separating these regions of agglomerated reinforcements were observed in the very dense reinforcement accumulation areas of Run 9 surface composite sample. The segregation of reinforcement particles along grain boundaries was observed in Figure 3c. The movement of reinforcement particles because of the density difference was not available in FSP since processing was below the melting temperature of the base alloy. The reinforcement movement happens only by the intense plasticization to be generated by the FSP tool.
In the case of Run 20 Al7075-SiC/fly ash surface composite, the uniform dispersion of reinforcements was confirmed through SEM imaging as shown in Figure 4. The particles agglomeration was not observed in the processed zones as shown in Figure 4a. The more magnified images denotes the distribution of SiC/fly ash particles inside the matrix as shown in Figure 4b,c. The dispersed SiC/fly ash particles were denoted by yellow color arrows as shown in Figure 4b,c. The volume percentage of reinforcement used was 4%, thus the stirring action by FSP tool was good enough to distribute the SiC/fly ash particles uniformly inside the base alloy matrix. Therefore, the agglomerated regions were not observed in the stir zones. The combination of tool rotational and traverse speed found well enough to produce ample opportunities for particles dispersion inside the processed region with intense stirring action. During friction stir action the plasticized material was been continuously deposited from the advancing side to retreating side. The well dispersed reinforcement’s interlocking inside the base alloy resulted in good interfacial bonding and activated important strengthening mechanisms. The segregation of reinforcement particles along the grain boundaries has not been observed in the case of Run 20 surface composite.
During stir processing, the aluminum matrix undergoes dynamic recrystallization and results in fine grain structure. Mishra et al. found that the heating and subsequent dynamic recrystallization occur stepwise such that the continuously extended recovered-dislocations have found to be rearranged [23]. Dinaharan et al. observed that for Al alloys with high stacking-energy continuously undergoes dynamic recrystallization whereas the reinforcement particles hinder grain boundary movements. Thus, the grain growth was restricted by the pinning effect of the reinforcement particles [9]. Thus, in case of Run 20, the equiaxed fine-grain structure was obtained by homogenous dispersion of SiC/fly ash particles. For Run 20, the rotational speed of the tool was lower than the Run 9 composite processing but due to the higher volume percentage, the agglomeration problem occurred in the Run 9 composite. Thus, high volume percentage of reinforcement inside the base alloy had a significant effect on the dispersion of the particles inside the matrix. Latter this was confirmed through ranking of parameters as per their f-values in the models. Both SiC and fly ash particles were fragmented, and their morphologies and particle sizes were found to be changed inside the hybrid surface composites.

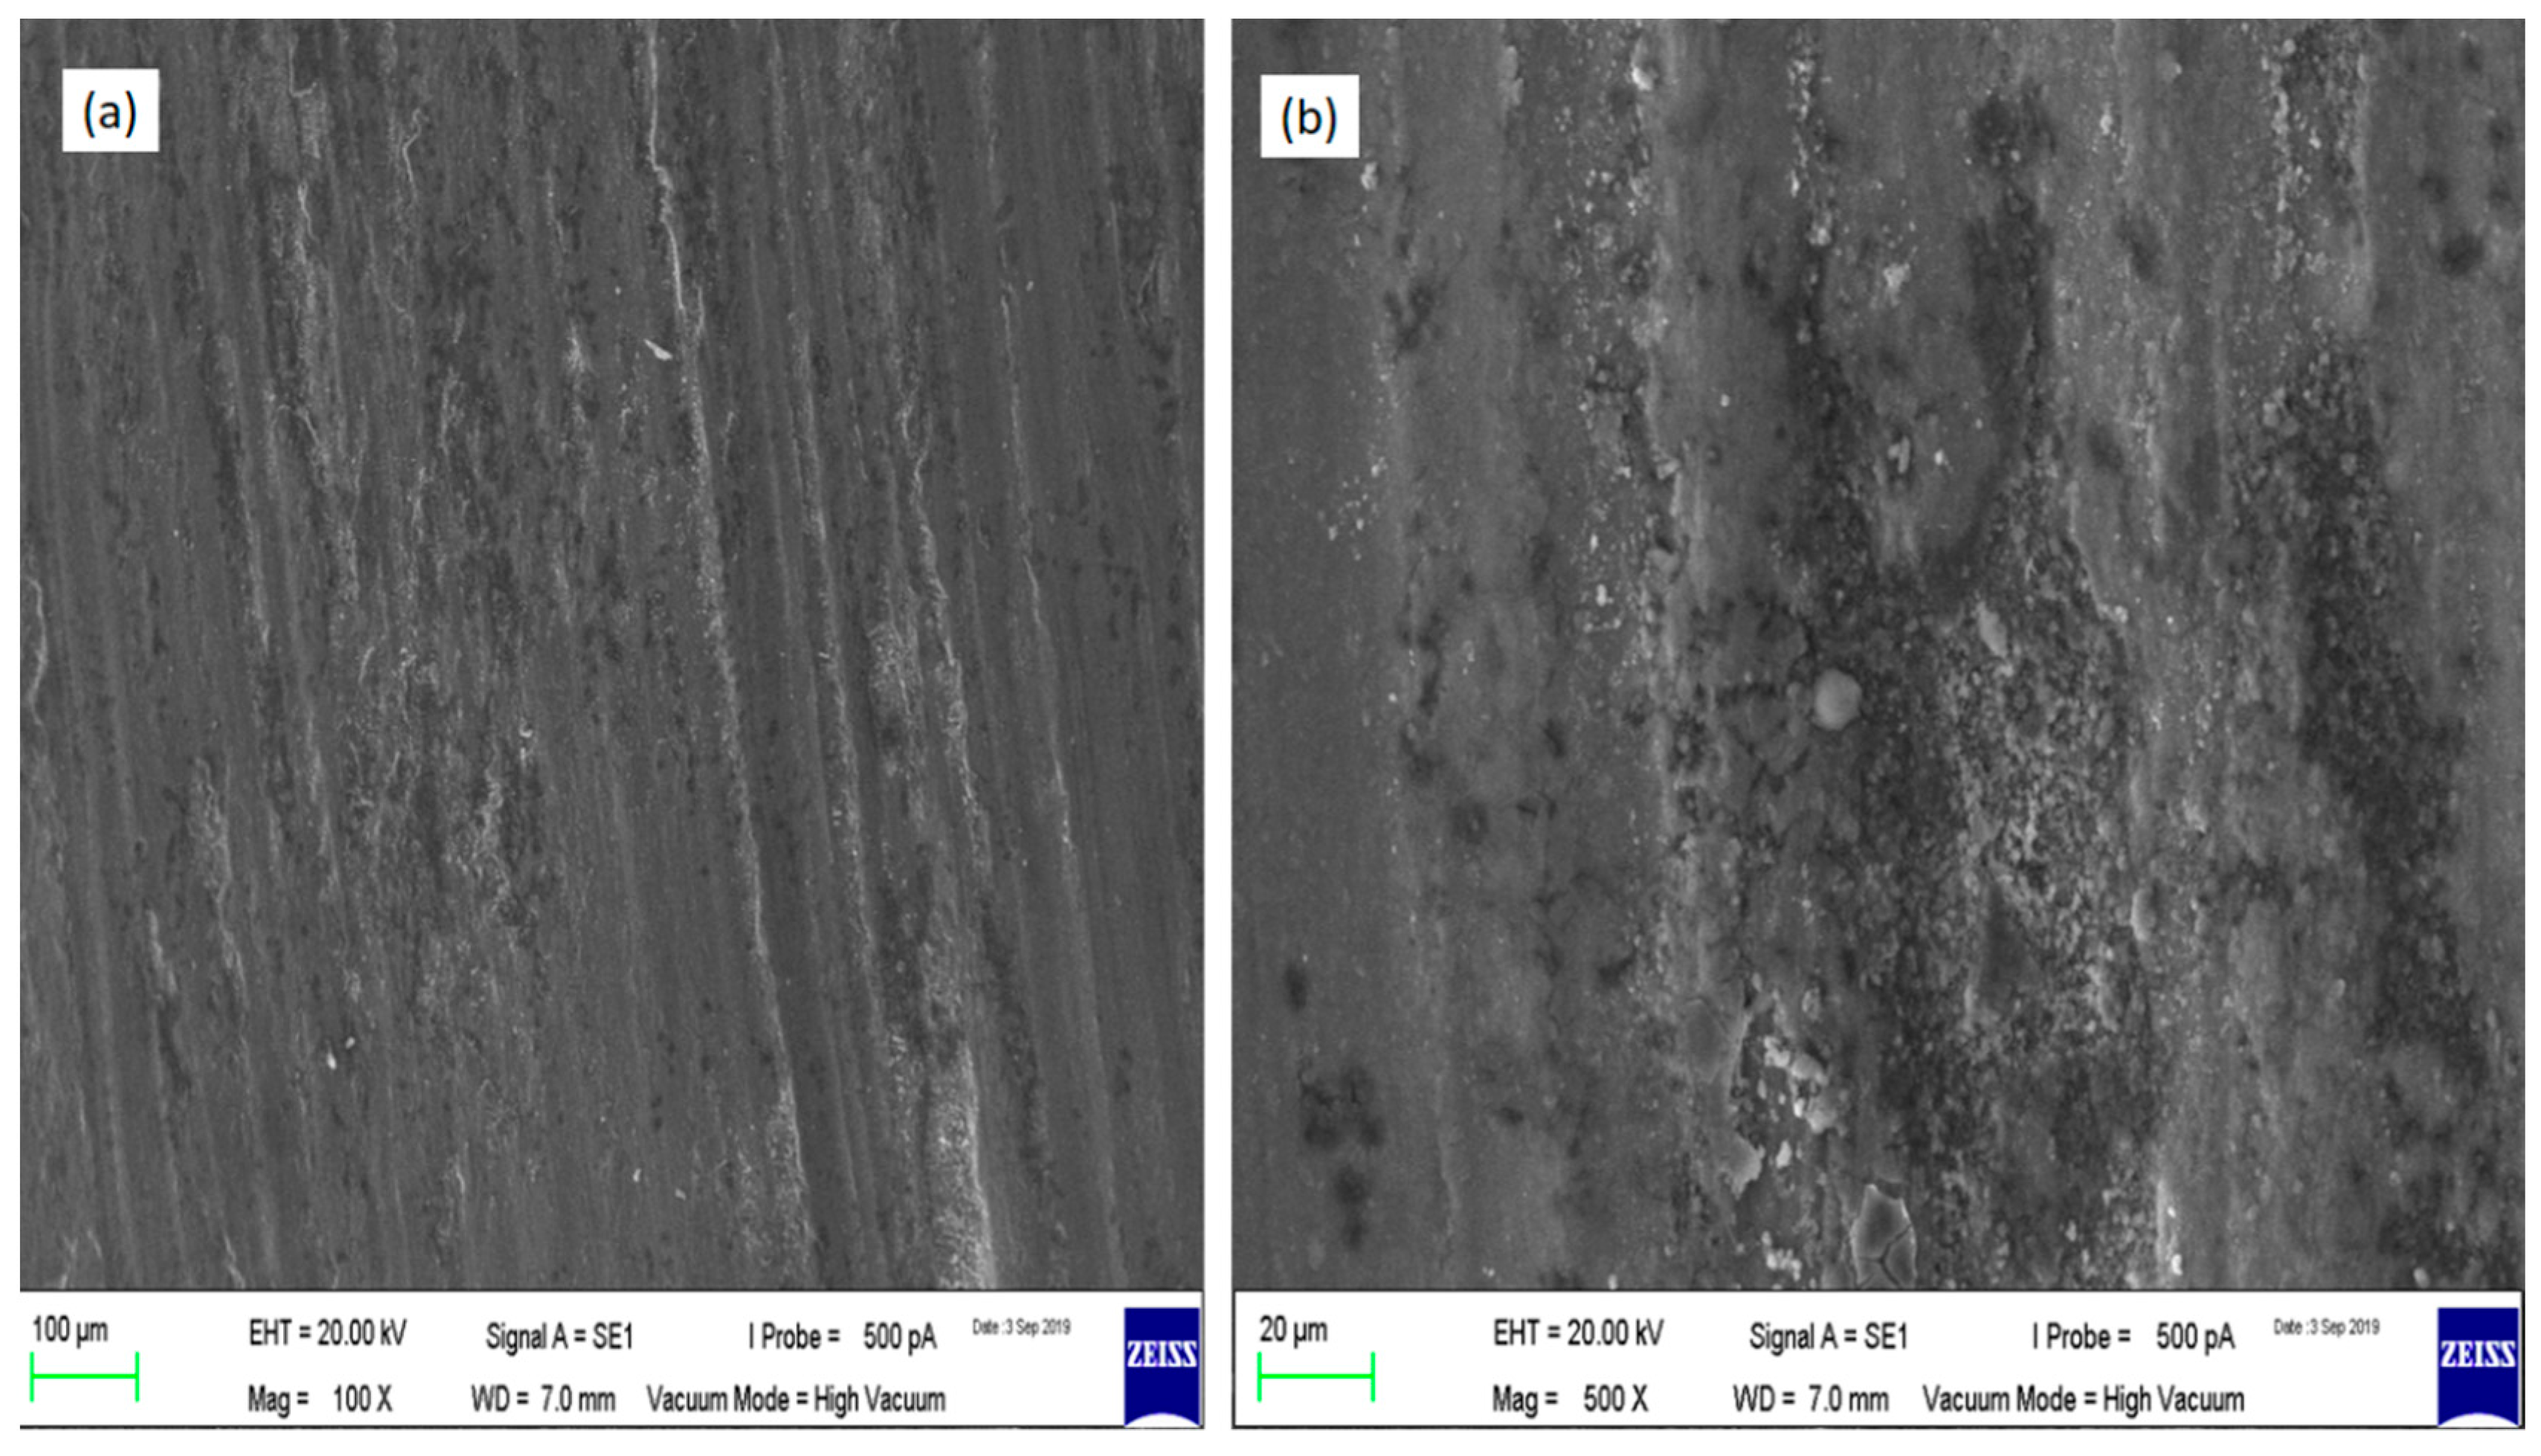
3.2. Wear Properties
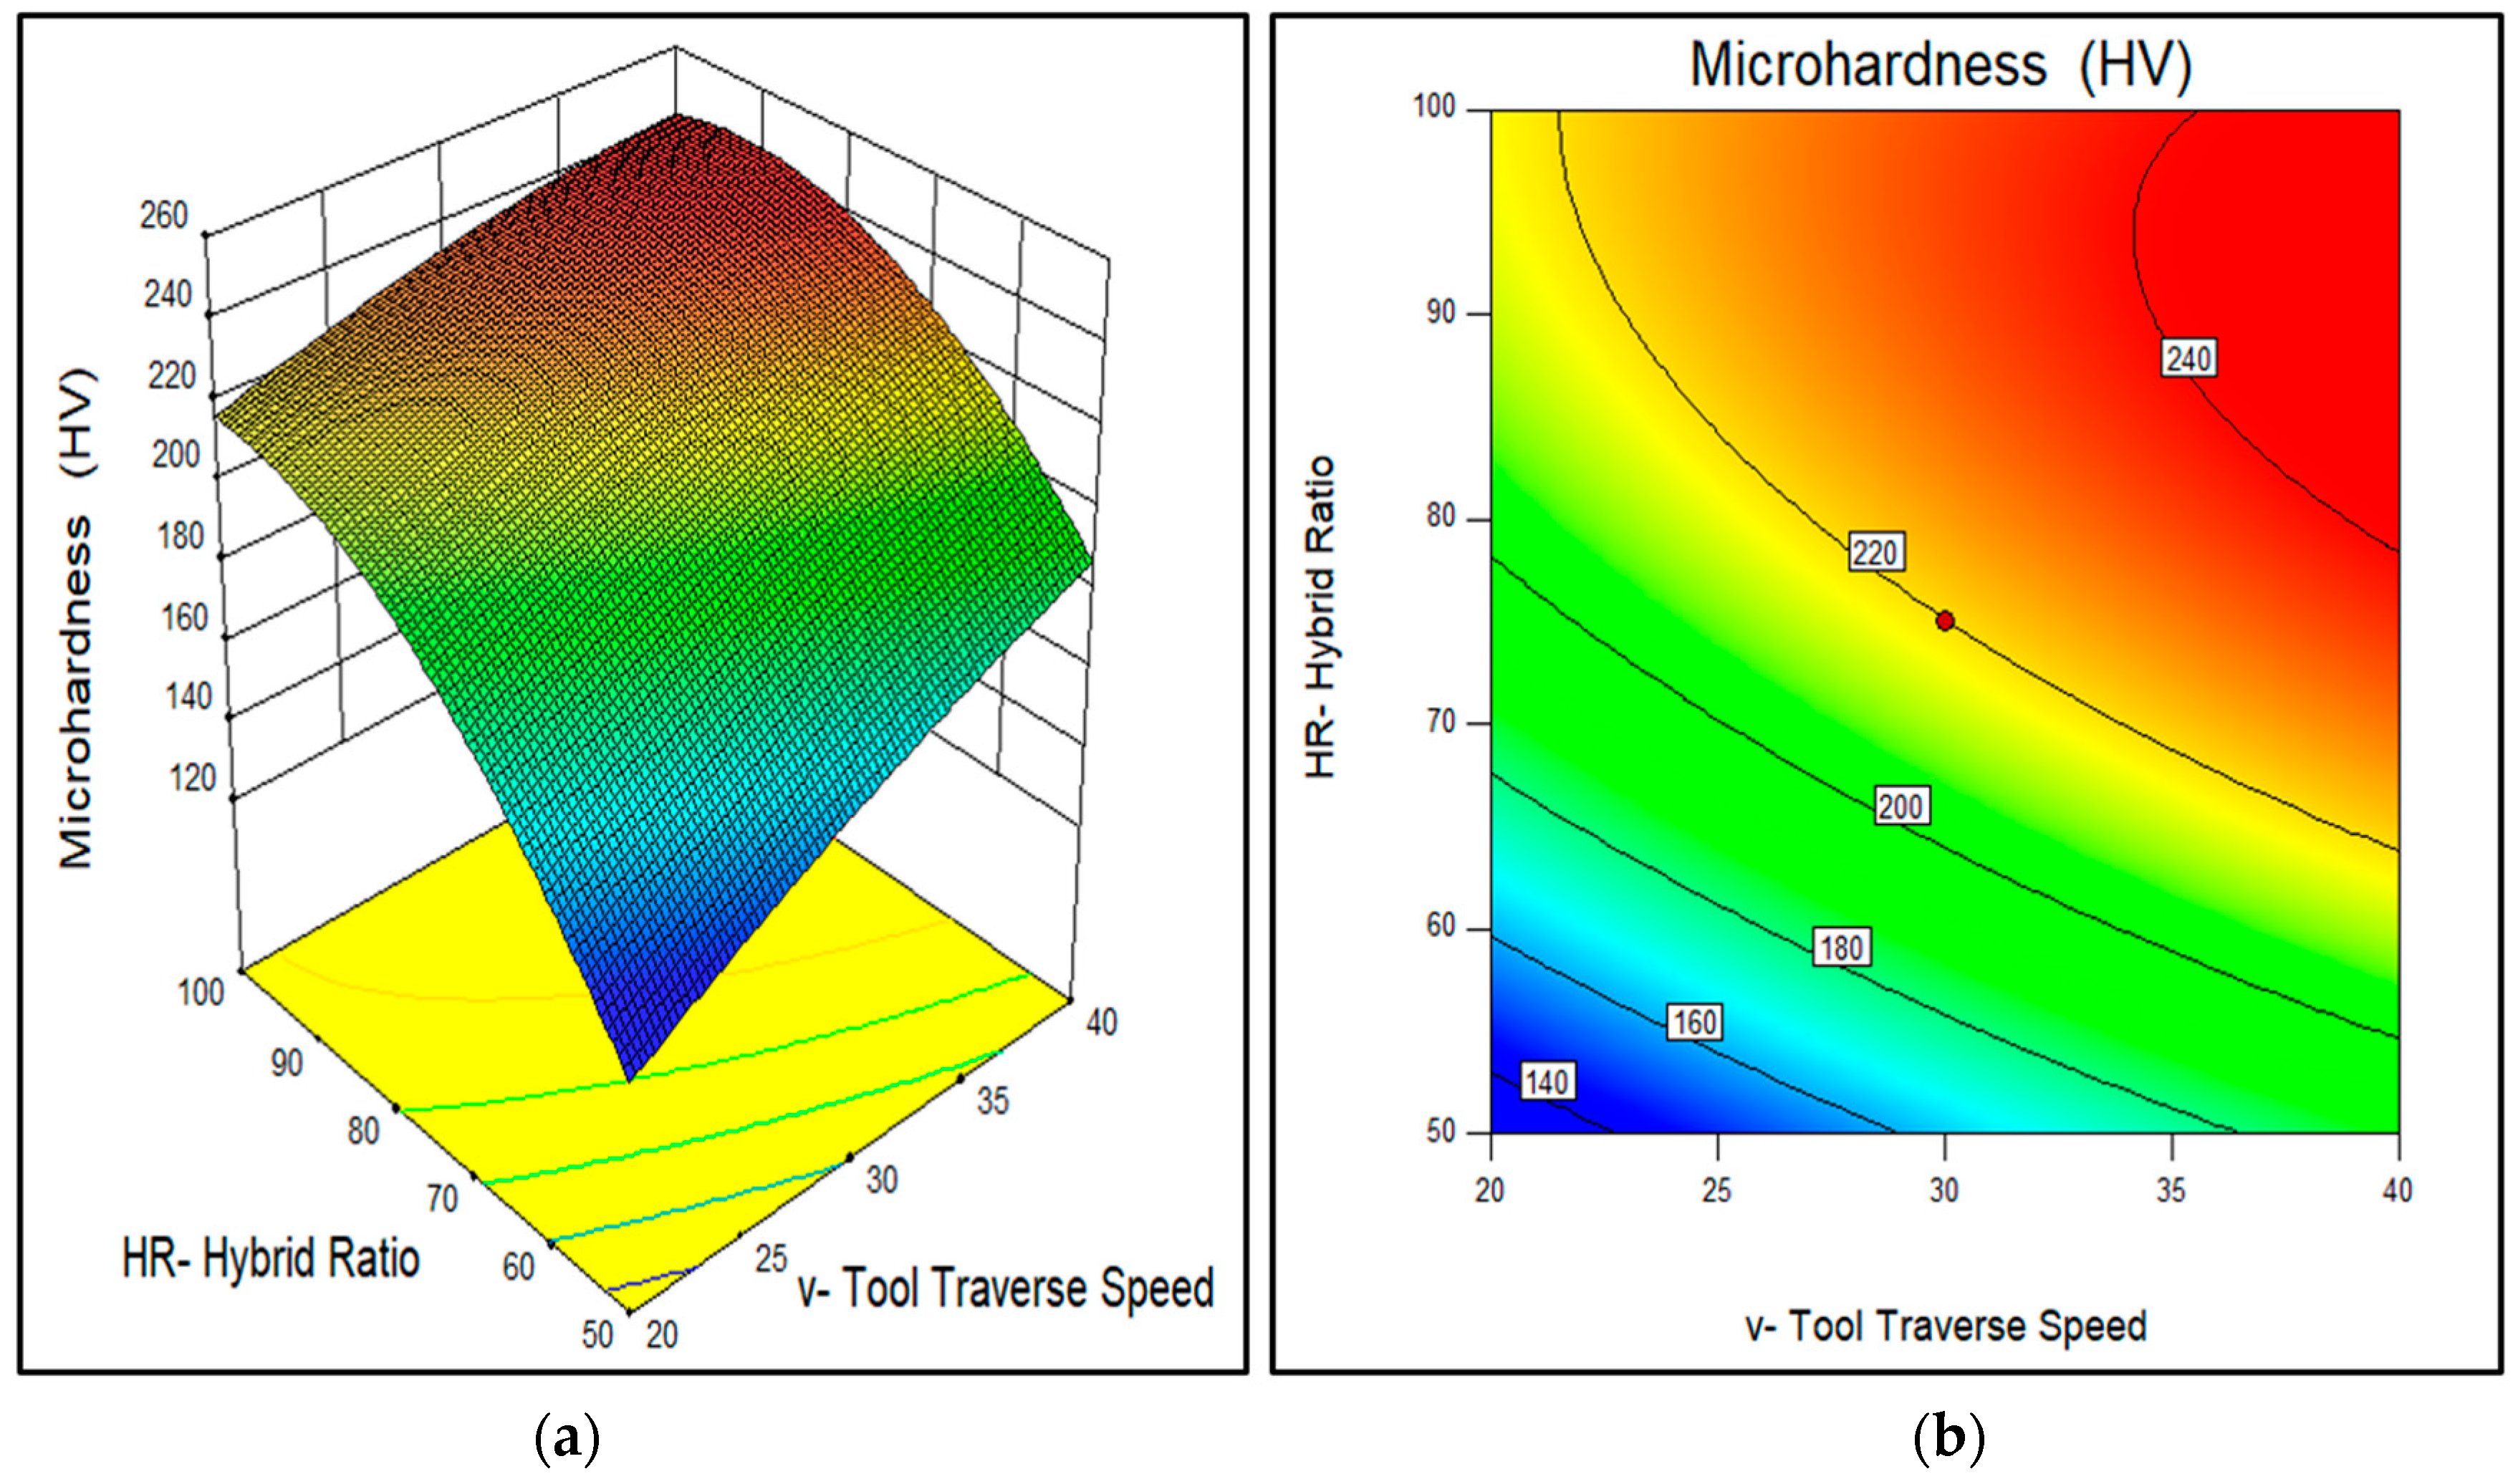
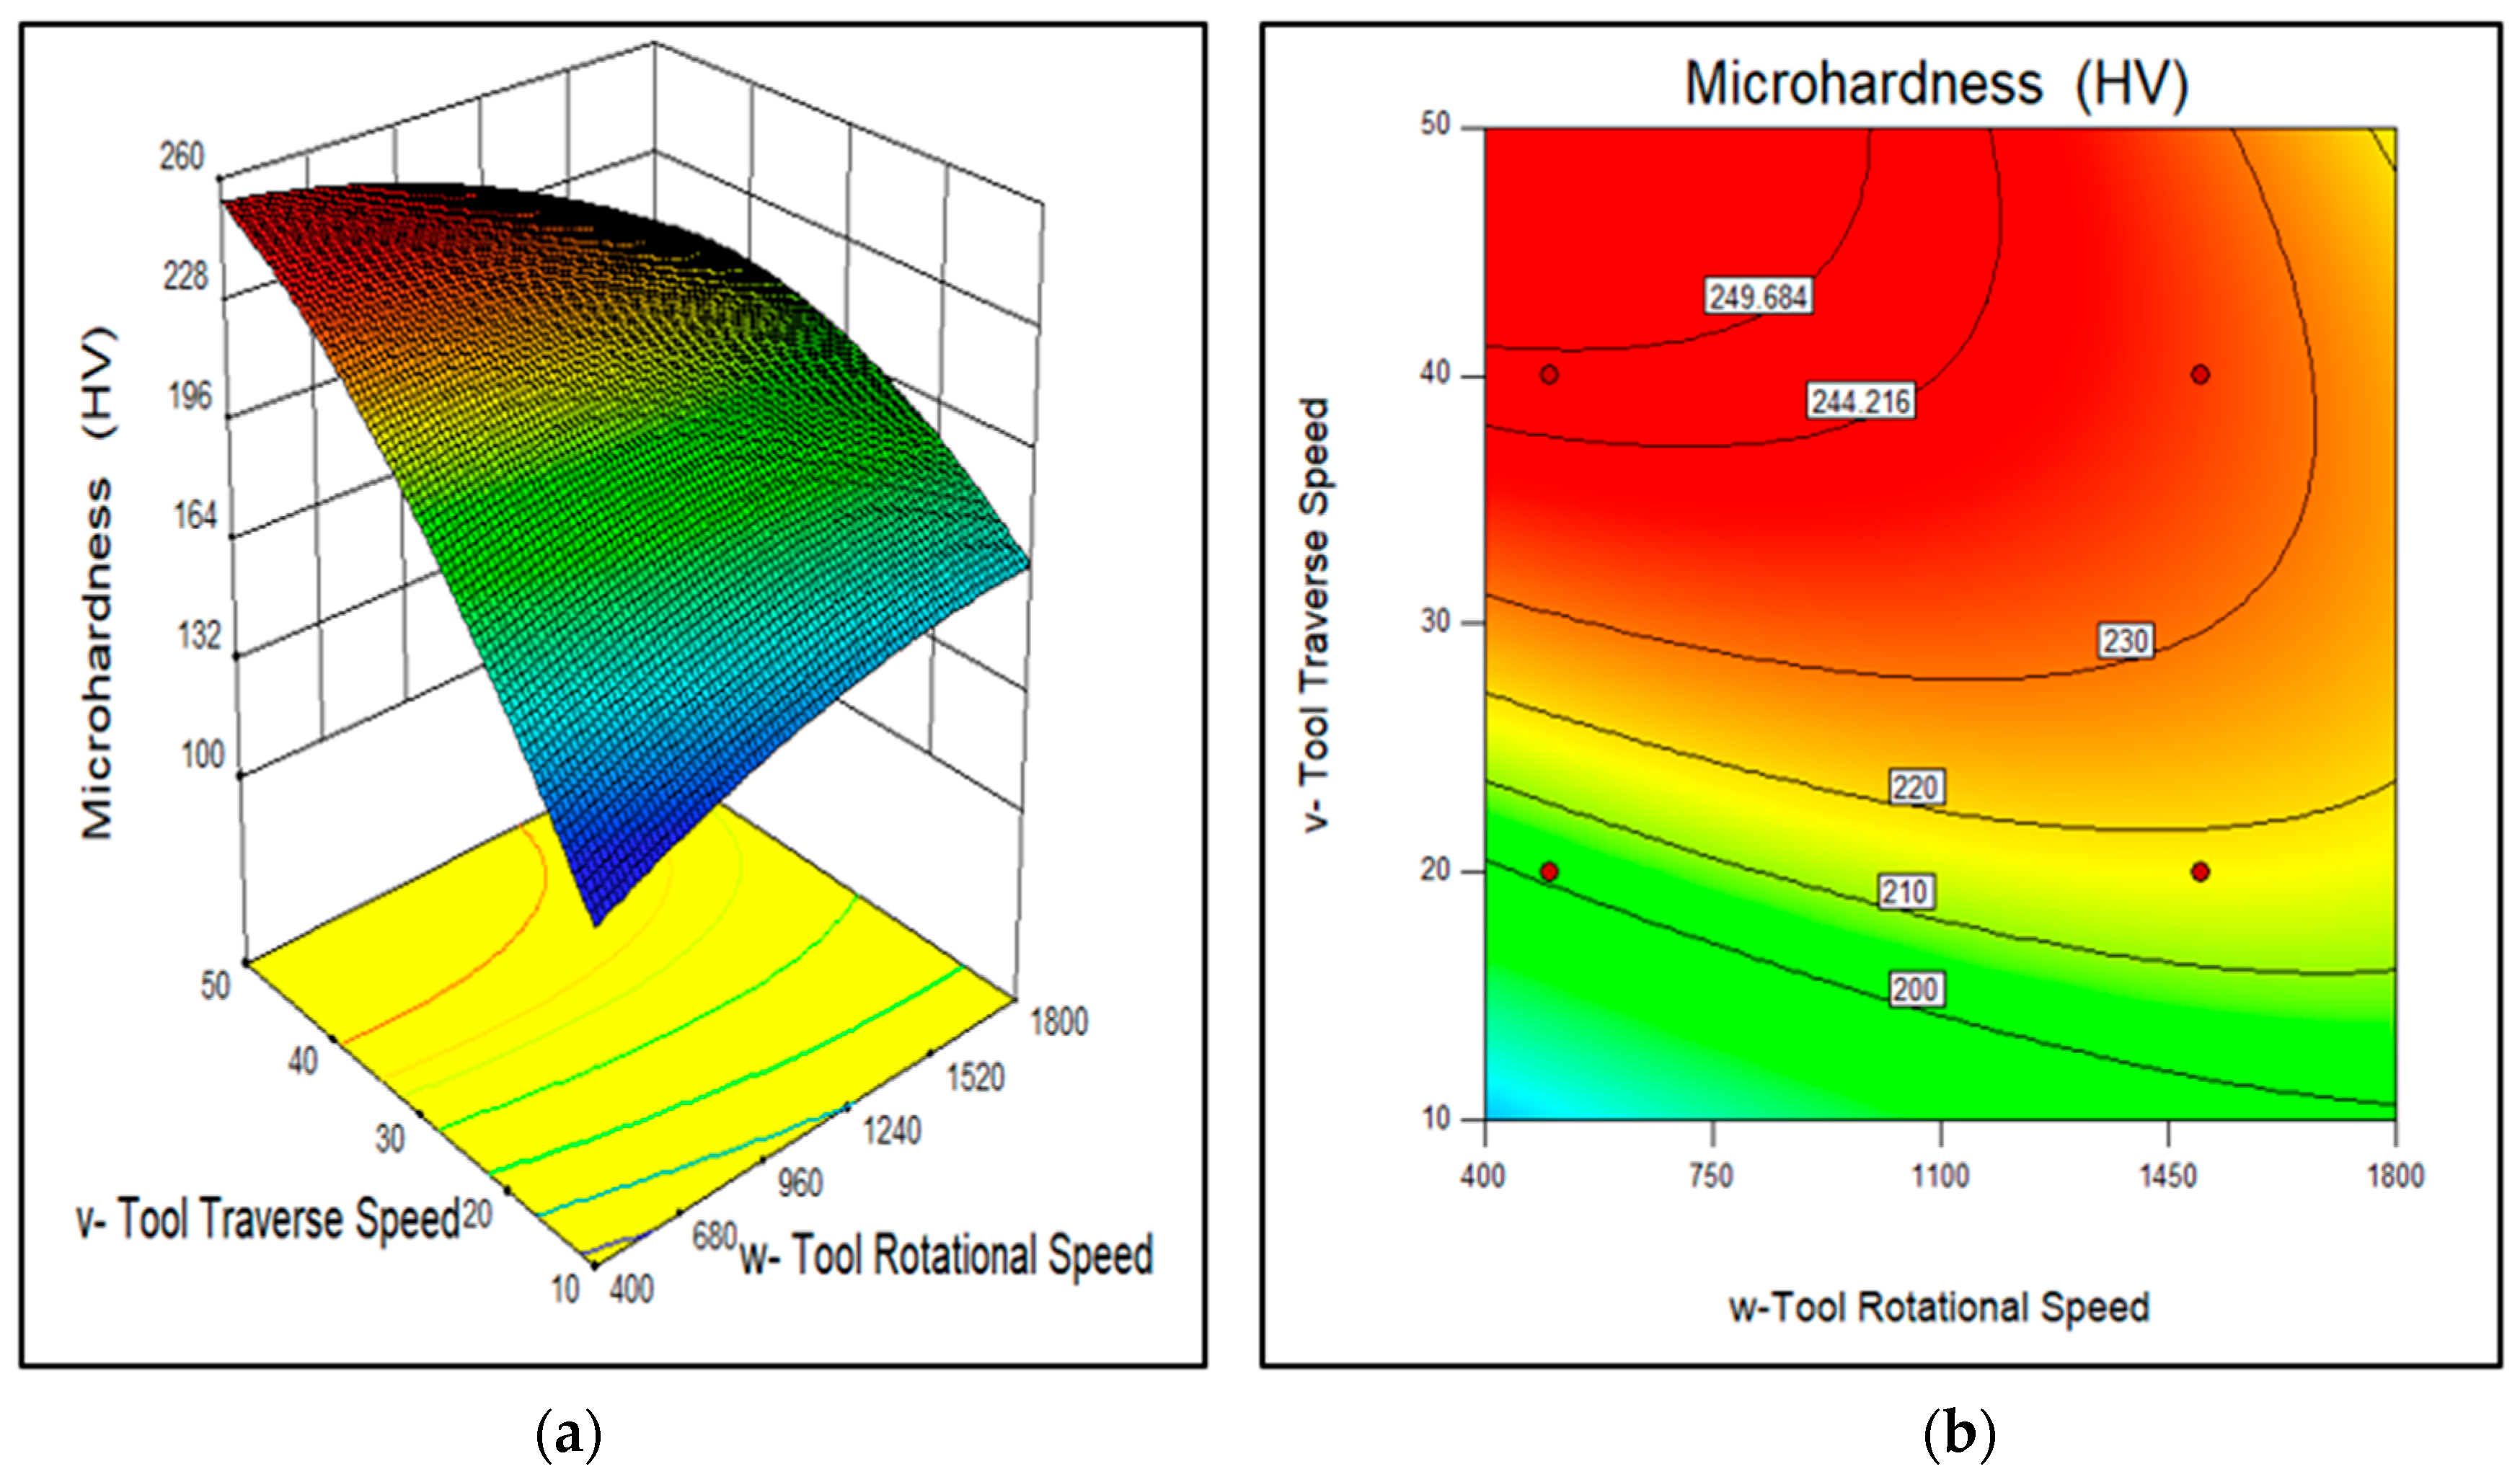
The parameters used for fabrication of AA7075-SiC/fly ash composites and their respective wear rates (mg/m) are enlisted in Table 2. For the base alloy, wear rate—0.09734 mg/m and microhardness—144.2 HV were obtained in the respective tests. The wear resistance has improved in all surface composites relative to that of the base alloy. The wear rate was evaluated as a response using the process of ANOVA. The results of the ANOVA analysis for wear rate as an output are provided in Appendix A. Through the effects of four important independent parameters on surface composite’s wear rate have been evaluated. The minimum wear rate was observed for Run 20 surface composite. The interaction effect of SiC/fly ash volume percentage and hybrid ratio (f value—67.36) had the most influential effect on the wear rate. Whereas Run 9 surface composite showed maximum wear rate among all 27 samples. The 3D plots and contour graphs given in Figure 7, Figure 8 and Figure 9 show the effects of these four independent parameters on the wear rate of surface composites. From these figures, the ranges of independent parameters for changed intervals of wear rate were observed. All of the four independent parameters were observed to be significant in ANOVA analysis results as shown in Appendix A.
From the analysis of contour plots, the influence of each parameter on the wear rate of the composites was as follows: (A) the tool rotational speed showed the desirable range of 900–1100 rpm for minimizing the wear rate of Al 7075-SiC/fly ash surface composites as observed from Figure 7, Figure 8 and Figure 9. It has been noted by Shafiei-Zarghani et al. and Chen et al. that, the wear behavior of composites depends upon grain size, reinforcement dispersion and also distribution of the inherent available precipitates. Thus, precipitates also employ a notable effect on tribological behavior along with reinforcement particles [24,25]. The minimum wear rate sample—Run 20 was obtained with 1000 rpm rotational speed and maximum wear rate sample—Run 9 was produced with 500 rpm. The tool rotational speed controls the extent of stirring action inside the base alloy matrix. With the increase in tool rotational speed, the stirring action will be greater; this stirring action has an effect on mainly two important activities inside the base alloy. The stirring action comprises both the heating and plasticized material movement. The first was the distribution of reinforcements inside the matrix, with an increase in the rotational speed chances of a homogenous dispersion of reinforcements in the stir zone increases. On the other hand, the second activity of inherent strengthening precipitates fragmentation and subsequent dissolution also depends on the rotational speed of the FSP tool. The 7075-T651 alloy inherently contains strengthening precipitates due to heat treatment. With more rotational speed, these precipitates get fragmented and subsequently get dissolved due to intense stirring action at sufficiently high temperature. Thus, the desirable rotational speed range observed (900–1100 rpm) for lower wear rate was in the intermediate range, such that the equilibrium was maintained with stirring action effect on reinforcement distribution and precipitates dissolution inside the processed zone. Naeem [26] and Soleymani Mahmoud et al. [27] also reported the phenomenon of dissolution of large strengthening precipitates in base alloys during FSP for the Al-Zn-Mg-Cu alloys.
In the case of (B) tool traverse speed, the desirable range of minimum wear rate observed was 38–40 mm/min, i.e., towards maximum traverse speeds as shown in Figure 9. It was observed that as of tool rotational speed, likely the tool traverse speed also has a significant effect on the distribution of SiC/fly ash reinforcements and inherent precipitates. With the decrease in traverse speed heat generated by stirring action increases, and subsequently results in more fragmentation and dissolution of inherent precipitates. Elangovan and Balasubramanian have mentioned that the higher heat generated contributes to more dissolution of the coarse precipitate [28]. Moreover, on the other side reinforcement distribution has to be more uniform with a lower traveling speed of the tool as time spent for stirring was comparatively more. In this study, the traverse speed was observed as the second most significant factor among all the parameters independently as mentioned in wear rate ANOVA table of Appendix A. In this study, the maximum wear rate was observed with 20 mm/min traverse (Run 9), where the main reason was the reinforcement agglomerations in the composite. While the minimum wear rate was observed with 40 mm/min traverse (40 mm/min), where the uniform dispersion of reinforcements took place. Thus, with higher tool traverse speed, the extent of precipitates dissolution was avoided. At the same time at the higher traverse, the tool rotating stirring action has to produce enough opportunity for reinforcement distribution so that strengthening by reinforcement distribution becomes more prominent than the decrement due to the dissolution of precipitates.
For the reinforcement related to two independent parameters, i.e., the hybrid ratio of SiC/fly ash and their volume percentage inside the matrix, it was observed that the interaction (f value—67.33) of both these parameters had a most significant effect on the wear rate of the composites. Notably, the reinforcement content and required stirring action to be induced by the tool movement were closely related to each other. Unless these were in coherence with each other the reinforcement distribution in the composite may not be homogenous. The heterogeneous distribution of the reinforcements leads to the agglomerated and reinforcement particles free zones in the composites. On the other hand, whenever the stirring action overcomes the flow stress of base alloy effectively, then resultant plasticized material movement gives generous opportunities to distribute the reinforcement particles more uniformly in the composites. Wang and Rack have clarified that the agglomeration areas act as a limitation during dry sliding wear tests. In which, reinforcement particles at these agglomerated areas lack required interfacial bonding with the base metal matrix [29]. Lin et al. also mentioned that this poor interfacial bonding causes particles being pulled out at the initial stage of the dry sliding wear process [30].
The desirable range for (C) hybrid ratio of SiC/fly ash particles observed was 87:13 to 90:10 as shown in Figure 8. The Run 9 surface composite with a hybrid ratio of 60:40 showed a maximum wear rate. Hence, the desirable fly ash limit in the hybrid ratio to get improved wear rate was noted to be equal to and less than 13% in the mixture. This limit was due to the increased fraction of the fly ash has resulted in the presence of more debris due to the breaking of fly ash particles during stir processing. The SiC ceramic particles are harder than the fly ash debris particles. In the wear process, the SiC particles act as obstacles along with fly ash but have more load-bearing capacity than the fly ash debris particles. Chen and Alpas also found that reinforcement particles decrease the direct contact amid the steel disc and composite substrate and accordingly led to a notable decrease in wear rate [31]. Thus, it has been noted that with the dispersion of SiC and fly ash the wear rate has decreased than the base alloy, but the optimum fraction of fly ash was restricted to equal to or less than 13% in the mixture with SiC particles.
Finally, for the (D) volume percentage of SiC/fly ash reinforcement particles, the desirable range observed was 5–8% as shown in Figure 7. The volume percentage had very significant effect on the wear behavior of the composites. The maximum wear rate was observed with Run 9 (vol.%: 12) due to more agglomeration of reinforcements inside the composite. There the amount of reinforcement content and the required stirring action were mismatched, so the intensity of plasticization was not enough to disperse the reinforcement uniformly. Because for a higher volume percentage of reinforcements, the stirring action required to obtain uniform distribution was more. As discussed earlier, the mismatch between the reinforcement content and required stirring action for uniform distribution led to the agglomerations inside composites. Such agglomerated areas served as faults in dry sliding wear testing due to their poor interfacial bonding to the base alloy. In another way, the minimum wear rate was obtained for Run 20 (vol.%: 8), where the even dispersal of reinforcement took place. The stirring action generated was enough to disperse the reinforcements uniformly inside the matrix. With a uniform distribution of reinforcement particles, the tribological properties were enhanced since the hard SiC/fly ash particles acted as obstacles to reduce the surface to surface contact with the mating disc. So, in this study, it was observed that for good wear resistance properties the amount of SiC/fly ash particles into the aluminum matrix was 5–8%.
For the lowest wear rate sample of Run 20, the SiC and fly ash particles were found to be uniformly distributed. The SEM Mapping analysis results of Run 20 composite wear tracks are given in Figure 10. In which, it has been confirmed that the SiC/fly ash particles were present over the wear track surface. The elements oxygen (O), carbon (C) and silicon (Si) in Figure 10 show the presence of inherent oxides (fly ash) and carbide (SiC) particles. This confirmed that reinforcement particles were trapped in certain parts on the surface of the wear sample.
The worn surfaces on the samples of the base alloy, Runs 20 and 9 composites are shown in Figure 11, Figure 12 and Figure 13 respectively. In the case of base alloy, the worn surface shows a large amount of plastic flow, micro-cracks and pits on the surface. During sliding contact between the base alloy sample and the mating disc, the load between asperities was enough to get the local plasticization. Also, the load transfer during dry sliding action between the asperities of base alloy and mating steel disc was repetitive in behavior and which may lead to fretting fatigue wear mechanism. Majzoobi and Soori observed that the fretting fatigue wear occurs when the mating surfaces were subject to oscillating loads and sliding motions at the same time [32]. The asperities on the surface of base alloy sample and mating disc have undergone repetitive loading actions which lead to crack formation and propagation as shown in Figure 11. In addition, the increased temperature due to sliding led to formation of pits due to adhesion. Therefore, it was confirmed that adhesive, as well as fatigue wear mechanism, found to be present between mating materials. This has led to the formation of smaller pits and micro-cracks on the surface. The groove patterns generated were observed to be less in number on the base alloy than the composites and small pits and cracks were observed dominantly.
In the case of surface composites, the worn surfaces were looking more abraded and parallel groove patterns were dominant. In a case of Run 20, because of uniform dispersion of the SiC/fly ash particles on the surface, the wear resistance has increased than the Run 9 composite. For Run 20, due to good interfacial bonding, the reinforcement particles have acted as stable load carrying mediums between the mating surfaces and have detached the full surface-to-surface contact of the sample and disc. Thus, these hard reinforcement particles have changed the wear phenomenon from adhesion to abrasion. The presence of prominent parallel tracks on the worn surface denotes the abrasion wear mechanism. For the Run 9 composite sample, the worn-out material was higher than the Run 20 composite. Since the highly agglomerated zones on the surface have facilitated the hard reinforcement particles to pull out of surface due to poor interfacial bonding with base alloy. These large number of reinforcing particles again have churned between the mating surfaces to increase further abrasive actions. The resultant surface has many dimples and delaminations compared to the Run 20 and base alloy samples.

3.3. Microhardness

The Vickers’ microhardness values measured of all AA7075-SiC/fly ash composites are enlisted in Table 2. The microhardness was measured upon each surface composite surface at 5 different locations starting from advancing side to retreating side, and the average value was used for analysis. The ANOVA results of the microhardness as a response are enlisted in Appendix B. The interaction effect of SiC/fly ash reinforcement volume percentage and hybrid ratio (f value—51.40) had the most influential effect on the microhardness of surface composites. Moreover, individually SiC/fly ash volume percentage (f value—26.94) was the most effective parameter for the microhardness of the composites. As the amount of these hybrid reinforcements increased, the SiC/fly ash particles occupied area inside composites has increased. The load-bearing capacities of the SiC/fly ash particles have contributed to enhance the microhardness of the resultant surface composites as the powder content increased.
Overall, in this study, it was observed that micro hardness of surface composites was more than 7075 base alloy. The maximum microhardness of 241.20 HV was observed for Run 15 (w: 500 rpm, v: 40 mm/min, HR: 90:10 and vol.%: 12) sample, whereas a minimum 145.12 HV for Run 8 (w: 1500 rpm, v: 40 mm/min, HR: 90:10 and vol.%: 4) sample. For three composites (Runs 5, 8 and 10), the improvement in microhardness was very minor even after the dispersion of SiC/fly ash reinforcement particles. In the earlier study, it has been observed that the microhardness of the resulting composites was found to be based on the influence of process parameters on the degree of precipitate fragmentation and grain size strengthening occurred within the resulting aluminum composites [22]. In other studies, Sato et. al. [33] as well as Elangovan and Balasubramanian [28] reported that microhardness of heat-treated aluminum alloys has been reduced due to precipitates dissolution after friction stir processing. So, interestingly in this study, the microhardness had mostly increased and was comparable to the base alloy in a few runs. So, the grain size strengthening due to SiC/fly ash particles has a dominant effect than the reduction in microhardness due to precipitates dissolution.
The FSP tool rotational and traverse speed directly controls the intensity of plasticization during FSP. Remarkably, in this study ranking wise, the most influential factor was the interaction effect of reinforcement volume percentage and hybrid ratio. Next, the most influential factor was the volume percentage and tool traverse speed as shown in ANOVA-Appendix B. Therefore, the influence of stirring action on the reinforcement distribution has controlled the microhardness enhancement phenomenon. The desirable ranges of four independent parameters for maximum microhardness were observed from the 3D surface and contour plots as shown in Figure 14, Figure 15 and Figure 16. The desirable ranges of parameters were as follows: tool rotational speed-(500–1100 rpm), tool traverse speed-(35–40 mm/min), hybrid ratio-(80:20–90:10) and reinforcement volume percentage (10–12%).
In the case of tool rotational speed, the desirable range found to be (500–1100 rpm), as shown in Figure 15. It implies that, although the reinforcement distribution was more uniform at the higher rotation of the FSP tool, the dissolution of precipitates due to intense stirring has reduced the microhardness at a higher number of rotations. Similarly, for the tool traverse speed desirable range observed from Figure 14, Figure 15 and Figure 16 was (35–40 mm/min). At lower travel speed of the FSP tool, obtained stirring action was higher which results in a more uniform dispersion of reinforcement but also introduces more inherent precipitates dissolutions. Thus, such desirable ranges for tool rotational speed and traverse speed were observed in this study, in which the reinforcement particle distribution was good enough and at the same time, precipitates were also retained inside the composite structures.
The microhardness was observed to be a function of volume percentage of SiC/fly ash reinforcement into the base alloy. The more reinforcement content into the base alloy has improved the microhardness because of their inherent hard nature and load-bearing capacity. For the surface composites, in which distribution of more SiC/fly ash reinforcement particles took place homogenously, the SiC/fly ash particles have acted as hindrances in the grain growth by pinning the grain boundaries. The pinning effect of reinforcements inside the base matrix has led to refined grain structure and induced grain size strengthening. Also, Bauri et al. mentioned that due to the mismatch of the thermal conductivity coefficients between reinforcement particles and the base alloy, the dislocations density increases inside the composites [34]. Kumar et al. observed that the increased dislocation density inside the composite leads to hinder the dislocation movement, thus microhardness increases [35]. Therefore, the desirable range of volume percentage obtained was towards high content of reinforcement, i.e., 10% to 12% of SiC/fly ash particulate reinforcements as shown in Figure 16.
From Figure 14, the desirable ranges observed for the hybrid ratio of SiC/fly ash was (80:20–90:10, i.e., maximum SiC content. This suggests that the fly ash powder fraction must be limited to 20% or less with SiC to get a more significant improvement in microhardness. The SiC particles are more hard ceramic material than the fly ash. Fly ash during FSP became fragmented due to its brittle character, and broken fly ash debris was generated. Thus, it was noted that, owing to its hard-refractory nature SiC had a major role in improving the hardness significantly. Through friction stir processing the formation of detrimental phases by reaction of SiC/fly ash with base alloy were avoided. Thus, the fly ash particles also contributed to enhancing the microhardness through load bearing ability of its inherent oxides like silica (SiO2), alumina (Al2O3) and CaO, etc.

4. Conclusions

  • The extent of uniform dispersion of SiC/fly ash reinforcements inside the AA7075 base alloy was found to be most important aspect in inducing the improvement in microhardness and wear resistance behavior into the composites.
  • The interaction effect of SiC/fly ash reinforcement’s volume percentage and hybrid ratio was found to be most significant factor for inducing minimum wear rate and maximum microhardness in the AA7075-SiC/fly ash composites. In addition, the higher tool traverse speeds found to be effective for improvement in wear resistance and microhardness properties.
  • Optimum wear rate and microhardness may be induced in the AA7075-SiC/fly ash composites with maximum SiC content. For inducing effective improvement in microhardness and wear behavior, the ratio of fly ash must be less than 20% and 13% in the mixture of SiC/fly ash combination, respectively.
  • Wear resistance increased as the wear mechanism changed from adhesion and fatigue in base alloy to abrasion, due to the presence of SiC/fly ash particles in the composites.
  • For maximum microhardness and wear resistant composite materials, the required volume percentage of SiC/fly ash into base alloy were found to be converse to each other, i.e., 10–12% and 5–8%, respectively.
  • Fly ash particles were found to be fragmented during the process inside the composites and thus higher microhardness and dry sliding wear resistance was observed with maximum SiC reinforced composites.
  • Notably, the wear rate was found to be increased with more agglomeration of SiC/fly ash particles, which has induced poor interfacial bonding to pull out reinforcement particles during the wear process.
  • The optimum ranges of FSP parameters in the fabrication of Al7075-SiC/fly ash hybrid surface composites with minimum wear rate were observed to be: w: 900–1100 rpm, v: 38–40 mm/min, HR: 87:13–90:10 and vol.%: 5–9%.
  • The optimum ranges of parameters for higher microhardness were observed to be: w: 500–1100 rpm, v: 35–40 mm/min, HR: 80:20–90:10 and vol.%: 11–12%.

Author Contributions

Conceptualization, N.A.P. and S.R.P.; resources procurement, S.R.P.; methodology, experiments, N.A.P. and S.R.P.; microstructure and tribological characterization, N.A.P., S.R.P., and A.M.H.S.L.; writing—original draft preparation, N.A.P.; writing—review and editing N.A.P., S.R.P., and O.B.M.; supervision, S.R.P., O.B.M., and A.M.H.S.L.; project administration and funding acquisition, S.R.P. All authors have read and agreed to the published version of the manuscript.

Funding

This research received no external funding.

Acknowledgments

The work was supported by the Centre of Graduate Studies, Universiti Teknologi PETRONAS, Malaysia.

Conflicts of Interest

The authors declare no conflict of interest.

Appendix A

Table A1. The ANOVA model validation for wear rate.
SourceSum of
Squares
dfMean Squaref Valuep-Value
Prob > f
Model9.813 × 10−4146.799 × 10−520.63<0.0001
A-w3.381 × 10−711.109 × 10⁻⁶ 0.340.5727
B-v1.552 × 10−411.436 × 10⁻⁴ 43.58<0.0001
C-HR6.126 × 10−515.410 × 10⁻⁵ 16.410.0016
D-vol.%1.086 × 10−517.975 × 10⁻⁶ 2.420.1458
AB4.296 × 10−612.474 × 10⁻⁶ 0.750.4033
AC3.730 × 10−513.145 × 10⁻⁵ 9.540.0094
AD5.340 × 10−516.096 × 10⁻⁵ 18.490.0010
BC3.406 × 10−514.014 × 10⁻⁵ 12.180.0045
BD7.045 × 10−619.949 × 10⁻⁶ 3.020.1079
CD2.372 × 10−412.220 × 10⁻⁴ 67.36<0.0001
A27.410 × 10−517.513 × 10⁻⁵ 22.790.0005
B21.665 × 10−411.650 × 10⁻⁴ 50.05<0.0001
C21.006 × 10−419.945 × 10⁻⁵ 30.170.0001
D21.314 × 10−411.328 × 10⁻⁴ 40.28<0.0001
Residual4.249 × 10−5123.296 × 10−6
Lack of Fit4.236 × 10−5103.942 × 10−6 60.620.0163
Pure Error1.301 × 10−726.503 × 10⁻⁸
Cor Total1.024 × 10−326-

Appendix B

Table A2. The ANOVA model validation for Microhardness (HV).
SourceSum of
Squares
dfMean
Square
f
Value
p-Value
Prob > f
Model15656.89141118.358.870.0003
A-w2.5112.510.0200.8901
B-v1963.7611963.7615.580.0019
C-HR24.92124.920.200.6645
D-vol.%3395.4313395.4326.940.0002
AB801.881801.886.360.0268
AC12.80112.800.100.7554
AD0.2610.262.04 × 10−30.9647
BC356.931356.932.830.1182
BD1745.3611745.3613.850.0029
CD6477.4316477.4351.40<0.0001
A237.57137.570.300.5950
B243.17143.170.340.5692
C2151.381151.381.200.2946
D2857.141857.146.800.0229
Residual1512.2512126.02
Lack of Fit1490.8210149.0813.910.0689
Pure Error21.43210.72
Cor Total17169.1426

References

  1. Dolata-Grosz, A.; Wieczorek, J. Tribological properties of hybrid composites containing two carbide phases. Arch. Mater. Sci. Eng. 2007, 28, 149–155. [Google Scholar]
  2. Patil, N.A.; Pedapati, S.R.; Mamat, O.B.; Lubis, A.M.H.S. A review on aluminium hybrid surface composite fabrication using friction stir processing. Arch. Metall. Mater. 2020, 65, 441–457. [Google Scholar]
  3. Bodunrin, M.O.; Alaneme, K.K.; Chown, L.H. Aluminium matrix hybrid composites: A review of reinforcement philosophies; mechanical, corrosion and tribological characteristics. J. Mater. Res. Technol. 2015, 4, 434–445. [Google Scholar] [CrossRef] [Green Version]
  4. Xing, Y.; Guo, F.; Xu, M.; Gui, X.; Li, H.; Li, G. Separation of unburned carbon from coal fly ash: A review. Powder Technol. 2019, 353, 372–384. [Google Scholar] [CrossRef]
  5. Sett, R. Fly ash: Characteristics, problems and possible utilization. Adv. Appl. Sci. Res. 2017, 8, 32–50. [Google Scholar]
  6. Mahendra, K.V.; Radhakrishna, K. Characterization of stir cast Al—Cu—(fly ash + SiC) hybrid metal matrix composites. J. Compos. Mater. 2009, 44, 989–1005. [Google Scholar] [CrossRef]
  7. Rao, J.B.; Rao, D.V.; Murthy, I.N.; Bhargava, N. Mechanical properties and corrosion behaviour of fly ash particles reinforced AA 2024 composites. J. Compos. Mater. 2012, 46, 1393–1404. [Google Scholar] [CrossRef]
  8. Rao, J.B.; Rao, D.V.; Bhargava, N. Development of Light Weight ALFA Composites; Springer: Berlin/Heidelberg, Germany, 2010. [Google Scholar]
  9. Dinaharan, I.; Nelson, R.; Vijay, S.J.; Akinlabi, E.T. Microstructure and wear characterization of aluminum matrix composites reinforced with industrial waste fly ash particulates synthesized by friction stir processing. Mater. Charact. 2016, 118, 149–158. [Google Scholar] [CrossRef]
  10. Reddy, B.R.; Srinivas, C. Fabrication and characterization of silicon carbide and fly ash reinforced aluminium metal matrix hybrid composites. Mater. Today Proc. 2018, 5, 8374–8381. [Google Scholar] [CrossRef]
  11. Prabhakar, G.V.N.B.; Ravi Kumar, N.; Ratna Sunil, B. Surface metal matrix composites of Al5083-fly ash produced by friction stir processing. Mater. Today Proc. 2012, 5, 8391–8397. [Google Scholar] [CrossRef]
  12. Wang, W.; Shi, Q.; Liu, P.; Li, H.; Li, T. A novel way to produce bulk SiCp reinforced aluminum metal matrix composites by friction stir processing. J. Mater. Process. Tech. 2009, 209, 2099–2103. [Google Scholar] [CrossRef]
  13. Kurt, A.; Uygur, I.; Cete, E. Surface modification of aluminium by friction stir processing. J. Mater. Process. Tech. 2011, 211, 313–317. [Google Scholar] [CrossRef]
  14. Miranda, R.M.; Santos, T.G.; Gandra, J.; Lopes, N.; Silva, R.J.C. Reinforcement strategies for producing functionally graded materials by friction stir processing in aluminium alloys. J. Mater. Process. Tech. 2013, 213, 1609–1615. [Google Scholar] [CrossRef]
  15. Rana, H.; Badheka, V. Influence of friction stir processing conditions on the manufacturing of Al-Mg-Zn-Cu alloy/boron carbide surface composite. J. Mater. Process. Tech. 2018, 255, 795–807. [Google Scholar] [CrossRef]
  16. Dursun, T.; Soutis, C. Recent developments in advanced aircraft aluminium alloys. Mater. Des. 2014, 56, 862–871. [Google Scholar] [CrossRef]
  17. Mohseni, E.; Zalnezhad, E.; Sarhan, A.A.; Bushroa, A. A study on surface modification of Al7075-T6 alloy against fretting fatigue phenomenon. Adv. Mater. Sci. Eng. 2014, 2014, 17. [Google Scholar] [CrossRef] [Green Version]
  18. Sharma, V.; Prakash, U.; Manoj Kumar, B.V. Surface composites by friction stir processing: A review. J. Mater. Process. Tech. 2015, 224, 117–134. [Google Scholar] [CrossRef]
  19. ASTM G99-17 Standard Test Method for Wear Testing with a Pin-on-Disk Apparatus; ASTM: West Conshohocken, PA, USA, 2017.
  20. Patil, N.A.; Pedapati, S.R.; Mamat, O.B.; Hidayat Syah Lubis, A.M. Optimization of friction stir process parameters for enhancement in surface properties of Al 7075-SiC/Gr hybrid surface composites. Coatings 2019, 9, 830. [Google Scholar] [CrossRef] [Green Version]
  21. Narasimha Murthy, I.; Venkata Rao, D.; Babu Rao, J. Microstructure and mechanical properties of aluminum–fly ash nano composites made by ultrasonic method. Mater. Des. 2012, 35, 55–65. [Google Scholar] [CrossRef]
  22. Kumar, P.R.S.; Kumaran, S.; Rao, T.S.; Natarajan, S. High temperature sliding wear behavior of press-extruded AA6061/fly ash composite. Mater. Sci. Eng. A. 2010, 527, 1501–1509. [Google Scholar] [CrossRef]
  23. Mishra, R.S.; Ma, Z.Y.; Charit, I. Friction stir processing: A novel technique for fabrication of surface composite. Mater. Sci. Eng. A. 2003, 341, 307–310. [Google Scholar] [CrossRef]
  24. Shafiei-Zarghani, A.; Kashani-Bozorg, S.F.; Zarei-Hanzaki, A. Microstructures and mechanical properties of Al/Al2O3 surface nano-composite layer produced by friction stir processing. Mater. Sci. Eng. A. 2009, 500, 84–91. [Google Scholar] [CrossRef]
  25. Chen, Z.; Li, J.; Borbely, A.; Ji, G.; Zhong, S.Y.; Wu, Y.; Wang, M.L.; Wang, H.W. The effects of nanosized particles on microstructural evolution of an in-situ TiB2/6063Al composite produced by friction stir processing. Mater. Des. 2015, 88, 999–1007. [Google Scholar] [CrossRef]
  26. Naeem, H.T. Characterizations particulates of crushed particles (Al_Zn_Mg_Cu_Ni) for fabrication of surface composites al-alloy using friction stir processing route. MJET 2016, 4, 56–65. [Google Scholar]
  27. Mahmoud, S.; Farshid, K.B.S.; Alimohamad, H. Evaluation of wear properties of Al7075/SiC-BN hybrid nano-composite surface layer produced by friction stir processing. Adv. Proces. Mater. 2016, 10, 47–57. [Google Scholar]
  28. Elangovan, K.; Balasubramanian, V. Influences of post-weld heat treatment on tensile properties of friction stir-welded AA6061 aluminum alloy joints. Mater. Charact. 2008, 59, 1168–1177. [Google Scholar] [CrossRef]
  29. Wang, A.; Rack, H.J. A statistical model for sliding wear of metals in metal/composite systems. Acta Metall. Mater. 1992, 40, 2301–2305. [Google Scholar] [CrossRef]
  30. Lin, Y.C.; Li, H.C.; Liou, S.S.; Shie, M.T. Mechanism of plastic deformation of powder metallurgy metal matrix composites of Cu–Sn/SiC and 6061/SiC under compressive stress. Mater. Sci. Eng. A. 2004, 373, 363–369. [Google Scholar] [CrossRef]
  31. Chen, H.; Alpas, A.T. Sliding wear map for the magnesium alloy Mg-9Al-0.9 Zn (AZ91). Wear 2000, 246, 106–116. [Google Scholar] [CrossRef]
  32. Majzoobi, G.; Soori, M. Fretting and plain fatigue behavior of Al 7075-T651 at elevated temperatures. Proc. Inst. Mech. Eng. J. Eng. Tribol. 2013, 227, 1386–1398. [Google Scholar] [CrossRef]
  33. Sato, Y.S.; Kokawa, H.; Enomoto, M.; Jogan, S. Microstructural evolution of 6063 aluminium during friction-stir welding. Metall. Mater. Trans. A. 1999, 30, 2429–2437. [Google Scholar] [CrossRef]
  34. Bauri, R.; Yadav, D.; Shyam Kumar, C.N.; Balaji, B. Tungsten particle reinforced Al 5083 composite with high strength and ductility. Mater. Sci. Eng. A. 2015, 620, 67–75. [Google Scholar] [CrossRef]
  35. Kumar, H.; Prasad, R.; Srivastava, A.; Vashista, M.; Khan, M.Z. Utilisation of industrial waste (Fly ash) in synthesis of copper based surface composite through friction stir processing route for wear applications. J. Clean. Prod. 2018, 196, 460–468. [Google Scholar] [CrossRef]
Figure 1. Schematic diagram showing surface blind holes deposition method.
Coatings 10 00541 g001
Figure 2. The FESEM micrographs with magnification of 5000× of (a) Run 20 and (b) Run 9 AA7075-SiC/ fly ash (FA) surface composites.
Coatings 10 00541 g002
Figure 3. The SEM micrographs of Run 9 AA7075-SiC/FA composite showing (a) stir zone cross-sectional view (b) (300× magnification) agglomeration of FA/SiC particles in the stir zone area (c) (high magnification 8000×) clusters of FA/SiC particles interlocked and agglomerated region separation grain boundaries.
Coatings 10 00541 g003
Figure 4. The SEM micrographs of Run 20 AA7075-SiC/FA composite showing (a) stir zone cross-sectional view (b,c) (2000× magnification) FA/SiC particles distribution in the stir zone.
Coatings 10 00541 g004
Figure 5. FESEM-EDX analysis of Run 20-AA7075-SiC/fly ash composite.
Coatings 10 00541 g005
Figure 6. SEM-Mapping analysis of Run 20-AA7075-SiC/fly ash composite.
Coatings 10 00541 g006
Figure 7. Effect of tool rotational speed and reinforcement volume percentage on the wear rate of AA7075-SiC/fly ash composites (a) 3D surface and (b) contour plot.
Coatings 10 00541 g007
Figure 8. Effect of tool rotational speed and reinforcement hybrid ratio on the wear rate of AA7075-SiC/fly ash composites (a) 3D surface and (b) contour plot.
Coatings 10 00541 g008
Figure 9. Effect of tool rotational speed and traverse speed on the wear rate of AA7075-SiC/fly ash composites (a) 3D surface and (b) contour plot.
Coatings 10 00541 g009
Figure 10. SEM mapping analysis on the wear tracks of Run 20 AA7075-SiC/fly ash surface composite.
Coatings 10 00541 g010
Figure 11. SEM micrographs of the wear tracks of AA7075-T651 base alloy (a) magnification 100× and (b) magnification 1000×.
Coatings 10 00541 g011
Figure 12. SEM micrographs of the wear tracks on Run 20 AA7075-SiC/fly ash surface composite samples (a) magnification 100× and (b) magnification 300×.
Coatings 10 00541 g012
Figure 13. SEM micrographs of the wear tracks on Run 9 AA7075-SiC/fly ash surface composite samples (a) magnification 100× and (b) magnification 500×.
Coatings 10 00541 g013
Figure 14. Effect of tool traverse speed and hybrid ratio on the wear rate of AA7075-SiC/fly ash composites (a) 3D surface and (b) contour plot.
Coatings 10 00541 g014
Figure 15. Effect of tool rotational speed and traverse speed on the wear rate of AA7075-SiC/fly ash composites (a) 3D surface and (b) contour plot.
Coatings 10 00541 g015
Figure 16. Effect of tool traverse speed and reinforcement volume percentage on the wear rate of AA7075-SiC/fly ash composites (a) 3D surface and (b) contour plot.
Coatings 10 00541 g016
Table 1. Independent parameters and their levels.
ParameterLevel 1Level 2Level 3
Tool Rotational Speed (w rpm)50010001500
Tool Traverse Speed (v mm/min)203040
Reinforcement Hybrid Ratio (HR)60:4075:2590:10
Reinforcement Volume Percentage (vol.%)4812
Table 2. Wear rate (mg/m) and microhardness (HV) of AA7075-SiC/fly ash composites.
Run
No.
A: w-Tool
Rotational
Speed (rpm)
B: v-Tool Traverse Speed (mm/min)C: HR-Hybrid RatioD: vol.%Wear Rate
(mg/m)
Micro
Hardness
(HV)
1500206040.02507184.95
21500206040.02475209.50
3500406040.01768206.45
41500406040.02299184.10
5500209040.01383147.85
61500209040.01636170.95
7500409040.01432164.90
81500409040.01349143.70
95002060120.03360160.10
1015002060120.02210152.65
115004060120.01277210.34
1215004060120.01415213.45
135002090120.02823204.20
1415002090120.02289225.45
155004090120.02356241.20
1615004090120.01591230.12
17500307580.02652191.95
181500307580.02829175.12
191000207580.01415158.65
201000407580.01240207.75
211000306080.01841172.40
221000309080.01315186.85
231000307540.02742194.35
2410003075120.03095216.76
251000307580.02083186.12
261000307580.02134192.56
271000307580.02108188.32

