Article

New Approach to Produce a Nanocrystalline Layer on Surface of a Large Size Pure Titanium Plate

Key Laboratory of Electromagnetic Processing of Materials, Ministry of Education, Northeastern University, Shenyang 110004, China
*
Author to whom correspondence should be addressed.
Coatings 2020, 10(5), 430; https://doi.org/10.3390/coatings10050430
Submission received: 9 April 2020 / Revised: 22 April 2020 / Accepted: 24 April 2020 / Published: 27 April 2020

Abstract

:
It was demonstrated that the mechanical shot peening (MSP) technique was a viable way to obtain a nanocrystalline layer on a large size pure titanium plate due to the MSP provided for severe plastic deformation (SPD) of surface high velocity balls impacting. The MSP effects of various durations in producing the surface nanocrystalline layer was characterized by optical microscope (OM), X-ray diffraction (XRD), transmission electron microscope (TEM), and Vickers micro-hardness tester. The results showed that the thickness of the SPD layer gradually increased with the MSP processing time increase, but saturated at 230 μm after 30 min. The average grain size was refined to about 18.48 nm in the nanocrystalline layer. There was equiaxed grain morphology with random crystallographic orientation in the topmost surface. By comparing with the nanocrystalline layer, acquired by surface mechanical attrition treatment (SMAT), the microstructure and properties of the nanocrystalline layer acquired by MSP was evidently superior to that of the SMAT, but the production time was cut to about a quarter of the time used for the SMAT method.

1. Introduction

Titanium and its alloys have attracted abundant interests because of their exceptional performance, such as high specific strength, low density, exceptional corrosion resistance, and biocompatibility, compared with conventional materials [1,2,3,4]. However, some performances and working reliability of titanium and its alloys still need to be enhanced due to the continuous development of technology [5,6]. It is generally known that material failures such as wear, corrosion, and fretting fatigue are extremely susceptible to the microstructure and properties of the material surface [7]. Hence, it would be considerably effective to utilize some surface modification to improve the material properties on the surface of the part. Since the concept of surface nanocrystallization (SNC) was firstly proposed by Lu et al. in 1999 [8], a variety of SNC methods, such as ultrasonic shot peening (USSP) [9], high energy shot peening (HESP) [10], equal-channel angular pressing (ECAP) [11], high pressure torsion (HPT) [12], surface mechanical grinding treatments (SMGT) [13], SMAT [14], etc. were sequentially developed by material scientists. Of the above-mentioned methods, surface mechanical attrition treatment (SMAT) is the most widely applied to produce nanocrystalline layer on various materials surface. The SNC process of SMAT utilizes several balls (Φ2.0–8.0 mm) that repeatedly and concentratedly impact on the surface of a workpiece [15,16,17]. The impacts uninterruptedly input compressive stresses and work hardenings to the surface region of the workpiece, which can refine the crystal particle to the orders of nanometer. The mechanical properties of materials, such as fatigue strength, hardness, and yield stress, can be dramatically enhanced through the SMAT process in terms of the Hall–Petch relationship [18].
Although the SMAT enables materials to possess a nanocrystalline layer with a certain thickness, it can merely deal with small workpieces with a regular geometric shape and seems powerless in dealing with plates with a large size [19]. Furthermore, using SMAT to produce a nanocrystalline layer with a certain thickness will cost a long processing time, which is not appropriate in industrial production. As an extension of the SMAT technique, mechanical shot peening (MSP) technique is a new SNC approach that was developed in industrial production. In contrast to the SMAT technique of impacting balls moving together with the specimen, the impacting balls of the MSP technique are driven by a piston in the state of high frequency vibration to impact the static specimen. By means of multiple piston unit joints, a nanocrystalline layer on a large size plate can be obtained by the MSP technique. The SNC principle of the MSP has many similarities with that of the SMAT, which has been discussed in former literatures [20,21]. By altering MSP parameters, which mainly includes the amount or size of shot balls, processing time, and vibration frequency, various microstructures from nanometer-sized grains to sub-micrometer-sized and micrometer-sized crystallites with the deformed layer can be acquired. Therefore, the global mechanical performance can be markedly optimized by the formation of a surface nanocrystalline layer, and the interior materials still have exceptional ductility and elasticity.
The objective of this paper is to understand the effect of the MSP technique in inducing the nanocrystalline layer on large size titanium plates. The pure titanium is selected as the experimental material due to its low cost and high adaptability compared with titanium alloys. For this reason, the microstructure, grain morphology, grain size, surface morphology, and microhardness were investigated by optical microscope (OM), X-ray diffraction (XRD), transmission electron microscope (TEM), Vickers micro-hardness tester, and reciprocating sliding wear tester.

2. Experimental

2.1. Sample Preparation

The annealing rolled titanium plate was cut to 50 mm × 50 mm × 3 mm in size by wire cut electrical discharge machining (WEDM, DK7745, Jiangsu, China) in this experiment. The chemical compositions (wt.%) are shown in Table 1. Before the MSP process, all the titanium plates were processed and surfaces were polished to a fine finish with different silicon carbide abrasive papers.

2.2. MSP Treatment

The processing of SMAT and MSP have been reported in detail in our previous paper [22,23]. The facility of MSP includes a high-frequency engine with the rate of 3800 rad/min and output power of 1800 W, a linkage device made up of eccentric gear and linkage, and a vibration piston and piston chamber composed of special processed Cr12MoV steel. The piston includes impact pins (dimensions: Φ1.5 mm × 2.0 mm) fixed on its head. The impact pins are composed of WC. Within a gap of 0.05 mm between the vibration piston and the piston chamber, the piston (dimensions: Φ50 mm × 80 mm) can move without difficulty. The impact balls are made from GCr15 steel whose diameter is 6.0 mm. The distance between the top of impact balls and the titanium plate is approximately 25 mm. The impact pins can obtain large amounts of kinetic energy from the high-frequency motor and offer eccentric impacts with impact balls. Therefore, the impact balls will impact the plate surface, not with vertical impacts but in multiple directions. As the piston high-frequency reciprocating motion brings about the system temperature to rise, the water cooling tubes in the piston chamber are employed to reduce the system temperature. Additionally, the argon flow is used as protective gas in the piston chamber, so as to prevent the titanium plate from oxidation in successive impacts. In order to evaluate the effect of different MSP durations in producing the nanocrystalline layer on titanium plates, the processing time is 5, 10, 20, and 30 min respectively. The different processing times are controlled by the speed of plate movement.

2.3. Microstructural Characterization

To verify the effect of microstructure evolution after various MSP processing times, the cross-sectional specimens of the pure titanium plate were prepared for metallographic examination using standard procedures and etched in Kroll solution with 5% HF, 5% HNO3, and 90% H2O for about 30 s at room temperature. The microstructures were observed by an optical microscope (OM, Leica DMI 5000M (Wetzlar, Germany), and the phase composition was analyzed with X’pert Pro PW3040/60 X-ray diffraction (XRD, PANalytical, Lelyweg, EA Almelo, Netherlands) using Cu Kα radiation (40 KV, 40 mA, λ = 0.15406 nm). Small angular increments of 2θ = 0.03° were taken to measure the intensity of each Bragg diffraction peak. The pattern of the phase was obtained at room temperature. The average grain size was calculated by the Debye-Scherrer formula from XRD patterns. The thickness of the nanocrystalline layer was observed by a field emission gun scanning electron microscope (FE-SEM, Zeiss Ultra 55, Jena, Freistaat Thüringen, Germany). The grain morphology and average grain size were characterized by a transmission electron microscope (TEM, TECNAI G20, FEI, Hillsboro, OR, USA). The foil samples for TEM observation were prepared by grinding and mechanical polishing using an ion beam thinner (Gatan Model 695, Pleasanton, CA, USA).

2.4. Surface Morphology Characterization

The surface 3-dimensional morphology was provided by an optical microscope in 50× magnification (OM, Leica DVM6, Wetzlar, Germany). The surface roughness value was calculated by a surface profiler (Alpha-Step IQ, Berlin, Germany). Each measurement was implemented in scan length 4000 μm with a scan rate of 50 μm/s. With regards to each specimen, the surface roughness values at five different locations were calculated, so as to prevent surface roughness variation with the location. All specimens were cleaned up using 100% ethanol, and dried prior to the observation and measurement.

2.5. Hardness

The micro-hardness was employed to clarify the hardening effect in depth. A Vickers micro-hardness tester (Wolpert L101 MVD, Buehler, Lake Bluff, IL, USA) was utilized to measure the surface hardness and hardness curve along the depth under the load of 25 g and the duration time of 10 s. The micro-hardness values were computed by the measured geometry of the Vickers pyramid import. Each measurement was repeated five times, and the average value was adopted.

3. Results and Discussion

3.1. Microstructural Characterization of the MSP Treated Sample

Figure 1 shows the microstructure evolution induced by MSP and SMAT for various processing times. As seen from Figure 1a–d, a SPD layer that occurs in the surface can be clearly identified after 5 min of MSP treatment. The thickness of the SPD layer becomes thicker as processing time is prolonged, but obtains a stable thickness of 200–230 μm after 20 min. In the SPD layer, a large number of twin crystals can be observed. The pure titanium is a hexagonal close-packed structure, and generally twin deformation is used as a form of initial deformation. As the amount of deformation accumulates, the slip deformation occurs. Therefore, under the metallographic microscope, only mechanical twins can be seen, and slip deformation can be observed in the area where the dislocation density is highly accumulated. It was reported that the main deformation form of the pure titanium is the mechanical twins in previous studies [15,24,25,26]. This result has similarity with previous reports. Furthermore, grain boundaries gradually become indistinguishable from the undeformed substrate to the topmost surface layer, which is the result of the grain size gradually decreasing with depth. Figure 1e–h shows the microstructure evolution induced by SMAT. In contrast with the SPD layer produced by MSP, the SPD layer produced by SMAT obtains a stable thickness of 50–60 μm after 60 min. The thinner SPD layer can be attributed to the fact that impact stress provided by SMAT is lower than that of MSP. The longer durations to obtain a stable SPD layer can be attributed to the low impact frequency provided by SMAT. Because the nanocrystalline layer was not appropriately observed in low magnification OM, the microstructural observation of the nanocrystalline layer was performed by SEM.
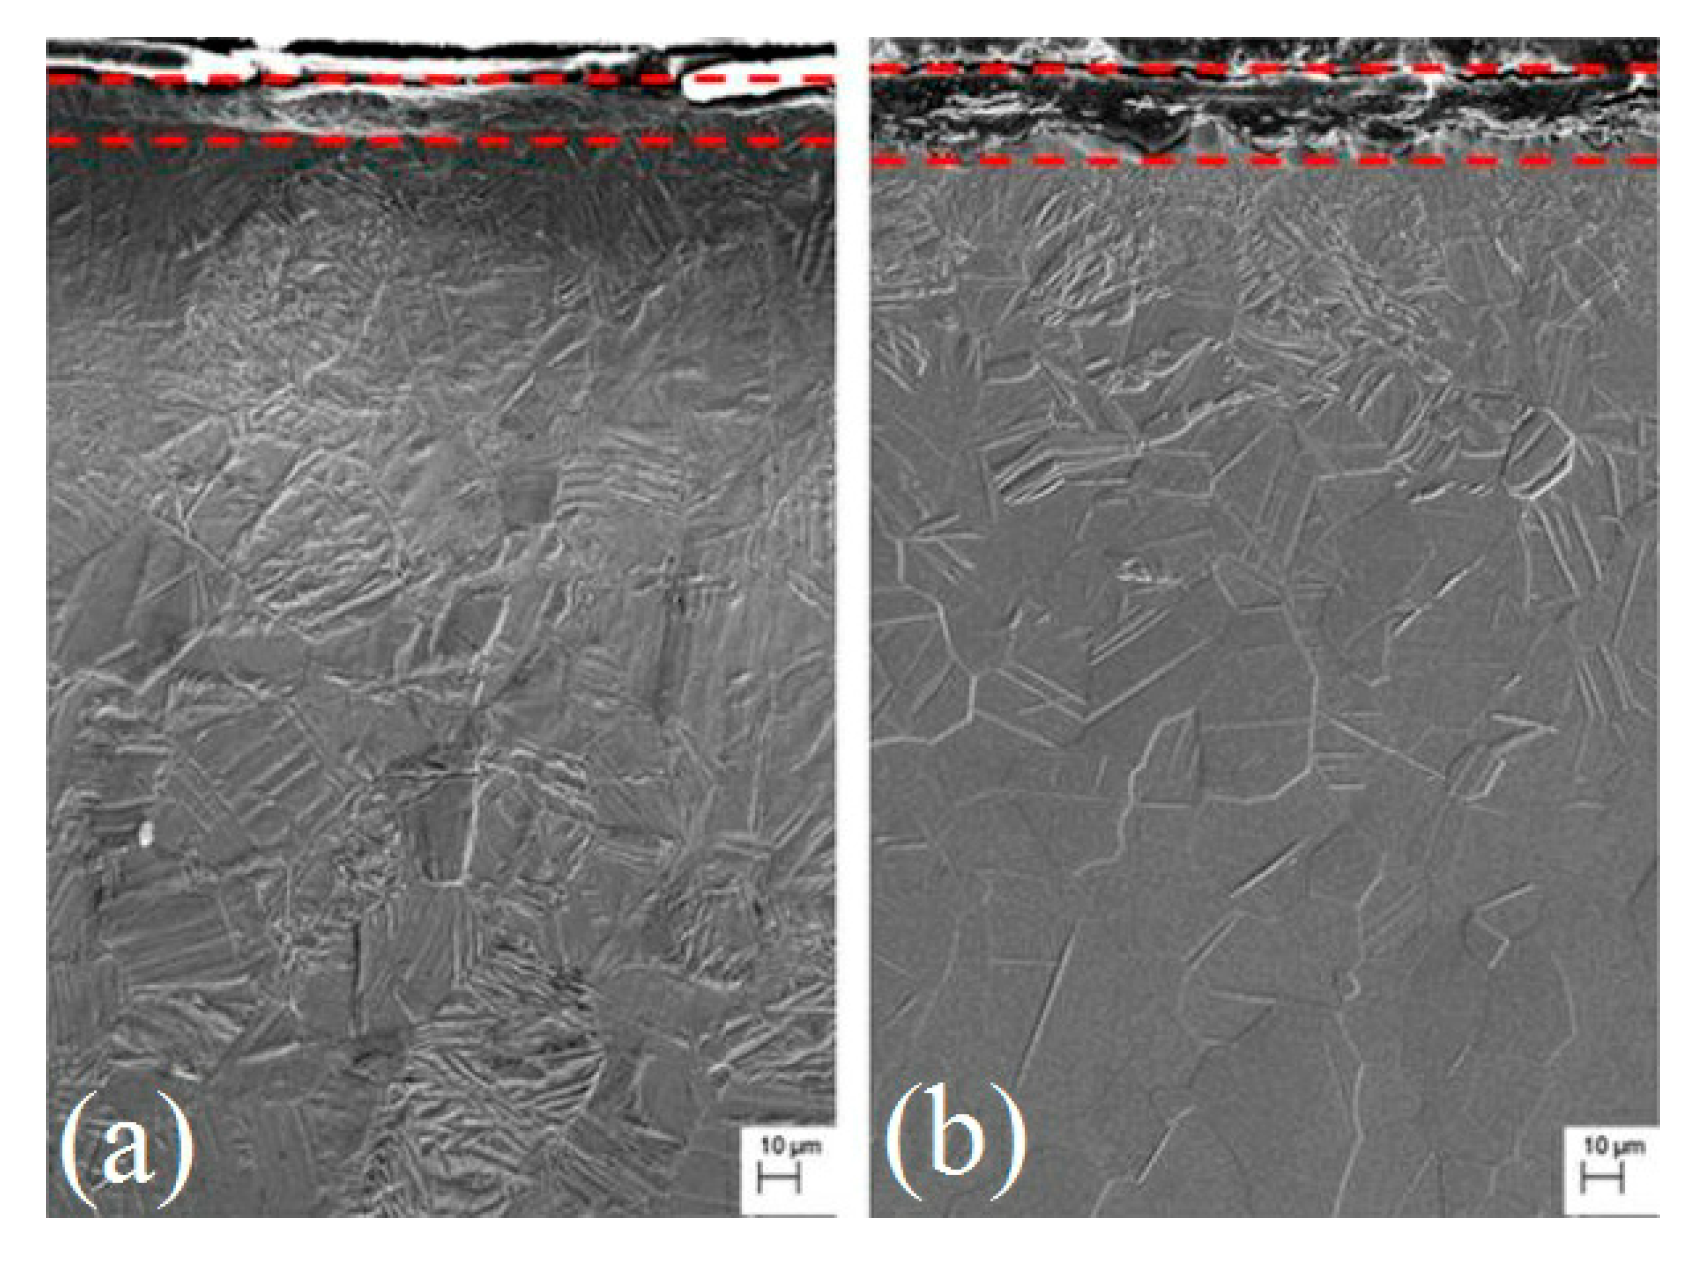
Figure 2 shows the nanocrystalline layer (between red lines) produced by MSP and SMAT. As seen from Figure 2a, a very thin nanocrystalline layer of 10 μm is formed on the top surface after 30 min of MSP treatment. The nanocrystalline layer is clearly distinguished from the SPD region by a dividing line. The grain boundaries are not clearly distinguished due to the grain size refinement of nanometric grade. The thickness of the nanocrystalline layer is not uniform, which indicates the heterogeneity of SPD induced by the SNC process. In addition to the thickness, the nanocrystalline layer produced by SMAT is the similar to that of the MSP shown in the Figure 2b. The thicker nanocrystalline layer can be attributed to the longer SNC processing time of SMAT.
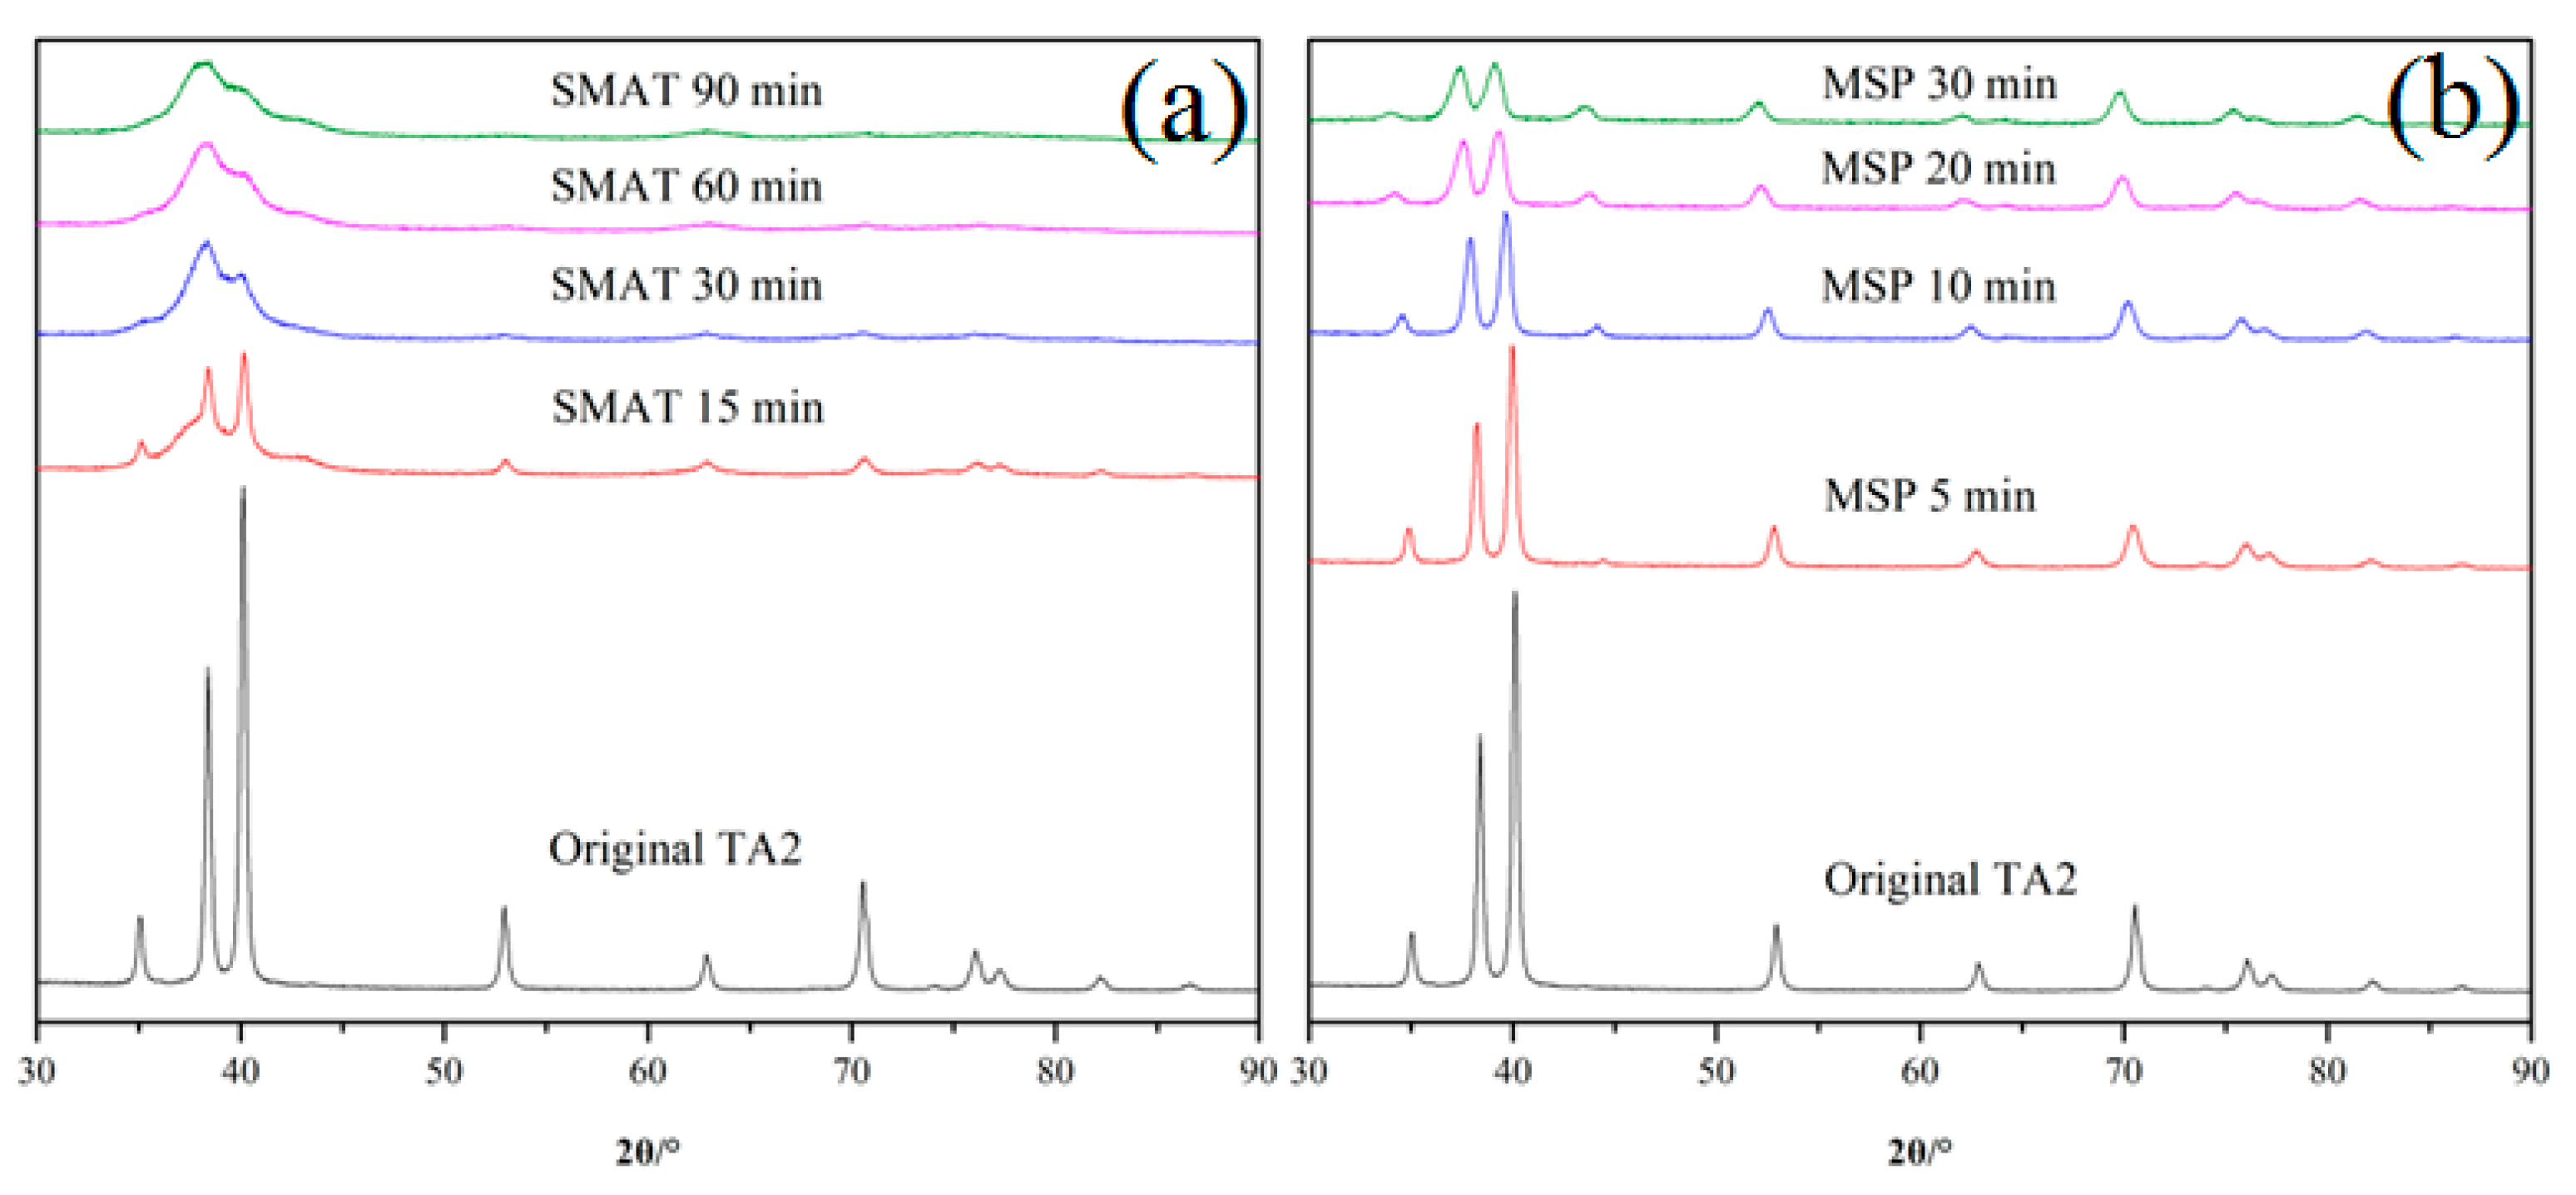
Figure 3 shows XRD patterns of the titanium specimen after various processing conditions. As seen from Figure 3a, there is significant broadening of the Bragg reflections after 30 min of MSP treatment, compared to the annealed specimen. This result can be attributed to the grain refinement, lattice deformation, and micro-strain development. Except for Fe phase, all of Bragg reflections belong to the α-Ti phases. There is no evidence about the appearance of the new phase and the disappearance of the original phases during the MSP process. With the extension of the MSP processing time, the Bragg reflection belonging to the Fe phase gradually became obvious. It can be attributed to the employment of iron-based materials, such as piston chamber, piston, and impact balls. The uninterrupted impacts cause iron dust to fall off their matrix and induces the specimen surface in MSP processing. In contrast with the MSP, similar Bragg reflections broadening can be observed after SMAT treatment shown in the Figure 3b. However, the Fe phase cannot be observed. This was attributed to titanium-based materials used as impact balls, and a milling container prevents the specimen surface from impurity contamination. Besides, some Bragg reflections cannot be discerned due to the large degree of broadening after 90 min SMAT treatment. Because the degree of Bragg reflections broadening can qualitatively evaluate the degree of grain refinement in 0–15 μm depth, the grain refinement induced by SMAT was more evident than that induced by MSP for the same processing time. This result can be attributed to the inputted stress of SMAT concentrates in the range of very thin depths. The concentrated stress more easily induces grain refinement. The oxides cannot be observed in either Figure 3a,b. Therefore, the argon atmosphere prevents specimen from oxidation.
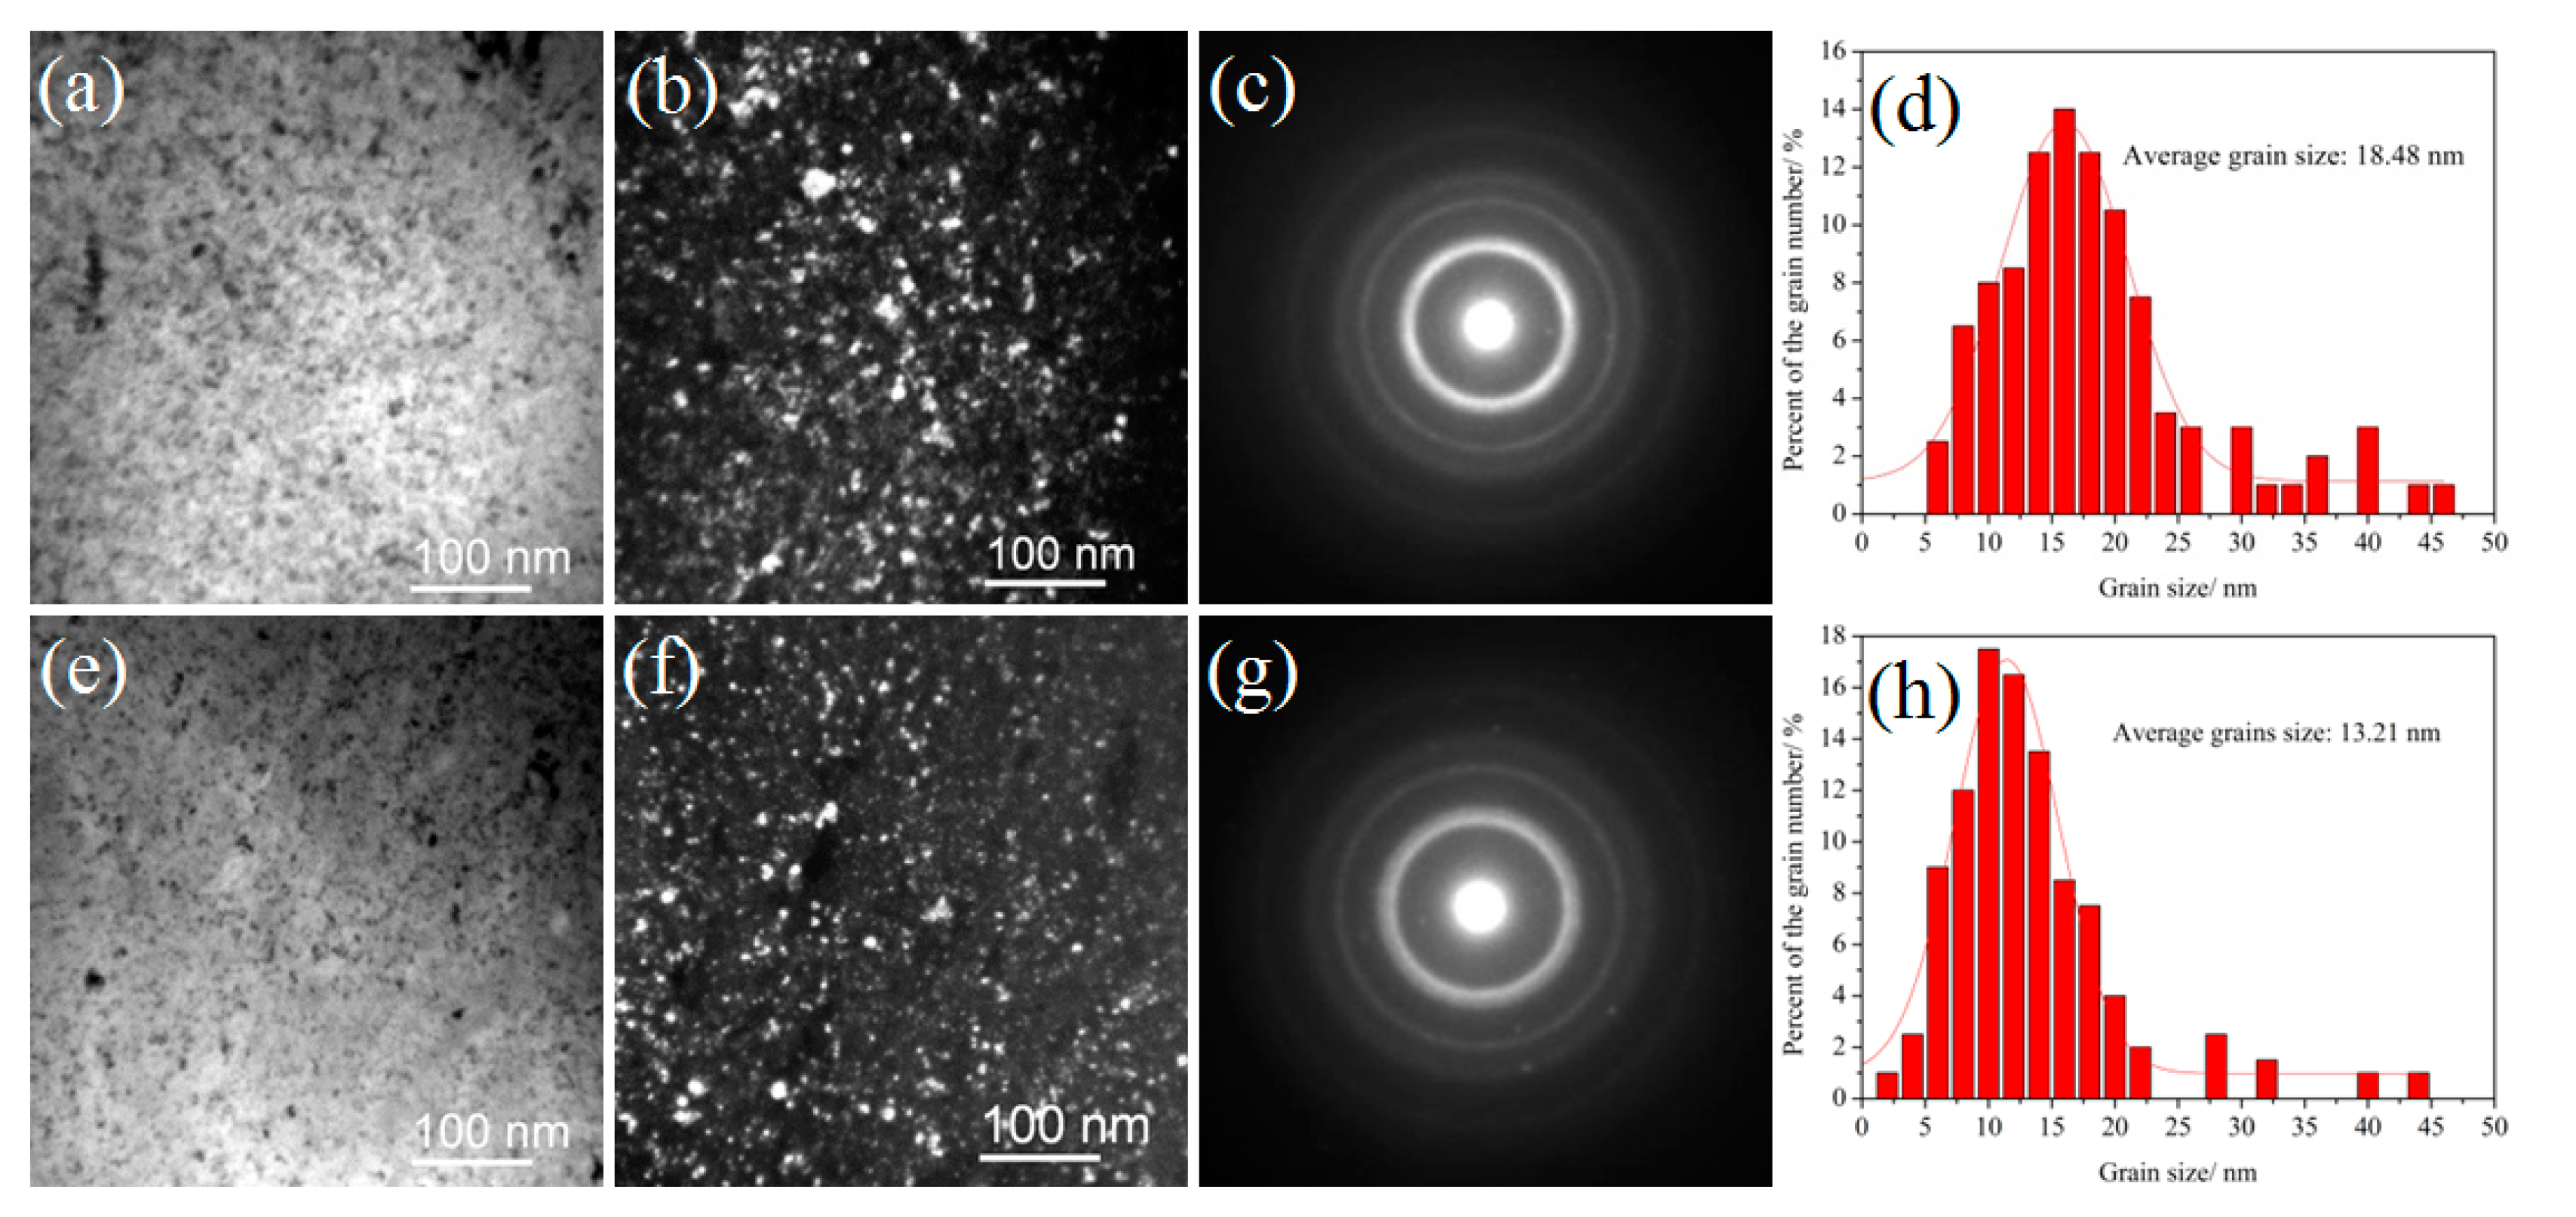
TEM observations are utilized in order to have more information about grain morphology and average grain size of the topmost surface. Figure 4 shows the TEM images with their selected area electron diffraction (SAED) patterns and the statistic grain size distribution after 30 min MSP and 90 min SMAT. As seen from Figure 4a, the grains present equiaxed and ultrafine morphology. Its corresponding SAED patterns present continuous rings without spots, shown in Figure 4c, which implies that the grains are characterized by random crystallographic orientation. The histogram of grain size distribution, by randomly measuring a large number of grain sizes from Figure 4b, is characterized by a normal logarithmic distribution with a narrow size distribution, as shown in the Figure 4d. As seen from Figure 4d, the grain size distribution is mostly in the range of 5–25 nm, and the percentage of the grains with grain size below 25 nm is about 85%. The minimum grain size, maximum grain size, and average gains sizes are 7.5, 47.5, and 18.48 nm, respectively. According to the above analysis, the degree of grain refinement under experimental parameters presented in this paper, i.e., the average grain size of the surface layer produced by utilizing MSP treatment is 18.48 nm. As seen from Figure 4e, a similar grain refinement can be observed after 90 min of SMAT. The SAED patterns present continuous rings, meaning that the crystallographic orientations of Ti nanocrystalline is random after SMAT treatment. However, the minimum grain size, maximum grain size, and average gains sizes are 1.9, 44.5, and 13.21 nm, respectively, as obtained in Figure 4f. Besides, as shown in Figure 4h, the histogram of grain size distribution is concentrated in the range of 0–20 nm, and the peak of the fitting curve moves in the direction of the smaller grain size. This result implies that grains in the topmost surface of the SMAT specimen are finer than that of the MSP. Therefore, grain refinement induced by SMAT is more effective than MSP. This result can be attributed to the longer SNC process time.

3.2. Surface Morphology and Roughness

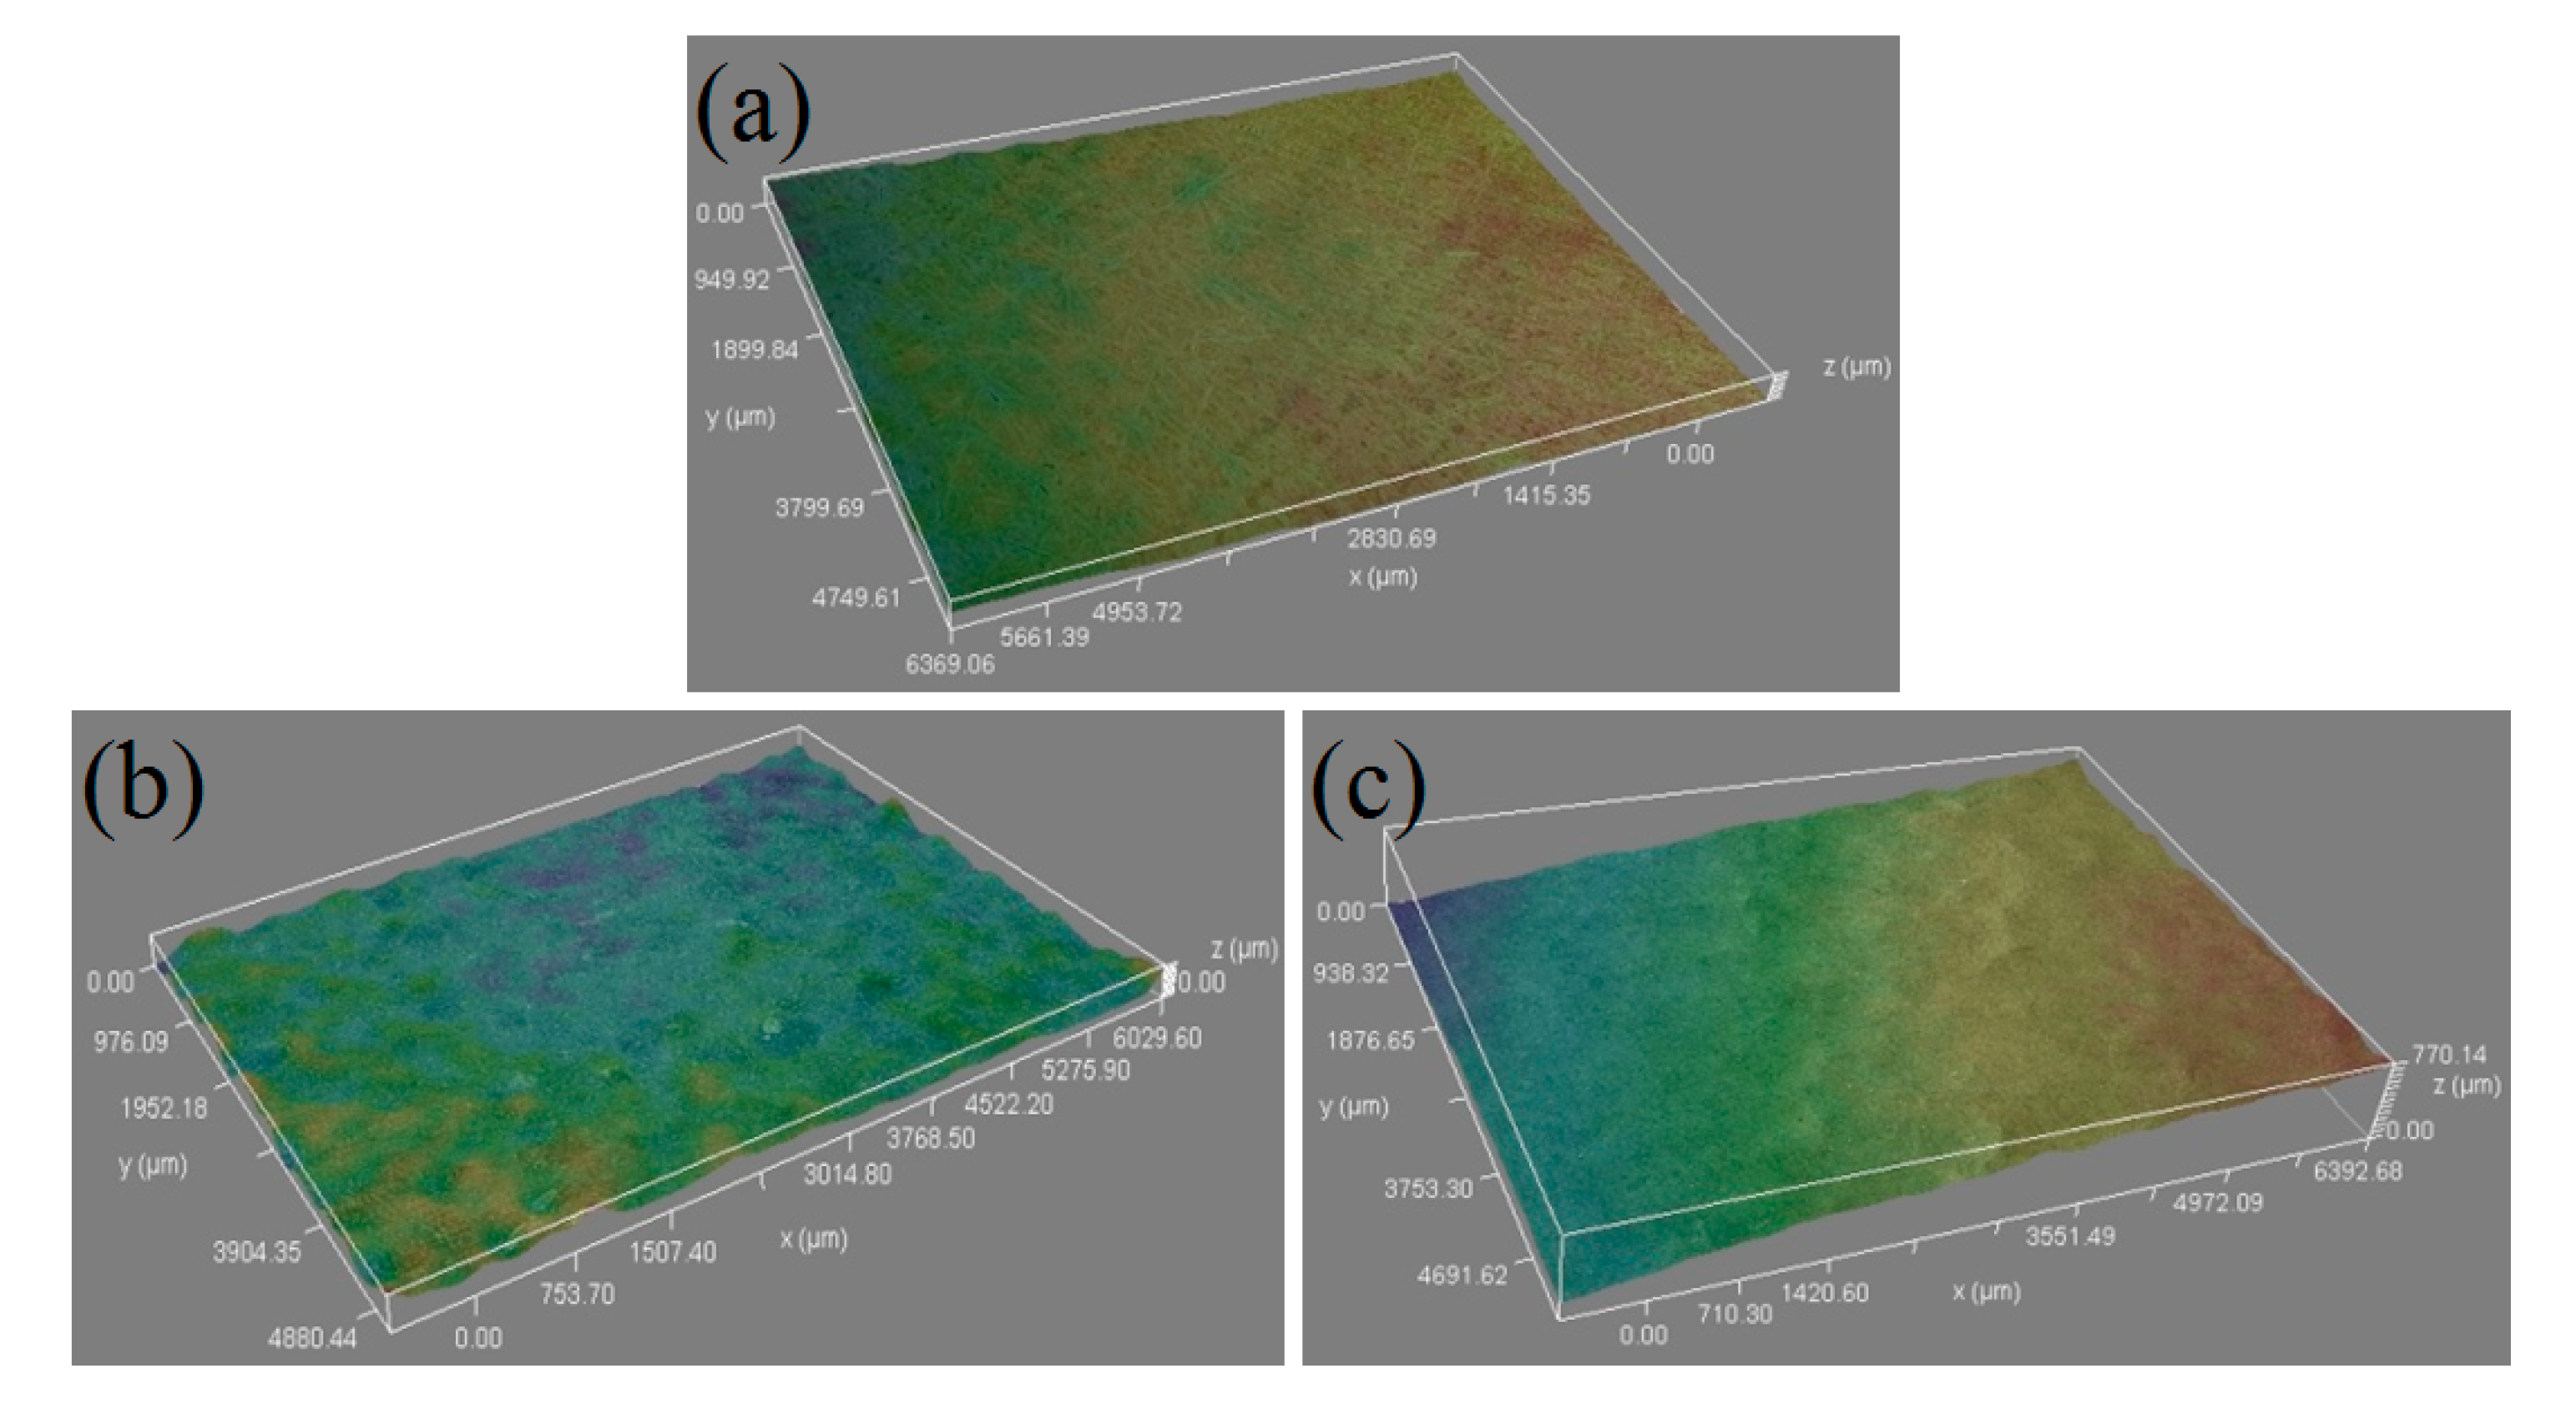
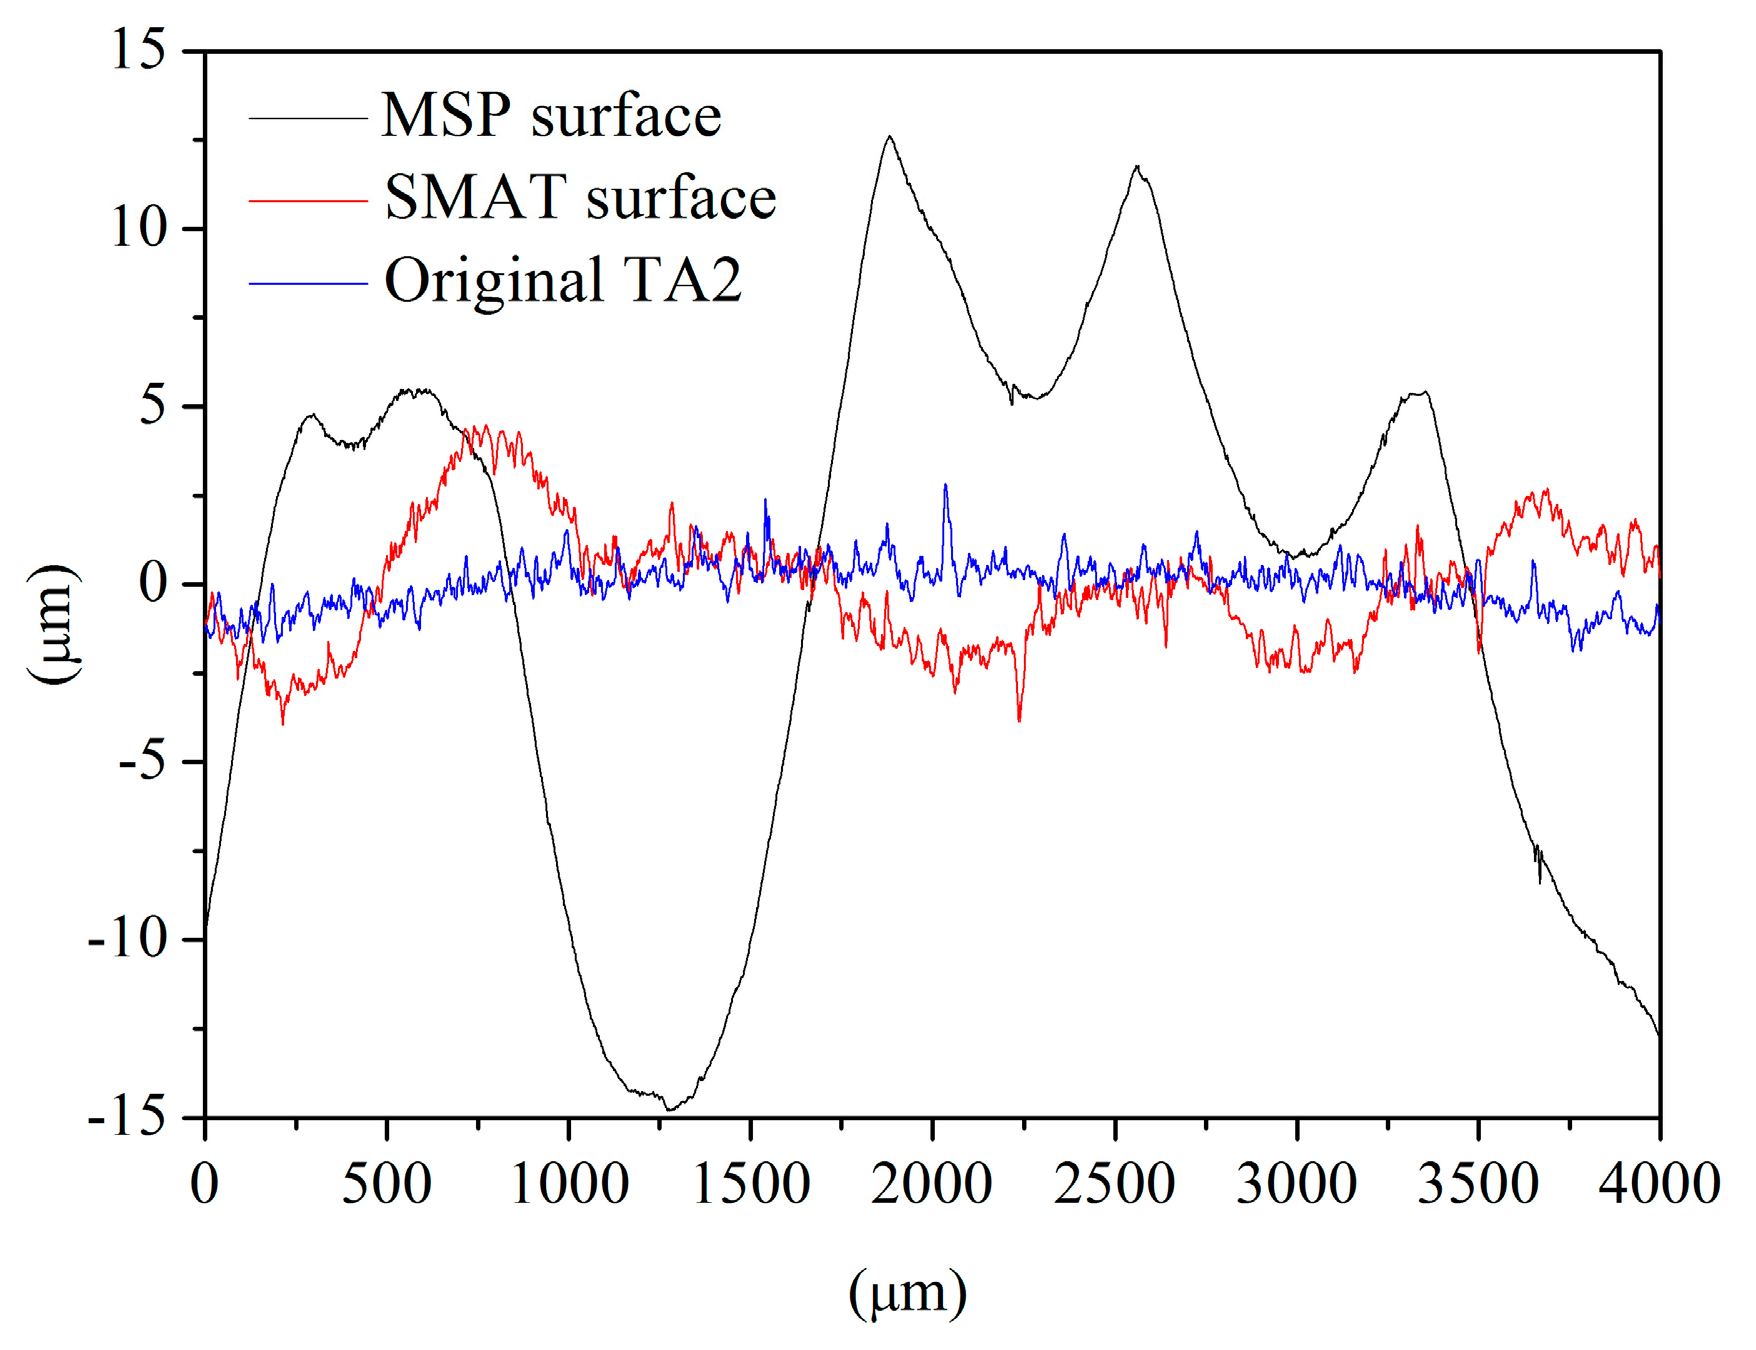
Figure 5 presents the surface morphologies before and after various treatment conditions. The 3-dimensional (3D) morphologies before and after various treatment conditions are shown in Figure 6. As seen from Figure 6a and Figure 7, the surface of the industrial pure titanium (TA2) plate polished by 1000# silicon carbide paper before SNC treatment is smooth, and the grinding cracks are close to homogeneous in alignment. The surface roughness Ra and Rq values are 0.3 μm and 0.4 μm, respectively, as shown in Table 2. Figure 6b and Figure 7 show the surface morphology and 3D morphology after 90 min SMAT treatment. As seen from Figure 6b and Figure 7, the SMAT brings about significant changes on surface morphology and surface roughness. The grinding cracks of specimen surfaces disappear, and the surface is covered in craters. Crater formation can be attributed to the high velocity impacts against the surface of the specimen, by plenty of impacting balls during SMAT processing, as characterized by the presence of dark spots. Besides, plenty of pile-ups can be observed surrounding the craters. The highest point of the pile-ups and the lowest point of the craters become the peak and valley of the surface. The altitude intercept between the peak and valley leads the increase of surface roughness. The Ra and Rq values increase from 0.3 and 0.4 μm to 0.45 and 0.56 μm, respectively. Because the surface roughness increases less than 50%, the surface morphology remains relatively smooth. The surface morphology and 3D morphology after MSP treatment are shown in Figure 6c and Figure 7. As seen from Figure 6c and Figure 7, the higher kinetic energy impacts of MSP treatment resulted in the bigger diameter of craters, and the pile-ups surrounding the carters become more uplift. It is generally known that the more severe the impacts, the rougher the treated surface. Consequently, the MSP treated specimen presents more roughness on its surface than that of SMAT treated specimen. The Ra and Rq values of the MSP treated specimen were 0.99 and 1.18, respectively, which was a 300% increase compared with the original TA2. The surface roughness evidently increased due to the high kinetic energy impacts.

3.3. Hardness

Figure 8 compares the hardness variation along the cross-sectional direction induced by MSP and SMAT. Previous studies have shown that the hardness variation, with grain refinement induced by SPD, follows the Hall–Pethch [16,17,18]. According to the conventional Hall–Petch relationship, which was given in [27] and [28]: Hv = Hv0 + Kd − 1/2 (where Hv is the Vickers-hardness, Hv0 is the single crystal Vickers-hardness, K is a constant, and d is grain size). The hardness, Hv, is closely related to grain size, d. As seen from Figure 8, the high kinetic energy impact of MSP produces a thicker work-hardened surface layer and a deeper surface region compared with SMAT. The average hardness of MSP treated surface reaches 580 HV after 30 min of treatment. The work-hardened effect of MSP can be observed at about 180 μm thickness. In contrast with the MSP, the depth of the work-hardened surface layer of SMAT is about 80 μm, which is half of that induced by MSP. However, it is worth noting that the hardness at the topmost surface of the MSP and SMAT are very similar. This phenomenon can be attributed to the formation of nanocrystalline at the impacted surface of both specimens. The similar grain size showed in TEM images was likely to get the similar hardness. Therefore, the high kinetic energy of MSP not only produced a nanocrystalline layer similar to that of the SMAT, but also was expected to produce a thicker work-hardened surface layer and a deeper surface region with large residual compressive stresses, compared to that of SMAT.

4. Conclusion

In summary, the major contribution of this study was offering a new method for obtaining a nanocrystalline layer on a large size plate. The effect of MSP and SMAT on the microstructure evolution, surface roughness, and hardness was investigated. These conclusions can be drawn from the present investigation, as follows:
  • A nanocrystalline layer with a certain thickness was produced on the surface of a large size TA2 plate after 30 min of MSP treatment.
  • The SPD layer thickness and nanocrystalline layer thickness were 230 and 10 μm, respectively. The grains in the topmost surface were 18.48 nm in average size and possess random crystallographic orientations.
  • The surface roughness and work-hardened region of MSP treated specimens was higher than that of SMAT due to the high kinetic energy impacts.
  • The mechanical shot peening (MSP) technique was used as an extension of the SMAT technique applied in industrial production.

Author Contributions

Data curation, Q.Y.; funding acquisition, W.T.; investigation, G.W.; methodology, J.G.; writing–original draft, Y.F. All authors have read and agreed to the published version of the manuscript.

Funding

This research was supported by the National Natural Science Foundation of China (Grant No. U1810109).

Conflicts of Interest

The authors declare that they have no known competing financial interests or personal relationships that could have appeared to influence the work reported in this paper.

References

  1. Kao, W.H.; Su, Y.L.; Horng, J.H.; Huang, H.C.; Yang, S.E. Improved tribological, electrochemical and biocompatibility properties of TI6Al4V alloy by gas-nitriding and Ti-C:H coating. Surf. Coat. Technol. 2015, 283, 70–79. [Google Scholar]
  2. Jelliti, S.; Richard, C.; Retraint, D.; Roland, T.; Chemkhi, M.; Demangel, C. Effect of surface nanocrystallization on the corrosion behavior of Ti-6Al-4V titanium alloy. Surf. Coat. Technol. 2013, 224, 82–87. [Google Scholar]
  3. Bhaskar, P.; Dasgupta, A.; Sarma, V.S.; Mudali, U.K.; Saroja, S. Mechanical properties and corrosion behavior of nanocrystalline Ti-5Ta-1.8Nb alloy produced by cryo-rolling. Mater. Sci. Eng. A 2014, 616, 71–77. [Google Scholar]
  4. Vasylyev, M.A.; Chenakin, S.P.; Yatsenko, L.F. Nitridation of Ti-6Al-4V alloy under ultrasonic impact treatment in liquid nitrogen. Acta Mater. 2012, 60, 6223–6233. [Google Scholar]
  5. Ge, L.L.; Tian, N.; Lu, Z.X.; You, C.Y. Influence of the surface naonocrystallization on the gas nitriding of Ti-6Al-4V alloy. Appl. Surf. Sci. 2013, 286, 412–416. [Google Scholar]
  6. Oliveira, R.M.; Mello, C.B.; Silva, G.; Gonçalves, J.A.N.; Ueda, M.; Pichon, L. Improved properties of Ti6Al4V by means of nitrogen high temperature plasma based ion implantatiom. Surf. Coat. Technol. 2011, 205, 5111–5114. [Google Scholar]
  7. Hassani-Gangaraj, S.M.; Moridi, A.; Guagliano, M.; Ghidini, A.; Boniardi, M. The effect of nitriding, severe shot peening and their combination on the fatigue behavior and micro-structure of a low-alloy steel. Int. J. Fatigue 2014, 62, 67–76. [Google Scholar]
  8. Lu, K.; Lu, J. Surface Nanocrystallization (SNC) of metallic materials-presentation of the concept behind a new approach. J. Mater. Sci. Technol. 1999, 15, 193–197. [Google Scholar]
  9. Marteau, J.; Bigerelle, M.; Mazeran, P.E.; Bouvier, S. Relation between roughness and processing conditions of AISI 316L stainless steel treated by ultrasonic shot peening. Tribol. Int. 2015, 82, 319–329. [Google Scholar]
  10. Li, H.M.; Liu, Y.G.; Li, M.Q.; Liu, H.J. The gradient crystalline structure and microhardness in the treated layer of TC17 via high energy shot peening. Appl. Surf. Sci. 2015, 357, 197–203. [Google Scholar]
  11. Zhang, L.Y.; Ma, A.B.; Jiang, J.H.; Yang, D.H.; Song, D.; Chen, J.Q. Sulphuric acid corrosion of ultrafine-grained mild steel processed by equal-channel angular pressing. Corros. Sci. 2013, 75, 434–442. [Google Scholar]
  12. Dong, F.Y.; Zhang, P.; Pang, J.C.; Ren, Y.B.; Yang, K.; Zhang, Z.F. Strength, damage and fracture behaviors of high-nitrogen austenitic stainless steel processed by high-pressure torsion. Scr. Mater. 2015, 96, 5–8. [Google Scholar]
  13. Yang, L.; Tao, N.R.; Lu, K.; Lu, L. Enhanced fatigue resistance of Cu with a gradient nanograined surface layer. Scr. Mater. 2013, 68, 801–804. [Google Scholar]
  14. Wang, K.; Tao, N.R.; Liu, G.; Lu, J.; Lu, K. Plastic strain-induced grain refinement at the nanometer scale in copper. Acta Mater. 2006, 54, 5281–5291. [Google Scholar]
  15. Sun, J.; Tong, W.P.; Zuo, L.; Wang, Z.B. Low-temperature plasma nitriding of titanium layer on Ti/Al clad sheet. Mater. Des. 2013, 47, 408–415. [Google Scholar]
  16. Yao, Q.T.; Sun, J.; Fu, Y.Z.; Tong, W.P.; Zhang, H. An evaluation of a borided layer formed on Ti-6Al-4V alloy by means of SMAT and low-temperature boriding. Materials 2016, 9, 993. [Google Scholar]
  17. Wang, Z.B.; Tao, N.R.; Li, S.; Wang, W.; Liu, G.; Lu, J.; Lu, K. Effect of surface nanocrystallization on friction and wear properties in low carbon steel. Mater. Sci. Eng. A 2003, 352, 144–149. [Google Scholar]
  18. Lu, K. Nanocrystalline metals crystallized from amorphous solids: Nanocrystallization, structure, and properties. Mater. Sci. Eng. R Rep. 1996, 16, 161–221. [Google Scholar]
  19. Liu, Y.G.; Li, H.M.; Li, M.Q. Characterization of surface layer in TC17 alloy treated by air blast shot peening. Mater. Des. 2015, 65, 120–126. [Google Scholar]
  20. Lu, K.; Hansen, N. Structural refinement and deformation mechanisms in nanostructured metals. Scr. Mater. 2009, 60, 1033–1038. [Google Scholar]
  21. Huang, R.; Han, Y. The effect of SMAT-induced grain refinement and dislocations on the corrosion behavior of Ti-25Nb-3Mo-3Zr-2Sn alloy. Mater. Sci. Eng. C 2013, 33, 2353–2359. [Google Scholar]
  22. Tong, W.P.; Tao, N.R.; Wang, Z.B. Nitriding iron at lower temperatures. Science 2003, 299, 686–688. [Google Scholar] [PubMed] [Green Version]
  23. Yao, Q.T.; Sun, J.; Shen, D.P.; Tong, W.P.; Zuo, L. Large-Scale Synthesis of Nanostructured Nitride Layer on Ti Plate Using Mechanical Shot Peening and Low-Temperature Nitriding. Adv. Eng. Mater. 2017, 19, 1700157. [Google Scholar]
  24. Tao, N.R.; Lu, J.; Lu, K. Surface nanocrystallization by surface mechanical attrition treatment. Mater. Sci. Forum. 2008, 579, 91–108. [Google Scholar] [CrossRef]
  25. Chen, C.H.; Jin, C.; Ren, R.M. The effect of strain rate on the plastic deformation mode of CP-Ti during surface nanocrystallization. Mater. Sci. Forum 2011, 675, 239–242. [Google Scholar] [CrossRef]
  26. Ge, L.; Yuan, Z.; Jing, X.; Lu, Z. Study of pure titanium (TA2) surface nanocrystallization and its thermal stability. Rare Metal Mat. Eng. 2011, 40, 1239–1242. [Google Scholar]
  27. Yang, X.J.; Zhou, J.X.; Ling, X. Influences of surface grain size and gradient variation along depth on fatigue life of metallic materials. Mater. Des. 2013, 43, 454–459. [Google Scholar]
  28. Pande, C.S.; Masumura, R.A. Grain growth and deformation in nanocrystalline materials. Mater. Sci. Eng. A 2005, 409, 125–130. [Google Scholar]
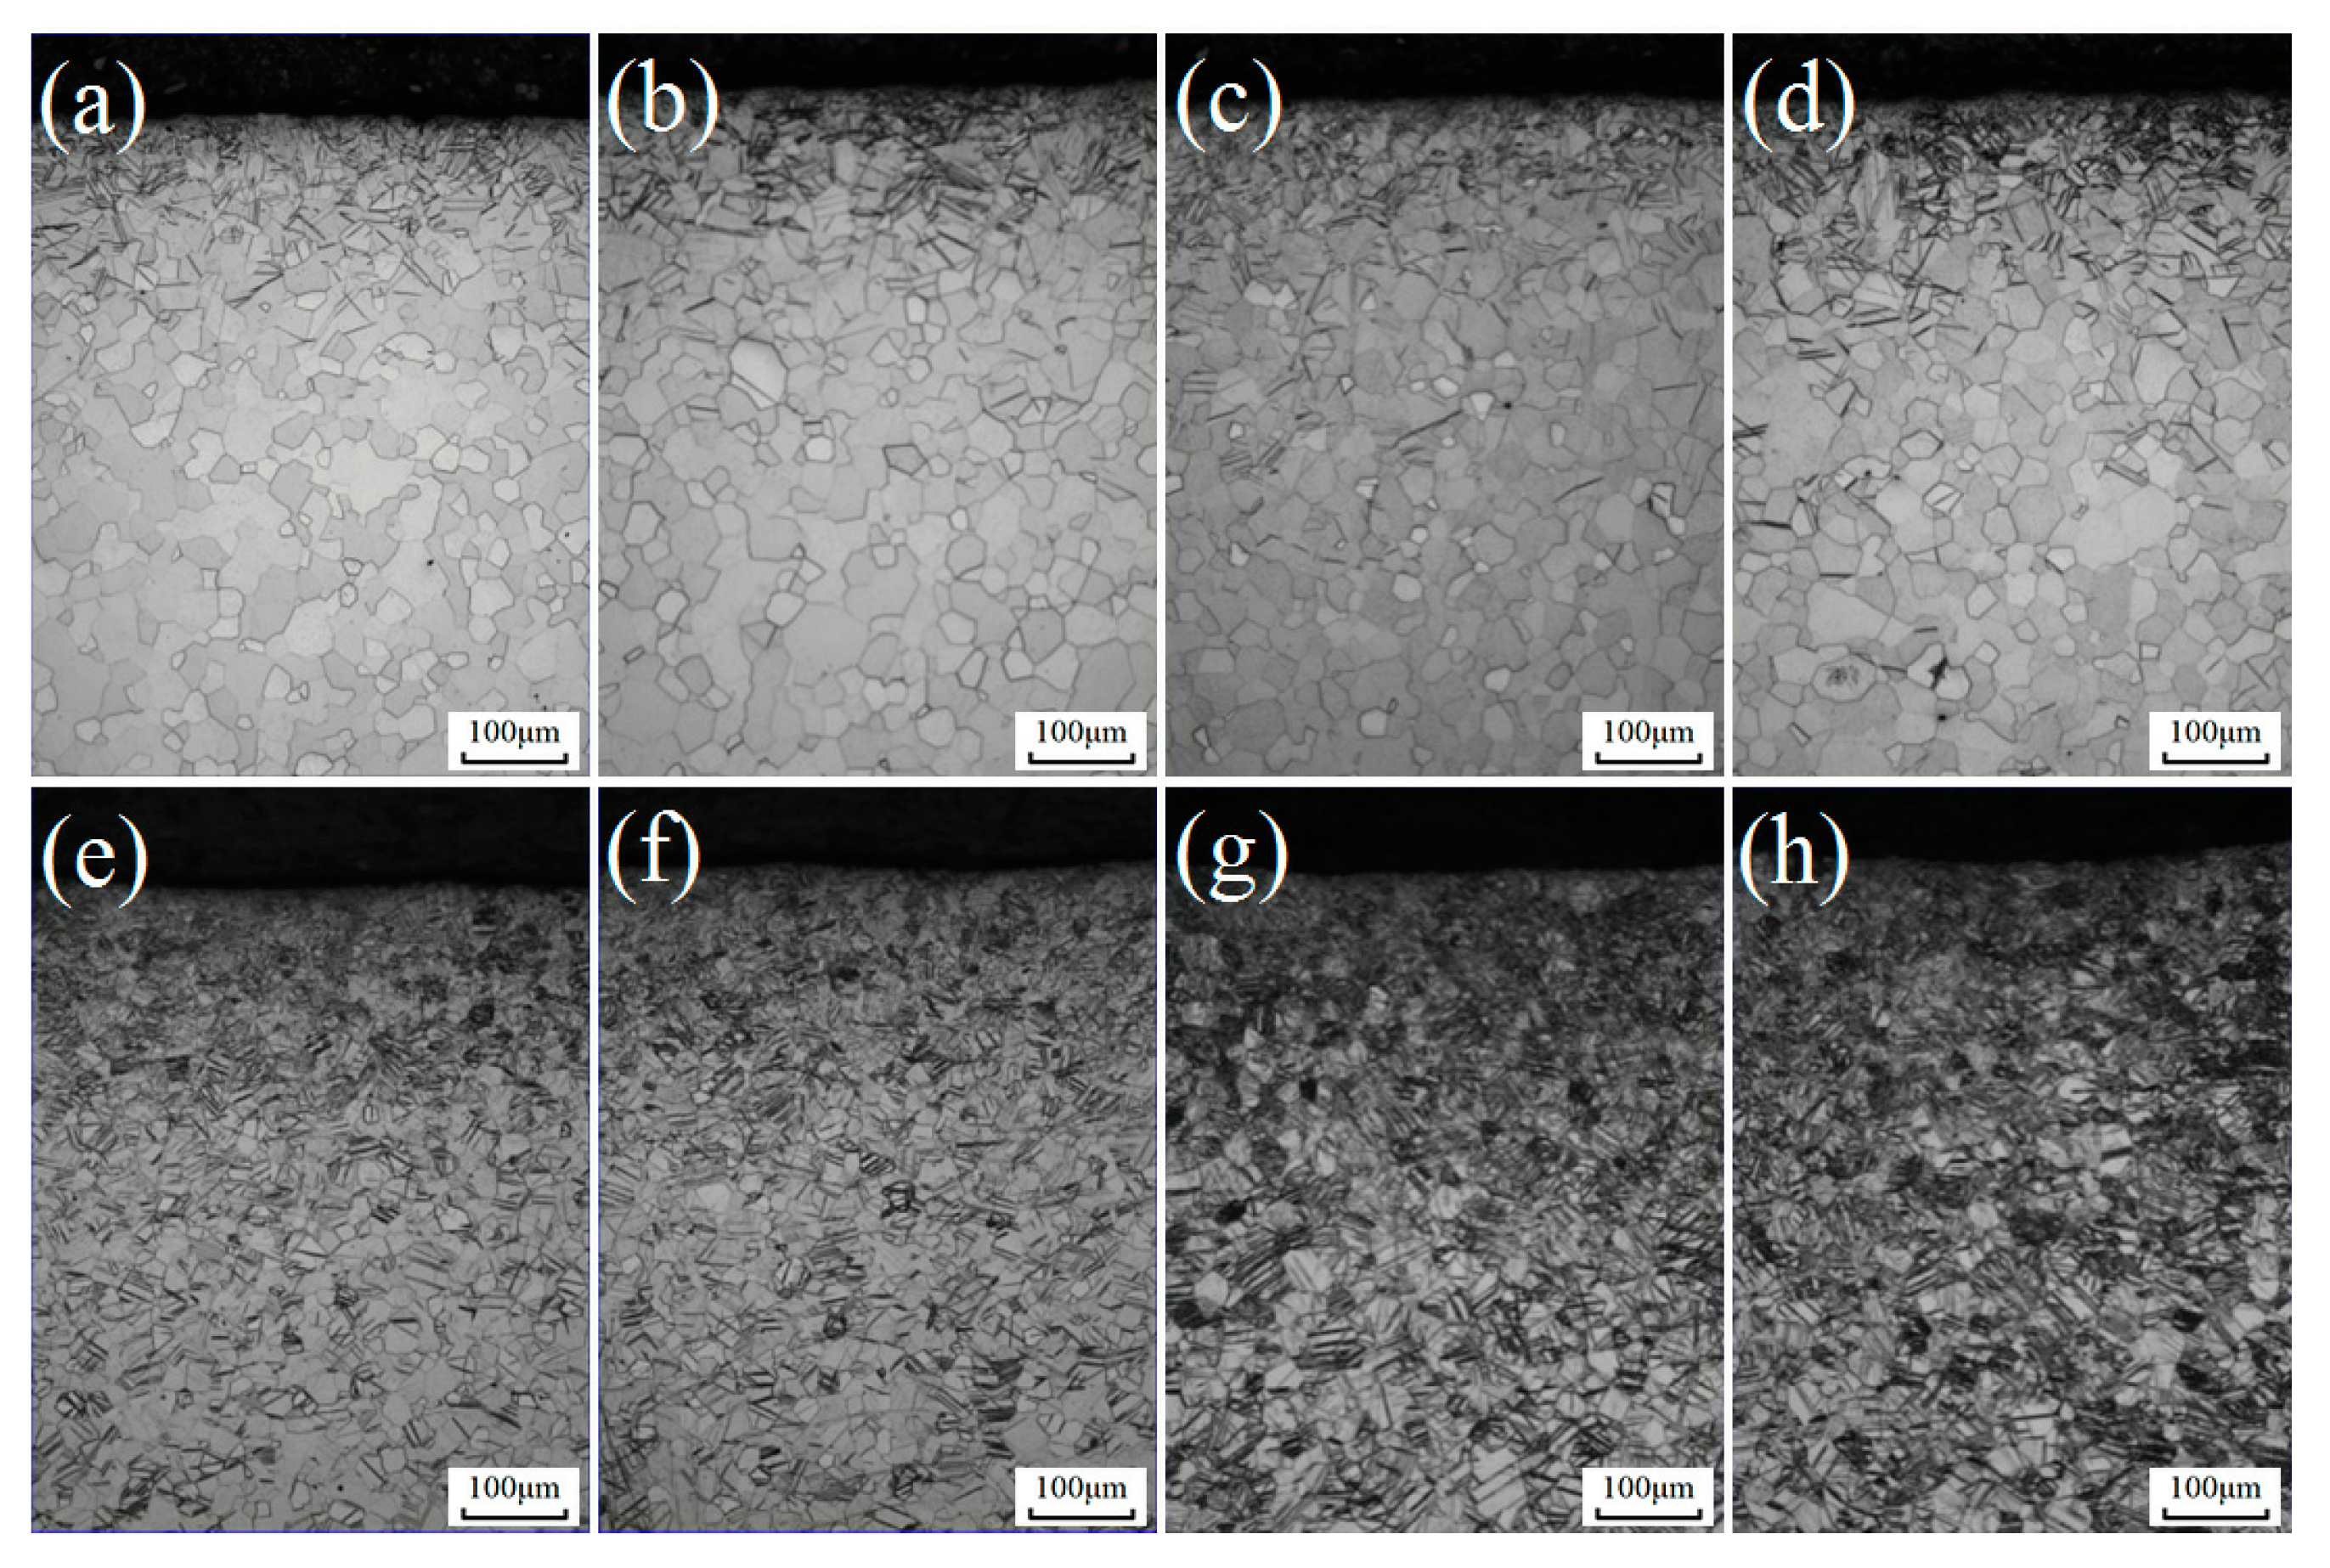
Figure 1. The microstructure evolution induced by MSP at (a) 5 min, (b) 10 min, (c) 20 min, (d) 30 min; and SMAT at (e) 15 min, (f) 30 min, (g) 60 min, (h) 90 min.
Coatings 10 00430 g001
Figure 2. Cross-sectional SEM images of titanium specimens after different treatment conditions: (a) MSP for 30 min, (b) SMAT for 90 min.
Coatings 10 00430 g002
Figure 3. XRD patterns of the titanium specimen after different treatment conditions: (a) MSP and (b) SMAT.
Coatings 10 00430 g003
Figure 4. TEM images of the top most surface after different treatment conditions: (ad) 30 min of MSP treatment; (eh) 90 min of SMAT treatment.
Coatings 10 00430 g004
Figure 5. Surface morphologies of three kinds of specimens: (a) original TA2, (b) 90 min SMAT specimen, and (c) 30 min MSP specimen.
Coatings 10 00430 g005
Figure 6. The surface 3D morphologies of three kinds of specimens: (a) original TA2, (b) 90 min SMAT specimen, and (c) 30 min MSP specimen.
Coatings 10 00430 g006
Figure 7. Surface profiles of three kinds of specimens.
Coatings 10 00430 g007
Figure 8. Hardness curve along the cross-sectional direction of different specimens.
Coatings 10 00430 g008
Table 1. The chemical composition (wt.%) of the titanium plate.
ElementFeCHNOTi
Composition (wt.%)0.30.080.0150.030.25balance
Table 2. Surface roughness of three kinds of specimens.
ContentMSPSMATOriginal TA2
Ra0.990.450.30
Rq1.180.560.40