Article

Granulation Effect Analysis of Gas Quenching Blast Furnace Slag with Different Basicities

College of Metallurgy and Energy, North China University of Science and Technology, Tangshan 063009, China
*
Author to whom correspondence should be addressed.
Coatings 2020, 10(4), 372; https://doi.org/10.3390/coatings10040372
Submission received: 12 December 2019 / Revised: 25 March 2020 / Accepted: 7 April 2020 / Published: 9 April 2020

Abstract

:
High content amorphous phase blast furnace slag beads were prepared by gas quenching blast furnace slag (BFS), which could not only avoid a series of environmental problems caused by traditional water quenching methods, but also significantly increase the added value of BFS subsequent products. In this paper, the granulation mechanism of BFS and the amorphous phase formation mechanism of slag beads were studied by combining the physical properties of BFS and the granulation effect. The results showed that the viscosity of BFS decreased with the increase of basicity; the bigger the basicity, the higher the bead formation rate, the smaller the particle size and the more regular the slag shape. The smaller the basicity, the greater the crystallization activation energy and the smaller the Avrami exponent, which indicated that the crystal was more difficult to nucleate and grow. The increase of the cooling rate could effectively inhibit crystal precipitation. Therefore, the high basicity and cooling rate could not only guarantee the high bead formation rate of BFS, but also ensure the high content amorphous phase of slag beads.

1. Introduction

Blast furnace slag, as bulk solid waste produced in the ironmaking process, will inevitably pollute the environment and occupy a large amount of land resources if it is not treated and utilized [1,2]. The traditional water quenching method of blast furnace slag (BFS) will consume a lot of new water in the process, pollute the atmosphere by gases such as H2S and SO2, waste a lot of sensible heat, and consume a lot of energy to dry the BFS for subsequent utilization [3,4,5]. Under the above background, the dry granulation process can overcome the disadvantages of water quenching and can significantly increase the added value of the subsequent BFS product, which has attracted researchers’ widespread attention. Purwanto [6] studied the influence of rotating speed on the size of slag particles by high speed camera experiment, obtaining the following equation for the particle size: D = 1686/ωr; Yoshinaga [7] studied the cooling rate and solidification time of slag particles and pointed out that in order to prevent the slag particles from sticking to each other in the process of granulation, it is effective to use powder as cooling medium for cooling and solidifying; Kashiwaya [8] combined rotating cup granulation with wind crushing, and the influences of rotor diameter, depth, inclination angle, rotating speed, slag viscosity, and air flow velocity on the granulation effect were studied. However, there are few studies on the granulation mechanism of BFS and the amorphous formation mechanism of slag beads. Therefore, the gas quenching method is used to break and granulate the BFS in this paper. We also studied the influence of the physical properties of BFS on the granulation effect and found the components that work in favor of BFS granulation. The crystallization behavior of slag beads as well as the favorable conditions for the slag beads to produce amorphous phase were determined.

2. Materials and Methods

2.1. Experimental Materials

The experimental raw material BFS was obtained from the Tangsteel iron manufacturing plant in Tangshan, China. The modifying agent fly ash and limestone were obtained from the Tangsteel power plant in Tangshan, China, and the Tangsteel iron manufacturing plant in Tangshan, China, respectively. The main components of BFS and its modifying agent are shown in Table 1. The experimental scheme is shown in Table 2.
The main components were determined by the Chinese industry standard YB/T140–2009 [9]:

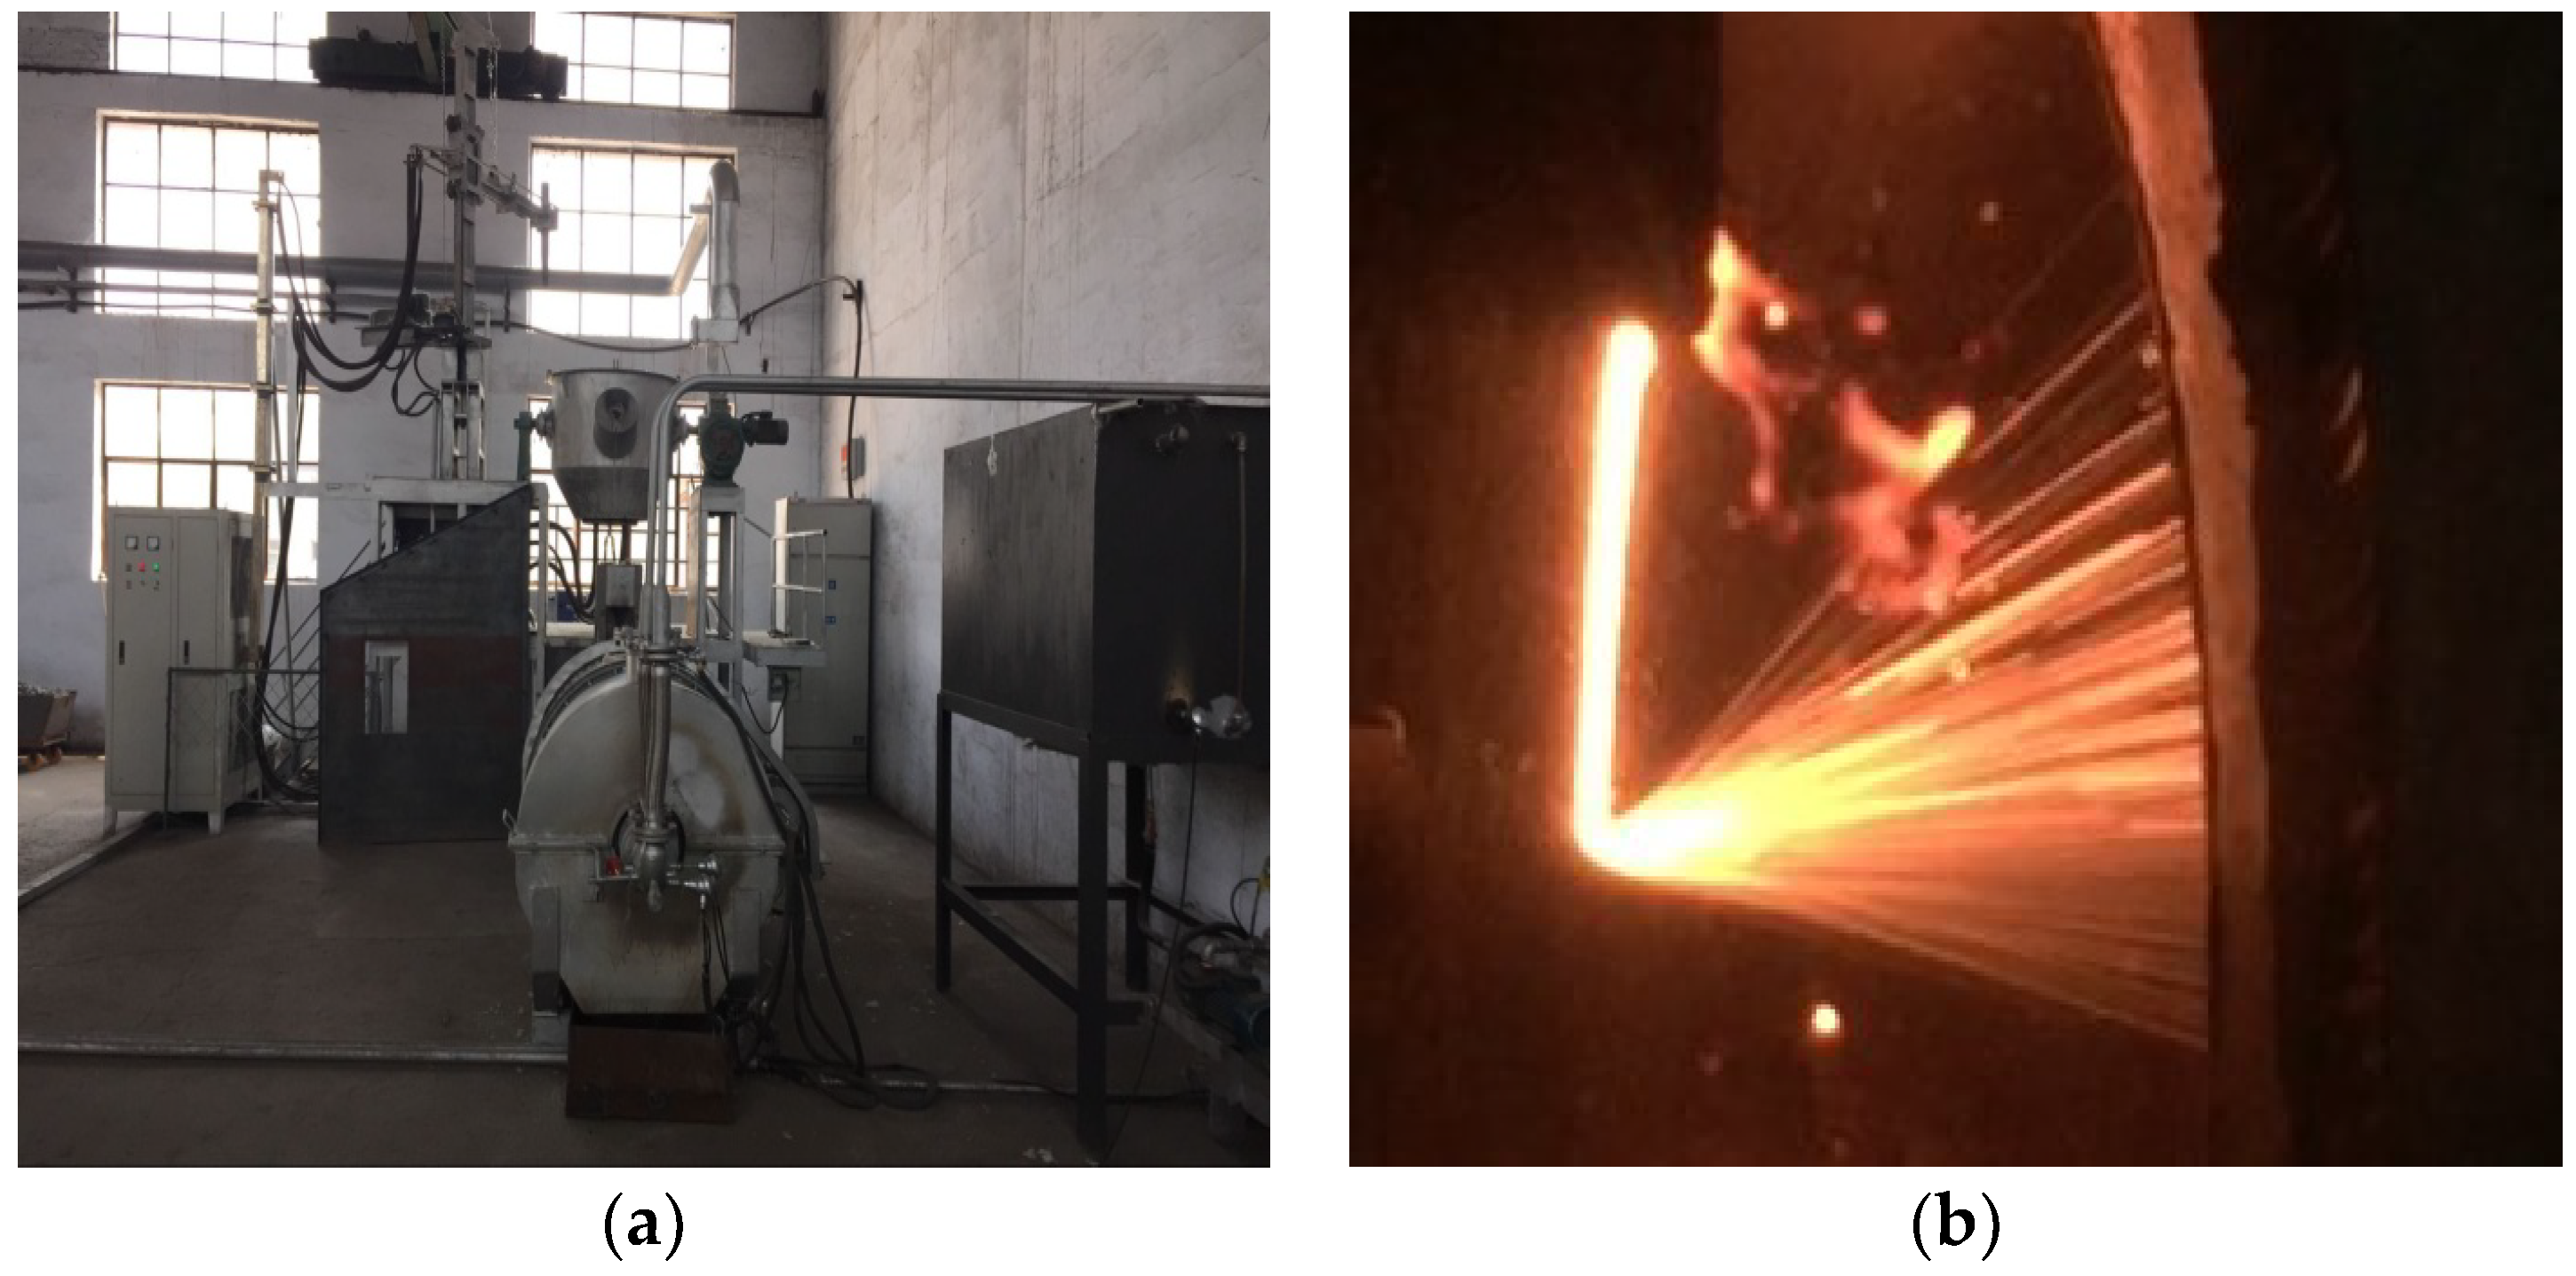
2.2. Experimental Flow Diagram

As shown in Figure 1, the coke was put at the bottom of the electric arc furnace (North China University of Science and Technology, Tangshan, China) and then headed. We added the BFS in the electric arc furnace when it heated to 800 °C. After heating to 1500 °C, the temperature was maintained constant for half an hour to fully melt the BFS. Next, we added the modifying agent to the BFS at a constant temperature for half an hour to make the BFS flowable. By adjusting the electrode to tilt the electric arc furnace to a certain angle, the BFS smoothly flowed out from the furnace. The bottom of the electric arc furnace was equipped with a gas quenching device to the gas quenching BFS. At the same time, the heat and slag beads were collected by a rotary slag cooler.

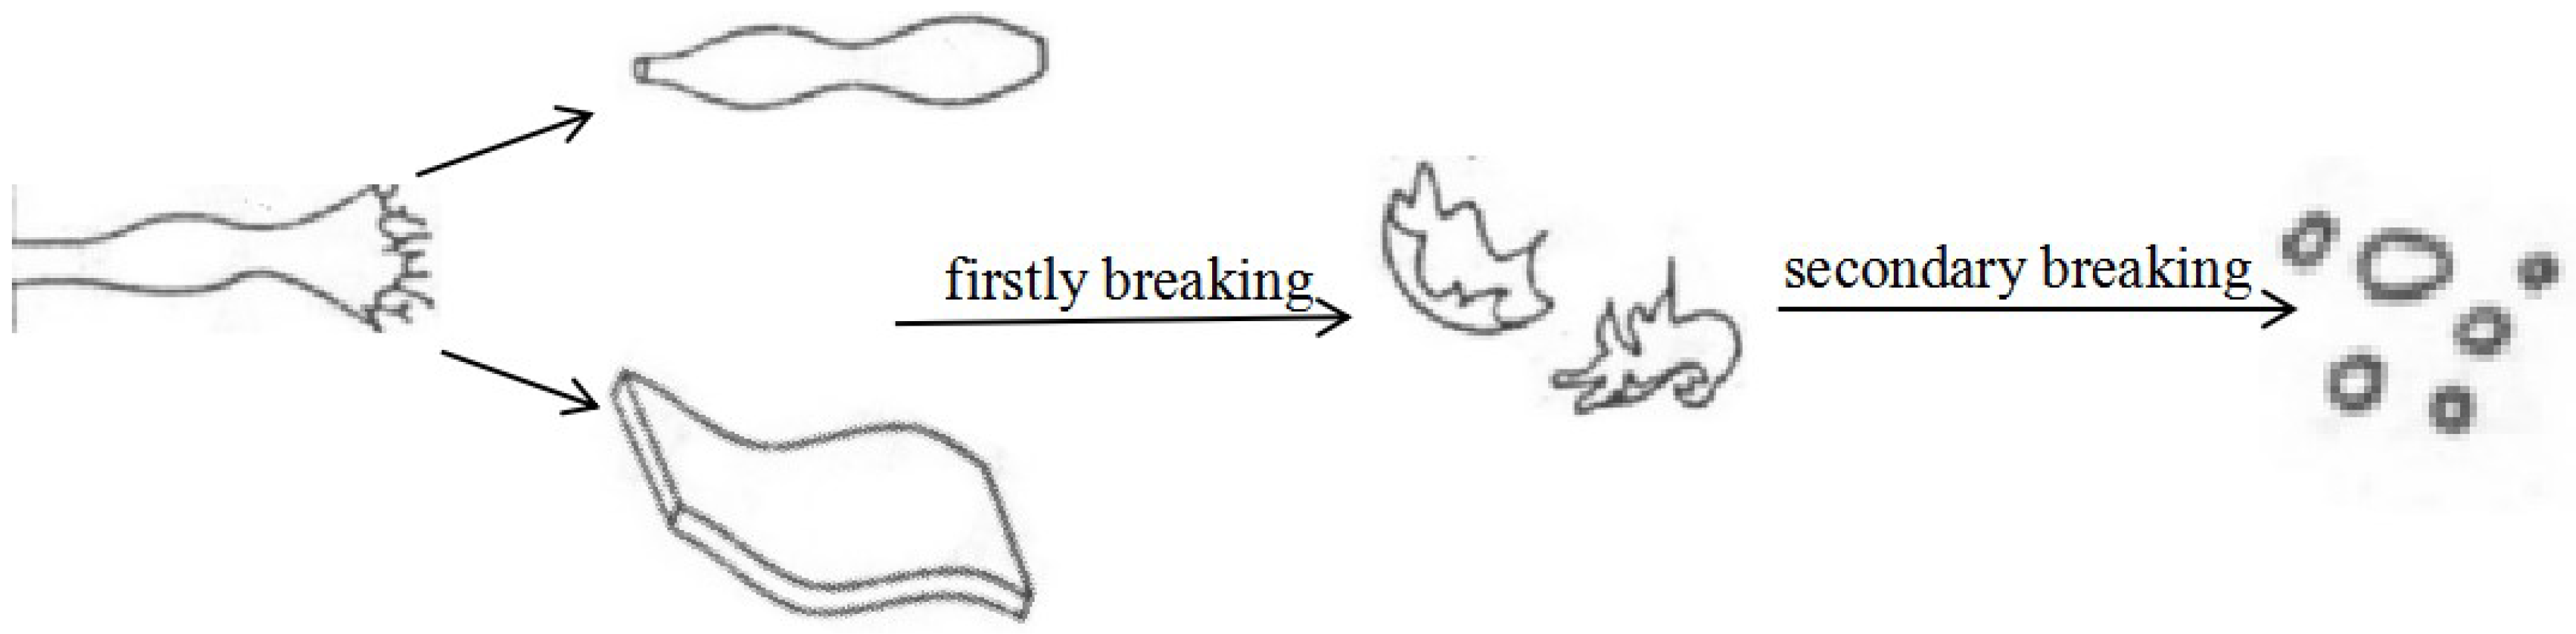
2.3. Gas Quenching Mechanism

As shown in Figure 2, the whole granulation process was mainly divided into in three stages: firstly breaking, secondary breaking, and solidification. The molten slag flow was affected by aerodynamic forces to form unstable disturbance waves. When the disturbance wave reached the critical value, it would break up and form membrane and a cylindrical liquid wire, breaking into droplets and membrane fragments, which was the firstly breaking of molten slag. At the same time, the larger particle size slag droplets and membrane fragments were disturbed by the surrounding air, and they would continue to break up under the control of the Weber number, thus forming smaller slag droplets, which was the secondary breaking. Finally, the solid slag beads were formed by cooling and solidification of slag droplets [10].

2.4. Spherical Degree Analysis

Samples under each basicity of 1~2 L were reduced by the quartile method, and 50 grains were randomly picked up. Maximum diameter and minimum diameter of each slag beads were measured with a vernier calipe, respectively. If the K value was close to 1, the slag beads were close to the sphericity.
K = D MAX D MIN
where K is the grain shape coefficient of each slag bead; DMAX is the maximum diameter of slag bead, mm; DMIN is the minimum diameter of the slag bead, mm.

2.5. Amorphous Content Analysis

The samples were fully dried for 1 h and ground to less than 200 mesh (ground by ZHM-1-P03061808, Beijing Zhonghe Venture Technology Development Co., Ltd., Branch, Beijing, China), the XRD analysis (Rigaku D-max-2500PC, Society of Science, Tokyo, Japan) was at a speed of less than or equal to 10° (2θ) per minute, and the scanning 2θ range was 10.0°~80.0°. The voltage was 40.0 kV and the current was 100.0 mA. XRD spectra was collected at 298 K using an X-ray diffractometer equipped with Cu Kα radiation (λ = 0.15405 nm).
The amorphous content of slag beads was detected by using the Jade 6.5 software, and the equation for determining the amorphous content was as follows:
w g = 1 S c S total × 100 %
where wg is the amorphous content, %; Sc is the area of crystalline phase in diffraction peak; Stotal is the area of the overall diffraction peak.

2.6. Method for Determination of Viscosity and Surface Tension

Firstly, the BFS raw material and conditioning agent were put into the blast drying box and then heated to 120 °C for 6 h. According to the experimental scheme in Table 2, samples with a total of 140 g of BFS and a certain proportion of conditioning agent were weighed and put into a graphite crucible. The graphite crucible was put into the RTW-13 melt comprehensive measuring instrument. Then, the electricity was turned on and heated up in accordance with a certain heating procedure. The constant temperature was maintained for 30 min to ensure that the sample was fully melted and mixed evenly when heated to 1500 °C. After the BFS was fully mixed, the Mo head connected to the corundum rod was inserted 35~40 mm under the slag liquid level. By clicking on the variable temperature viscosity measurement program, the viscosity of the conditioning slag was measured.
When the viscosity was measured, the corundum rod was connected to the molybdenum cylinder and put into the crucible. When the molybdenum cylinder reached the liquid level horizontally, the liquid was pulled up together with the molybdenum cylinder. When the surface tension was equal to the pulling force, the pulling force at this time was the maximum pulling force value. The liquid naturally fell off when the pulling force was greater than the surface tension when continued to pull the molybdenum cylinder, and the surface tension was the force needed at the moment the molybdenum cylinder left the liquid level.

2.7. DSC Experiment

The crystallization behavior was studied using the DSC experiment (STA449F3 Juptiter, NETZSCH, Selb, Germany) to study the crystallization mechanism. The samples were ground below 200 mesh by a jaw crusher and planetary ball mill. Samples of 30 mg were put into the crucible. An empty Al2O3 crucible was selected as the reference and the air was added as the reaction gas. Each sample group was heated to 1500 °C at a heating rate of 100 °C/min. The temperature was maintained constant for 30 min to fully melt the samples. The samples were cooled at cooling rates of 20, 30, 50, 55, and 60 °C/min, respectively. Because the crystallization behavior of BFS was closely related to the initial crystallization temperature, only the temperature corresponding to the first exothermic peak in the DSC exothermic curve was studied. The experimental data were analyzed by the Proteus analysis software.

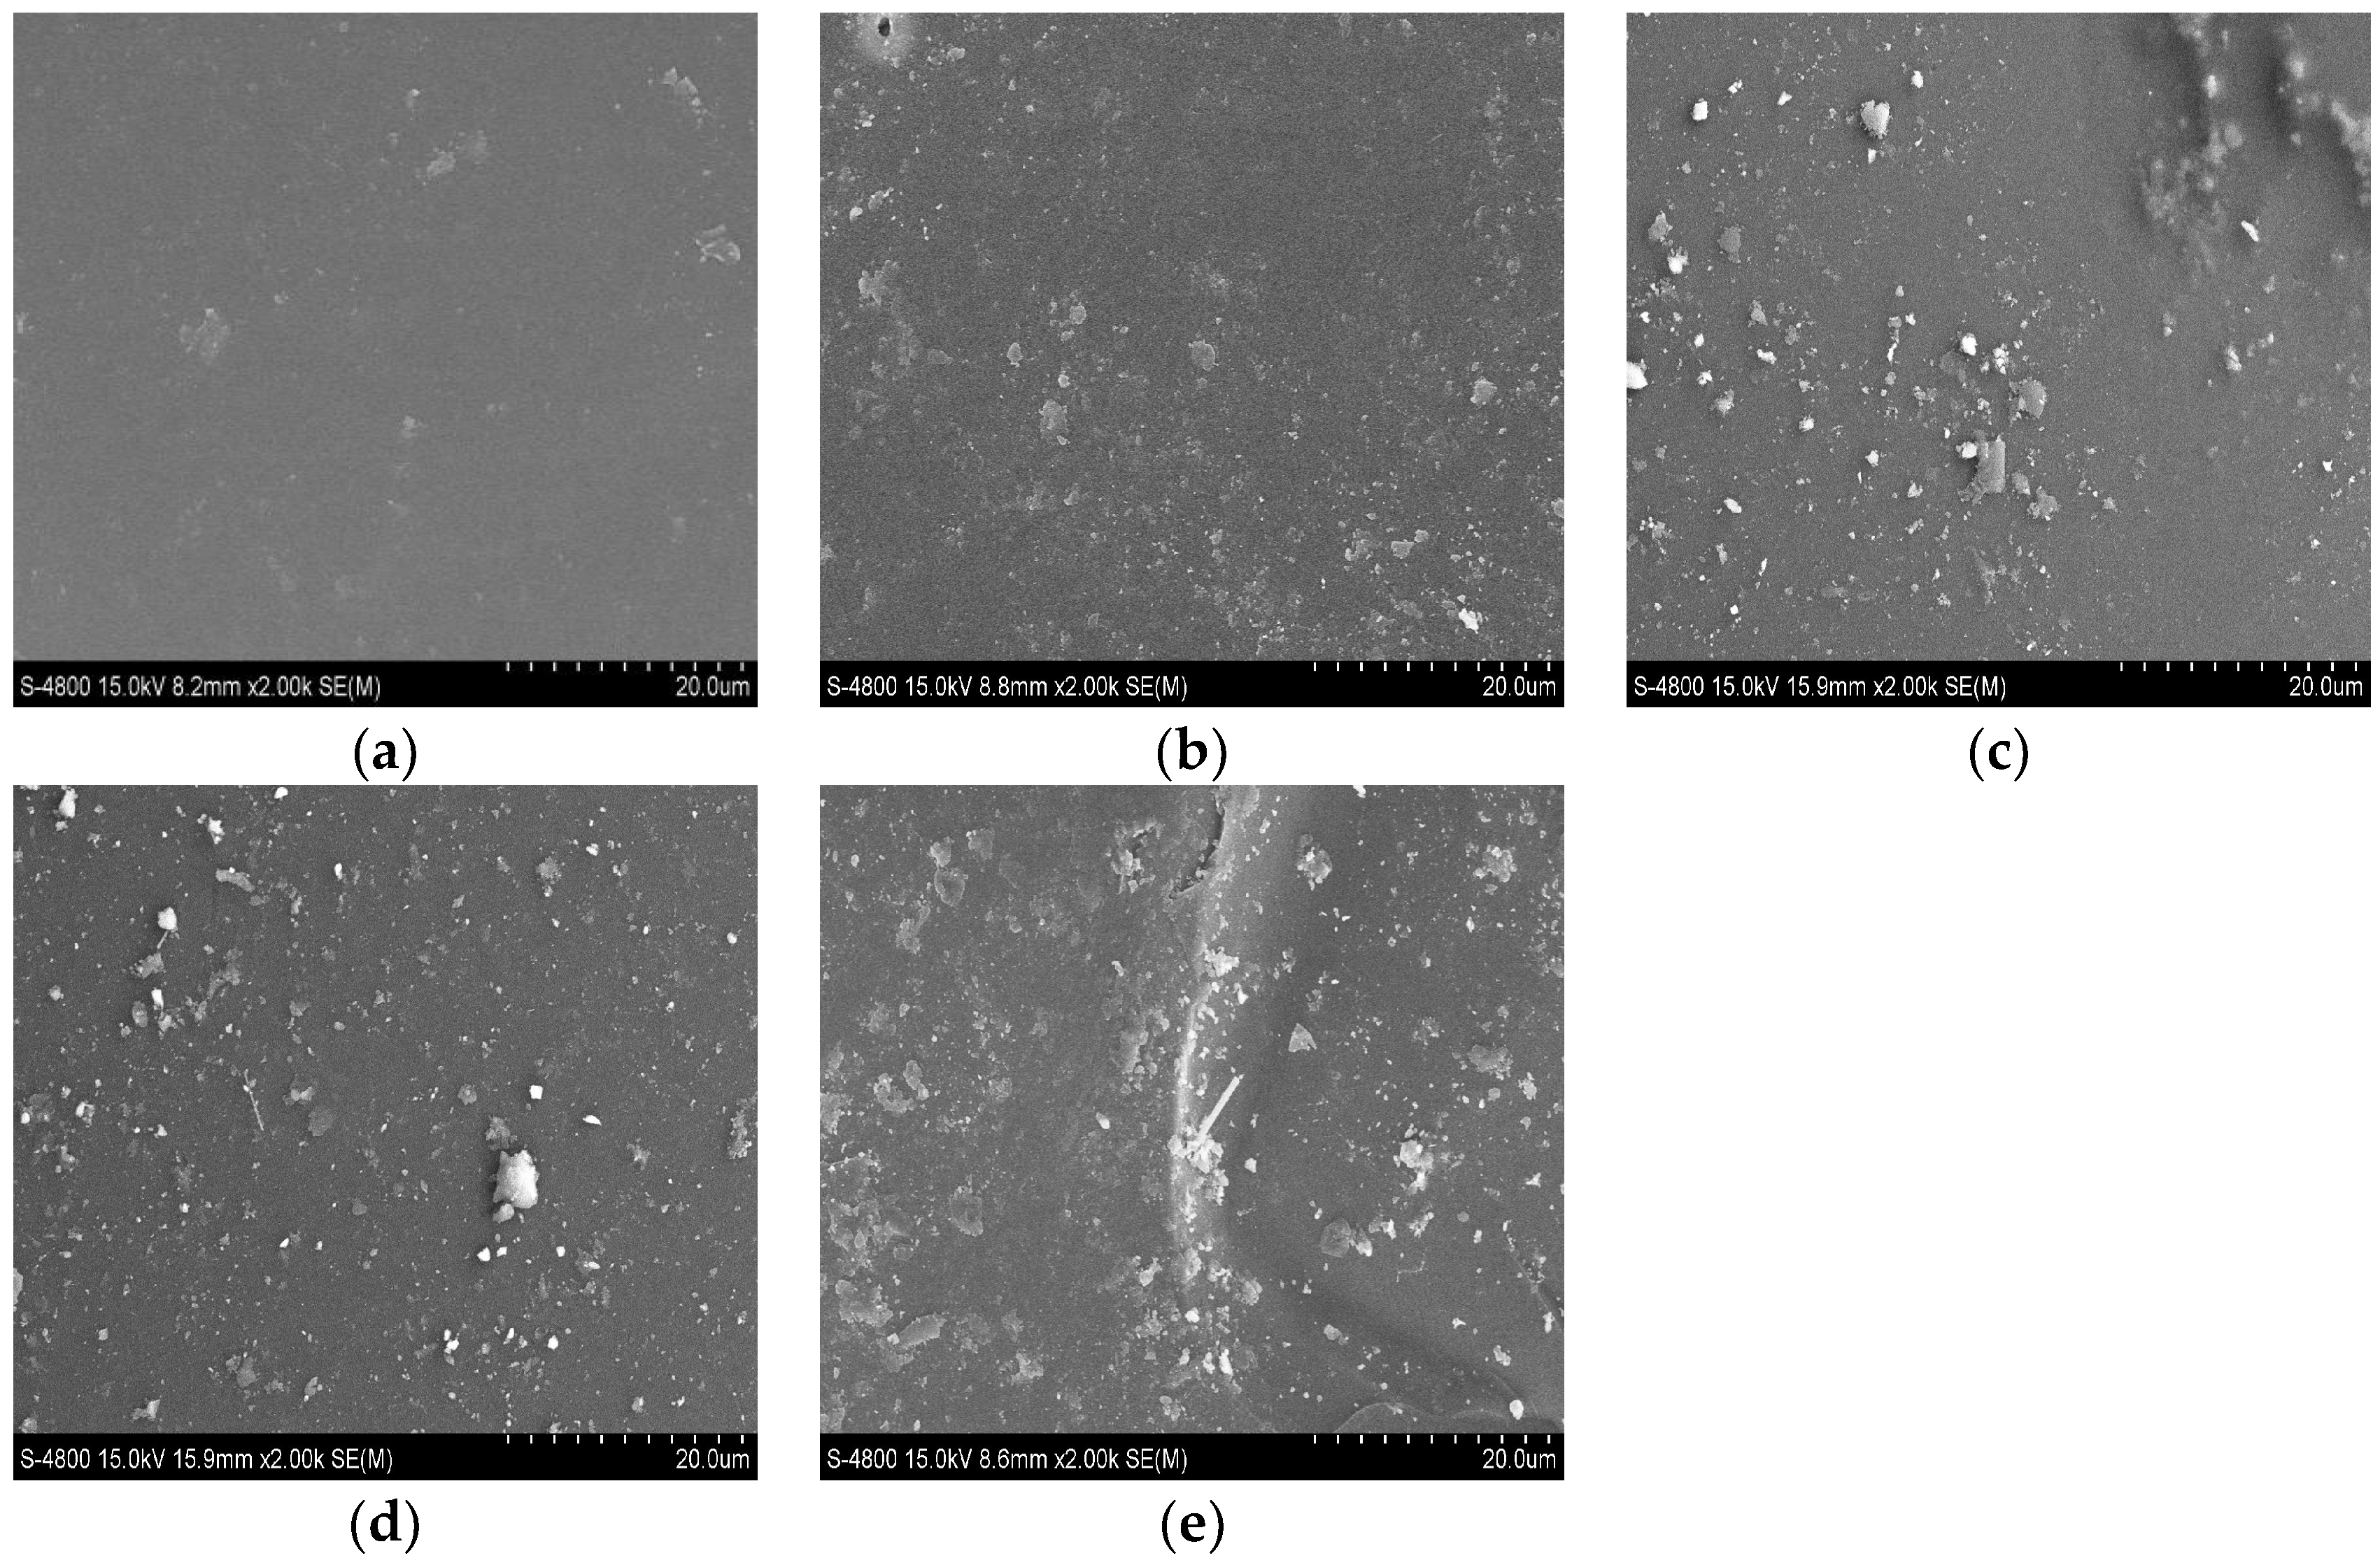
2.8. Microscopic Morphology Observation

The slag beads prepared under different basicities were broken and ground by ZHM-1-P03061808, and then the microstructure was observed by a S-4800 field emission scanning electron microscope (S-480003040155, Hitachi, Tokyo, Japan).

3. Results and Discussion

3.1. Influence of Different Basicities on the Granulation Effect of Gas Quenching BFS

The experimental material was 30 kg, the slag dumping temperature was 1600 °C, the nozzle diameter was 3 mm, the slag cooler speed was 5.5 r/min, and the nozzle pressure was 0.2 MPa. The results of the particle size distribution and the bead formation rate of the slag beads were obtained as shown in Figure 3. The BFS granulation products mainly include different particle size slag beads and fibers, the particle size distribution was mainly between 1 mm and 2.5 mm, and of basically normal distribution. The particle size distribution was more uniform. With the increase of basicity, the number of small particle size slag beads increased gradually, the fiber content decreased gradually, and the bead formation rate increased gradually.
Through the viscosity analysis in Figure 4, the BFS in a high temperature zone had a low viscosity which could guarantee good fluidity of BFS, and the viscosity of alkali slag was less than that of acid slag at the same temperature. The viscosity of alkali slag was greatly affected by temperature. With the decrease of temperature, the viscosity increased sharply, which made the slag solidify instantly and affected the free fluidity of the slag. The viscosity of acid slag was less affected by temperature and the curve changed smoothly. However, the overall viscosity was larger, and the slag fluidity was not as good as that of alkali slag when reduced to a certain temperature. Because the slag with less basicity contained a more complex network Si–O–Si tetrahedron structure, the polymerization degree was high [11], and the irons volume was large. Therefore, the diffusion between ions was not easy, and the slag was not easy to break. With the increase of Ca2+ in BFS with relatively large basicity, the [SiO4]4− complex anionic of the slag was disintegrated. As shown in Equation (3), Ca2+ destroyed the stable network and chain structure inside the slag, the ionic structure became simple, which made the slag easy to break, the bead formation rate increased, and the small particle size slag beads increased.
      |         |         O         O         |         |   O Si O Si O       |         |         O         O         |         |   + ( Ca 1 + + O 2 ) =       |               |             O               O             |               |       O Si O Ca O Si O       |               |             O               O             |               |      

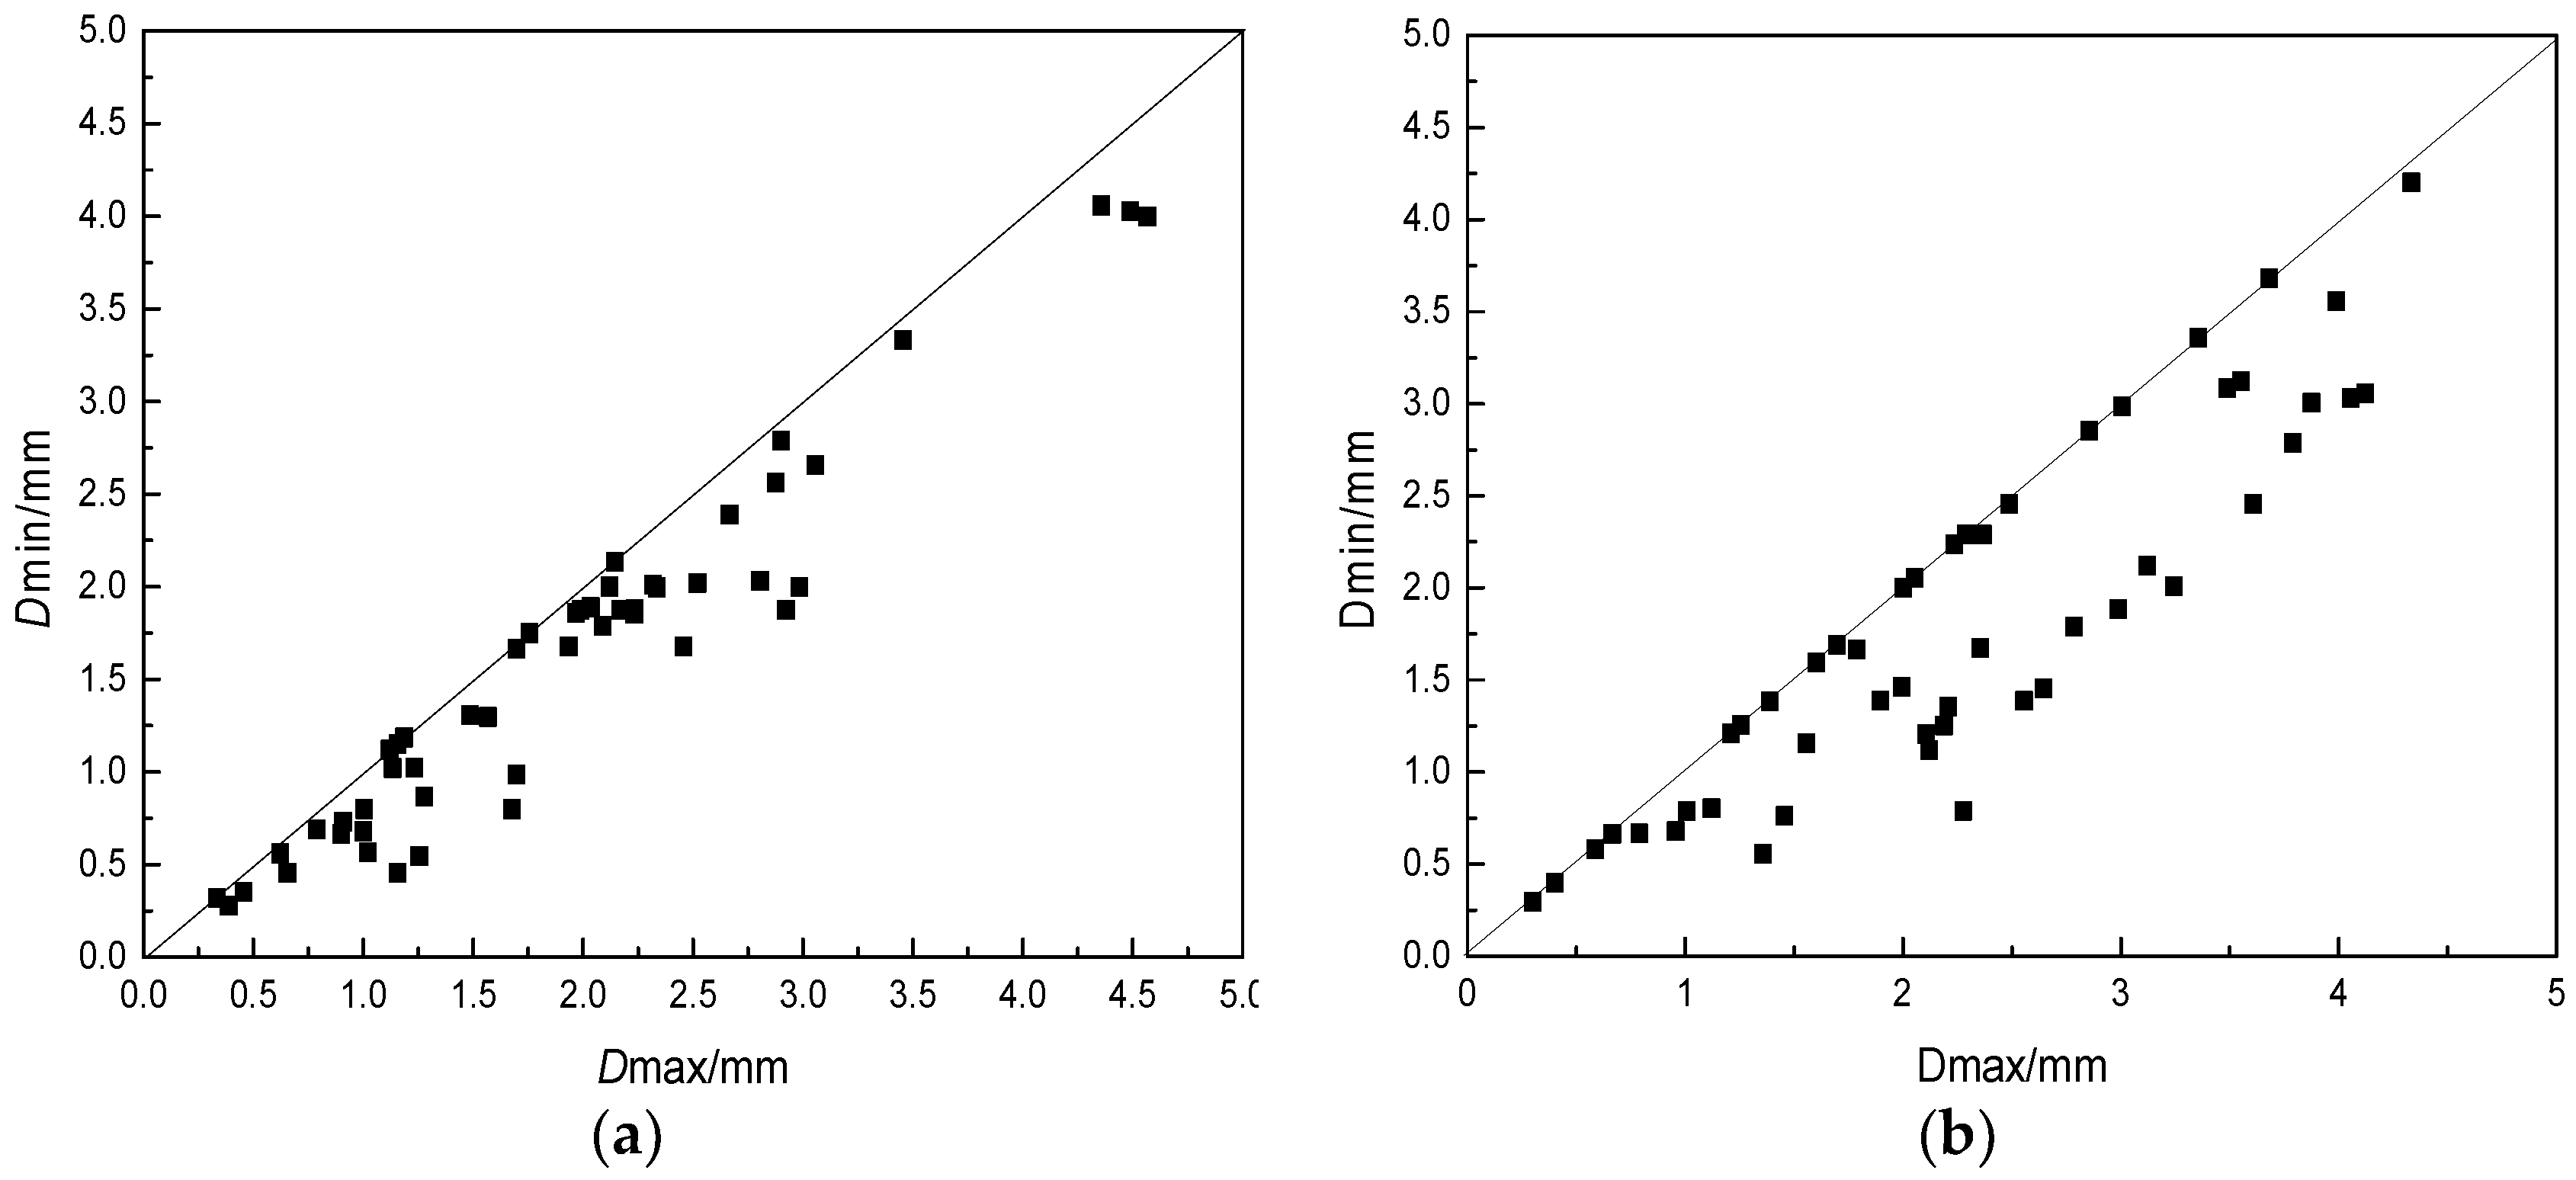
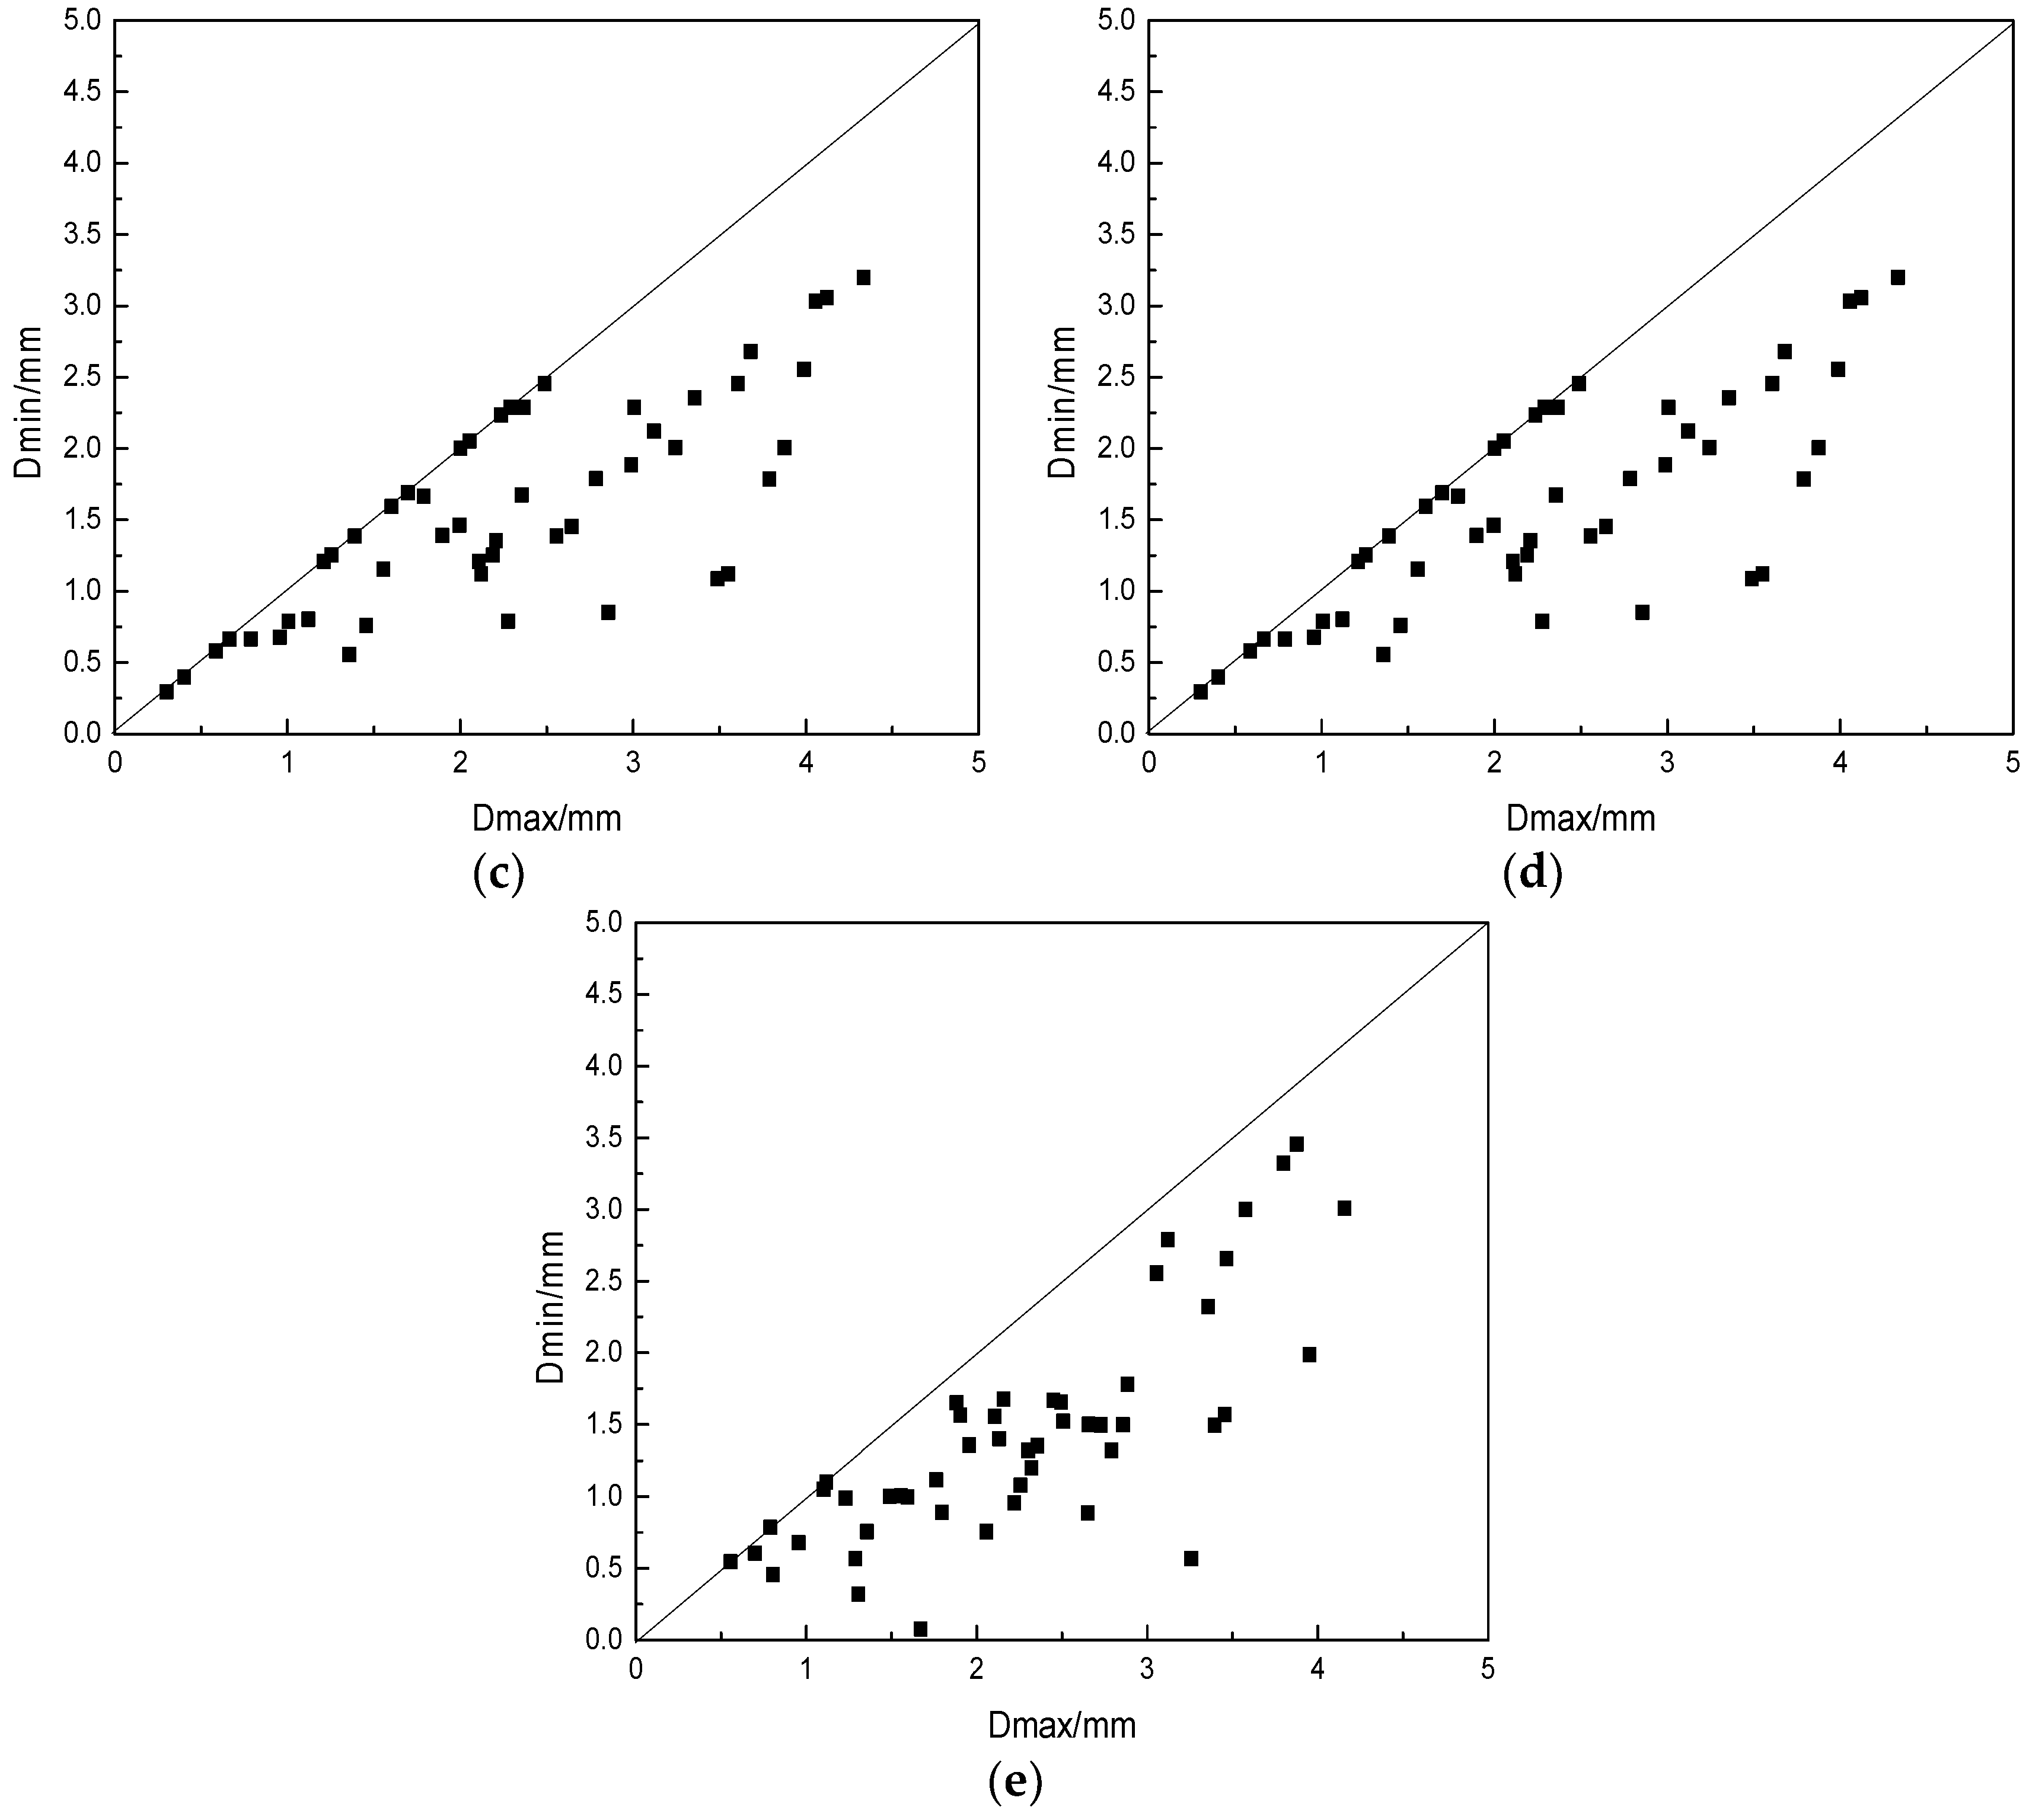
3.2. Influence of Different Basicities on Spherical Degree

The particle size of slag beads must be small and uniform in order to improve the heat recovery rate of BFS and increase the added value of BFS at the same time. Therefore, it was necessary to detect the spherical degree of slag beads obtained after granulation.
From the results in Figure 5, we could see that the particle size was very irregular when the basicity was small, and the large particle size increased. With the increase of basicity, the particle size of slag beads gradually became uniform, while the proportion of small particle size slag beads increased. This was mainly because that when the basicity was small, the BFS viscosity was relatively large, and the Si–O complex anion formed a stable network in the slag, which was not easy to disintegrate, resulting in a slag that was not easily broken, and therefore, the slag bead particle size was larger. Moreover, the slag surface tension and the shrinkage force were small, which was not enough to overcome the aerodynamic force to shrink into beads, thus forming irregular schistose or mutually bonded slag beads. The increased basicity increased the Ca2+ content which could disintegrated the complex anion structure, made the ionic structure simple, the slag was easily broken, and the small particle size slag beads formed. At the same time, as shown in Figure 4, the increase of basicity increased the BFS surface tension, which was more beneficial to the shrinkage of BFS into beads and to form the regular shape slag beads.

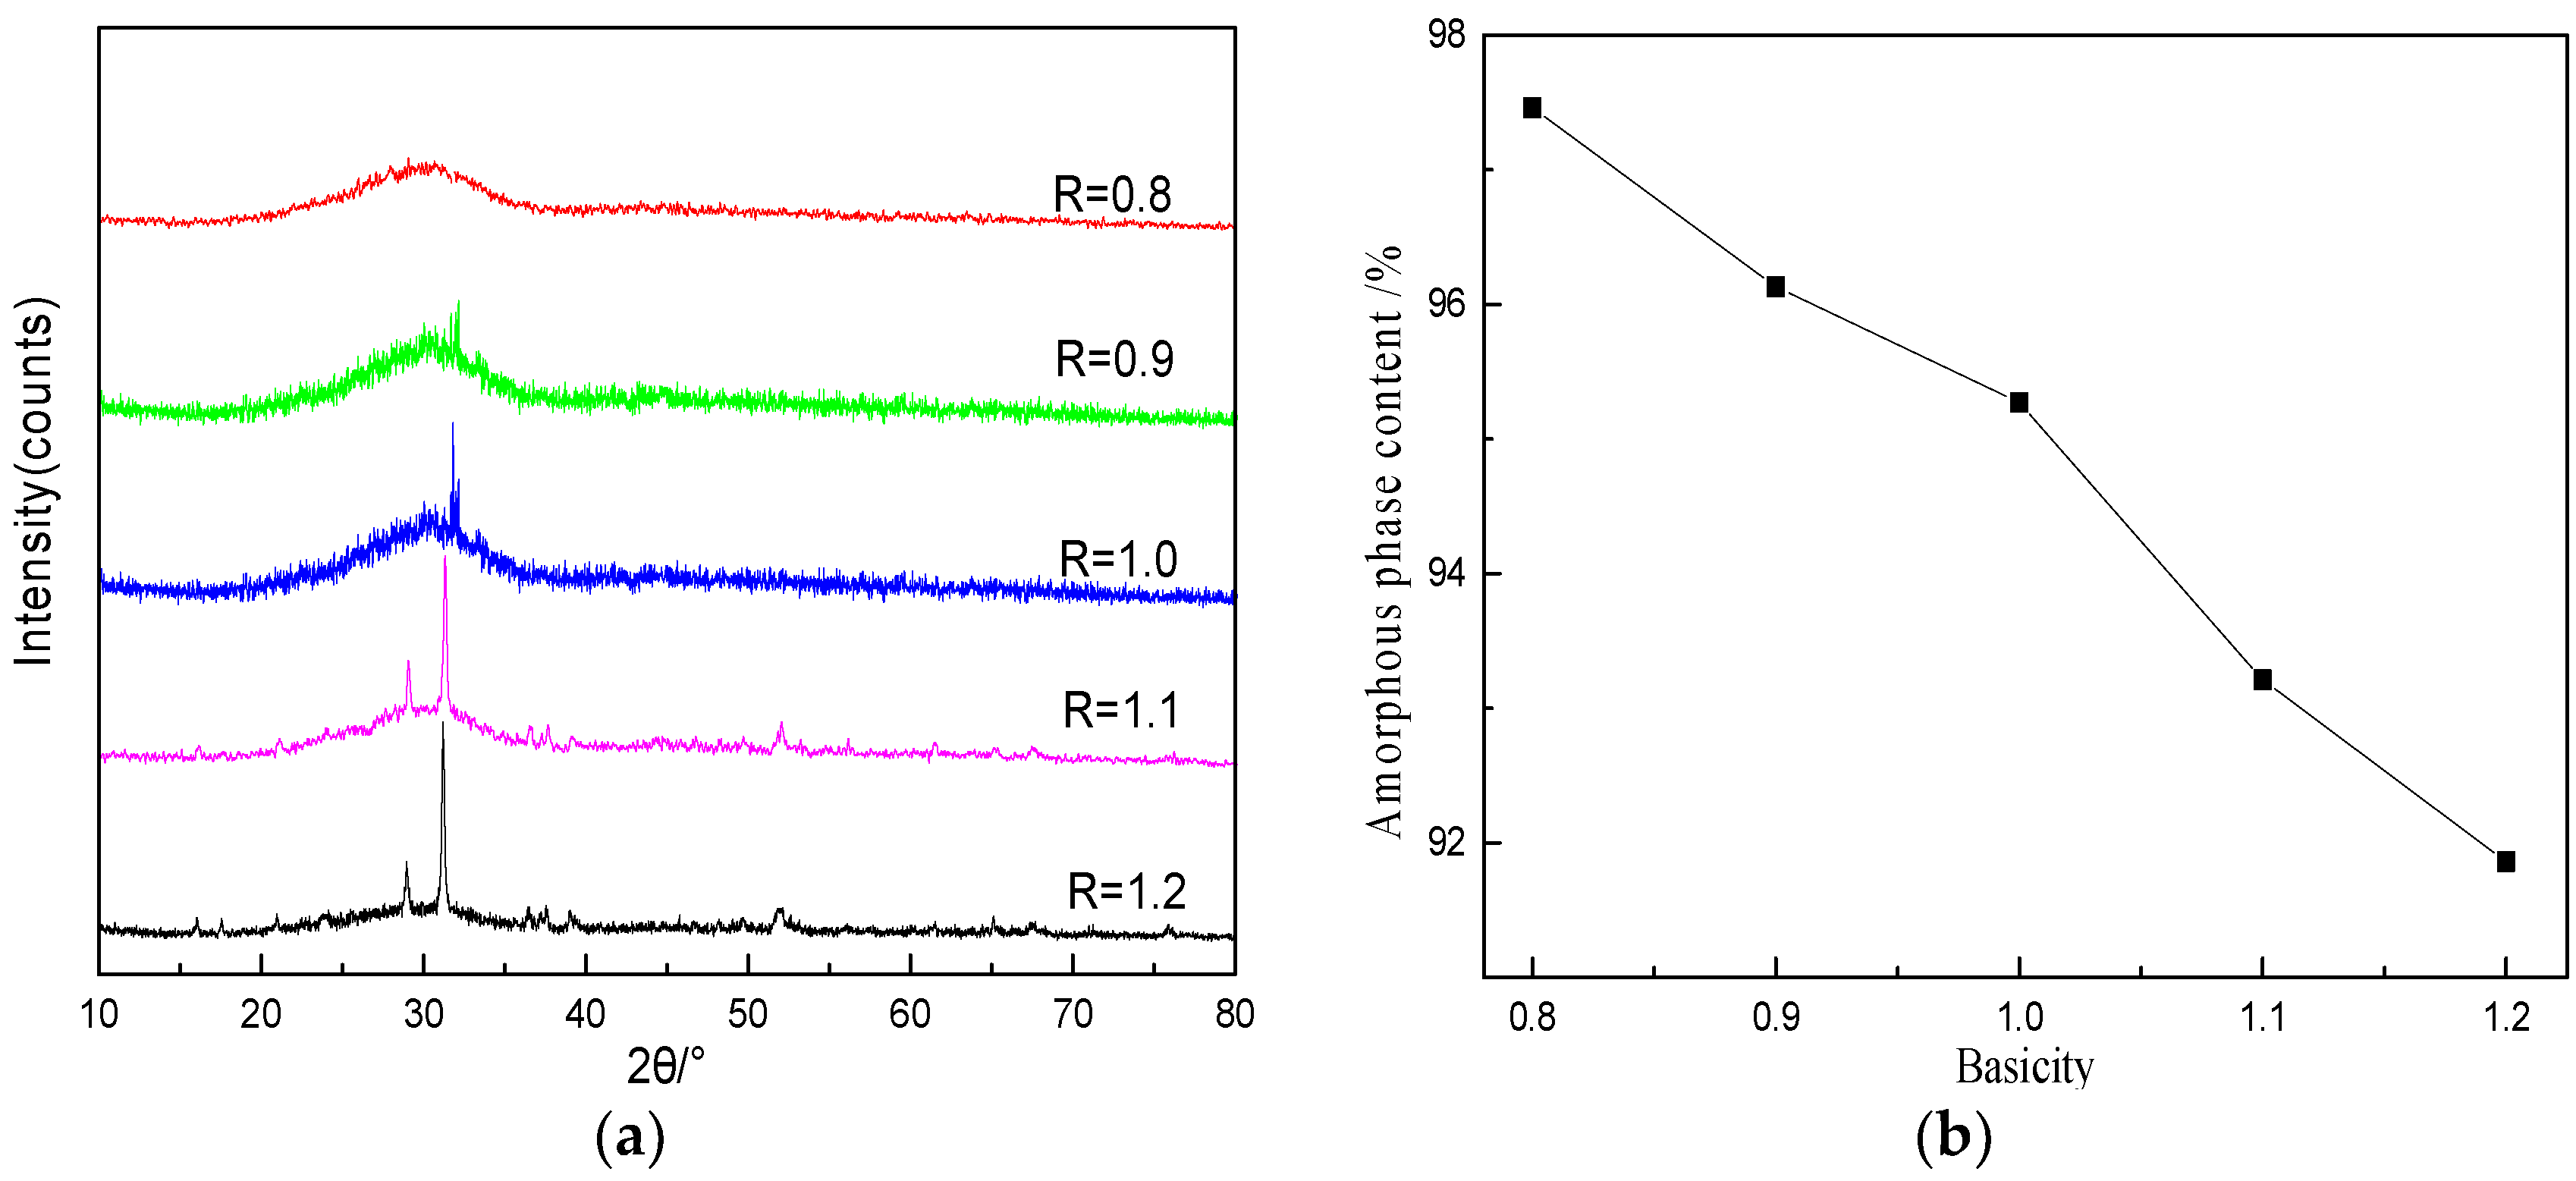
3.3. Analysis of Amorphous Content of Slag Beads

The crystal phase analysis and amorphous content of slag beads with a particle size of 1~2.5 mm at different basicities were carried out, and the results are shown in Figure 6. With the decrease of basicity, the crystal phase diffraction peak intensity of slag beads and the quantity decreased gradually. When the basicity reduced to 0.8, the diffraction peak of the slag beads changed smoothly, indicating that there was no crystal phase precipitation in the slag beads. The amorphous content was close to 100% when the slag beads basicity was 0.8. With the increase of basicity, the amorphous content decreased, which indicated that the decrease of basicity could inhibit the crystals precipitation.
The micromorphology analysis of slag beads with different basicities was observed, which is shown in Figure 7. As the basicity increased, the crystal phase in the slag beads gradually increased. When the basicity decreased to 0.8, the slag beads showed a smooth surface, and the sample was amorphous, which was consistent with the XRD results.
The amorphous content of slag beads with different basicities and particle size was obtained, as shown in Table 3. With the decrease of particle size, the amorphous content of slag beads increased with the decrease of particle size, and the amorphous content could reach 100% when the basicity decreased to 0.8 and particle size was smaller than 50 mesh. At the same particle size, the amorphous content in the slag beads gradually decreased with the increase of basicity.

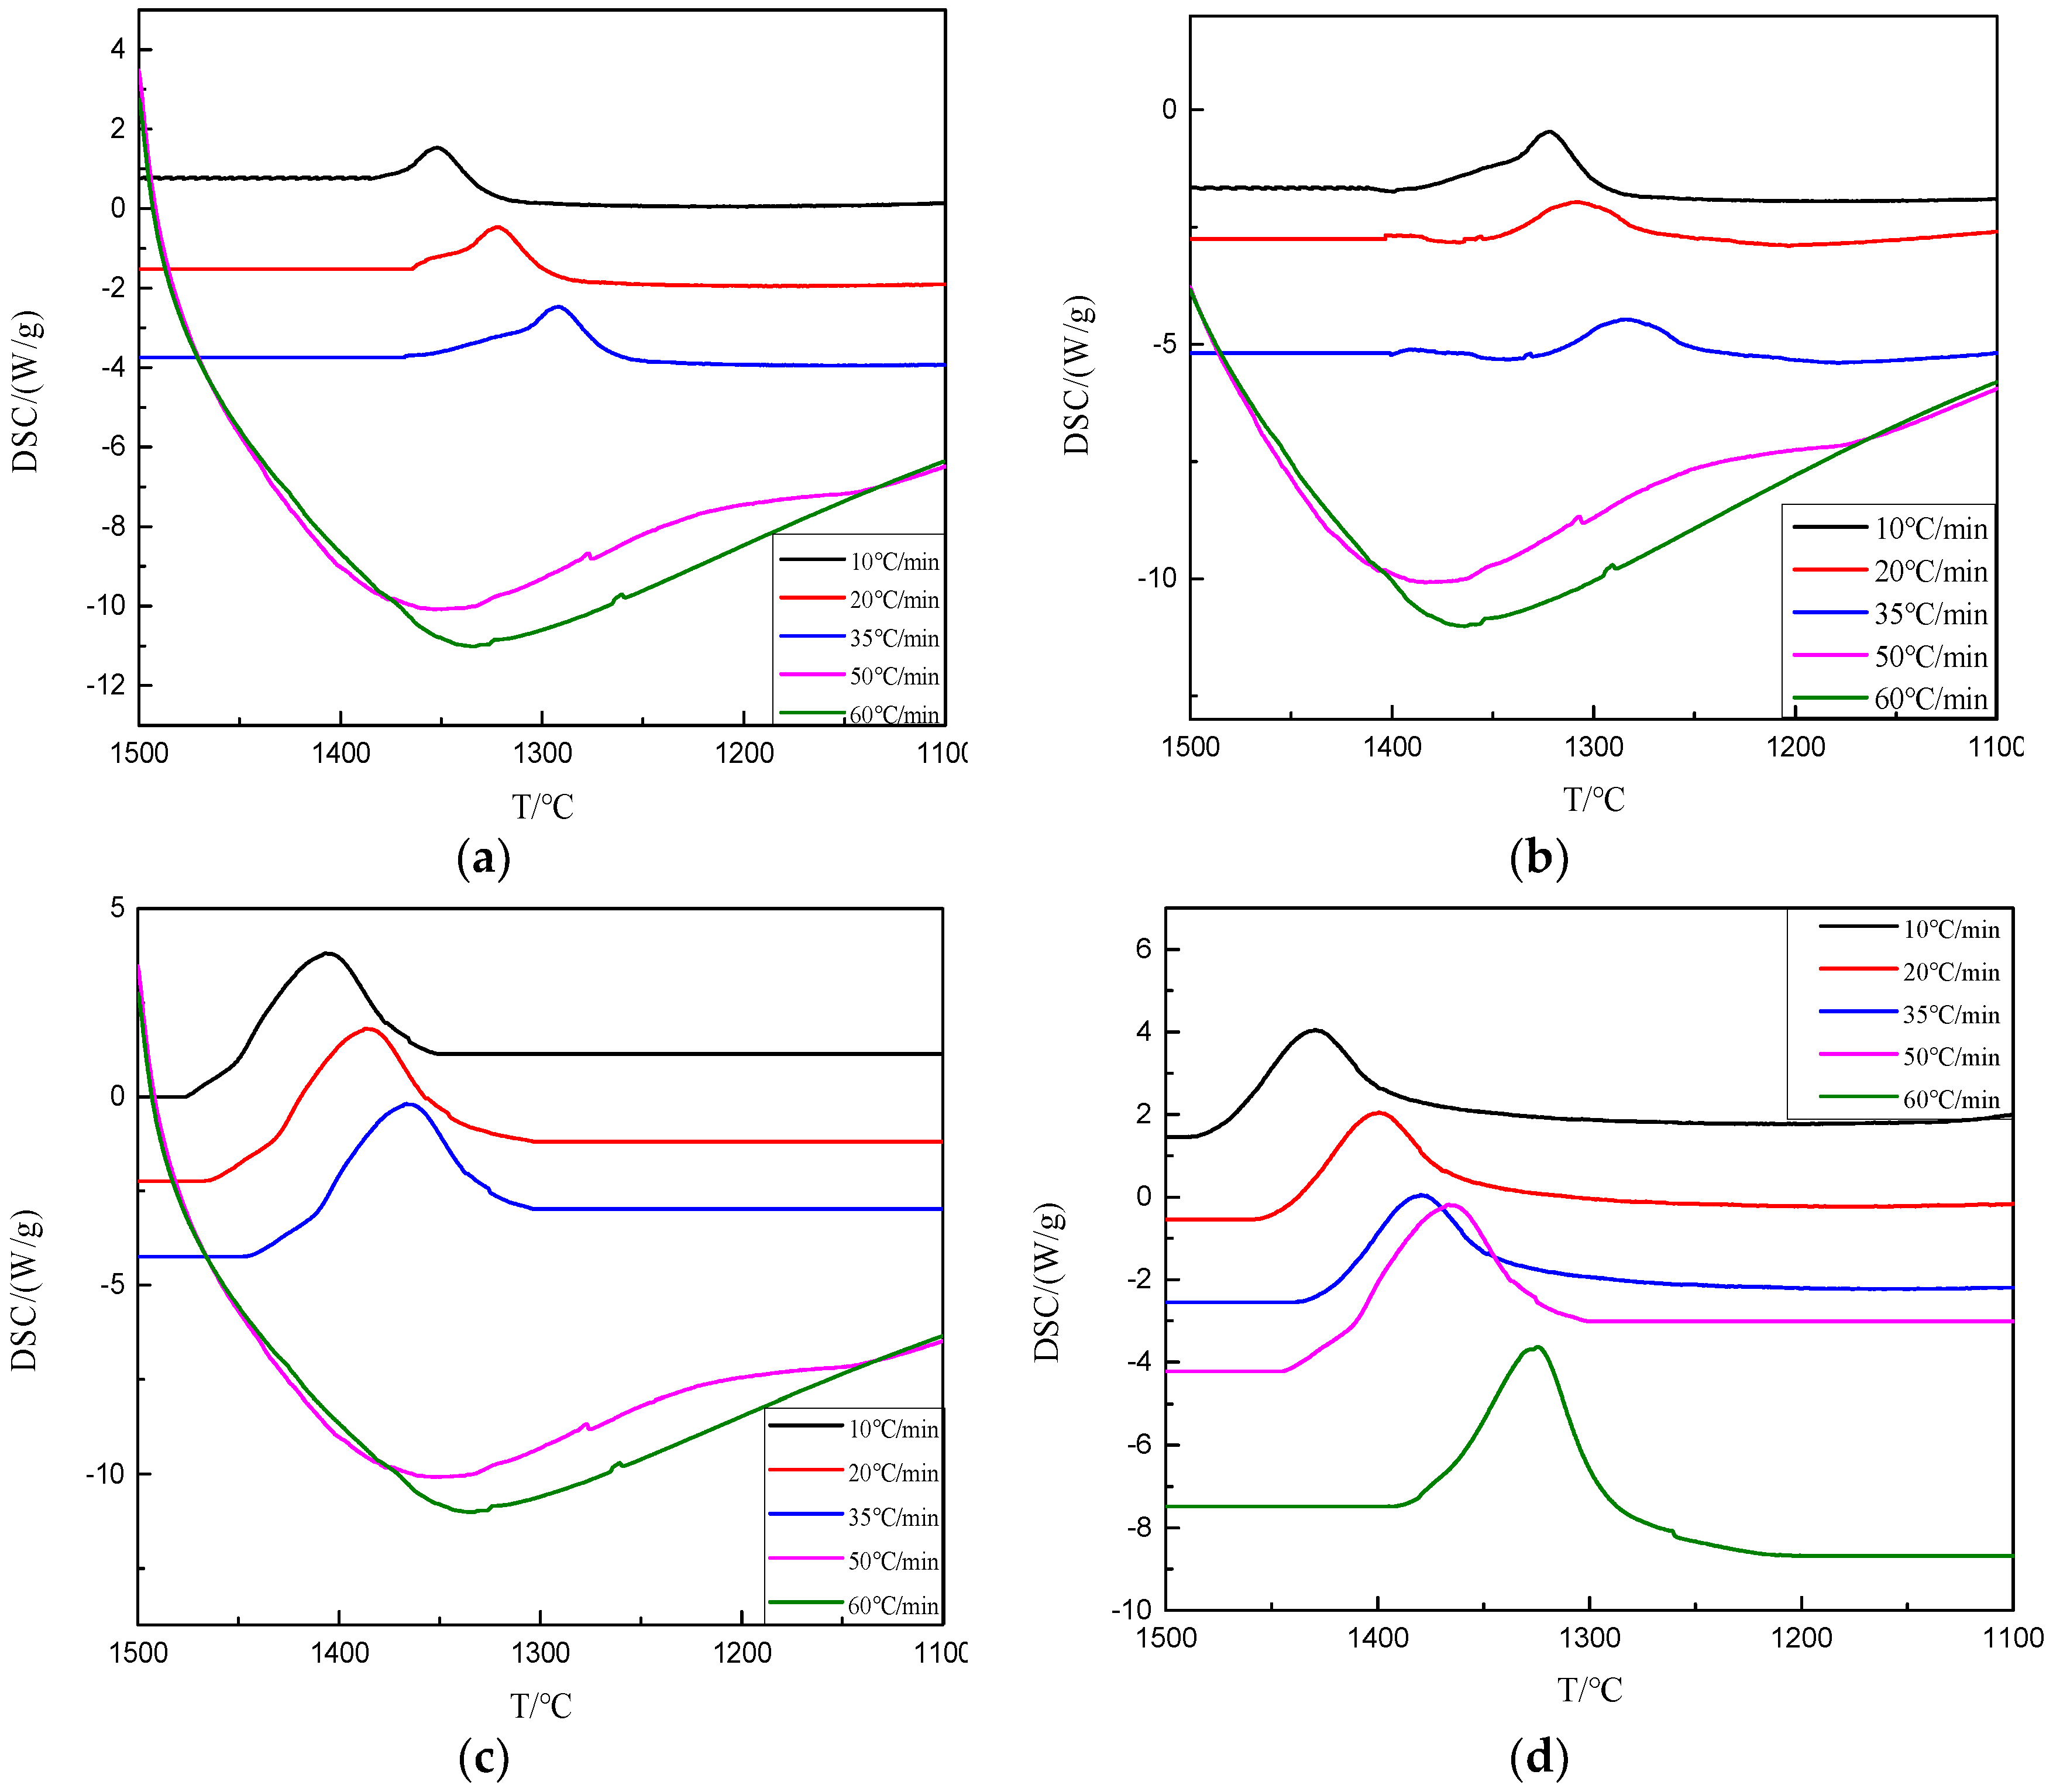
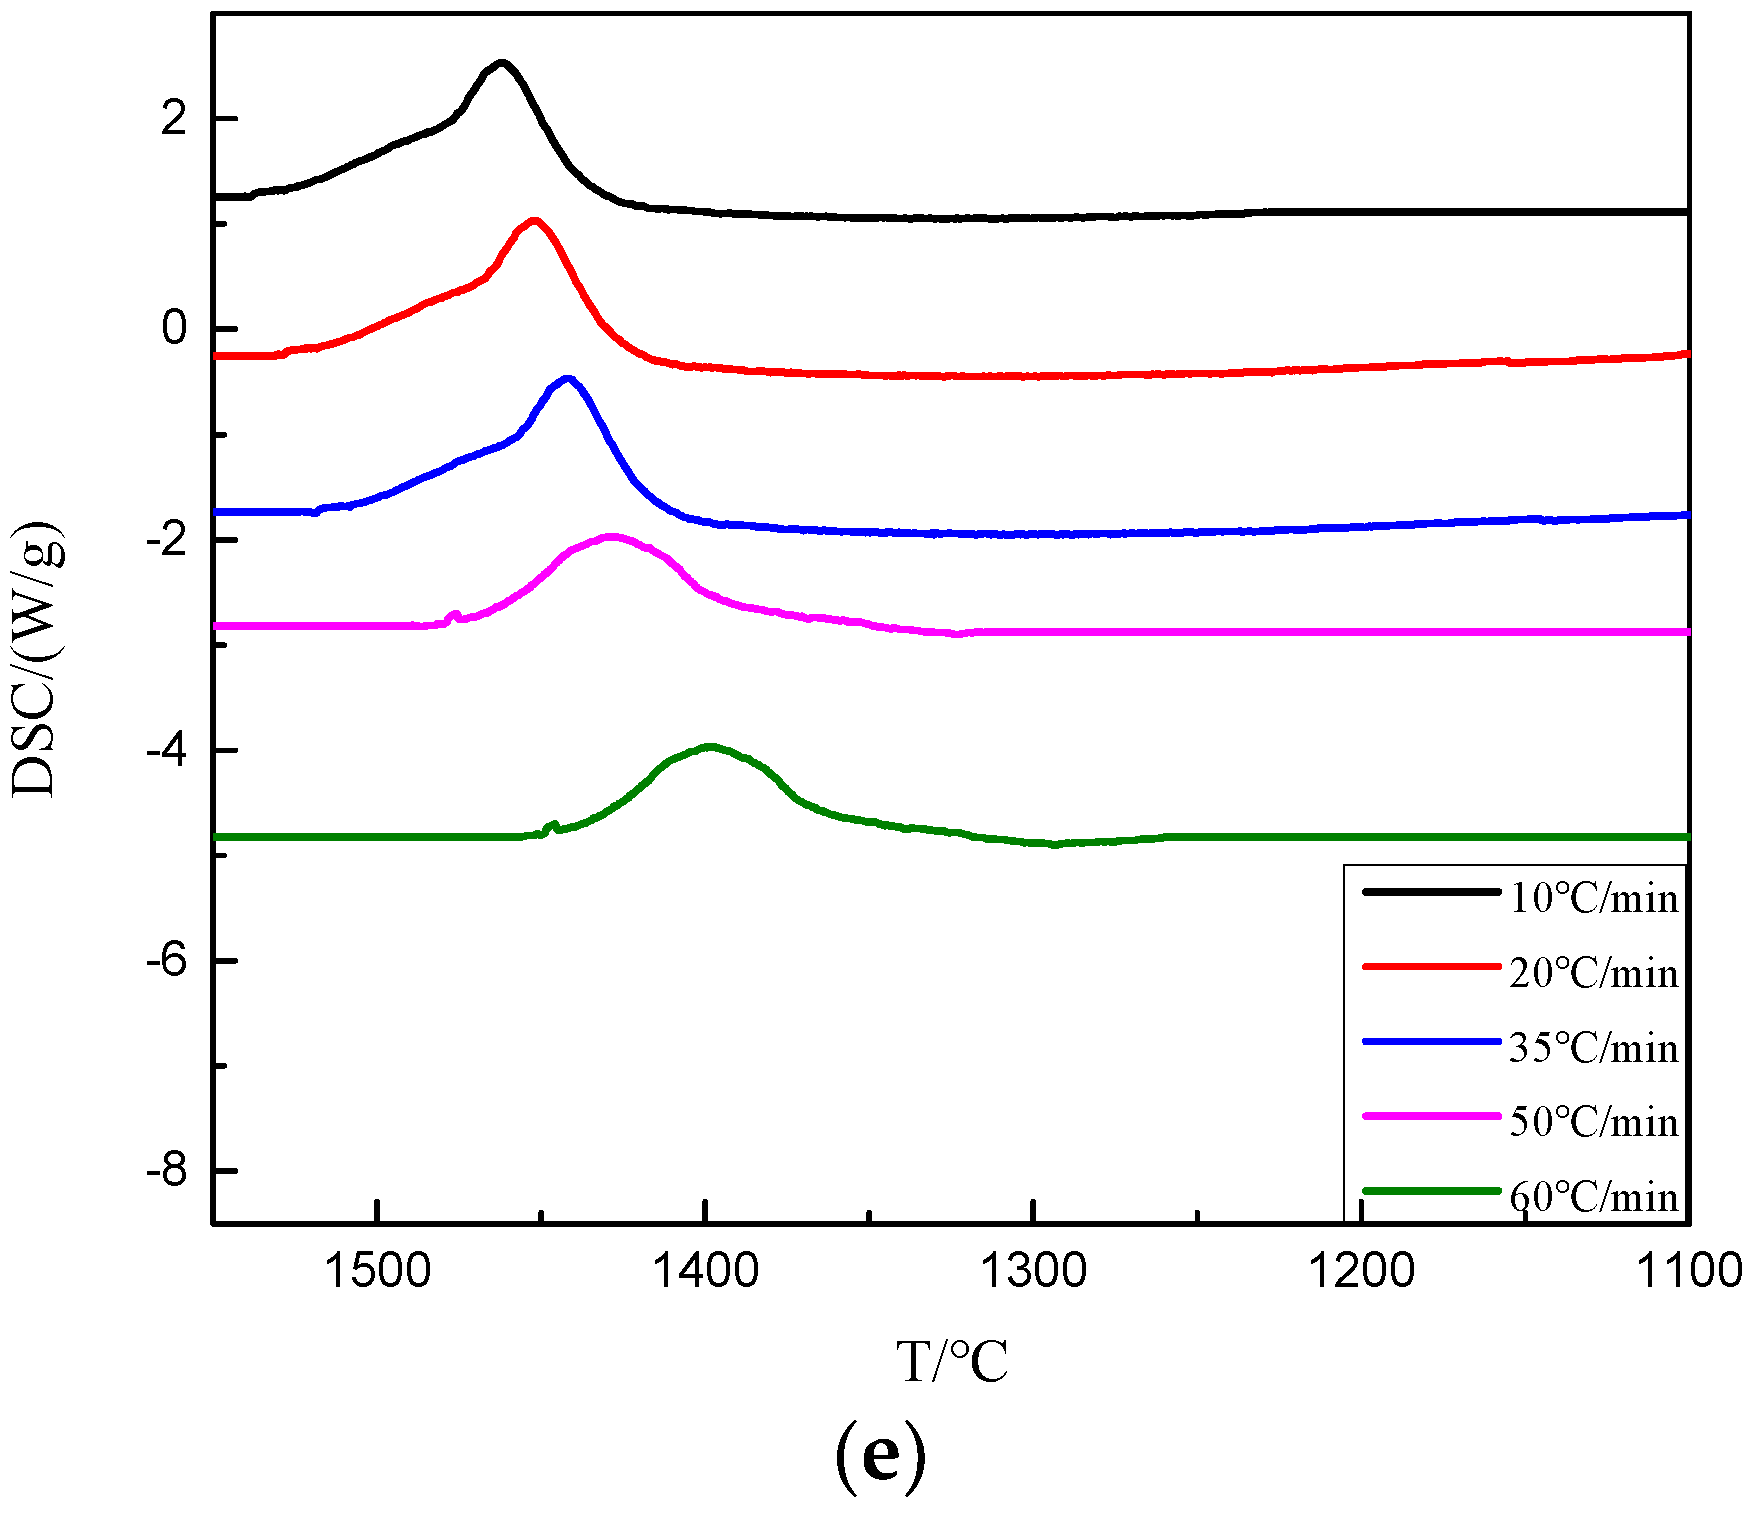
3.4. Crystallization Mechanism of BFS under Different Basicities

The amorphous content of BFS would directly affect the quality of subsequent slag beads, so it was very important to study the influence of different components on the crystallization behavior of BFS. By conducting DSC experiments, the crystallization behavior of BFS with different basicities and cooling rates was studied, and the crystallization activation energy and Avrami exponent were calculated to analyze the crystallization mechanism of BFS. Since the crystallization behavior of BFS was closely related to the initial crystallization temperature, only the temperature corresponding to the first exothermic peak in the DSC curve was studied, and the experimental data were all obtained by the Proteus analysis software.
As shown in Figure 8 and Table 4, when the basicity was 1.0~1.2, the exothermic peaks of BFS were observed at different cooling rates. When the basicity decreased to 0.9 and the cooling rate was greater than 50 °C/min, no obvious exothermic peaks appeared. At the same cooling rate, the initial crystallization temperature of BFS increased with the increase of basicity. At the same basicity, the initial crystallization temperature of BFS decreased with the increase of the cooling rate, which indicated that the basicity decrease and the cooling rate increase were beneficial to inhibit the crystal precipitation in BFS. From a kinetic point of view, the transformation of glass phase into crystal phase required a certain amount of energy to overcome the structural unit rearrangement and phase separation. The bigger the basicity, the more complete the silica ion in the melt disintegrated, and the less energy was needed to overcome the crystallization barrier, which made the crystal precipitate easier. On the other hand, the faster the cooling rate led to the increase of the undercooling degree, which prevented the formation and growth of the crystal nucleus, and thus the more difficult the crystal precipitated, the more lower the crystal temperature.

3.5. Calculation of Crystallization Activation Energy and Avrami Exponent

The capacity of glass precipitated crystal was usually characterized by crystallization activation energy and Avrami exponent [12], and the crystallization mechanism of BFS could be analyzed by calculating the two parameters.

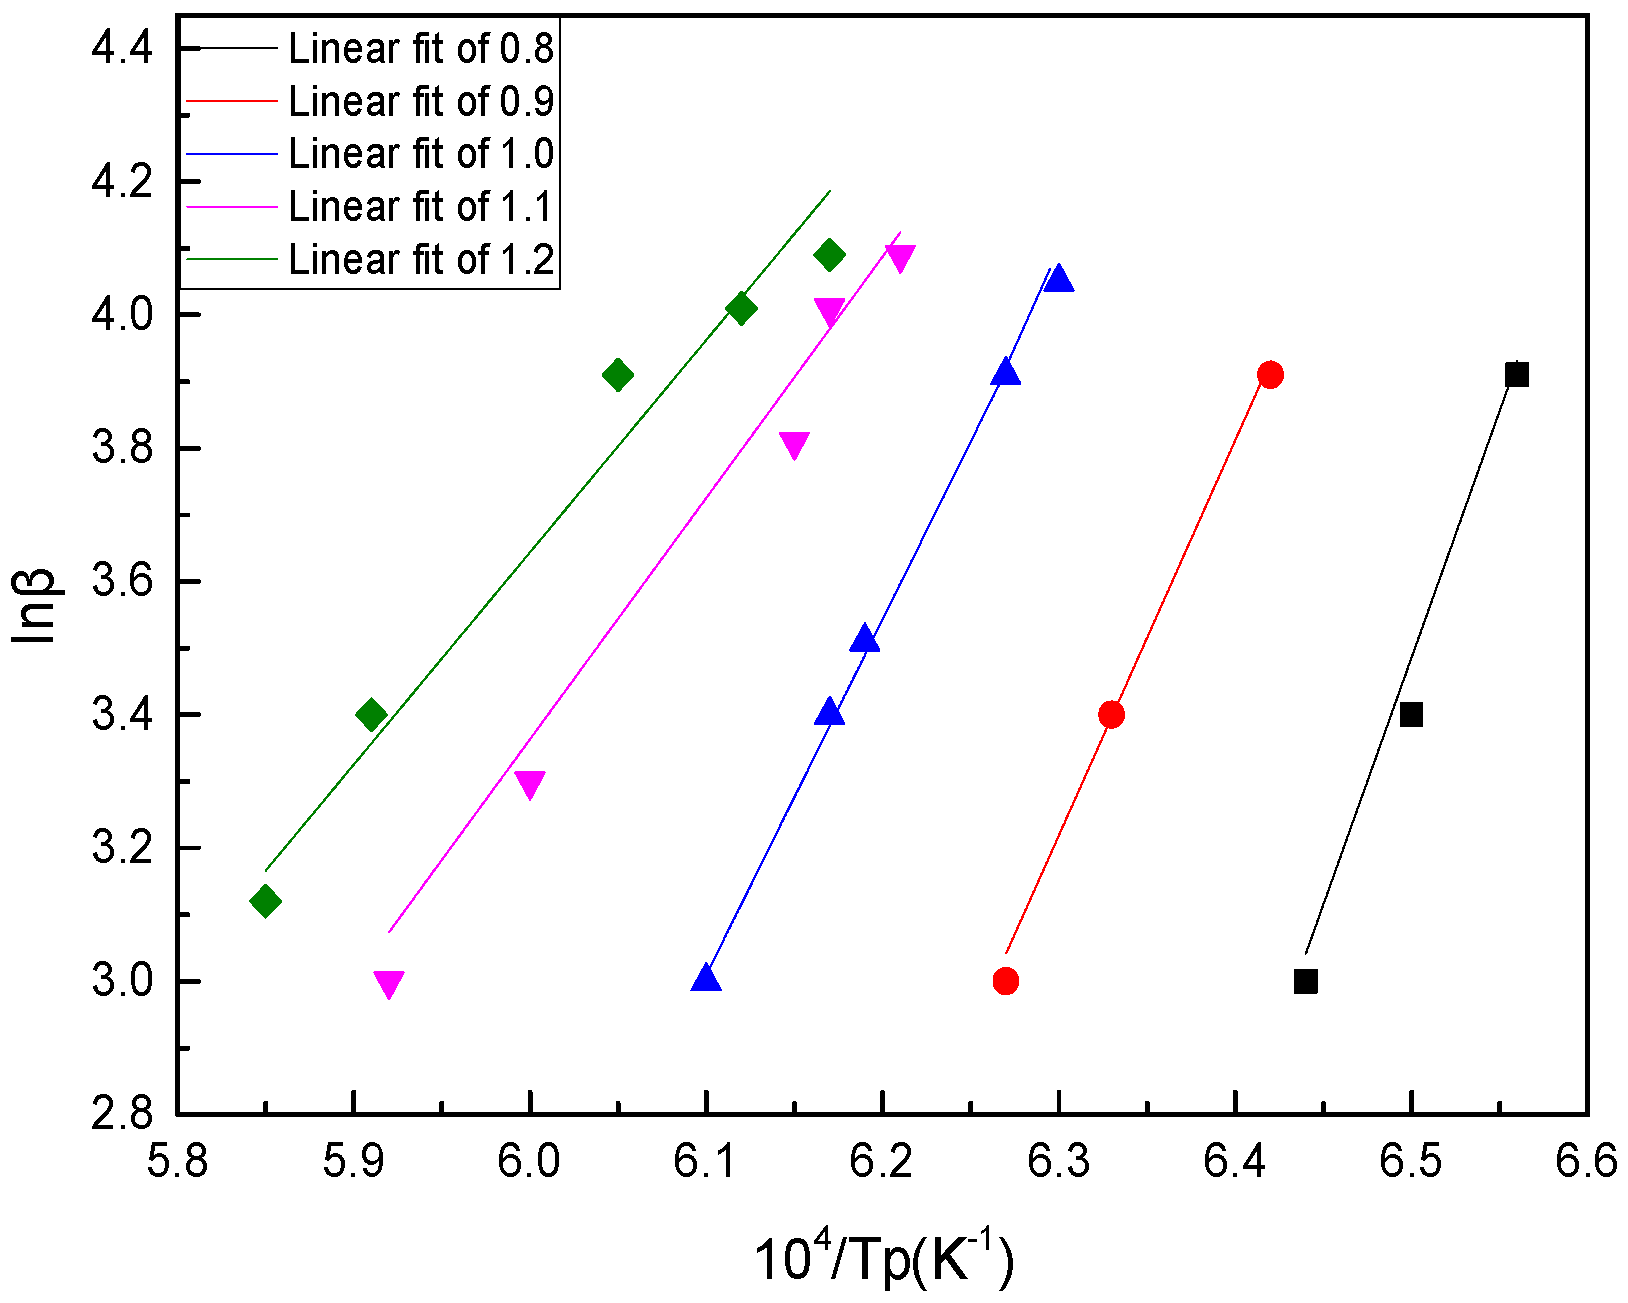
3.5.1. Calculation of Crystallization Activation Energy

Kissinger [13] proposed the method of calculating crystallization activation energy based on the traditional JMA theory equations, as shown in Equation (4).
ln ( β T p 2 ) = E R ( 1 T p ) + ln ( K 0 R E )
where β is the cooling rate; Tp is the crystallization temperature corresponding to exothermic peak in DSC curve; R is the gas constant.
By drawing ln(β/Tp2)~104/Tp, the crystallization activation energy could be obtained by calculating the straight slope −E/R, which can be obtained by linear fitting for each value point.
Another method for calculating the crystallization activation energy under non-isothermal conditions is the Ozawa [14] method, which is shown in Equation (5).
ln β = E / ( R T p ) + C
Moreover, by drawing lnβ~104/Tp, the crystallization activation energy could be obtained by calculating the straight slope −E/R, which can be obtained by linear fitting for each value point.
As shown in Figure 9 and Figure 10 and Table 5, the calculated value of the Kissinger method was slightly larger than that of the Ozawa method, but the results were consistent. With the increase of basicity, the crystallization activation energy of BFS decreased gradually, which showed that the bigger the basicity, the smaller the crystallization barrier to overcome; and the smaller the crystallization energy, the easier it was to form and grow the crystals. That is to say, the decrease of basicity was beneficial to the preparation of amorphous slag beads.

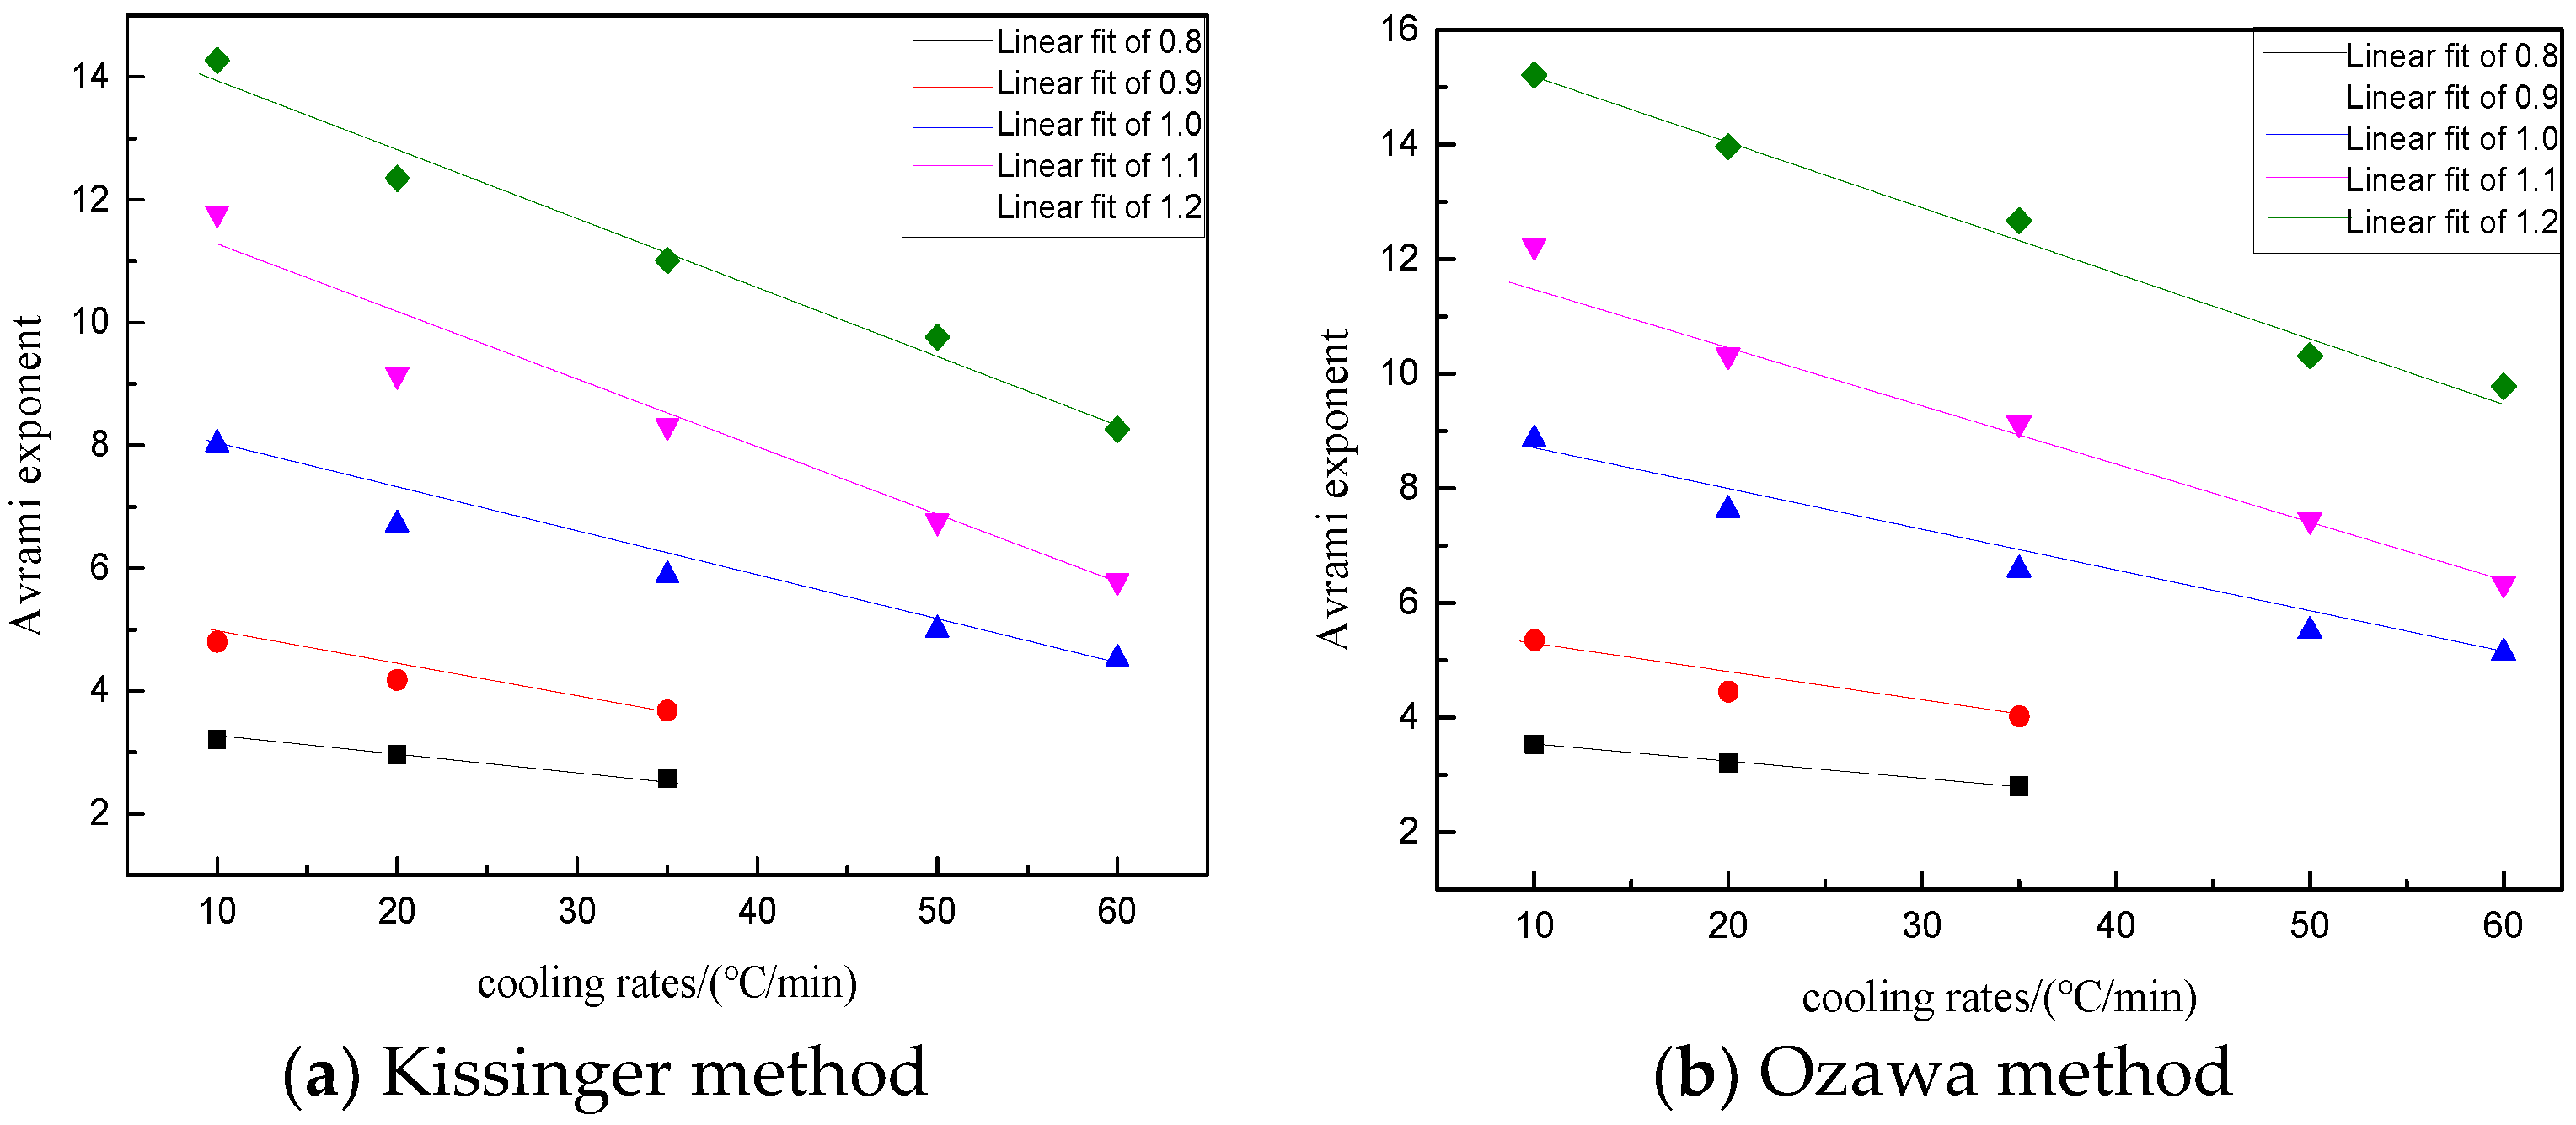
3.5.2. Calculation of Avrami Exponent

According to the crystallization kinetics, the glass precipitated crystals must satisfy that the crystal nucleation and growth inside the glass and the Avrami exponent (n) could reflect the degree of difficulty of crystal precipitation to a certain extent. Generally, the larger the n value, the easier it was to precipitate crystals. The glass crystallization was divided into surface crystallization and volume crystallization. When 0 < n < 3, only the surface crystallization occurred; when n > 3, volume crystallization occurred. The Avrami exponent was obtained by Equation (6) after calculating the E with the Kissinger and Ozawa methods.
n = 2.5 R T p 2 / ( T FWHM E )
where Tp is the initial crystallization temperature; TFWHM is the half-height width of crystal peak of DSC curve; E is the crystallization activation energy.
From Table 6 we could see that the Ozawa values were slightly larger than the Kissinger values, but the results obtained by the two methods were consistent. At the same basicity, the Avrami exponent decreased gradually with the increase of the cooling rate. At the same cooling rate, the Avrami exponent increased gradually with the increase of basicity. It could be seen that the increase of the cooling rate and the decrease of basicity could inhibit the crystal nucleation and growth, thus inhibiting the crystal precipitation.
For further analysis of the influence of slag basicity and cooling rate on the Avrami exponent, a linear fitting of the Avrami exponent with different basicities and different cooling rates was carried out, and the results are shown in Figure 11 and Equations (7) and (8).
n k 0.8 = 0.03 β + 3.31 ; n k 0.9 = 0.04 β + 5.04 ; n k 1.0 = 0.08 β + 8.11 ; n k 1.1 = 0.13 β + 11.90 ; n k 1.2 = 0.15 β + 14.36
n o 0.8 = 0.03 β + 3.85 ; n o 0.9 = 0.04 β + 5.76 ; n o 1.0 = 0.09 β + 9.46 ; n o 1.1 = 0.14 β + 12.16 ; n o 1.2 = 0.16 β + 16.56
According to the above relations, the Avrami exponent decreased with the increase of the cooling rate under any basicity. The smaller the basicity, the easier it was for BFS to crystallize on the surface, and the more difficult it was for the crystal phase to precipitate. This was mainly because in the case of low basicity, it was difficult to move the large volume silicon–oxygen complex anion contained in the slag during cooling, and thus making it difficult to rearrange in a regular and orderly manner. Therefore, it was more difficult to precipitate the crystal phase. Similarly, the increase of the cooling rate increased the undercooling degree, the kinetic energy of particles decreased, the particles could not move freely, and the nucleus could not form and grow, which led to the crystals not being able to form easily.

4. Conclusions

The granulation mechanism and crystallization mechanism of BFS under different basicities were studied. The component and cooling rate of amorphous slag beads which was beneficial to granulation were obtained, and the results were as follows:
  • The BFS granulation products were slag beads with different particle sizes and fibers. The particle size distribution was mainly concentrated in 1~2.5 mm, which was basically a normal distribution, and the particle size distribution was more uniform. With the increase of basicity, the bead formation rate increased gradually, the number of small size slag beads increased gradually, and the shape changed more regularly. The amorphous degree of slag beads could be improved by decreasing the slag beads basicity and particle size. The amorphous degree of slag beads with a basicity lower than 0.8 and a diameter less than 50 mesh could reach 100%.
  • Decreasing basicity could make BFS have higher crystallization activation energy and smaller Avrami exponent, which was not conducive to crystal nucleation and growth. An increasing cooling rate could increase the undercooling degree and inhibit crystal growth. The critical cooling rate required for the amorphization increased when the basicity increased. Overall, the analysis showed that the decrease of basicity and the increase of cooling rate were beneficial to the preparation of amorphous slag beads. The slag with bigger basicity needed a larger cooling rate than that of smaller basicity to obtain a high content of amorphous phase slag beads.

Author Contributions

C.L. performed the calculation, Y.K. wrote the original draft and analyzed the results, Y.Z. and H.X. provided suggestions and comments. All authors have read and agreed to the published version of the manuscript.

Funding

This research was funded by Hebei Key Research and Development Program of China (19273806D).

Acknowledgments

The calculations and experiments were done with the help of the teachers in the research group.

Conflicts of Interest

The authors declare no conflict of interest.

References

  1. Min, Y.; Huang, J.; Liu, C.J.; Jiang, M.F.; Yu, X.Q. Physical simulation of molten slag granulation by rotary disk. J. Iron Steel Res. Int. 2013, 20, 26–32. [Google Scholar] [CrossRef]
  2. Ta, Y.; Zhu, X.; He, X.; Ding, B.; Wang, H.; Liao, Q.; Li, H. Granulation characteristics of molten blast furnace slag by hybrid centrifugal-air blast technique. Powder Technol. 2018, 323, 176. [Google Scholar]
  3. Peng, H.; Shan, X.; Kang, J.; Ling, X.; Wang, D. Influence of rotary disk configurations on droplets characteristics in molten slag granulation for waste heat recovery. Appl. Therm. Eng. 2018, 135, 269. [Google Scholar] [CrossRef]
  4. Zhang, H.; Wang, H.; Zhu, X.; Qiu, Y.; Li, K.; Chen, R.; Liao, Q. A review of waste heat recovery technologies towards molten slag in steel industry. Appl. Energy 2013, 112, 956. [Google Scholar] [CrossRef]
  5. Liu, J.; Yu, Q.; Duan, W.; Qin, Q. Experimental investigation of glass content of blast furnace slag by dry granulation. Environ. Prog. Sustain. 2015, 34, 485. [Google Scholar] [CrossRef]
  6. Purwanto Akiyama, T. Hydrogen production from biogas using hot slag. Int. J. Hydrog. Energy 2006, 31, 491. [Google Scholar] [CrossRef]
  7. Yoshinaga, M.; Fujii, K.; Shigematsu, T.; Nakata, T. Method of dry granulation and solidification of molten blast furnace slag. ISIJ Int. 1982, 22, 823. [Google Scholar] [CrossRef]
  8. Kashiwaya, Y.; In Nami, Y.; Akiyama, T. Development of a rotary cylinder atomizing method of slag for the production of amorphous slag particles. ISIJ Int. 2010, 50, 1245. [Google Scholar] [CrossRef] [Green Version]
  9. Ren, Q.; Zhang, Y.; Long, Y.; Zou, Z.; Pei, J. Crystallisation behaviour of blast furnace slag modified by adding fly ash. Ceram Int. 2018, 44, 11628–11634. [Google Scholar] [CrossRef]
  10. Dai, B.; Zhang, J.L. The research of blast furnace slag fluidity by viscosity experiment and phase diagram analysis. Am. Soc. Met. 2020, 17, 25–29. [Google Scholar]
  11. Geng, M.; Zhang, Y.; Xiang, L.; Yin, J.; Tao, W. Influence of MgO content and basicity on viscosity of blast furnace slag. Henan Metall. 2005, 13, 7–8. [Google Scholar]
  12. Zhao, Y.C.; Xiao, H.N.; Tan, W. Study on compositions and crystallization character of the glass-ceramics with good abrasion resistance. J. Chin. Ceram. Soc. 2003, 31, 406. [Google Scholar]
  13. Kissinger, H.E.; Mcmurdie, H.F.; Simpson, B.S. Thermal Decomposition of Manganous and Ferrous Carbonates, J. Am. Ceram. Soc. 1956, 39, 168.
  14. Ozawa, T. Kinetic analysis of derivative curves in thermal analysis. J. Therm. Anal. 1970, 2, 301. [Google Scholar] [CrossRef]
Figure 1. Experimental diagram of gas quenching BFS: (a) Experimental equipment diagram; (b) Gas quenching diagram.
Coatings 10 00372 g001
Figure 2. Gas quenching mechanism diagram.
Coatings 10 00372 g002
Figure 3. Particle size distribution and bead formation rate of slag beads with different basicities. (a) Particle size distribution; (b) Bead formation rate.
Coatings 10 00372 g003
Figure 4. Visco-temperature curves and surface tension at different basicities. (a) Visco-temperature curves; (b) Surface tension at different basicities.
Coatings 10 00372 g004
Figure 5. Effect of different basicities on spherical degree. Spherical degree: (a) R = 1.2; (b) R = 1.1; (c) R = 1.0; (d) R = 0.9; (e) R = 0.8.
Coatings 10 00372 g005aCoatings 10 00372 g005b
Figure 6. Analysis of X-ray diffraction patterns and amorphous content of slag beads with different basicities. (a) XRD analysis of slag beads; (b) Amorphous content of slag beads.
Coatings 10 00372 g006
Figure 7. Micromorphology analysis of slag beads under different basicities. (a) R = 0.8; (b) R = 0.9; (c) R = 1.0; (d) R = 1.1; (e) R = 1.2.
Coatings 10 00372 g007
Figure 8. The DSC cooling curves of modified BFS with different basicities. (a) R = 0.8; (b) R = 0.9; (c) R = 1.0; (d) R = 1.1; (e) R = 1.2.
Coatings 10 00372 g008aCoatings 10 00372 g008b
Figure 9. Crystallization activation energy (E) calculated using the Kissinger method.
Coatings 10 00372 g009
Figure 10. Crystallization activation energy (E) calculated using the Ozawa method.
Coatings 10 00372 g010
Figure 11. The influence of cooling rates on the Avrami index using different methods. (a) Kissinger method; (b) Ozawa method.
Coatings 10 00372 g011
Table 1. The components of blast furnace slag (BFS) and modifying agent (mass fraction/%).
ComponentsSiO2CaOMgOAl2O3Fe2O3TiO2K2ONa2OMnO
BFS33.5336.258.6415.821.571.380.540.320.17
Fly ash51.873.370.01133.343.60.820.780.100.044
Limestone2.0852.042.851.22-----
Table 2. The experimental scheme (mass fraction/%).
No.BFS/kgLimestone/kgFly Ash/kgComponentsR
CaOSiO2MgOAl2O3
124.06-5.9429.7437.161.7119.290.8
226.31-3.6932.2035.797.5817.970.9
328.41-1.5934.5134.508.1816.751.0
429.620.38-36.2532.968.6415.821.1
527.772.23-37.5631.338.2514.801.2
Note: R was defined as the mass ratio of main basic oxides to the main acidic oxides in the BFS, and the equation was R = ω CaO ω SiO 2 .
Table 3. Amorphous content of slag beads with different basicities.
R0.80.91.01.11.2
<0.15 mm100.0099.8799.6698.5997.79
0.15~0.30 mm100.0098.9198.2597.1696.79
0.30~1 mm99.8797.4596.4395.3294.32
1~2.5 mm97.4696.1395.2793.2191.86
2.5~5 mm95.5194.5793.3191.0689.17
Table 4. Crystallization temperature of modified BFS/°C.
β/°C·min−10.80.91.01.11.2
101319.81356.61400.21438.01457.7
201309.21335.21378.01423.21432.2
351290.11316.11355.31419.31430.6
50--1342.11383.51421.1
60--1309.61342.81389.3
Table 5. Crystallization activation energy (E) calculated using different methods (KJ/mol).
RKissingerOzawa
0.8518 ± 59490 ± 50
0.9437 ± 17429 ± 33
1.0327 ± 33297 ± 27
1.1280 ± 41265 ± 51
1.2193 ± 35172 ± 48
Table 6. Values of the Avrami exponent (n) using different methods.
Basicitiesβ/°C·min−11020355060
0.8Kissinger3.212.962.58--
Ozawa3.533.212.81--
0.9Kissinger4.804.183.68--
Ozawa5.354.454.02--
1.0Kissinger8.026.715.885.004.52
Ozawa8.857.626.585.515.13
1.1Kissinger11.789.158.326.765.79
Ozawa12.2310.329.137.456.34
1.2Kissinger14.2712.3511.019.768.26
Ozawa15.2113.9612.6710.319.78

