1. Introduction
Biological membranes are necessary for living organisms because they provide a selective barrier of permeability, as well an environment for many processes occurring there [
1]. These membranes are usually described as lipid bilayers, associated with proteins and other components, e.g., polysaccharides [
2]. Currently, many studies are carried out on membrane models, i.e., monolayers [
3] or bilayers [
4,
5,
6]. The main goal of developing artificial lipid membranes is to reproduce the natural functions and to understand the interaction between all the membrane components on the molecular level [
7]. Moreover, lipid membrane models are used in studies of drug transport through membranes [
8] or in biosensors [
9,
10].
Saponins belong to a group of biological active compounds. They are natural compounds that are present in many plants of various species [
11]. Their sources include stems, leaves, and fruits, but also plant roots. In addition to plants, saponins are also components of fungi and marine organisms, such as starfish [
12]. Saponins are high molecular weight glycosides, consisting of a polycyclic aglycone part (sapogenin) combined with one or more side chains of the sugar molecule [
13]. Due to the structure of saponins, they are divided into two main groups, namely steroidal and triterpene [
14]. Saponins have many interesting properties. One of them is the active property of lowering surface tension and foaming properties, as evidenced by the amphipathic nature of these substances. They are used in the cosmetics industry, in the laundry detergent industry, and the food industry [
15]. However, the most valuable properties of saponins are their healing properties. They possess anti-inflammatory [
16,
17], antimicrobial [
18,
19], and antifungal [
20] properties, but are also used to synthesize steroid drugs or hormones. Literature reports also indicate that saponin compounds have antitumor activity [
21]. Modern research proves that saponins can inhibit the growth of various cancer cells by inhibiting the cell cycle and apoptosis [
22].
Due to their high biological and pharmacological activity and amphiphilic character, saponins are widely used by scientists as lipid membrane components [
23,
24,
25,
26]. Korchowiec et al., using Langmuir monolayer techniques, studied the interaction between saponins (digitonin and the commercial Merck Saponin) and lipid model systems. The authors concluded that the saponins influence lipid membranes by changing the physical state of membranes [
23]. Geisler et al. discussed recent progress in the physicochemical understanding of interactions between β-aescin and phospholipid model membranes [
26]. The results summarized in the review indicate that the interactions are due to the specific molecular structure of β-aescin. In particular, the pH and the protonation state of studied saponin, affect its self-assembly in lipid membranes [
26].
The compounds that are the subject of this study (diosgenin and diosgenin acetate) are classified as steroid sapogenins, i.e., only non-sugar parts of saponins are studied here. According to the literature cited above, many studies exist on the therapeutic effects of saponins, but the properties of sapogenins themselves have not been studied yet. Diosgenin and diosgenin acetate were chosen here due to their many treatment properties, in particular, their cytotoxic activity to cancer cells. The literature data show that diosgenin inhibits proliferation and induces apoptosis in various cancer cells, such as, colon carcinoma, breast carcinoma cells, and leukemia [
27,
28,
29].
According to our knowledge, there are few data on interactions between bilayer lipid membranes and sapogenin; in particular, there is a lack of data concerning the physicochemical and electrical properties of bilayer lipid membranes when modified by diosgenin and diosgenin acetate. Therefore, this work aims to analyze the impact of these sapogenins on the interfacial tension and the surface charge density of the model cell membranes (spherical bilayer lipid membranes and liposomes,
Figure 1). These parameters are very important for characterizing lipid membranes, both natural and artificial membranes. We previously described changes in the interfacial tension and the surface charge density influenced by, for example, membrane compositions in lipid–lipid [
30,
31,
32], lipid–sterol [
33,
34], and lipid–fatty acid [
35], or lipid–amine membranes [
36,
37]. Particularly important for understanding the membrane surface phenomena is their quantitative assessment, which is necessary for the complete interpretation. We realize this here by using simple mathematical relationships for the theoretical models relating to the quantitative description of phenomena between the membrane components and between them and surroundings. Then, through theoretical descriptions of complex formation, we can verify the experimental and theoretical data. This enables the quantitative determination of the parameters describing the equilibria, i.e., the surface tension, surface pressure, surface charge density, stability constants, and complex formation energies. Since no accurate data of the stability constants for forming connections exist in the literature, our team, as a first, has determined these parameters and introduced them to the world. This represents an original contribution to the knowledge of the biochemistry and biophysics of lipid membranes [
30,
31,
32,
33,
34,
35,
36,
37].
The examinations presented in this paper are a continuation of our research on the interaction of model membranes (1,2-dipalmitoyl-sn-glycero-3-phosphocholine) and molecules of increasing complexity (diosgenin, diosgenin acetate). We analyze the effect of interfacial tension on the composition of the 1,2-dipalmitoyl-sn-glycero-3-phosphocholine (DPPC)-Dio and DPPC-DAc systems over a possible range of compositions. We also show a comparison of the complexes’ parameters (stability constants and the surface areas). We also analyze the effect of the pH of the electrolyte solution and the compositions of the membranes on surface charge to better describe interactions in the DPPC membranes when modified by the sapogenins. Since these parameters influence the interactions between the membranes and biological active compounds, the data presented below may be, in our opinion, useful in understanding membrane binding mechanisms.
2. Materials and Methods
2.1. Materials
Membrane-forming materials: 1,2-Dipalmitoyl-
sn-glycero-3-phosphocholine (semisynthetic, ≥99%), diosgenin (>99%, TLC), and diosgenin acetate (>98.5%) were purchased and used as received (
Table 1). DPPC bilayers exhibit a well-defined gel phase at a measurement temperature of 293 K. The molecular weights of DPPC, Dio, and DAc were approximately determined to be 734.04, 414.62, and 456.67 g·mol
−1, respectively.
Electrolyte solutions: The electrolyte solutions for interfacial tension measurements (0.1 M potassium chloride) and microelectrophoretic measurements (0.155 M sodium chloride) were prepared using water purified through a Milli-Q plus water purification system (Millipore, Burlington, MA, USA) with a resistivity of 18.2 MΩ·cm.
The characteristics of the reagents used for the research are presented in
Table 1.
2.1.1. Spherical Bilayers Preparation
Spherical bilayer-forming solutions: DPPC, Dio, and DAc were purified by dissolving in chloroform (anhydrous, ≥99%), then the solvent was evaporated under inert gas. The stock solutions for bilayer formation were composed of 20 mg·cm−3 of the tested components (DPPC, Dio, DAc) in n-decane and butanol (anhydrous, ≥99%) in a ratio of 20:1. The solution containing the membrane components was stored at 4 °C. During bilayer formation, the organic solvents were removed and the membrane composition is the same proportion as the tested components as in the stock solution.
2.1.2. Liposomes Preparation
Liposomes-forming solutions: The solutions for liposome formation were composed of 10 mg·cm−3 of the tested substances (DPPC, Dio, or DAc) in n-chloroform (anhydrous, ≥99%) were mixed in various molar ratios (3:1; 1:1; 1:3). Then, the n-chloroform was evaporated under a stream of inert gas to obtain a dry residue. The resulting residue was hydrated with an electrolyte solution (0.155 M NaCl).
Preparation of liposomes via the sonication method: The lipid membranes were prepared by sonicating the suspension (ultrasound generator UD 20, Techpan, Poland). The operation was repeated five times, 90 s each. It was carried out using an ice bath, since, during the process, heat is liberated.
2.2. Interfacial Tension Measurements
Working conditions and experimental procedure: The interfacial tension measurements are based on Young’s and Laplace’s equation [
38]:
Using the equation, it is possible to determine the interfacial tension, γ, of a lipid bilayer by measuring the radius of curvature, R, of a convex surface formed by pressure difference, Δp, applied on both sides.
The apparatus and method of measurement have both been described in detail previously [
39,
40,
41]. The measurement cell is built of two glass elements separated by a mount holding (0.15 cm diameter) circular Teflon cap that has been axially pierced, leaving a small orifice. The Mueller–Rudin method [
42] was used to form the bilayers at the flat end of the Teflon cap. Both glass elements were filled with 0.1 M KCl. The stock solution was introduced into the flat wall of the Teflon cap, and the pressure was applied to the left glass element of the measuring cell using a manometer.
The convexity of the bilayer cap was measured to a 0.05-mm precision by the optical part of the measuring apparatus consisting of a charge-coupled device (CCD) camera and monitor. The convexity of the bilayers was monitored using reflected light microscopy with a high-brightness yellow LED source. The microscope and LED were mounted on brackets, enabling the illuminator, measuring vessel, and microscope to be placed on the optical axis. The distance between the microscope and the measuring cell can also be adjusted to focus on the membrane deep in the measuring vessel. Then, the radius of curvature was determined using the convexity obtained values of the lipid cap and the diameter of the Teflon element on which the membranes were formed, corresponding to the diameter of the lipid cap.
The radius of curvature,
R, was obtained using this value and the diameter of the Teflon cap,
r, corresponding to the diameter of the lipid cap and the convexity of the bilayer, as shown in
Figure 2.
The overpressure, Δp, causing the bilayer convexity was determined using the manometer. The radius of the curvature of the membrane was measured using the optical part of the measuring cell. Then, the interfacial tension according to Young’s and Laplace’s equation (from the radius of curvature and pressure difference) was calculated.
The interfacial tension was measured on a bilayer 12–15 times. For each bilayer, about 10 instrument readings of the lipid spherical cap diameter were made, where the cap is formed by the pressure difference applied on both sides. These measurements were made within the whole range, from the very low values of the lipid spherical cap diameter to those almost equal to the Teflon cap radius. From all of the instrument readings, the arithmetical means and standard deviations were enumerated. Measurements with the preparation of the electrolyte solution were made 2–3 times to test the repeatability of these determinations. All presented experiments were carried out at a temperature of 293 ± 2 K.
2.3. Microelectrophoretic Measurements
The electrophoretic mobility values of liposomes were obtained using the laser Doppler Micro-electrophoresis (LDE) technique with a high performance Zetasizer Nano ZS (Malvern Instruments, Malvern, UK) analyzer. All measurements were performed vs. pH using a WTW InoLab pH 720 laboratory meter (WTW, Weinheim, Germany). Liposomes suspended in the electrolyte solution (0.155 mol·dm
−3 NaCl) were titrated to the given pH (range 2–10, every ± 0.3 units) with hydrochloric acid or sodium hydroxide. Six measurements were performed (each consisting of 100–200 runs, duration of 5 s) for each pH value, for each sample. The experiments were performed three times. The membrane surface charge densities were calculated with help presented below equation from the electrophoretic mobility data [
43]:
where
u is the electrophoretic mobility, η is the viscosity of solution, and
d is the thickness of the diffuse layer.
3. Results and Discussion
The problem of understanding the influence of biological active substances on the physicochemical properties of cell membranes is extremely important, in view of many possible applications in membrane science, such as the interaction of significant biological activity molecules with cell membranes. Various studies carried out in the past few years have confirmed the strong potential of bioactive compounds to inhibit the growth of various cancer cells. However, in the literature, there are few data on the effect of these substances on the electrical and physicochemical properties of model systems, where the lack of quantitative descriptions of equilibria is noticeable.
3.1. Interfacial Tension Experiment and Theoretical Considerations
We have considered the case when the components of the lipid bilayer of a two-component membrane, e.g., DPPC (component 1) and diosgenin or diosgenin acetate (component 2), do not form chemical compounds, where the interactions between the membrane components can then be described [
30,
41]:
where
and
(mol·m
−2) are the surface concentrations of bilayer components 1 and 2,
and
(mol·m
−2) are the quantities of bilayer components 1 and 2 per unit area of the membrane,
and
(N·m
−1) are the interfacial tensions of membranes formed from pure components 1 and 2,
(N·m
−1) is the measured interfacial tension of the bilayer membrane, and
and
are the solution mole fractions of bilayer components 1 and 2.
A linear equation is obtained by elimination of parameters
and
:
The membranes can also make the two elements able to form a complex. Complex stoichiometry results may vary, but since the first stability constant in these complexes is usually the largest [
44], we assumed that the complexes primarily have 1:1 stoichiometry.
In cases where membrane components form a 1:1 complex, interactions in the membrane can be described using a previously published set of equations [
45]. The equilibrium between the individual components that make up the complex can be written as follows:
Thus, the basic equation describing the interaction between components 1 and 2 can be written as follows:
where
and
Equation (8) can be simplified, assuming that the stability constant of the resulting complex has a high value. The use of this simplification results in linear behavior for small (
x2 <
x1) and large (
x2 >
x1)
x2 values.
When calculating the stability constant for the complex, Equation (8) can be simplified to
.
Equation (12) is used to calculate theoretical interfacial tension values for agreement between experimental and theoretical data.
where:
In the case of the two-component systems, it was assumed that the formation of a 1:1 complex is an explanation of the deviation from the additivity rule. Theoretical curves were obtained using the parameters characterizing complexes, such as the stability constants, molecular areas, and interfacial tension values. The accuracy of the presented models was verified by comparison with experimental data.
The complex formation energy of the DPPC-Dio and DPPC-DAc systems was calculated by Equation (13):
where
(m
2·mol
−1) is the stability constant of the DPPC-Dio or DPPC-DAc complex,
(J·mol
−1) is the DPPC-Dio or DPPC-DAc complex formation energy,
(J·mol
−1·K
−1) is the gas constant, and
T (K) is the temperature in Kelvin.
Figure 3 contains graphs for two systems, namely the DPPC-Dio (
Figure 3a) and DPPC-DAc (
Figure 3b) systems. When there are no interactions between membrane components, these functions should give straight lines (Equation (2)). Of course, this is not the case, suggesting that there is a complex or different structure in the DPPC-Dio and DPPC-DAc systems. Since Equation (3) assumes the formation of a 1:1 complex, our initial assumption was that, between the components of the bilayer, they form a complex. The interfacial tension of the examined systems was analyzed over the entire possible range of components’ compositions.
3.1.1. DPPC-Diosgenin Complex
The dependence of bilayer interfacial tension vs. membrane composition for the DPPC-Dio and DPPC-DAc membrane was analyzed in the possible concentration range. The interfacial tension of the DPPC-Dio membrane was determined vs. the composition with 60% of the diosgenin content because only with such contents of component 2 (Dio) with DPPC was a bilayer created. The pure DPPC interfacial tension value (component 1), γ
1, was determined directly and presented [
45], equal to 1.62 ± 0.12 × 10
−3 N·m
−1. Since diosgenin (component 2) does not create a bilayer, there are no accurate interfacial tension data in the literature. To describe the course of the experimental plot, the γ
2 value for the pure component is necessary. Therefore, the hypothetical interfacial tension data for the Dio bilayer were calculated by adjusting the experimental curve with the polynomial of the other mark, extrapolating the
x2 = 1 value (
Figure 4). The value is equal to 6.33 × 10
−4 N·m
−1. Such a low interfacial tension value confirms that it is not possible to create a pure Dio bilayer.
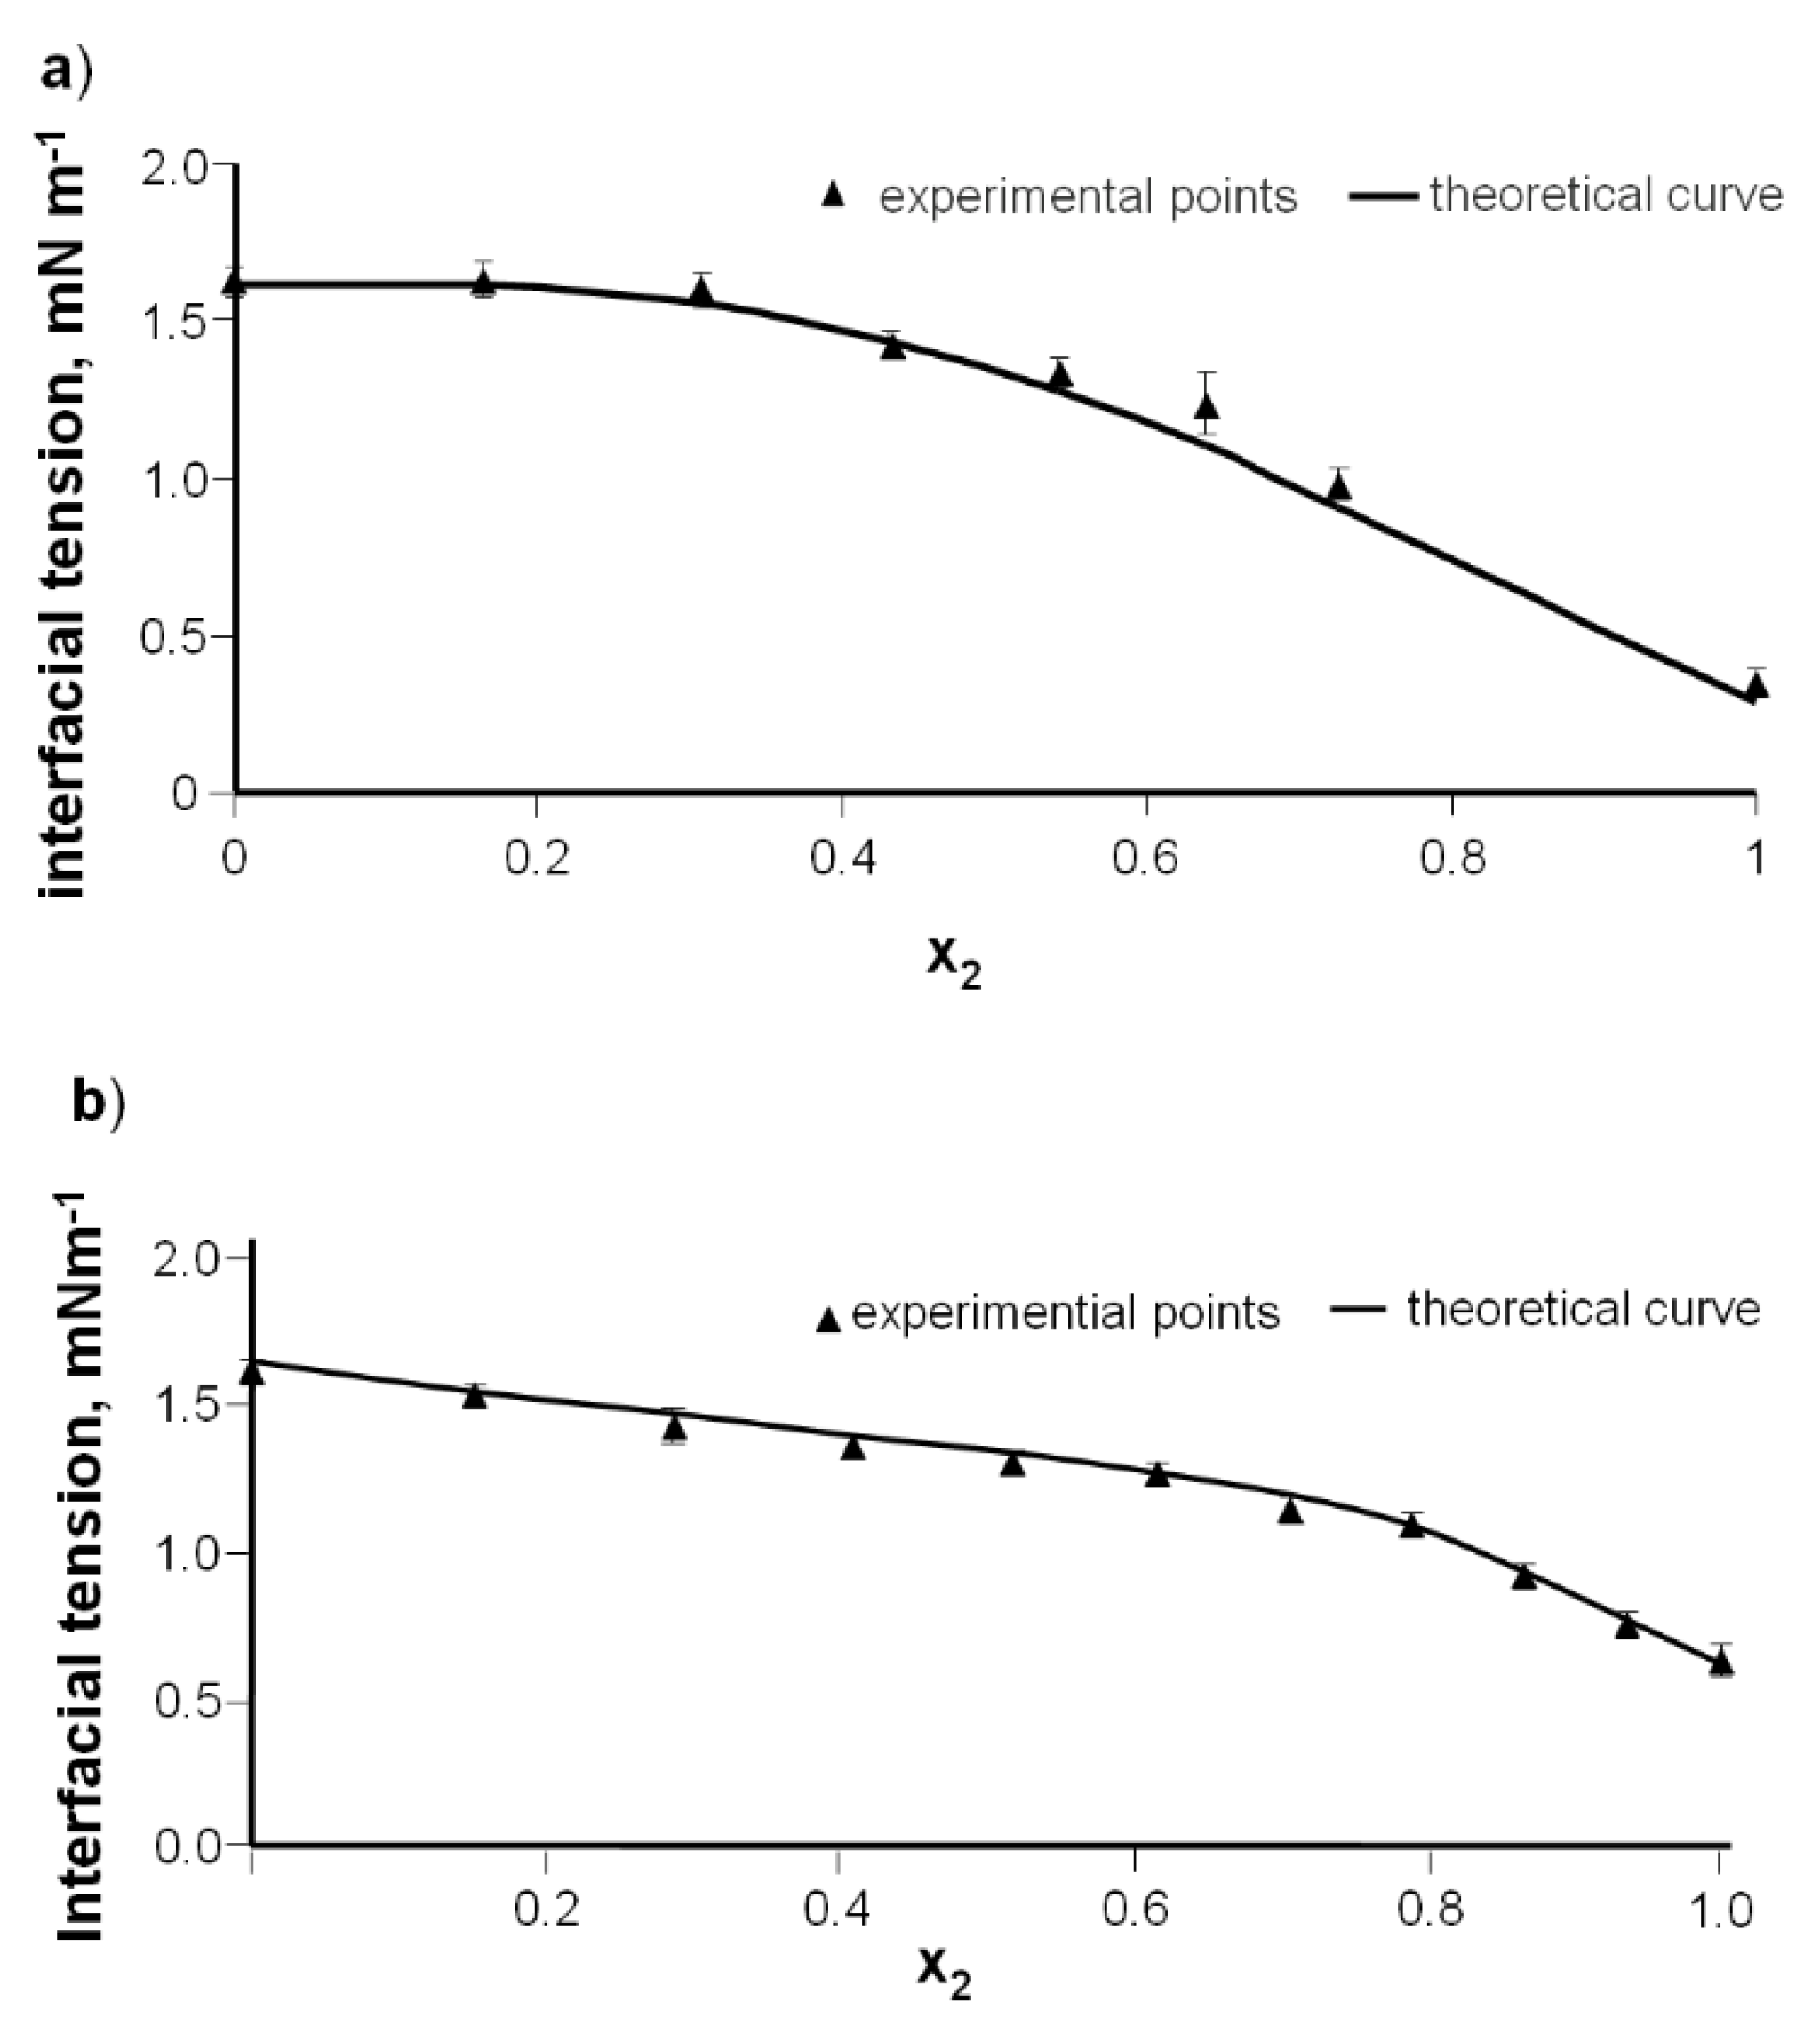
Figure 5a illustrates the interfacial tension of a DPPC-Dio bilayer vs. the mole fraction of diosgenin. The interfacial tension values of the pure DPPC and pure Dio bilayers are 1.62 × 10
−3 and 0.33 × 10
−3 N·m
−1, respectively.
When there are no interactions, the curve presented in
Figure 3a should be a straight line (Equation (6)). The nonlinear nature of the graph indicates the interaction between DPPC and diosgenin. Such interactions may be explained by the complex formation [
46,
47,
48]. Petelska and co-workers [
47] demonstrated the formation of a 1:1 complex in the DPPC-diosgenin in a monolayer system with a high value for the stability constant. This suggests that these types of complexes may also be formed by the components of the lipid bilayers.
According to the literature data, the 1:1 complex (termed compound 3) creates the most stable structure with a maximal stability constant, K [
44]. The dependence of interfacial tension vs. the stock solution composition (assumption of 1:1 complex formation) is described by Equation (8). The interfacial tensions of the pure components’ bilayers were obtained in an experimental way. The constants
,
, and
were calculated by assuming that the value of the stability constant for the DPPC-Dio complex was sufficient for the simplified Equation (8) to be applied to Equations (9) and (10).
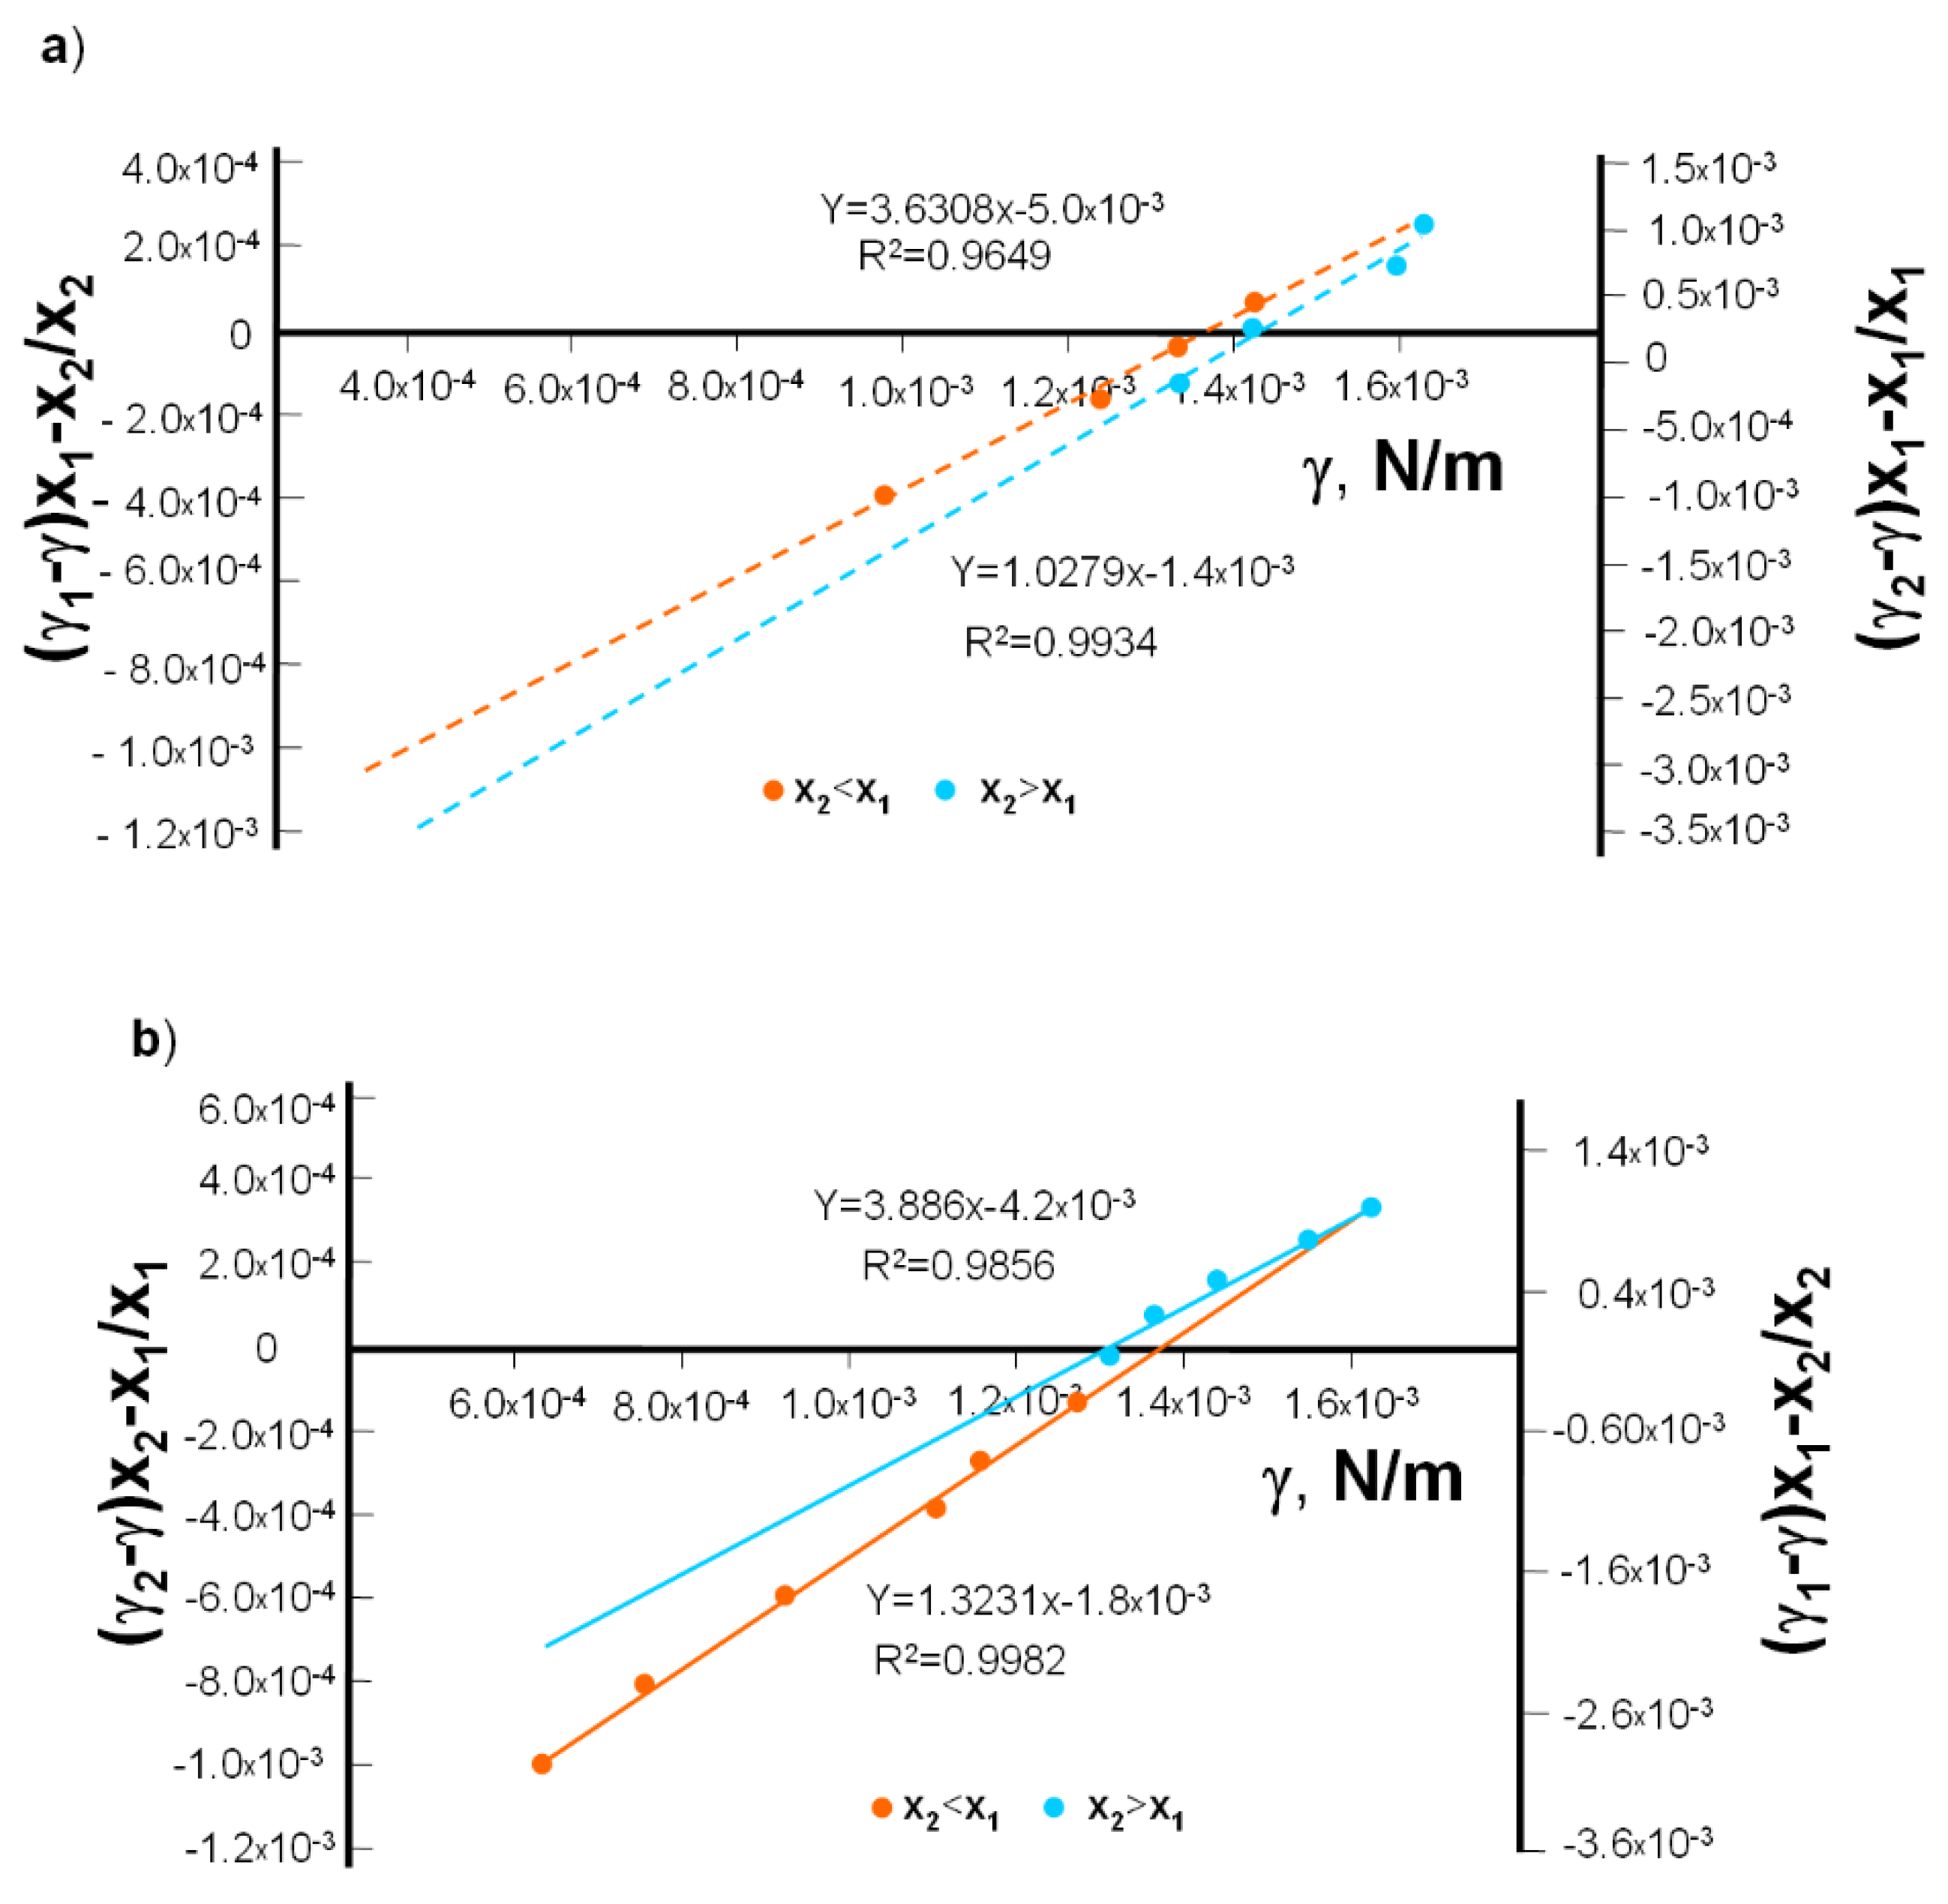
The plots of Equations (9) and (10) are illustrated in
Figure 6a. From the slopes of the lines,
(3.631) and
(1.028) values were obtained. The intersections of the straight lines with the ordinate provide
and
, which can be used to determine γ
3, the interfacial tension of the DPPC-Dio complex. The mean value obtained in this way was 1.37 × 10
−3 N·m
−1.
Determining the interfacial tension as a function of the composition enabled the calculation of the surface concentrations for bilayers formed of DPPC and Dio. At least one of these calculations is necessary to determine the value of
. The surface areas occupied by DPPC and diosgenin are 85.0 ± 0.9 [
30] and 45 ± 0.5 Å
2·molecule
−1 [
47], respectively.
The surface concentrations of DPPC and diosgenin in bilayers are 2.21 × 10⁻⁶ and 3.69 × 10⁻⁶ mol·m−2, respectively. Knowledge of and as well as and is needed to determine the surface concentration of a membrane composed of a DPPC-Dio complex. The obtained value, , for the DPPC-Dio complex was 1.11 × 10⁻⁶ mol·m−2. Based on this, one can determine that the area occupied by one DPPC-Dio complex is approximately 150 Å2·molecule−1. The value is larger than the sum of the areas occupied by individual DPPC and diosgenin molecules.
Using Equation (11), the stability constant of the DPPC-diosgenin complex was obtained by setting and the value was 1.11 × 10⁷ m2·mol−1. To our knowledge, no stability constants for the DPPC-Dio and DPPC-DAc complexes have been reported to date.
Based on the fact that the obtained value is relatively high, we can conclude that the 1:1 complex in mixed DPPC-diosgenin bilayers was formed. The
K value obtained for DPPC-Dio monolayers (6.46 × 10
5 m
2·mol
−1) is about two orders of magnitude smaller than the
K values for bilayers [
47]. The difference between these values is relatively large if we consider their different spatial surroundings. The higher value of the complex stability constant for the bilayer (about two orders of magnitude) may be a consequence of the roughness between the hydrophobic layers in the bilayer [
49]. The complex present in the bilayer is thus additionally strengthened by interactions between the two layers of the bilayer.
3.1.2. DPPC-Diosgenin Acetate Complex
The dependence of bilayer interfacial tension vs. the composition of the DPPC-DAc was analyzed over a wide concentration range (
Figure 5b).
According to Equation (6), the plot of
Figure 3b should yield a straight line. It can be seen from
Figure 1b that such linear dependences are not obtained. The curve indicates that the DPPC-diosgenin system forms a complex. The interfacial tensions of membranes formed using pure components were measured directly. The pure diosgenin acetate membrane exhibited an interfacial tension of 0.63 ± 0.03 × 10
−3 N·m
−1.
The value of
for the DPPC-DAc complex was calculated using Equations (9) and (10), presented in
Figure 6b. The values of
(3.189) and
(1.623) were determined from the slopes of the lines. The intersections of the straight lines with the ordinate provide
and
, which can be used to determine γ
3, the interfacial tension of the DPPC-Dio complex. The mean value obtained in this way was 1.34 × 10
−3 N·m
−1.
Equations (9) and (10) could also be used to calculate the surface concentration per unit area of the membrane formed entirely from the DPPC-DAc complex (the surface area occupied by a diosgenin acetate molecule is 52 ± 0.5 Å
2 [
48] and the surface concentration calculated for a pure DAc membrane is 3.19 × 10
−6 mol·m
−2).
The surface concentration for the DPPC-DAc complex is 1.19 × 10⁻⁶ mol·m−2. From this value, it is possible to determine the area occupied by the DPPC-DAc complex, which is 135 Å2·molecule−1. The stability constant of the DPPC-DAc complex was determined using Equation (11). The stability constant is equal to 2.22 × 10⁵ m2·mol−1.
Calculated from Equation (13), the complex formation energy (Gibbs free energy) values for the DPPC-Dio and DPPC-DAc complexes were equal to –39.74 ± 1.05 and –30.16 ± 0.91 kJ·mol
−1, respectively.
Table 2 presents some physicochemical values for DPPC-Dio and DPPC-DAc complexes.
The theoretical data (obtained from Equation (12)) denoted by lines and the experimental ones denoted by points are illustrated in
Figure 5a,b. From good agreement between theoretical and experimental data, it can be concluded that 1:1 DPPC-Dio and DPPC-DAc complexes are formed in bilayer membranes.
The proposed models of the spherical lipid bilayer organization of DPPC-sapogenin and DPPC-cholesterol are shown in
Figure 7. Both sapogenin and cholesterol in the bilayer do not influence the orientation of the lipid heads since the molecules are located in parallel with the DPPC chains and their hydroxyl groups are oriented at the level of the lipid’s carbonyl groups (
Figure 7). The stability constant values obtained for the DPPC-sapogenin 1:1 complex have a similar order of magnitude (~10
6–10
7) to the DPPC-cholesterol 1:1 complex [
45,
50].
3.2. Microelectrophoretic Experiments
The surface charge density of a lipid membrane is a significant parameter that controls some processes in natural cells. The surface charge is dependent on the molecular composition of the biological membrane and plays an important role in understanding membrane-binding mechanisms, cellular uptake, drug delivery, or liposome design. The parameter is an important property of a cell; it is useful in comparing the surface properties between two cell types [
51,
52].
Surface charge density changes in a living cell can occur commonly, including when they accompany the malignant transformation of cells. Since, membrane surface charge is influenced by many different factors, e.g., pH and membrane composition, its values can also be changed in vitro. This fact significantly contributes to the extension of cognitive capabilities, because in vitro studies of biological membranes and their artificial models are a valuable source of information on in vivo processes.
The effect of the sapogenins on the surface charge density of DPPC membranes was studied. The surface charge densities of DPPC-Dio and DPPC-DAc systems were drawn vs. pH (ranging from 2 to 10) and the molar composition of the components in the membranes (
Figure 8 and
Figure 9, respectively).
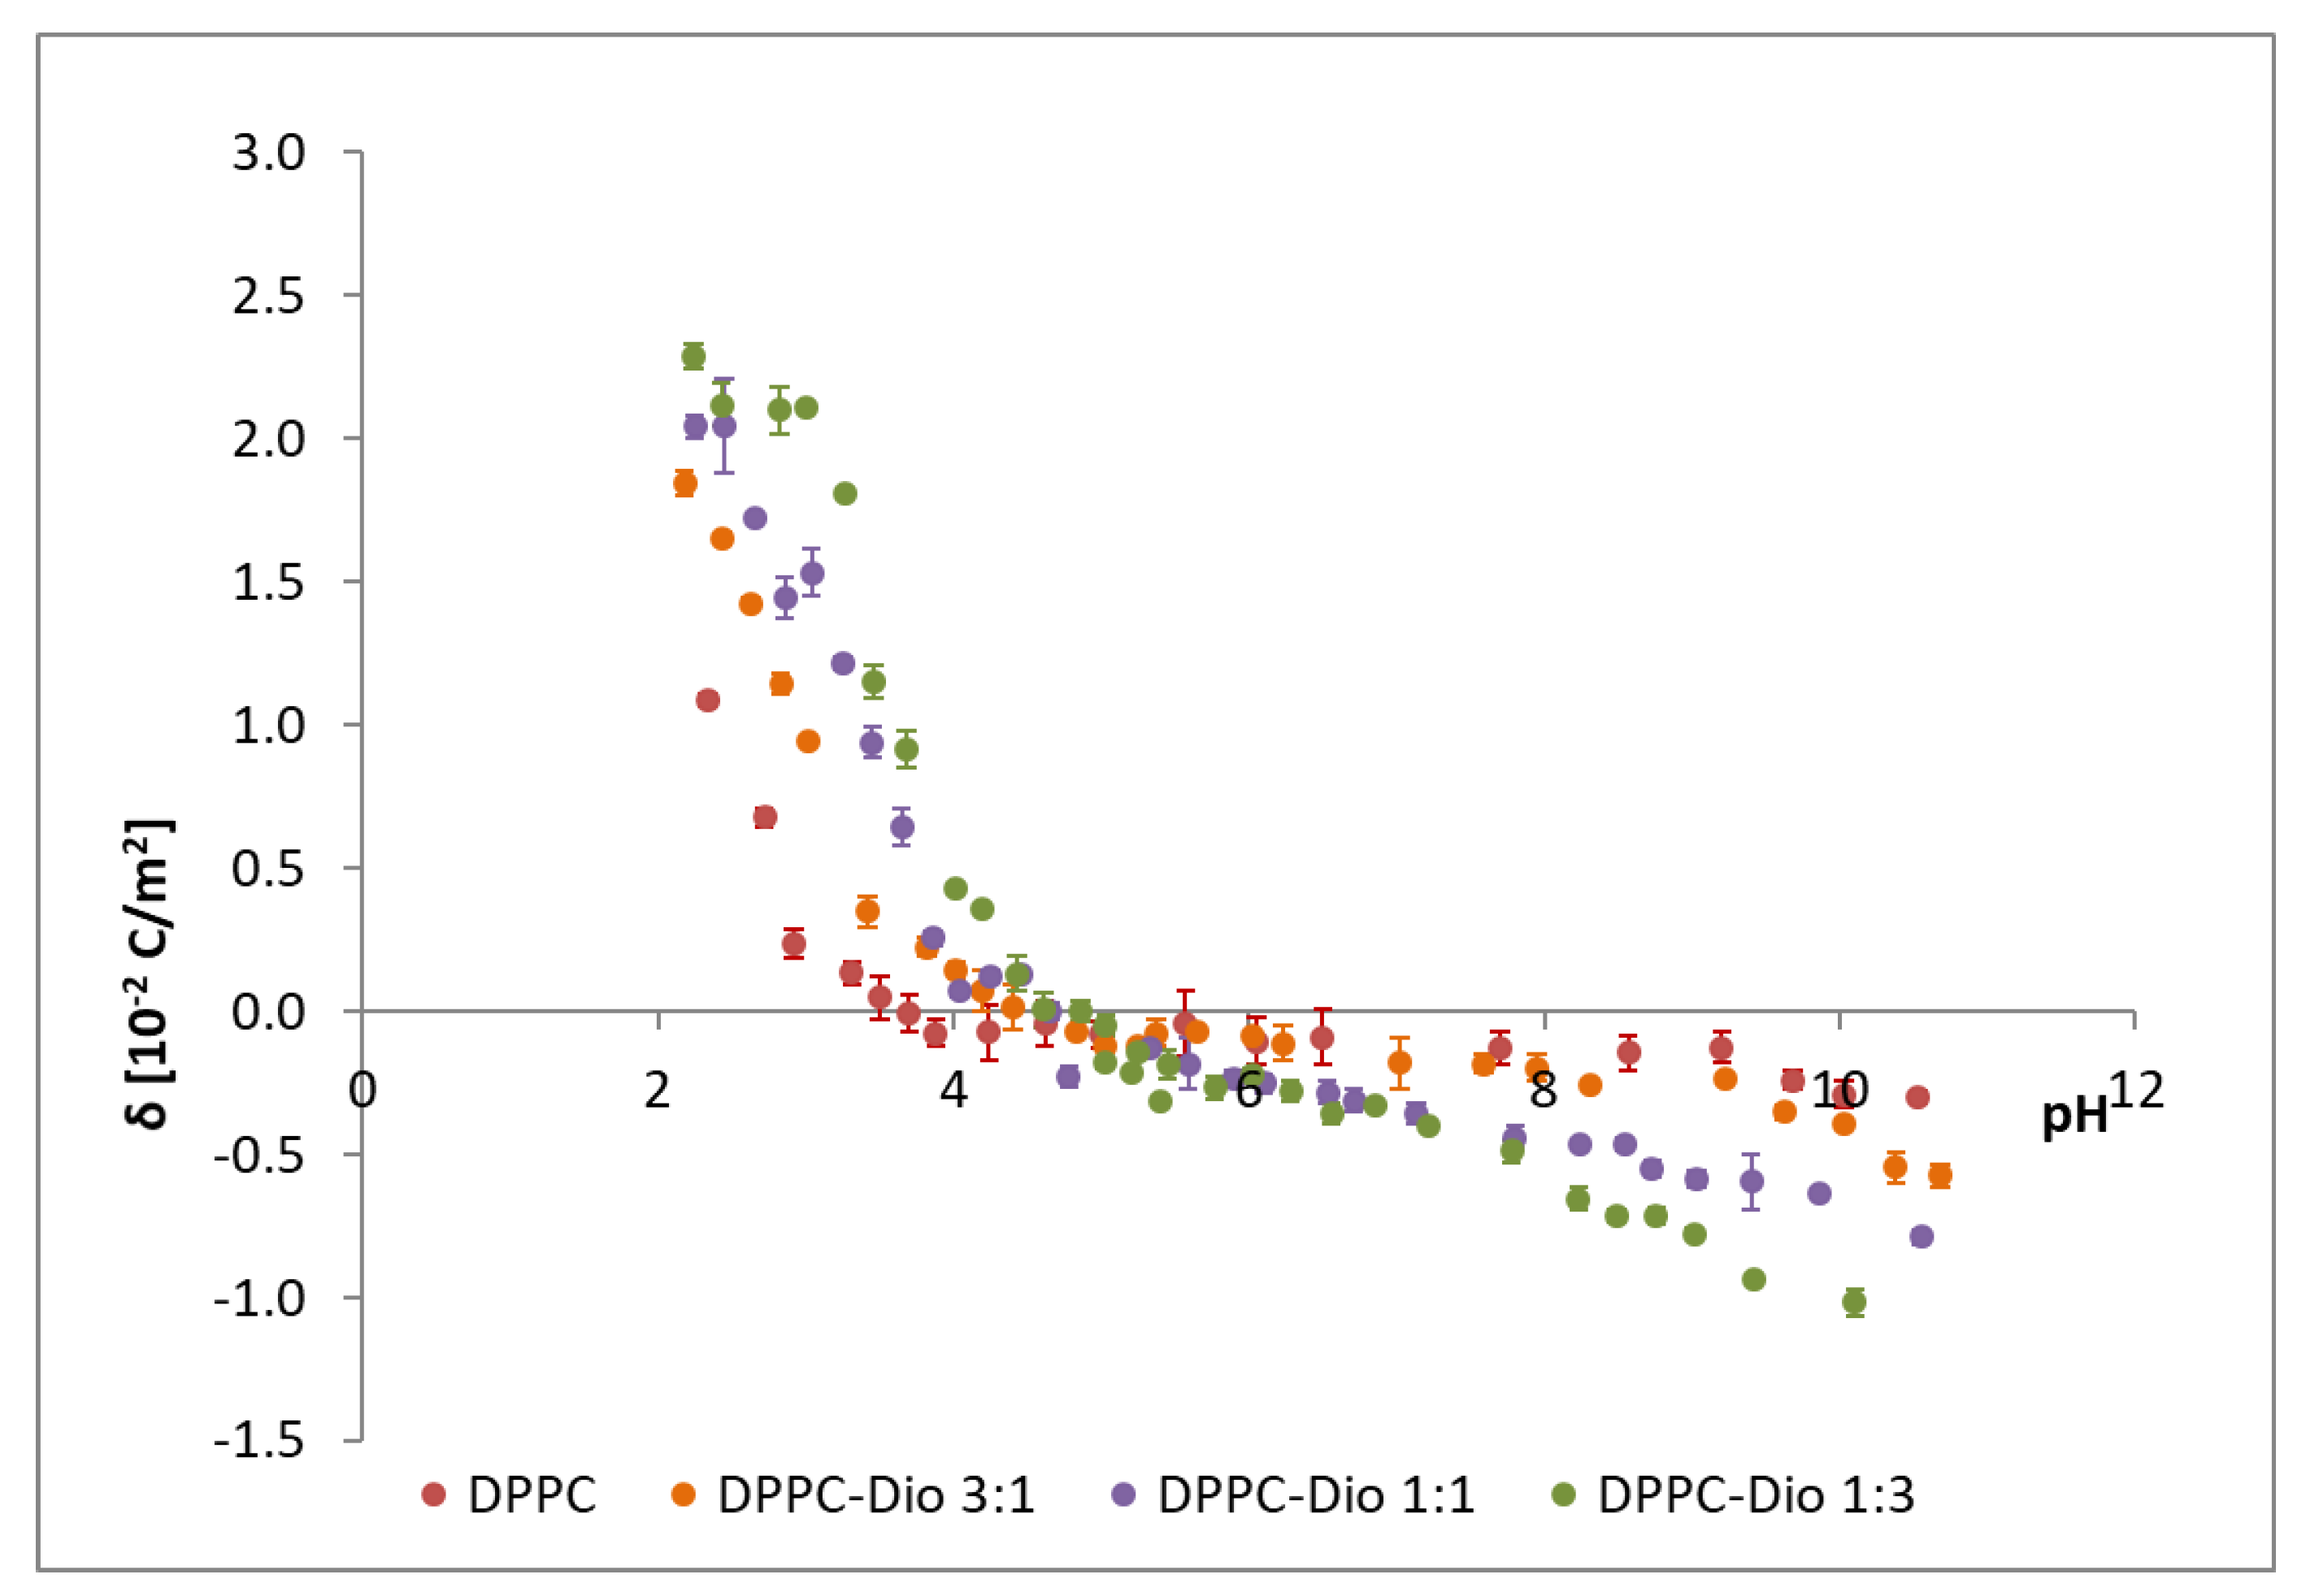
Figure 8 presents the influence of the liposome composition and pH value on the DPPC-diosgenin bilayer surface charge densities. Additionally, in the figure, the data obtained for pure DPPC membranes are illustrated. The increase in the positive surface charge and increase of the negative surface charge with increasing diosgenin content in the DPPC membrane is observed. The isoelectric point of the membrane shows a shift towards higher pH values with increasing content of diosgenin in the DPPC membrane (from pH ~4 for pure DPPC to pH ~5 for the DPPC-Dio 1:3 system). Similar behavior was observed for the DPPC-DAc system (
Figure 9).
Table 3 and
Table 4 summarize the results regarding the effect of the liposomal membrane composition on the value of the isoelectric point and surface charge density for the DPPC-Dio and DPPC-DAc systems, respectively.
Modifying DPPC membranes with both diosgenin and diosgenin acetate causes changes in the surface charge density (
Figure 8 and
Figure 9 and
Table 3 and
Table 4), which is the parameter controlling phenomena in natural cell membranes, and affects host-pathogen interactions or membrane-bound enzymes. The membrane surface charge depends on the concentration and type of electrolyte used in measurements, but also on pH and membrane composition. Changes in membrane surface charge densities values are caused by pH changes; towards more negative values in high pH or towards more positive values in low pH.
It is believed that the interaction of sapogenins with biological membranes may play a key role in their therapeutic activity. Therefore, compounds of natural origin are the valuable starting material for new drugs. In this work, it has been shown that the modification of DPPC membranes with both diosgenin and diosgenin acetate causes changes in the analyzed parameters, characterizing model lipid membranes.
4. Conclusions
The results presented in this work relate to the physicochemical and electrical properties of phospholipids modified with selected sapogenins, indicating special interactions between the components of the membranes, as well as between the components and surrounding solution.
The surface charge density of DPPC liposomes depends strongly on the modification of their structures, found here by examining the sapogenins and pH values of the electrolyte solution. The shift of the isoelectric point was also observed. Here, in the course of the interfacial tension measurements, the obtained good compliance between theoretical and experimental data verified the assumption of a 1:1 complex in the lipid bilayer. The lack of variation between the theoretical and experimental points indicates that our theoretical model (
Section 3.1) can sufficiently describe the interactions in DPPC-sapogenin membranes. The mathematically calculated and experimentally confirmed data collected here are important in the understanding of various phenomena in which lipid bilayers participate in.
Biochemical processes occurring within membranes influence the harmonious functioning of natural cells. The processes controlled in the organism can be significantly altered by different factors, for example, diseases, poisoning, and cancer transformation. Any changes in cell functioning translate into cell membrane functioning, that is, these changes influence the physicochemical properties of membranes, such as the surface charge or surface tension. Understanding the mechanisms underlying the interaction between the studied sapogenins and DPPC membranes is a complex task due to the numerous properties that characterize them. Considering this fact, we conducted our research with the idea that, in the future, obtained data may be essential for understanding sapogenins for the course of a lot of physicochemical and biochemical phenomena. We hope that such studies, in particular, a quantitative description of the phenomena occurring in biological membranes, will contribute to the possibility of using sapogenins as potential therapeutic agents.


