Article

Effect of Electrode Covering Composition on the Microstructure, Wear, and Economic Feasibility of Fe-C-Cr Manual Arc-Welded Hardfacings

by
Vytenis Jankauskas
1,*,
Egidijus Katinas
2,
Artūras Laskauskas
1,
Maksim Antonov
3,
Valentinas Varnauskas
4,
Irmantas Gedzevičius
4 and
Vilija Aleknevičienė
1
1
Vytautas Magnus University, K. Donelaičio St. 58, 44248 Kaunas, Lithuania
2
Faculty of Engineering, Department of Material Science and Manufacturing Technology, Czech University of Life Sciences Prague, Kamycka 129, 16500 Praha, Czech Republic
3
Department of Mechanical and Industrial Engineering, Tallinn University of Technology, Ehitajate tee 5, 19086 Tallinn, Estonia
4
Department of Materials Science and Welding, Faculty of Mechanics, Vilnius Gediminas Technical University, J. Basanavičiaus g. 28, LT–03224 Vilnius, Lithuania
*
Author to whom correspondence should be addressed.
Coatings 2020, 10(3), 294; https://doi.org/10.3390/coatings10030294
Submission received: 20 February 2020 / Revised: 11 March 2020 / Accepted: 16 March 2020 / Published: 21 March 2020
(This article belongs to the Special Issue Manufacturing and Surface Engineering II)

Abstract

:
Manual arc-welded hardfacings are widely used for the protection of new or the restoration of worn parts in agriculture, forestry, and mining applications. A study was conducted to investigate the effect of electrode covering composition on the microstructure, wear (low, average stress abrasion; erosion at 30, 50, and 80 m s−1), and economic feasibility of Fe–C–Cr manual arc-welded hardfacings. Hardfacings were produced with the carbon and chrome contents varied in the ranges of 0.87–2.95 and 1.3–33.2 wt.%, respectively. The major phases composing the microstructures of the hardfacings were austenite, perlite, ledeburite, and various carbides, including eutectic M7C3. Technical and economic analyses were performed to assess the economic feasibility of hardfacings and reference wear-resistant steel Hardox 400. A wear and economic feasibility map was created to specify various types and facilitate the selection of optimal hardfacings for specific conditions. The produced Fe–C–Cr coatings were the most effective in low-stress abrasive conditions (up to 7.8 times greater than Hardox 400) and quite effective in erosive conditions (up to 2.9 times greater than Hardox 400).

1. Introduction

Agriculture, forestry, and household work consume 35% of the energy produced in the world [1]. Industry and transport consume less, corresponding to 29 and 27% of the energy, respectively. Friction and wear losses in agriculture are among the highest, and therefore, their reduction is an important task to be carried out.
Wear is one of the main factors that strongly influences the performance and service time of the components of any mechanism [2]. From 85 to 90% of machine parts fail due to their wear [3]. The most intense form of wear is abrasive wear, which leads to significant costs for the repair of worn-out machines and the replacement of their parts [4]. Abrasive wear is especially harmful to the working parts of agricultural and mining machines, owing to their direct contact with abrasives [3]. One of the most reliable ways to improve the performance and wear resistance of such machine parts is to protect them by the application of hardfacings [5].
Manual arc welding is applied widely to protect working surfaces exposed to abrasive wear by Fe–C–Cr and other types of coatings (hardfacings). Fe–C–Cr hardfacings are less abrasive wear-resistant than those containing sufficient fractions of carbides of refractory metals (WC, MoC, TiC, NbC), but they are significantly cheaper [6]. Fe–C–Cr coatings effectively protect working surfaces against wear and corrosive effects, which considerably increases the service life of machine elements [5].
The abrasive wear resistance of Fe–C–Cr alloys is provided by carbides homogeneously distributed in the ductile matrix [5,7,8]. Fe–C–Cr alloys usually have high contents of chromium (10–30%) and carbon (2.5–3.5%), along with certain trace elements such as Mn, Mo, Nb, and Ti [8]. Liu Sha et al. compared various Fe–C–Cr alloys and found that high initial carbon content resulted in high contents of primary (Fe,Cr)7C3 carbides and high wear resistance [9]. The experimental investigations showed that with increasing Ti content, the primary M7C3 carbides were refined, and the dispersion of hard-phase TiC improved the wear resistance [8].
A high hardness of the matrix is also essential for providing high wear resistance of a hardfacing. In order to achieve high wear resistance, the hardness of the hardfacing should be higher than that of the abrasive particles [10]. The hardness of primary carbides (Fe,Cr)7C3 in Fe–C–Cr alloys is generally close to HV 1600, which is higher than that of SiO2 (HV 1000–1100) [11]. The primary carbides are known for their strong covalent bonding and high-temperature stability, but they are unfortunately quite brittle, owing to their high hardness [12]. Hardfacings containing a high fraction of carbides with hardness higher than that of abrasive particles can resist abrasion effectively. Ledeburite type materials can exhibit higher wear resistance due to the microstructure and higher hardness, while the austenitic transformation occurring during heat treatment can also influence hardness and resulting abrasive wear resistance [13,14,15,16]. Some authors tested the bainitic steels or hardfacings produced by the gas metal arc welding process with the austenitic structure to achieve improved wear performance [17,18].
The results of previous investigations showed that Fe–C–Cr alloys could have hypoeutectic, eutectic, or hypereutectic structures [7,19]. The formation of these structures depends on the number and content of alloying elements, the cooling process parameters, and the “chromium to carbon” ratio [5,7]. If the carbon level is below 4.3% in an alloy, then it is considered as a hypoeutectic structure, whereas if it is above 4.3%, then it is considered to be a hypereutectic structure; an alloy with a carbon content of 4.3% is a eutectic alloy. Primary (typically coarse and stable) M7C3-type carbides in these structures are formed when the carbon content is above 2% [5]. Hardfacings with (Fe,Cr)7C3 carbides are more wear-resistant in abrasive conditions, and this is usually illustrated by the discontinuous nature of scratches caused by abrasive particles. Under aggressive conditions, craters might be formed owing to the fracture and removal of carbides [11].
The wear resistance of Fe–C–Cr alloys is closely related to the content of the formed carbides, as well as their sizes and distribution (homogeneous or not) in the matrix. The microstructure of these alloys is usually composed of martensite, austenite, and eutectic carbides. A higher wear resistance is achieved by combining a eutectic structure with primary carbides [20].
Both the graphite and chromium (usually ferrochromium) contents in an electrode covering have a significant influence on the formation of (Fe,Cr)7C3 carbides in hardfacings, as well as on the cost of the electrodes. Therefore, the current study provides an analysis of electrodes, manual arc-welded hypoeutectic hardfacings with varied carbon and chromium contents, as well as their technical (hardness and wear rate in erosive and abrasive conditions) and economic assessment. Conventional wear-resistant Hardox 400 steel was evaluated as a reference material for the economic feasibility calculations of the produced Fe–C–Cr hardfacings. The wear and economic feasibility map resulting from the current study can serve as a tool for the selection of optimal hardfacings for applications in which the wear resistance of materials plays an important role.

2. Materials and Methods

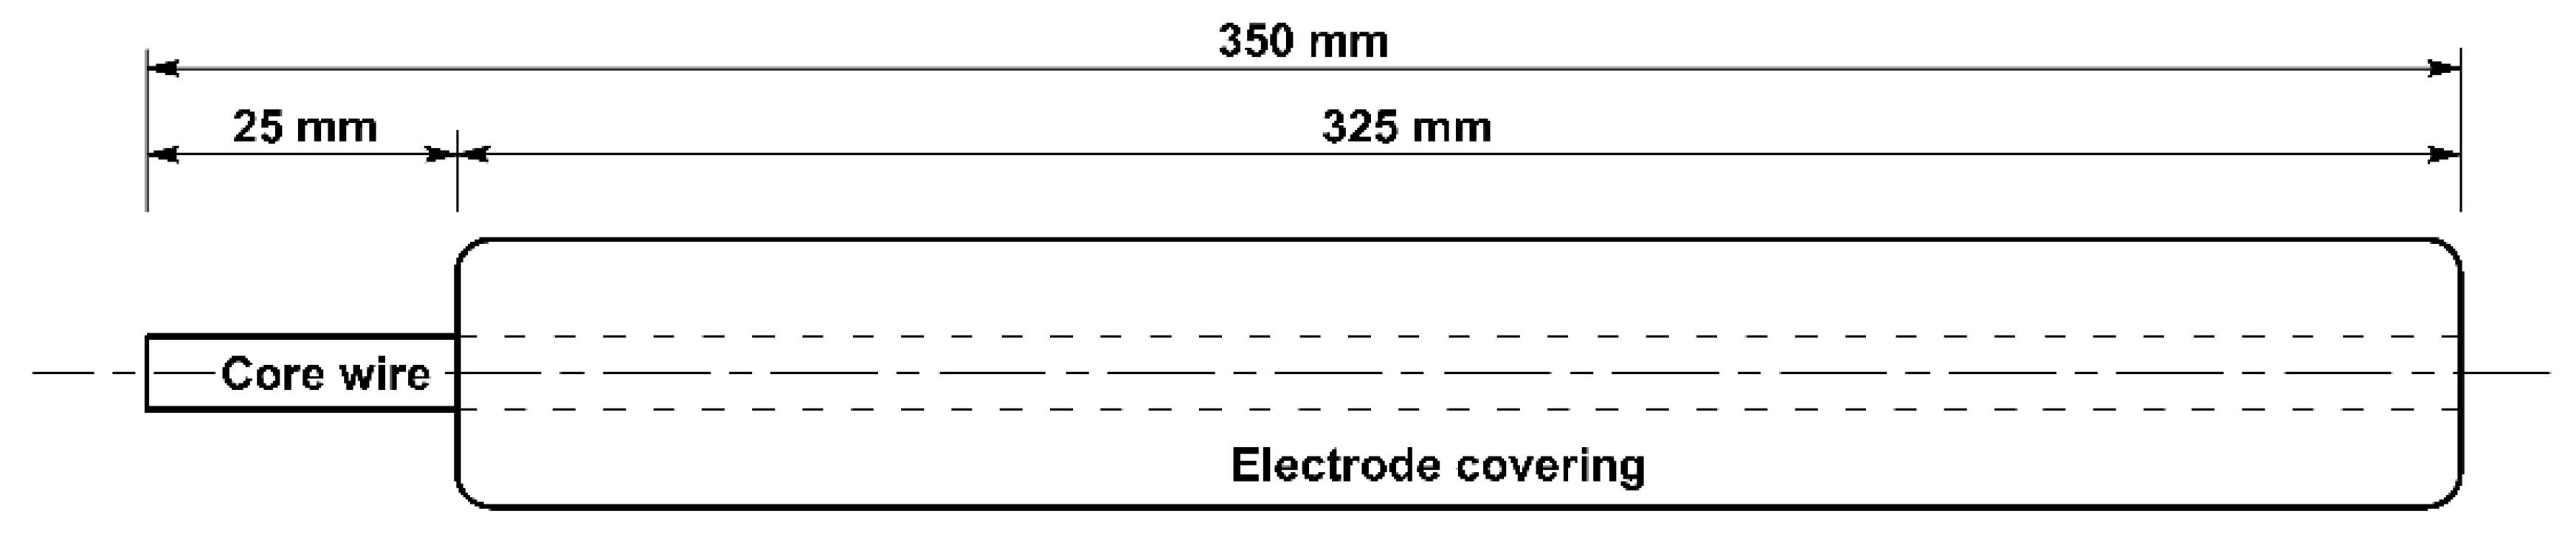
2.1. Production of Electrodes

Electrodes for the fabrication of Fe–C–Cr hardfacings were manufactured by a company (industrial-scale producer of electrodes). Figure 1 explains the main components and steps required to produce and estimate the economic feasibility of hardfacings. The contents of graphite and ferrochrome (HC Fe–Cr) in the coverings were varied to obtain hardfacings with suitable carbon and chromium contents, as shown in Table 1. The codes of the electrodes (and samples obtained with their help) are indicated. The content of high-carbon ferrochrome in the electrode covering ranged from 5.3 to 85%, while the content of graphite ranged from 0.1 to 30.0%. The covering was reinforced with cellulose. The limits of the studied ranges of ferrochrome and graphite were influenced by the technological feasibility of the electrode production process.
The diameter of the core wire was 3.2 mm, the length 350 mm, and the mass 22.5 g (this will be used later to calculate the electrode covering rate). The wire was made of low-carbon ferritic–pearlitic steel (SWRY-21 according to JIS G3503 or CB-08A according to GOST 2246-70). The diameter of prepared electrode (core wire with covering) was approximately 5.5 mm (the thickness of a single layer was about 1.15 mm).
The applied electrode covering was of the rutile type to provide protection, deoxidation, and alloying of the welding bath and the transfer of metal in fine drops (during hardfacing deposition), which generally resulted in a low level of spatters and lower fume emission. The limestone, aluminosilicates, and feldspar were used as electric arc stabilizing ingredients. The slag mixture (if taken as 100%) had the following composition: rutile 52%, limestone 25.4%, and aluminosilicates (feldspar) 22.6%. The slag mixture constituted from 1.9 (sample 647) to 70.0% (sample 590) of the total weight of the dry powders of the covering. The typical contents of the other dry covering substances were approximately 1% for cellulose and 12% for ferromanganese with a medium carbon level (MC FeMn; 1.5% of C). Cellulose burns completely during hardfacing deposition and forms carbon oxides (inert gas, which protects the weld from oxidation). Low- (0.1% C) and high-carbon (7% C) ferrochrome were used in order to prepare hardfacings with the lowest and highest carbon contents (Hardfacings 647 and 565, respectively).
Ferrochrome chemical composition: Cr—69.3%, C—9.03%, Si—0.24%, S—0.021%, P—0.024%; size <0.24 mm; price 1530 €∙t−1 (average prices valid in Lithuania were used for calculations; suppliers cannot be disclosed due to NDA). Graphite composition: C—90.11%, ashes 9.87%; moisture content 0.39%; size ≈ 0.04 mm; price 4917.7 €∙t−1. Ferromanganese chemical composition: Mn—80.99%, C—1.35%, Si—0.36%, P—0.18%, S—0.005%; price 2260 €∙t−1. Cellulose characteristics: bulk density—1.03∙10−4 g∙mm−3; moisture content—5.56%, water-soluble portion—1.65%; size <80 µm; price 332.5 €∙t−1. Slag materials characteristics: rutile—TiO2—96%, ZrO25%, Fe2O3—1.43%, SiO2—1.26%, P2O5—0.07%, SO3—0.05%; moisture content 0.06%; limestone powders consisted of CaCO3 and Ca; moisture content 0.2%; grain size <0.09 mm; potassium feldspar—SiO2—77.68%, Al2O3—12.5%, K2O—4.45%, Na2O—4.05%, CaO—0.28%, Fe2O3—0.24%. Prices of slag materials: rutile 779.9 €∙t−1, limestone 48.3 €∙t−1, and feldspar 220 €∙t−1.
The powders for the electrode covering were prepared to cover the widest range of possible compositions reported in the literature [21,22].
The mixing of the components was performed in two steps in a 5 dm3 mixing device in order to ensure a homogeneous distribution of the constituents for the flux covering. During the first step, the dry components were mixed for 5 min; then, during the second step, the viscous blend was prepared by additional mixing for 3 min together with the liquid sodium-potassium glass (17–29%), which facilitated the bonding of powders during pressing. Electrodes were formed by an industrial Oerlikon CEP 141 electrode extrusion press line at a rate of 200 electrodes/min. After forming, the electrodes were dried for 24 h at room temperature (23 ± 2 °C) and later for 1 h at 300 °C in an electric dryer (SNOL-3.5). The duration of the heating and cooling cycles from room temperature to 300 °C was 2 h [23].

2.2. Evaluation of the Economic Feasibility of Hardfacings

The cost (all costs in the current work are expressed in Euros) of 1 kg of electrode, S1 kg electrode, was calculated as follows:
S 1   k g   E l e c t r o d e = S M a t e r i a l + S P r o d u c t i o n
where SMaterial is the cost of the materials (wire and electrode covering) and SProduction is the cost of the activities required to produce the electrode (labor and use of equipment).
The cost of 1 kg of hardfacing was calculated by taking into account the cost of the electrode and the deposition coefficient:
S 1   k g   H a r d f a c i n g   m a t e r i a l = S 1   k g   E l e c t r o d e η
where η is the deposition coefficient for welding with a manual arc electrode (usually less than 1 because some portion of the electrode is lost).
Electrode covering wt. rate L with respect to M expressing the electrode covering weight rate in terms of the total mass of electrode was calculated as follows:
L = M 22.5 22.5 · 1.077
The coefficient 1.077 was the ratio of the whole electrode wire length (350 mm) to the covered electrode length (325 mm). A length of 25 mm of the electrode was left uncovered for mounting the electrode in the electrode holder during the welding process (Figure 2).
The detailed composition of the covering, the technical parameters of production, the costs of the electrodes, and its components are presented in Table 2.
The differences in the electrode price were mainly influenced by the price of graphite and ferrochrome powders (Table 2). The price of dry covering materials accounted for from 32 to 63% of the final electrode price.
The method of calculating the deposition cost of wear-resistant hardfacings followed that of the authors’ previous works [6,24]. The prerequisites for calculating the productivity (rate of hardfacing deposition, P, kg h−1) were as follows:
-
arc burning time was approximately 35% of the working time;
-
one electrode with the diameter of the wire being 3.2 mm melted in 1.6–2.0 min; therefore, 16 electrodes were deposited per hour during the hardfacing process, including the time for electrode exchange.
P = 16   M   η 1000
where M is the mass of the electrode (Table 2).
The cost of the deposited hardfacing (S1 kg Hardfacing, €∙kg−1) was the sum of the hardfacing material cost (Equation (2)) and the labor cost associated with the deposition of hardfacing. The typical hourly rate for such activity in Lithuania was 5 €∙h−1.
S 1   k g   H a r d f a c i n g = S 1   k g   H a r d f a c i n g   m a t e r i a l + H o u r l y   r a t e P
The price of the steel Hardox 400 plate of thickness 5–10 mm was ≈ 2.0 €∙kg−1 in Lithuania, depending on the purchase volume. The cost of the use of Hardox 400 for the repair of elements in construction and agricultural machinery (including material itself, cutting, bending, fitting, and welding) was six times higher (12 €∙kg−1; this was the average result from several real case studies), considering the hourly rate of 5 €∙h−1. The main component of cost was labor cost.
Both the wear rates and costs of the material solutions under consideration (hardfacing vs. Hardox 400) must be compared to draw conclusions regarding the economic feasibility of the investigated hardfacings. Hardfacings with a lower cost and lower wear rate are the most desired, and the coatings with a slightly higher price (than that of Hardox 400), but sufficiently lower wear rates are also suitable candidates for the repair of machinery.
The prerequisite for the hardfacing solution to be economically more feasible than repairing with Hardox 400 is as follows:
S 1   k g   H a r d f a c i n g < ε · S 1   k g   R e p a i r   w i t h   H a r d o x   400
where ε [6] is the wear intensity ratio (wear resistance of hardfacing) calculated according to the wear rates of the reference material and hardfacing:
ε = I H a r d o x   400 I H a r d f a c i n g
The relative cost of hardfacing that showed the threshold of its economic feasibility is calculated as follows:
S 1   k g   H a r d f a c i n g   r e l a t i v e = S 1   k g   R e p a i r   w i t h   H a r d o x   400 ε
The relative cost of hardfacing (in %) showed how much less (if less than 100%) or more (if more than 100%) expensive the hardfacing solution was than the Hardox 400 steel solution if the wear intensity ratio were taken into account:
K = S 1   k g   H a r d f a c i n g   r e l a t i v e S 1   k g   R e p a i r   w i t h   H a r d o x   400 · 100

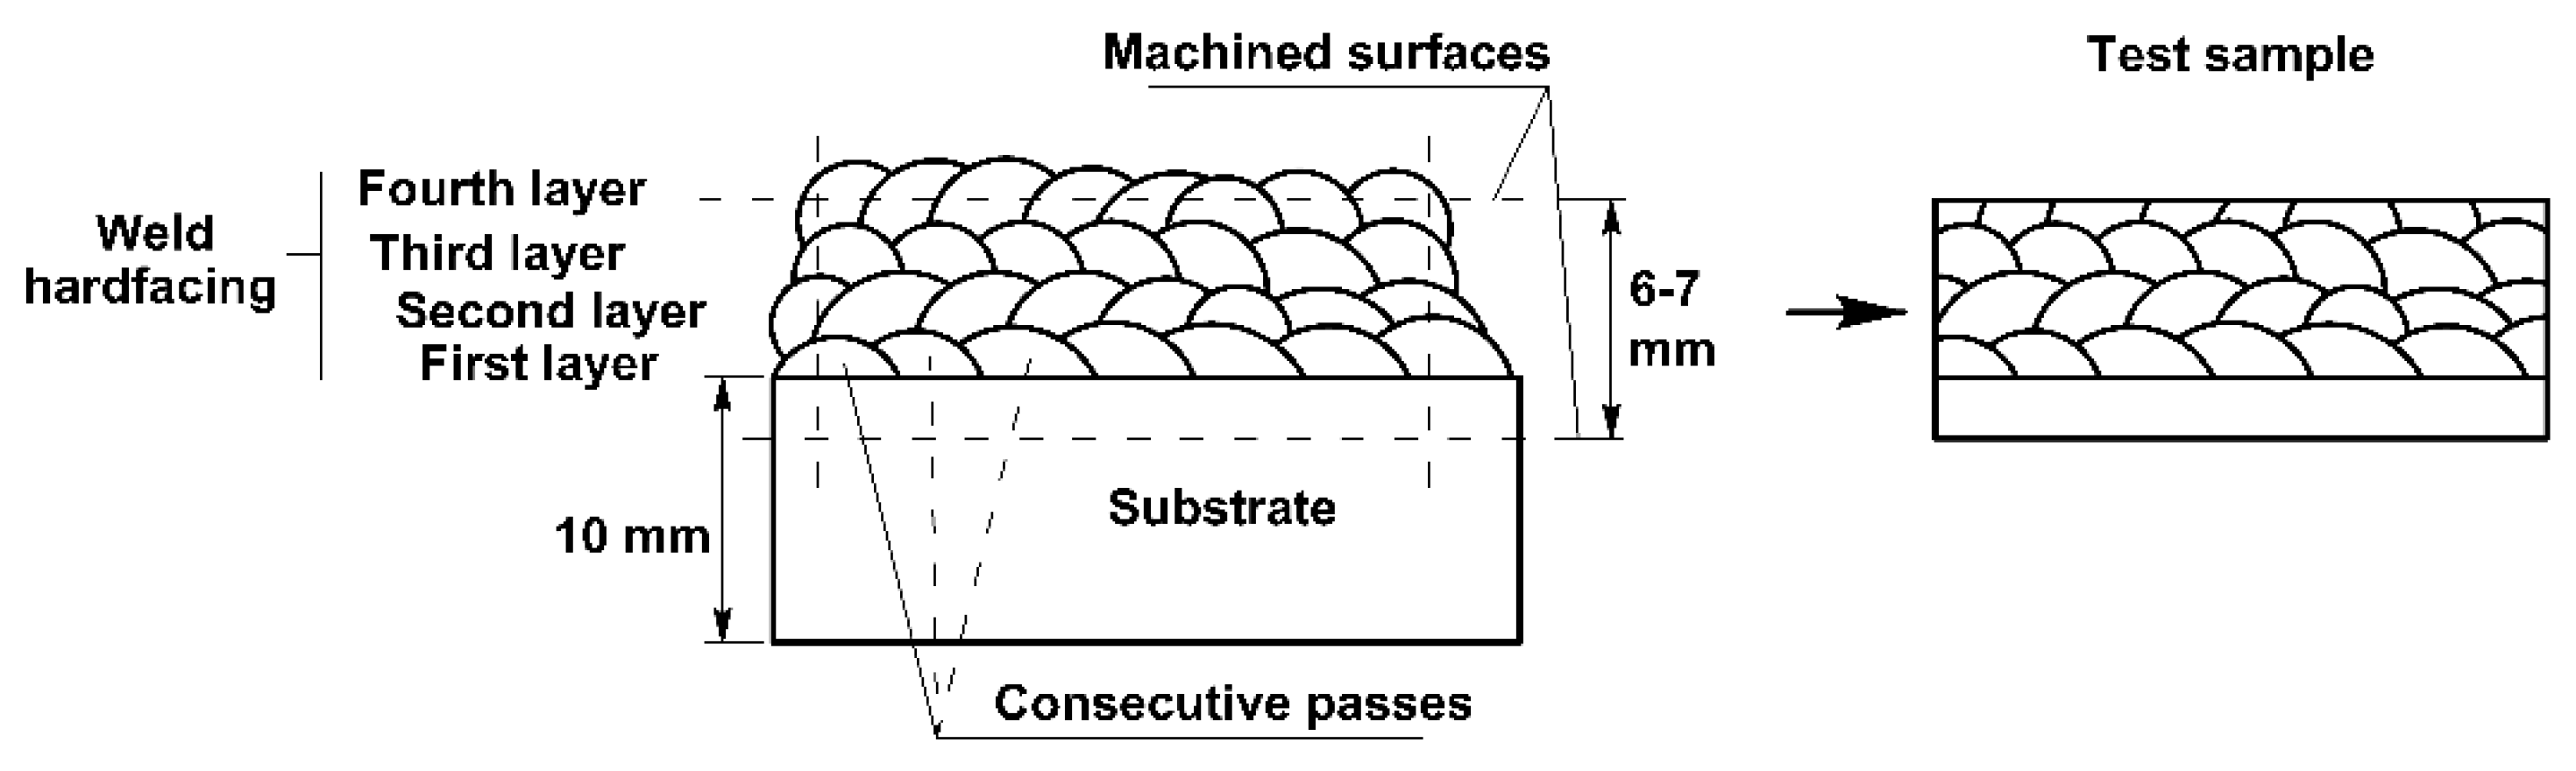
2.3. Deposition of Hardfacings

The hardfacings (Figure 3) were deposited with a CADDT TIG 2200I AC/DC apparatus from ESAB, using a direct current of 120 A.
The steel S355 (EN10025, dimensions 80 × 40 × 10 mm, composition: 0.20–0.22% C, 1.6% Mn, 0.55% Si) was used as a substrate for hardfacing. After the manual arc welding process, the coated samples were cooled to room temperature. The bottom and top of the substrate (including part of the hardfaced material) were removed to achieve a sample thickness of 6 ÷ 7 mm (Figure 3), as required for fixing the samples inside the wear test devices. Samples of dimensions 80 × 40 × (6 ÷ 7) or 25 × 16 × (6 ÷ 7) mm were used for ASTM G65 (low and average contact stress) and erosion wear tests, respectively. The machined samples were cut into the required shapes using a Secotom 50 precision cutting machine (Struers). Rockwell hardness measurements, Scale C (HRC), were performed with the help of a diamond pyramid on the hardness testing device TK-2M (Russia). At least 6 measurements were made to calculate the average value. The metallographic samples were polished with a Tegramin 20 (Struers) by using the corresponding sandpaper and fine (3 µm) water-based diamond suspensions. Metallographic investigations were performed using an Eclipse MA-100 optical microscope (Nikon). The composition of the hardfacings was determined by a Compact Lab spectral analyzer (Belec Spektrometrie Opto–Elektronik GmbH).
Three-body abrasive wear tests were performed according to the ASTM G65-04 standard (Figure 4a). The test conditions at low and average contact stress levels (with rubber-lined and solid steel wheels) are presented in Table 3. Erosive wear tests at 30 m·s−1 (average stress), 50, and 80 m·s−1 (high stress due to fracturing of particles) were performed according to GOST 23.201-78 [25] using a Centrifugal Accelerator of Kleis (CAK), as shown in Figure 4b. The tests were performed at room temperature using 12 kg (30 m·s−1) or 6 kg (50 and 80 m·s−1) of silica sand with a particle size range of 0.25–0.50 mm; the impact angle was 30°; 15 samples were tested simultaneously. A running-in test was performed before the real test with 6 kg of the same type of quartz sand. A fresh erodent was applied for every test.
The mass of each sample was measured before and after the three-body or erosive wear test to the nearest 1.0 or 0.1 mg with a KERN EG420–3NM or Mettler Toledo ME204 balance, respectively.

3. Results and Discussion

3.1. Composition and Hardness of Hardfacings

Table 4 provides the composition of hardfacings produced by deposition using the developed electrodes (with various contents of ferrochrome and graphite in the coating), which have different technological properties. The carbon content of the hardfaced layer was influenced by the graphite content or by the presence of carbon in the ferrochrome or ferromanganese of the electrode covering. The technological properties of the electrodes were also assessed during the application of the hardfacings. It was found that hardfacings with lower ferrochrome and carbon contents had better technological properties. The composition and hardness of the hardfacings are shown in Table 4.
The hardfacings could be divided into four groups, the first three of which were used for wear testing (Table 1):
  • Varied graphite and ferrochrome contents in the electrode covering (Codes 565, 604, 613, 622, 632, 631, and 647; hereinafter indicated as Group 565/647).
  • Similar graphite content and varied ferrochrome content in the electrode covering (Codes 591, 601, 611, 621, and 631; hereinafter indicated as Group 591/631).
  • Similar ferrochrome content and varied graphite content in the electrode covering (Codes 611, 612, 613, and 614; hereinafter indicated as Group 611/614).
  • The remaining electrodes (590, 592, 593, 602, 603, 623, 624, and 633) were produced to track the effect of the electrode covering composition on the resulting composition and hardness of the hardfacing.
The carbon and chromium contents of all of the produced samples varied from 0.61 to 2.95% and from 1.29 to 33.20%, respectively (Table 1 and Table 4). For the groups of hardfacings selected for wear testing, the contents of carbon and chromium were 1.98–2.95% and 1.29–33.2% (to study the effects of carbon and chromium), 0.87–2.68% and 4.37–25.10% (to study effect of chromium), and 1.44–2.56% and 7.00–9.58% (to study effect of carbon), respectively. The hardness of the hardfacings is given in Table 4.

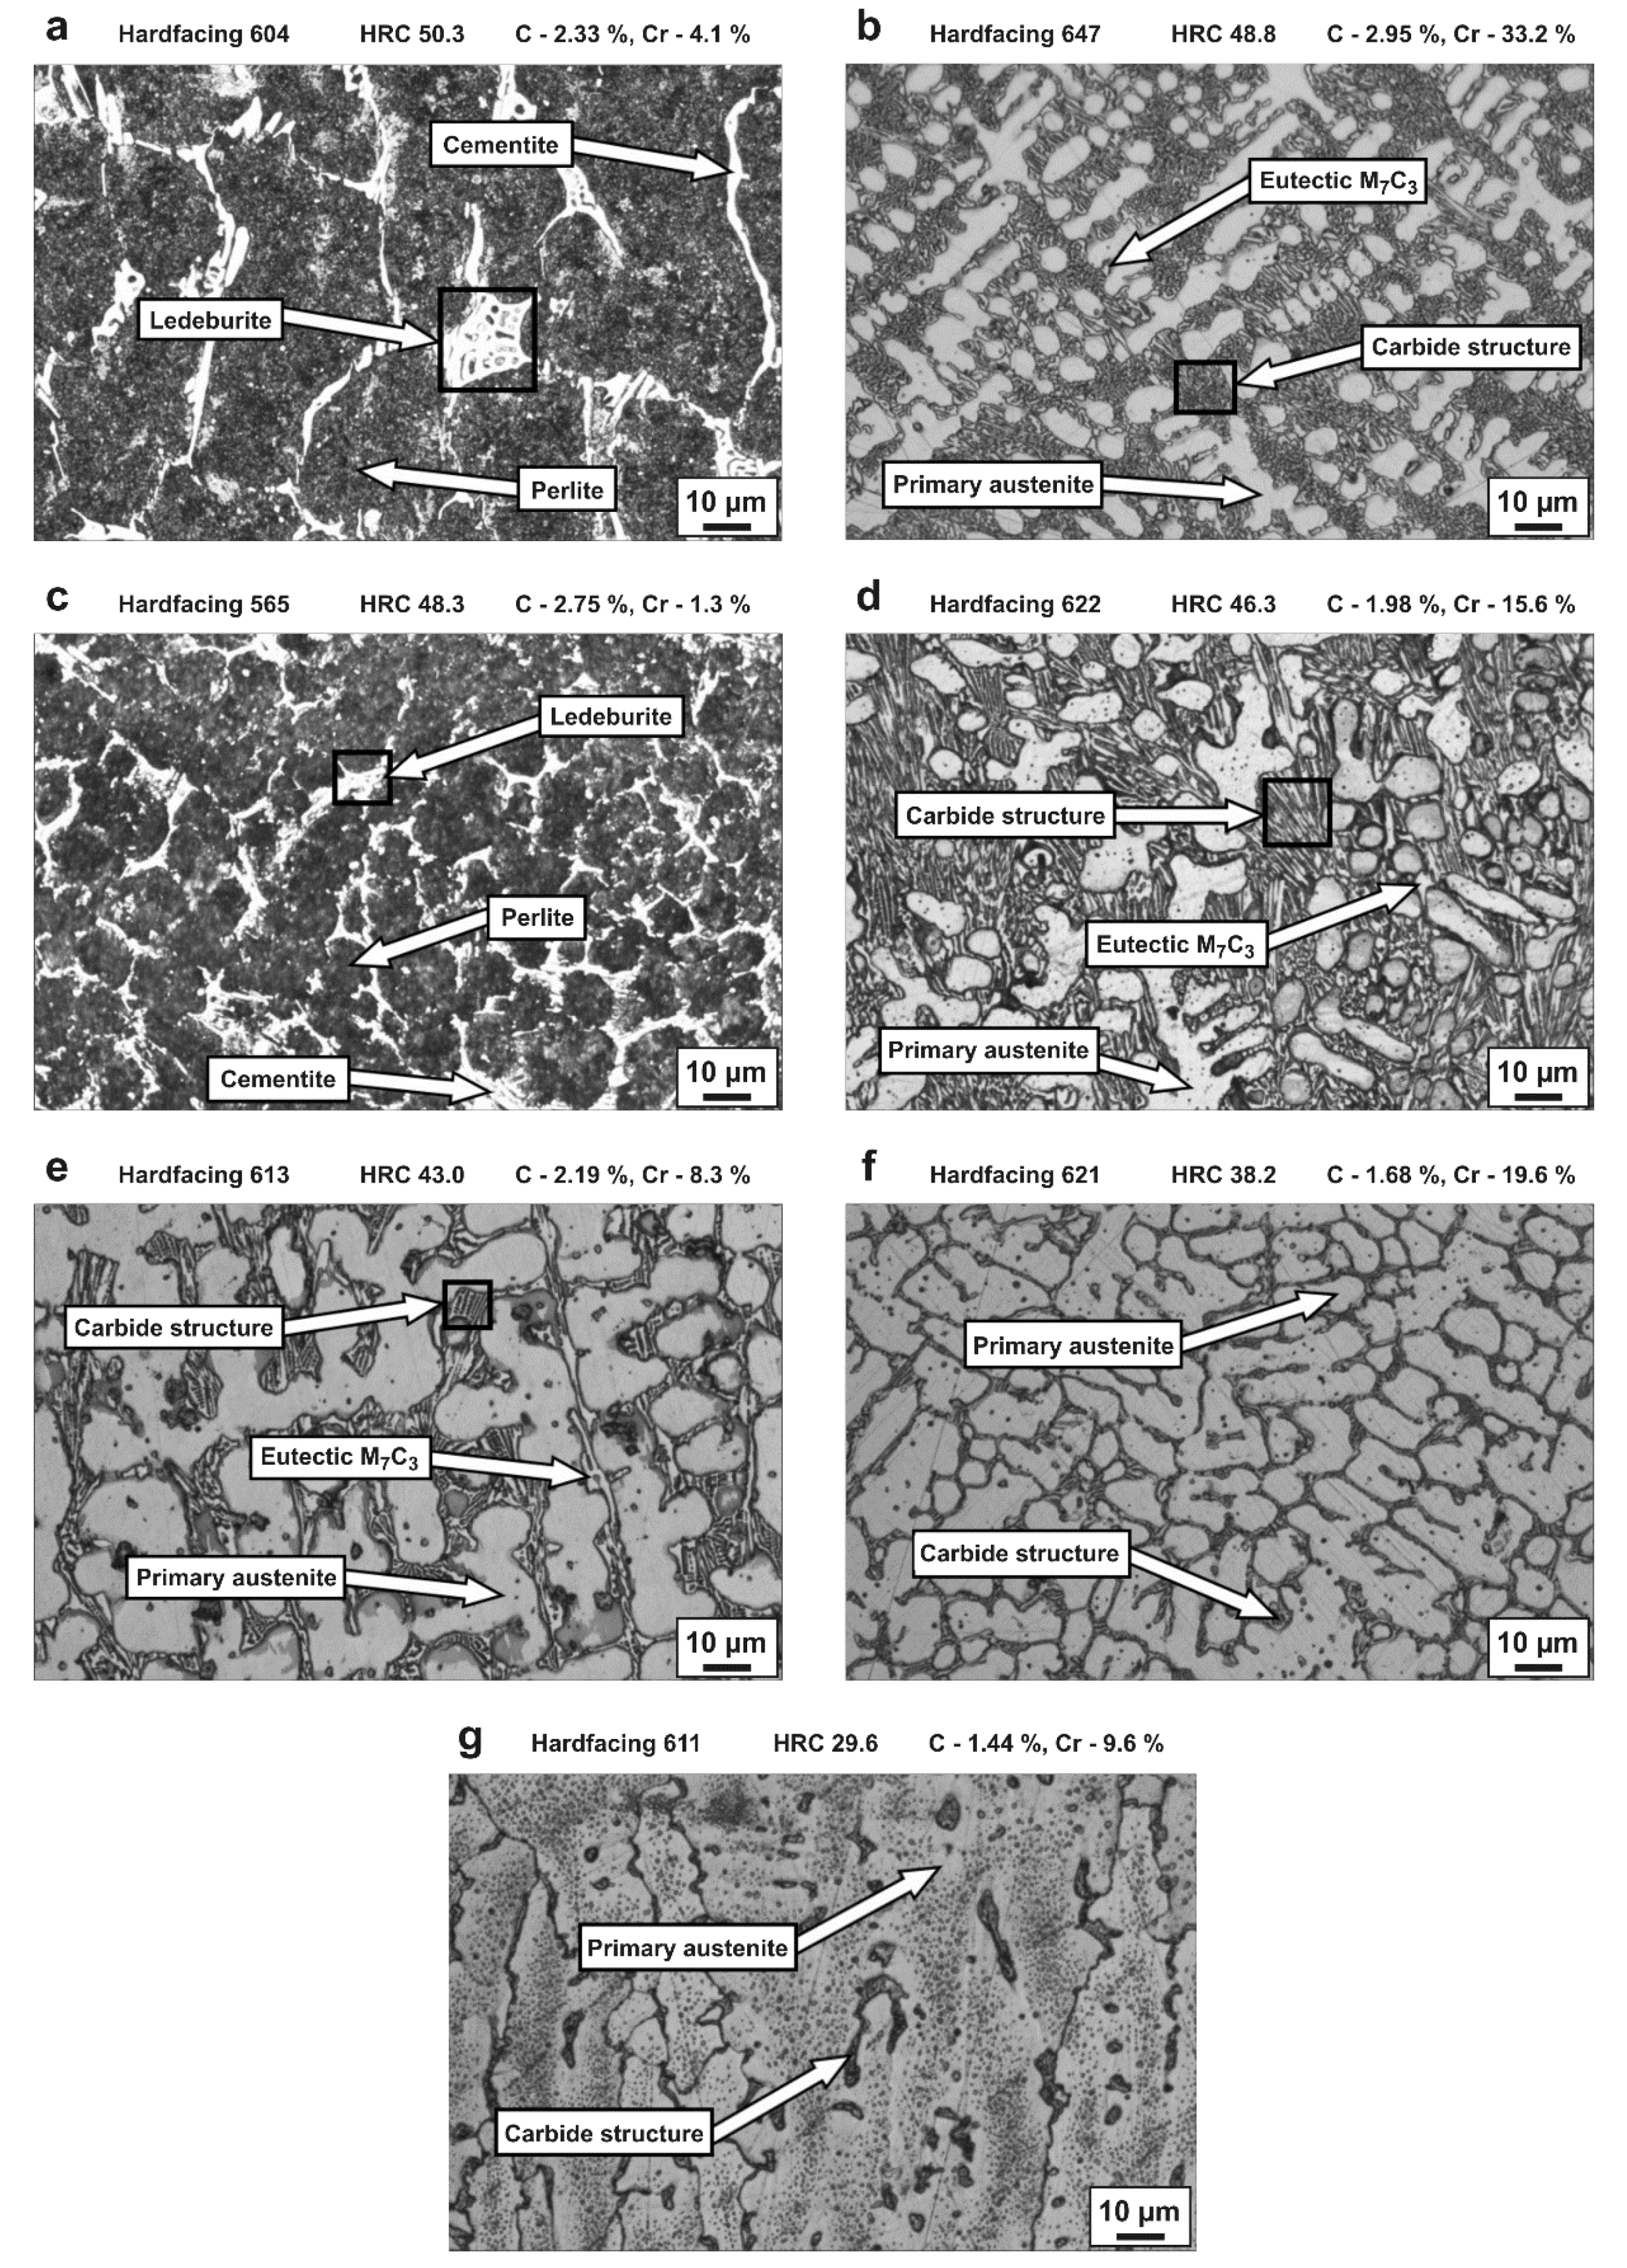
3.2. Microstructure of the Hardfacings

The results of the microstructural investigation of the hardfacings are summarized in Figure 5. These were in agreement with the results of other researchers [26,27,28,29].
Variation of graphite (0.1–30.0%) and ferrochrome (5.3–85.0%) contents in the covering of electrodes resulted in the formation of a wide range of Fe–Cr–C microstructures, such as primary austenite, ledeburite, perlite, cementite, and eutectic M7C3. The prevailing austenite structure of Sample 611 resulted in the lowest hardness (Figure 5). The microstructure of hardfacings will be discussed in more detail in the following sections.

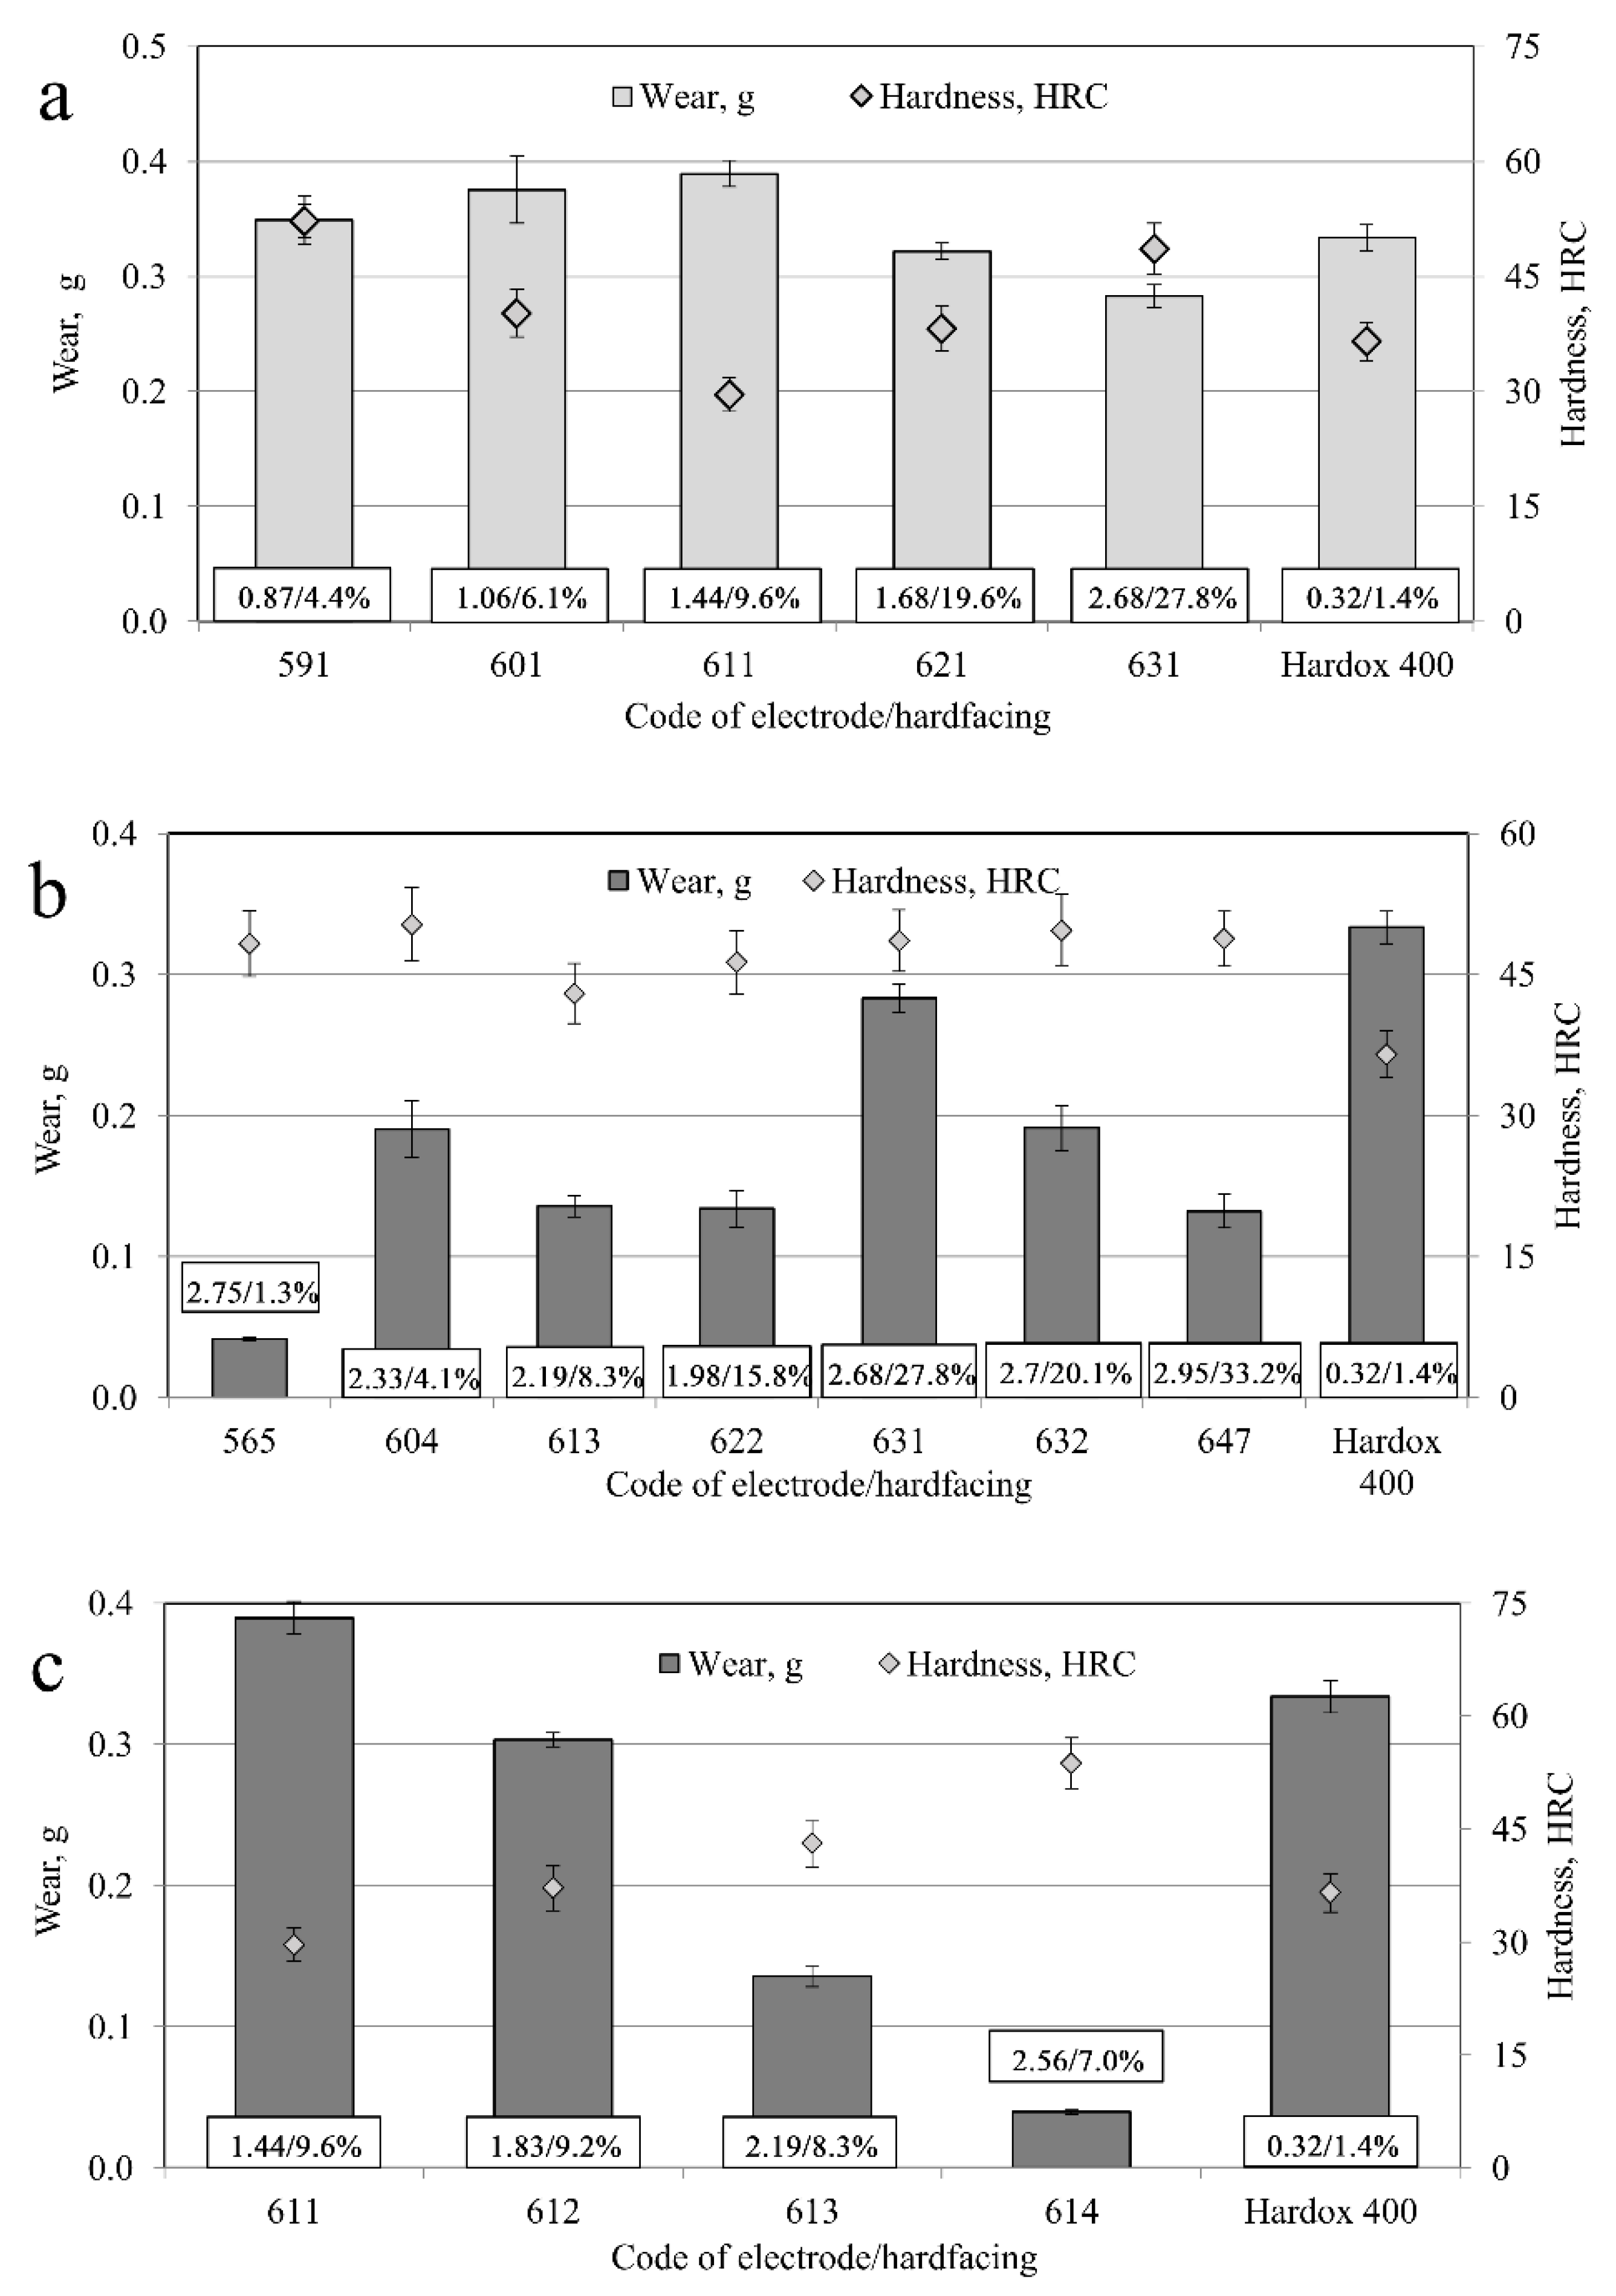
3.3. Wear of Hardfacings in Low-Stress Abrasive Conditions

The wear rates of Groups 591/631, 565/647, and 611/614 of the manufactured Fe–C–Cr hardfacings exhibited under low-contact-stress conditions (with rubber-rimmed wheel), along with their corresponding hardness values, are shown in Figure 6.
In the case of Group 591/631 with varied carbon and chrome contents, it was found that the hardness (29.6–52.2 HRC) and wear resistance were directly correlated. Materials with high hardness (591, 631) exhibited low wear rates, whereas Material 611 with the lowest hardness had the highest wear rate. The wear rate of hardfacings was similar to that of Hardox 400 (the difference ranged from −18 to +14%).
The hardfacings of Group 565/647 with high carbon (>2%) content and varied chromium content had similar hardness (43.0–50.3 HRC), but there were some essential differences in their wear extent; it was obvious that this was affected by the composition and microstructure in addition to the hardness. The wear of the layers varied from 1.2 (Sample 631) to 8.0 (Sample 565) times lower with respect to the reference steel Hardox 400. One of the reasons for this was the lower hardness of Hardox 400 (36.5 HRC). However, the hardness alone could not guarantee high wear resistance. The hardness values of Samples 631 and 647 were similar (48.8 and 48.6 HRC), whereas the wear rates differed by more than a factor of two, which again demonstrated the effect of the composition and microstructure.
The wear of the samples with a prevailing eutectic primary austenite structure with low carbide content (611, 621) was high (Figure 6a,c). Meanwhile, Sample 613, which was composed of a eutectic primary dendritic austenite structure with approximately 30% carbide (eutectic M7C3, Table 5), showed less wear by a factor of 2.0–2.5 (Figure 6b) during the low-contact-stress abrasive test. The dominant structure of Samples 565 and 604 was perlite (with small differences in composition, i.e., 2.75 and 2.33% of C and 1.29 and 4.09% of Cr, respectively; Table 4). The perlite grain size in Sample 604 was 45–70 μm, and that for Sample 565 was 10–25 μm (Figure 5). The contents of cementite and ledeburite were similar, but the difference in grain size led to the increase in the wear rate of Sample 604 of approximately 400%. The composition of Sample 565 (perlite, cementite, ledeburite) was more favorable in comparison to that of Sample 647 (eutectic M7C3, primary dendritic austenite, carbide structure), and resulted in a lower wear rate by a factor of three (Figure 5).
Hardfacings 621 and 622 with a similar composition had a significantly different carbide structure, and 621 additionally had a eutectic M7C3 (Figure 5) that resulted in a lower wear rate by a factor of almost three (Figure 6a,b).
The increase in carbon content in the groups of Samples 611/614 from 1.44 to 2.56% resulted in an increase in the hardness of the hardfacings (29.6 to 53.7 HRC), which in turn provided a lower wear rate as a result. Samples 613 and 614 showed lower wear rates by factors of 2.5 and 8.4, respectively, compared to the reference steel Hardox 400. The reason for this was the higher hardness of the materials and the different microstructure. The structure of Samples 611/613 ranged from the dominant eutectic primary austenite and carbides in 611 to the eutectic primary dendritic austenite with carbide structure and eutectic M7C3 in Sample 613 (Figure 5), which showed a corresponding progressive reduction in the wear rate.
It can be concluded that under low-stress abrasive conditions, the wear rate of the hardfacings was influenced by the hardness and the microstructure, whereas the composition alone was less significant.

3.4. Wear of Hardfacings in Average-Stress Abrasive Conditions

The wear rates of the groups of hardfacings tested under average-stress abrasive conditions are shown in Figure 7, along with their hardness values.
It can be concluded that, in general, there was a similar tendency of the wear rates of materials from Group 591/631 (where both the carbon and chromium contents were varied) tested under low- and average-stress abrasive conditions (see Figure 6a and Figure 7a). The wear rates of the samples from Group 591/631 differed from −15% to +6% in comparison to the reference steel Hardox 400, i.e., the differences were not significant. The lower wear of Samples 601 and 631 was statistically reliable, because deviations in the wear rate of a hardfacing were smaller than the difference in the wear rates of the compared hardfacings. The average wear of the hardfacings (0.69 g) was lower than that of the steel Hardox 400 (0.73 g); the average hardness of the coverings was 41.8 HRC, whereas that of the Hardox 400 steel was 36.5 HRC. The samples with higher hardness, in general, exhibited lower wear rates, although this was not the case for Samples 591 and 601: Sample 591 had higher hardness and wear. It may be expected that defects such as porosity and cracks had negative effects.
For the samples of Group 565/647, it could be said that under average-stress abrasive conditions, the effect of chromium content variation on the wear rate was insignificant. In comparison to the reference steel Hardox 400, the wear rate of Samples 565/647 ranged from −15% to +20%, and such differences were not essential. The average hardness of the surface layers was 47.9 HRC, and the average wear was 0.76 g, whereas the Hardox 400 steel of hardness 36.5 HRC had a lower wear of 0.73 g. This demonstrated the importance of microdefects such as porosity or the presence of internal stress, as well as strength, which become more important if contact stresses are higher (in comparison to low-stress wear tests). Materials 565 and 647, which had the lowest wear rates under low-stress conditions, had very high wear rates under average-stress conditions.
If only Samples 613, 622, 632, and 631 were assessed, then the content of chrome increased from 8.3 to 27.8% and the content of carbon increased from 2.19 to 2.68% (Table 4); a slight increase in hardness was also observed (43 to 49.7 HRC), which resulted in the reduction in the wear rate from 0.82 to 0.63 g. However, the hardfacings with lower carbon and chromium contents (Samples 565 and 604), as well as that with the highest contents of these elements (Sample 647) did not follow this trend.
The hardfacings of Group 611/614 tested under average-stress conditions exhibited different behavior in comparison with tests under low-stress conditions (Figure 7c). With respect to the reference steel Hardox 400, the wear rate was similar, with a slight difference ranging from −5% to +11%. Under average-stress abrasive conditions, the increase in hardness did not provide a beneficial reduction in the wear rate. Only Sample 614 with the maximum hardness of this group had a slightly lower wear rate. A comparison of Figure 6c and Figure 7c reveals that as the result of the increasing stress level, the wear of Sample 611 increased by a factor of approximately two, whereas the growth factor in the wear rate of Sample 614 was greater than 10.
Comparing the results of all the samples tested under average-stress conditions with those of the reference steel Hardox 400, it could be concluded that the hardness in addition to the microstructure and quality of materials (presence of defects such as cracks or porosity) influenced the wear resistance [27]. The wear rates of the tested hardfacings differed by −15% to +20% in comparison to Hardox 400, which indicated that such hardfacings could not generally provide significant advantages under average-stress three-body conditions.

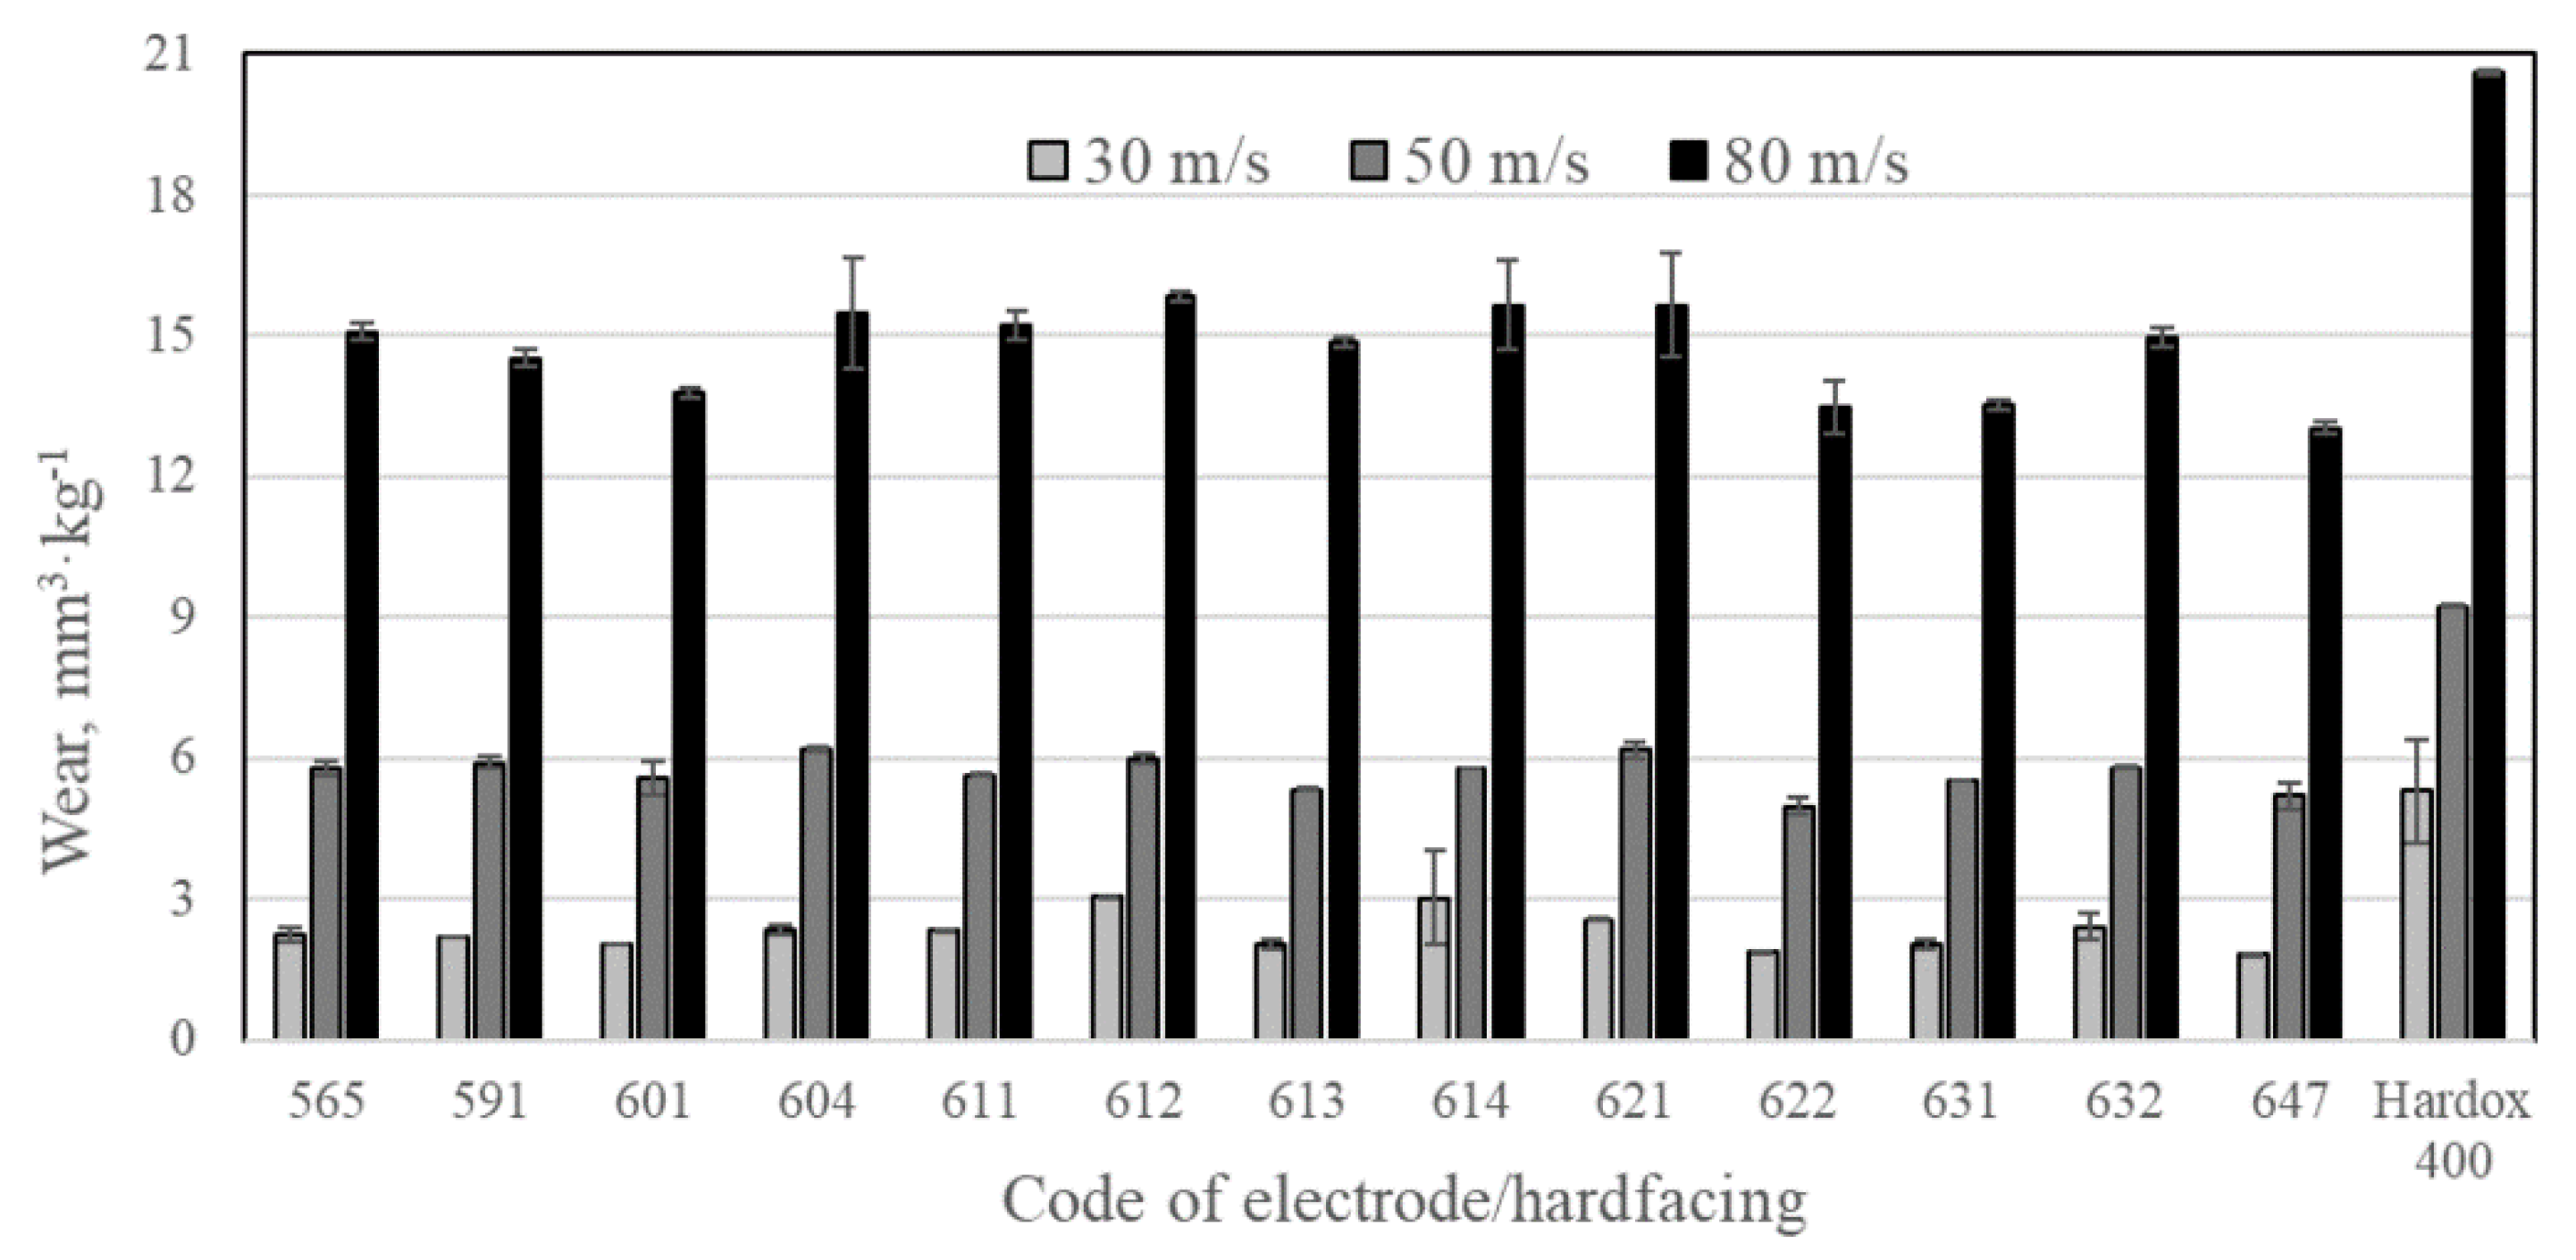
3.5. Wear of Hardfacings under Average- and High-Stress Erosive Conditions

The wear rates of hardfacings tested under erosive conditions at speeds of 30 (average stress), 50, and 80 m·s−1 (high stress) are shown in Figure 8. In general, the wear rates of all the tested hardfacings at all speeds were lower than that of the reference steel Hardox 400: at 30, 50, and 80 m·s−1, the average wear of the hardfacings was lower by factors ranging from 1.7 to 2.9, 1.5 to 1.9, and 1.3 to 1.6, respectively. This demonstrated that the surfacing (deposition of hardfacings) was more effective than the protective solution involving Hardox 400 steel in all the cases considered. However, as with three-body conditions, the application of deposited hardfacings was more beneficial under lower stress conditions (at the speed of 30 m·s−1, for example).
Samples 601, 613, 622, and 647 had the lowest wear at the particle speed of 30 m·s−1; Samples 613, 622, and 647 had the lowest wear at the speed of 50 m·s−1; and Samples 601, 622, 631, and 647 at the speed of 80 m·s−1. These samples had a prevailing austenitic microstructure, which was responsible for the lower wear rate [19,30].

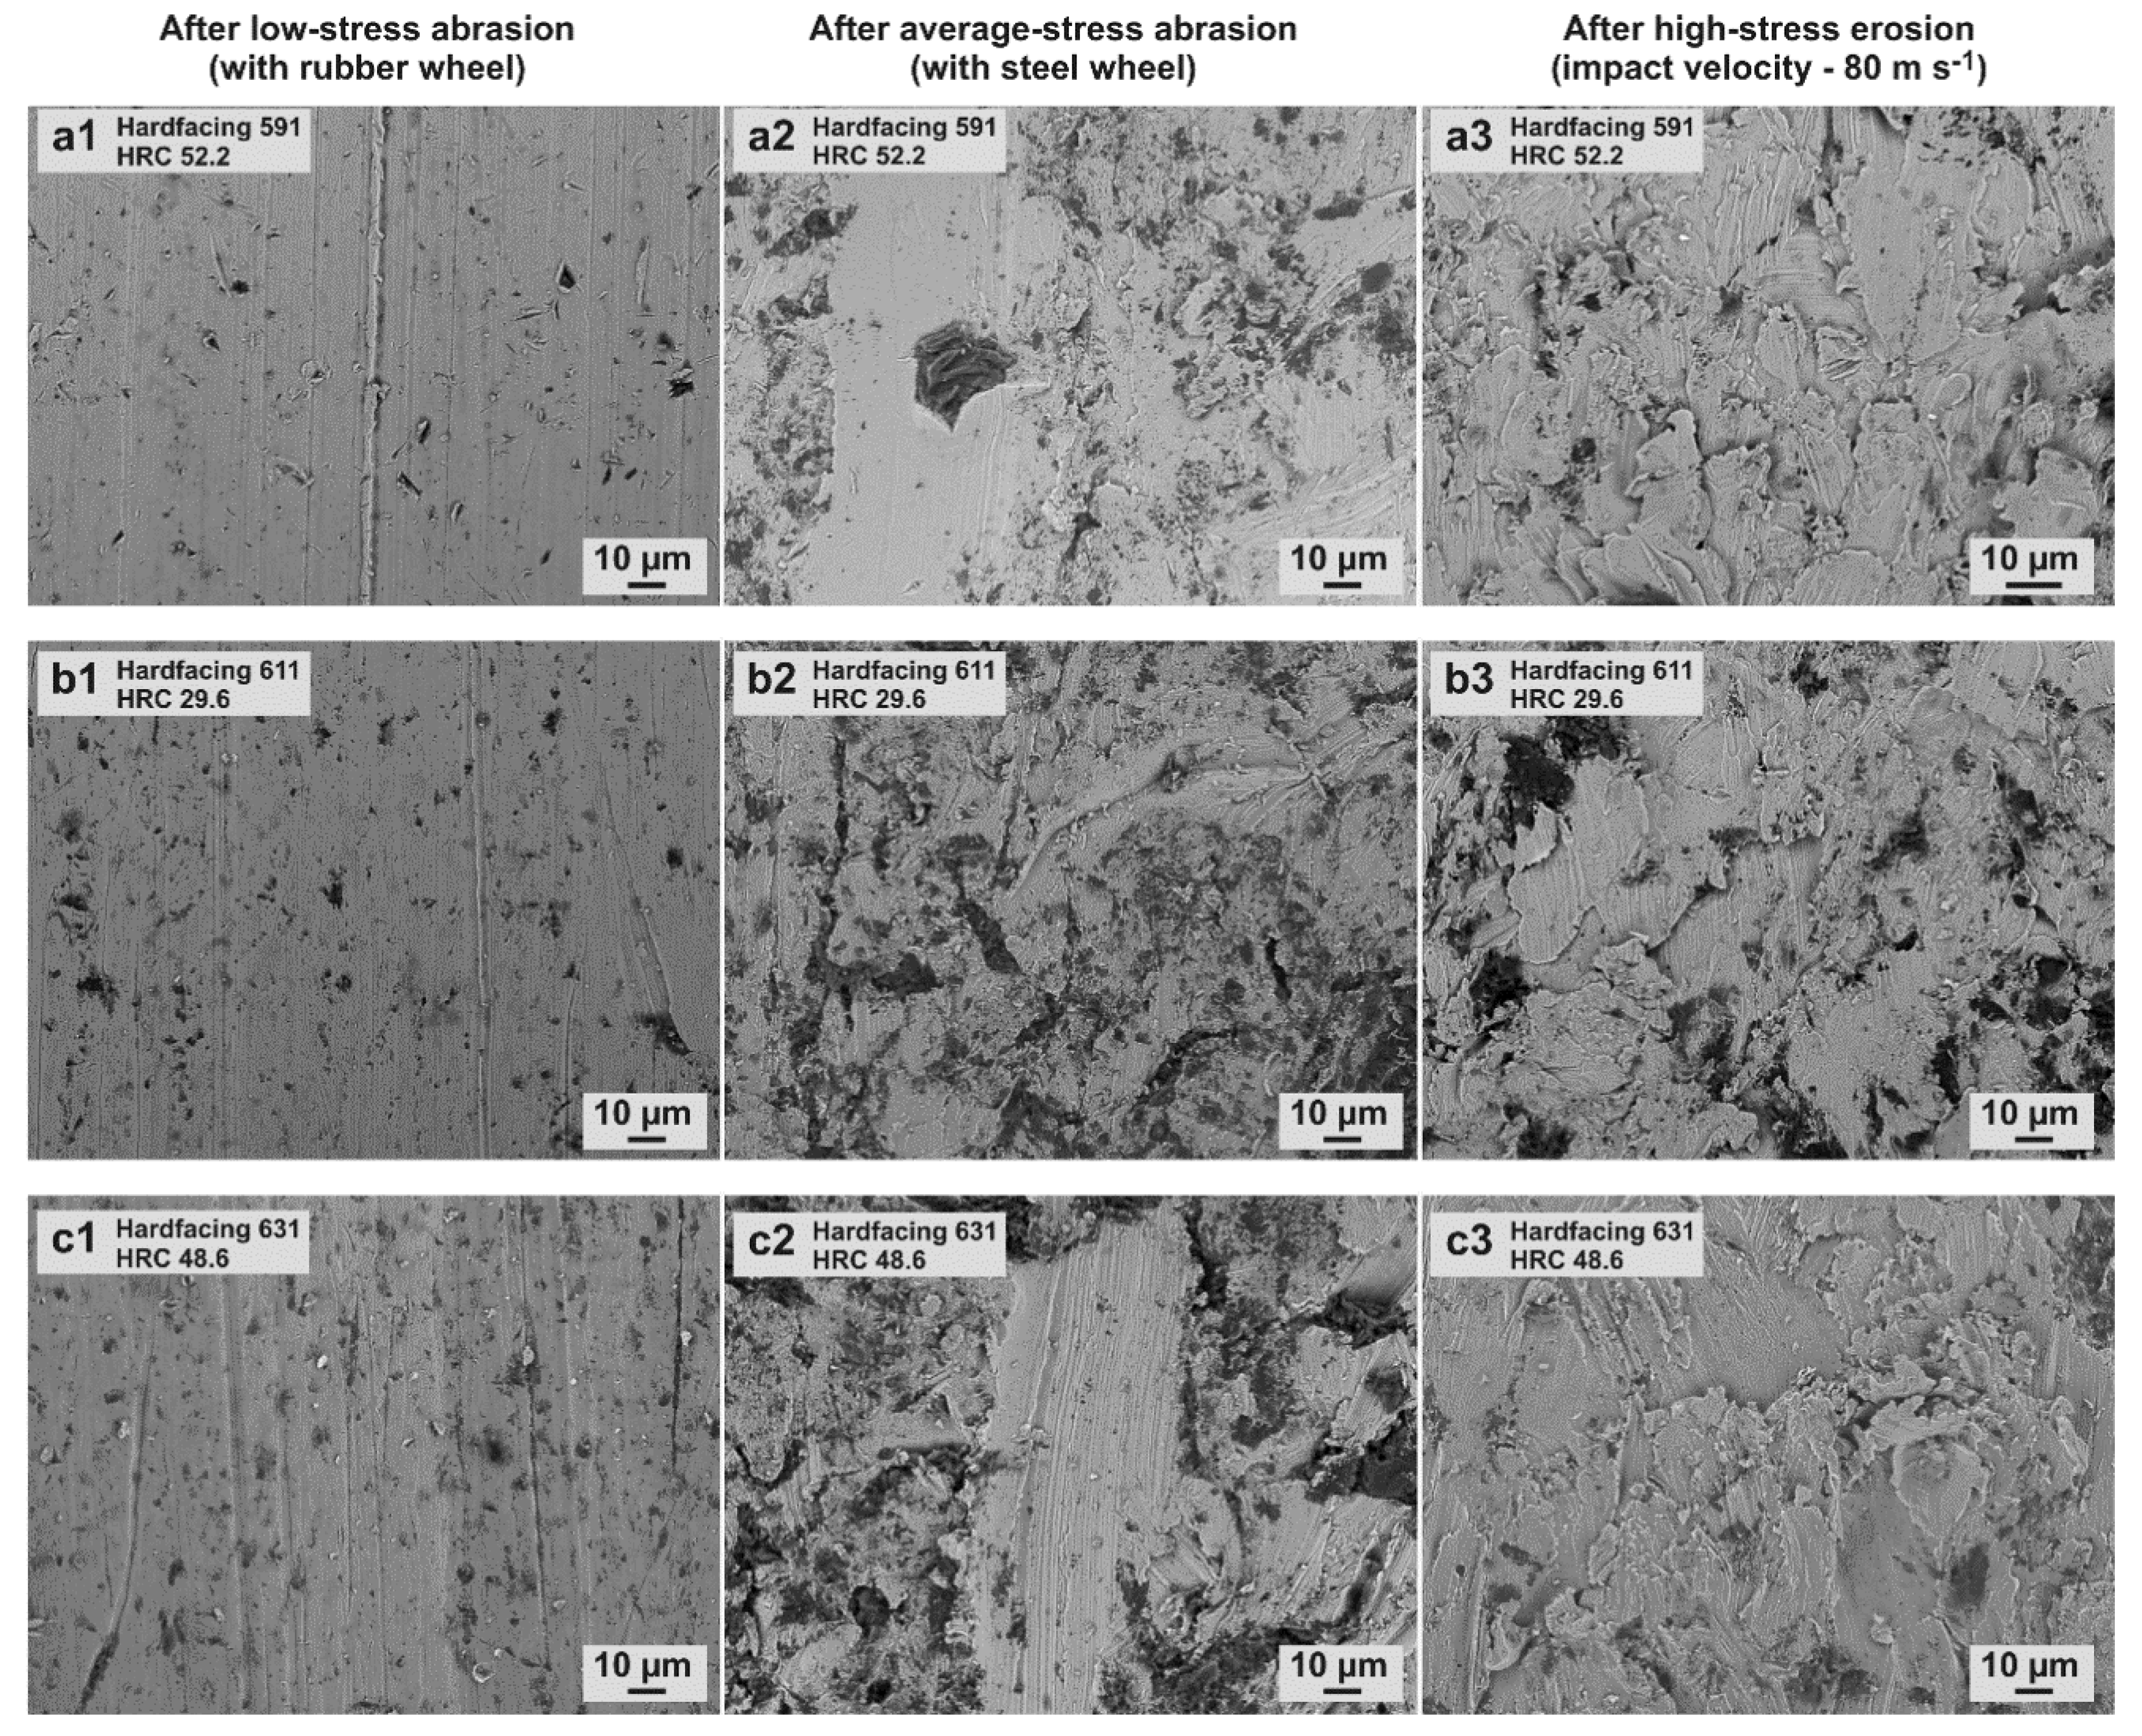
3.6. Analysis of Worn Surfaces

Characteristic images of the worn surfaces are provided in Figure 9.
In the case of a low contact stress abrasive test, abrasive particles being pressed toward the sample by the rubber disk slid on a surface and caused only shallow discontinuous scratches (which were aligned vertically downwards, as in Figure 9). Sample 591 had many micro-impressions, probably due to the presence of hard phases, which stopped the sliding and provoked rotation and indentation by abrasive particles. There were only a few fragments of abrasive particles remaining, whereas there was a significant number of impressions made by particles.
In the case of an average contact stress abrasive test, SiO2 particles crushed between a steel disk and a test surface resulted in much more significant plastic deformations. The surface of a hardfacing had many remaining embedded fragments of broken abrasive particles, and a mechanically mixed layer was formed [31,32]. The directions of the scratches were not always parallel, owing to the higher level of particle rotation; particles with irregular shapes usually did not form parallel grooves or scratches during rotation.
In the case of high contact stress caused by the erosion of hardfacings, craters with significant macro-deformation of the surface were present. Sample 611 exhibited the highest number of sand fragments embedded into the surface, which was likely due to its highly ductile austenitic structure with the lowest hardness (29.6 HRC).

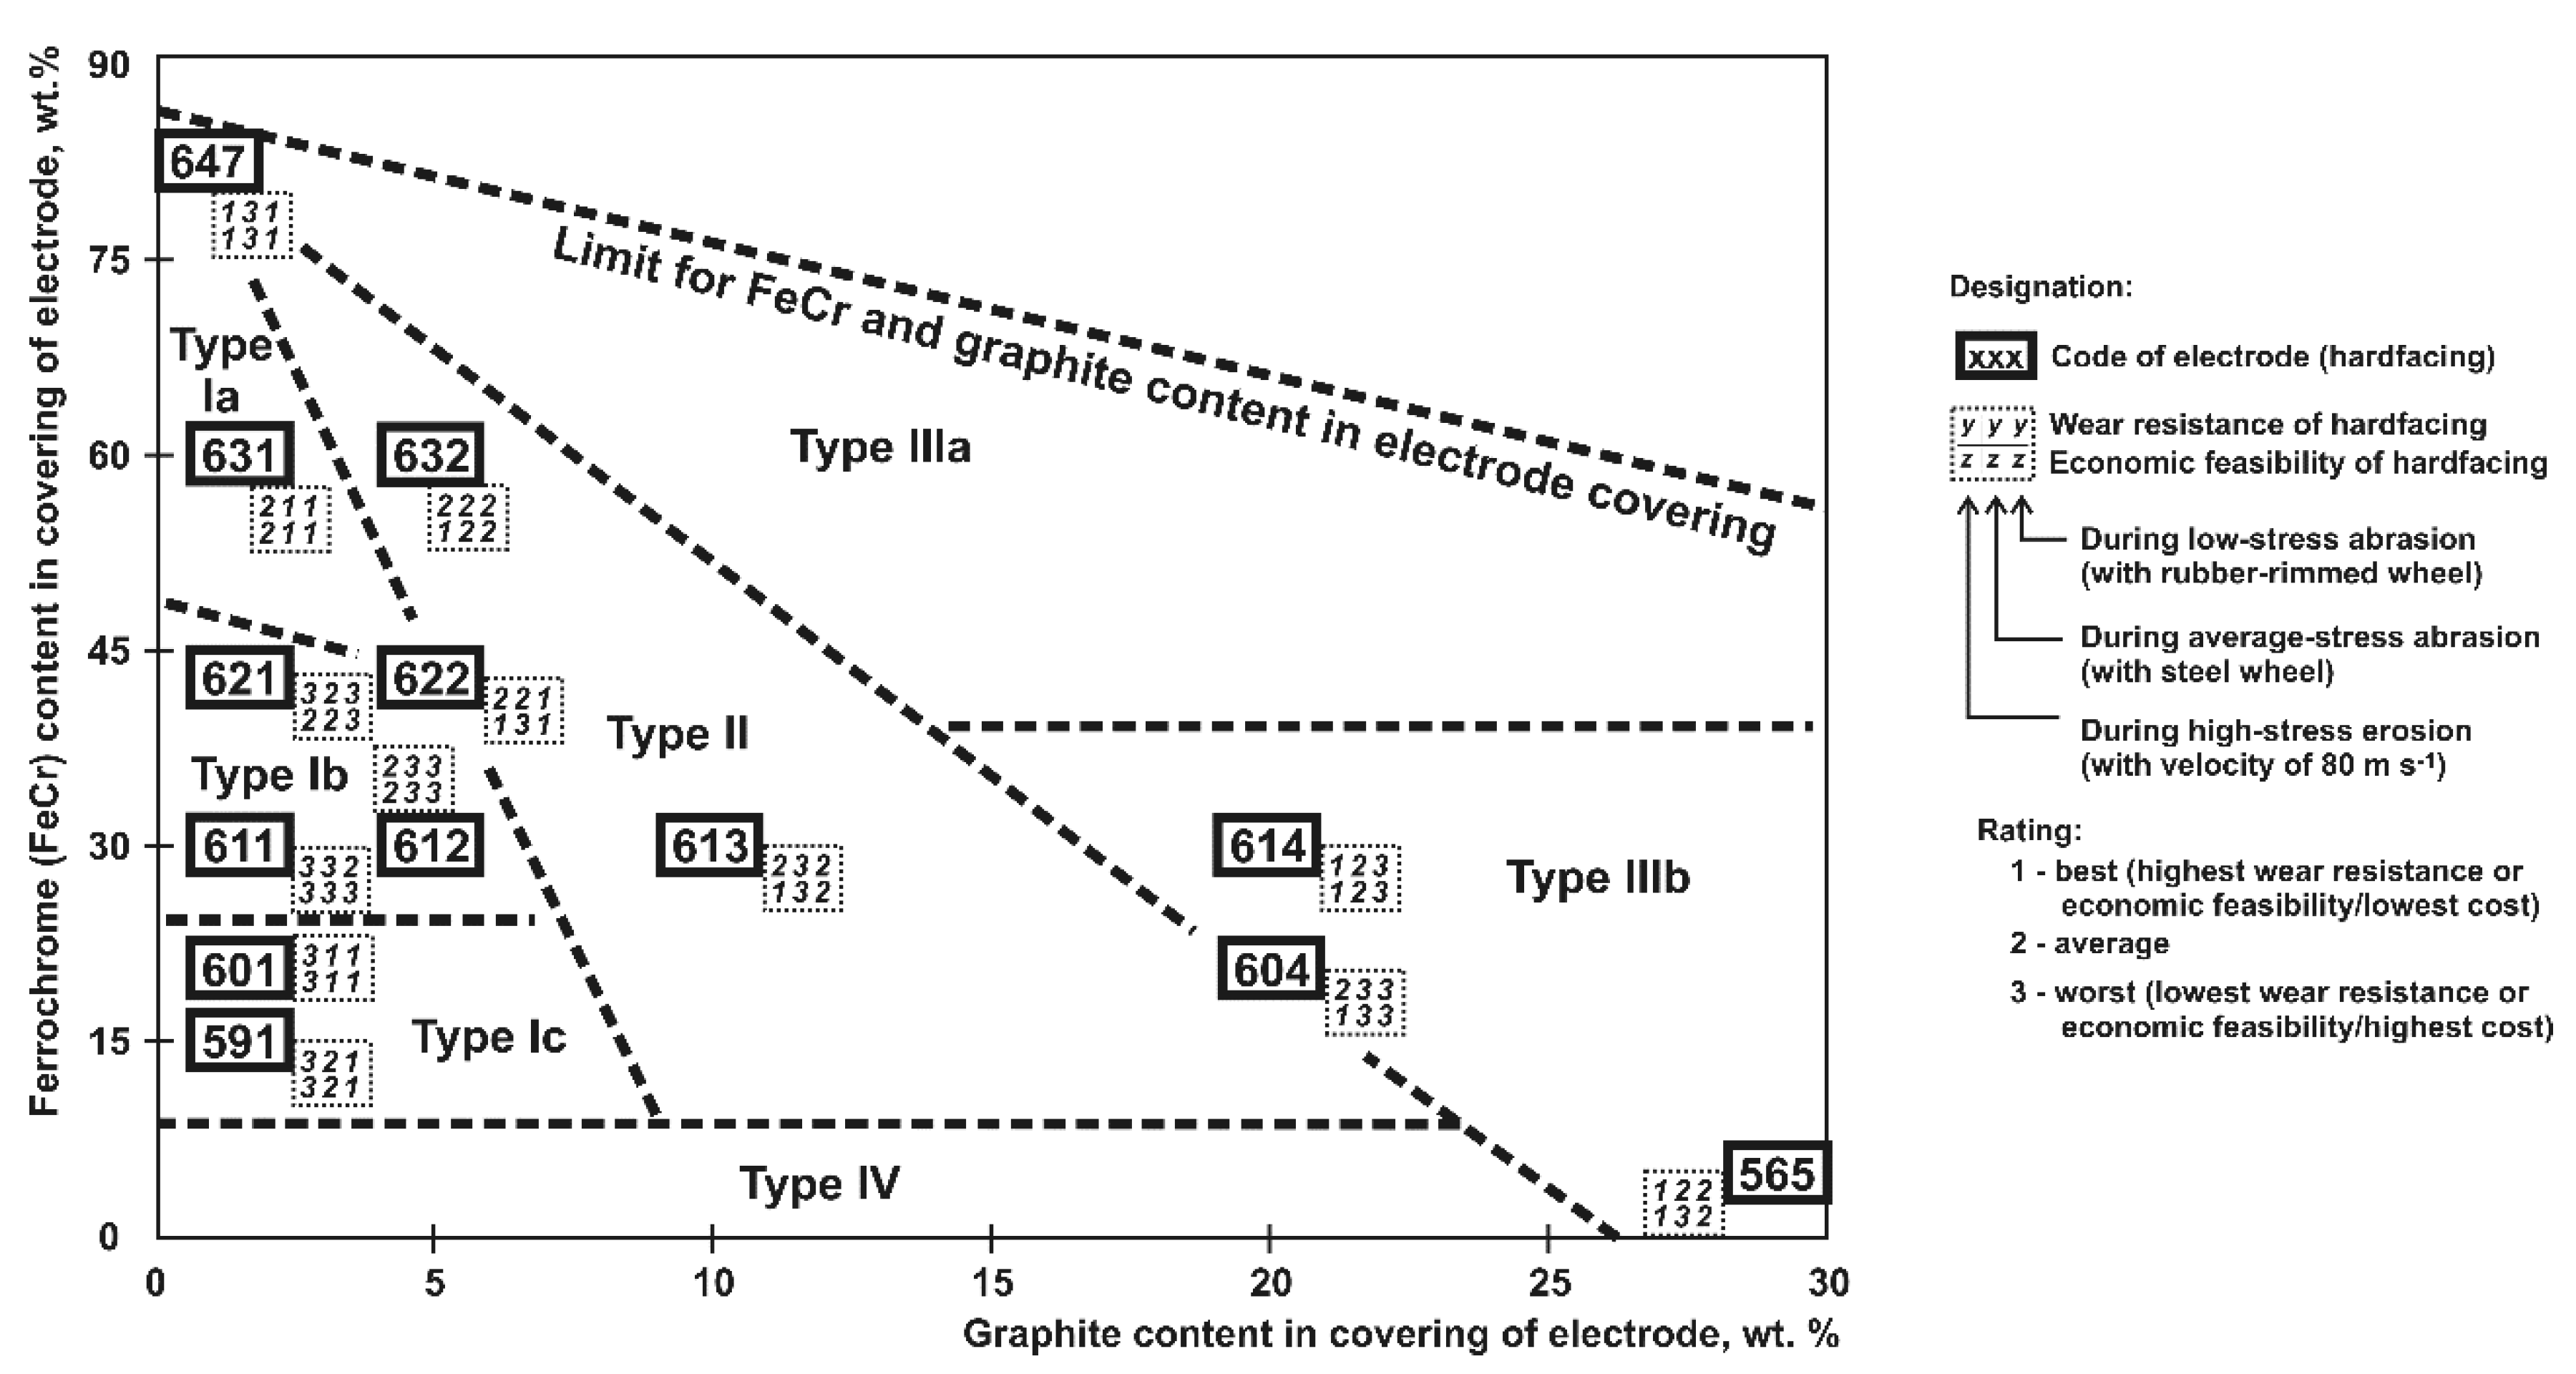
3.7. Technical and Economic Assessment of Hardfacings

Technical (mass of electrodes, deposition coefficient of electrode, wear rates, and wear intensity ratio of materials) and economic (electrode, hardfacing material cost, deposited hardfacing cost, hardfacing productivity, etc.) indicators are presented in Table 5.
The cost of 1 kg of deposited hardfacing varied from 11.05 to 20.12 €∙kg−1, mainly owing to the various compositions of manufactured electrodes. The hardfacing labor cost (13.38–16.56 €∙kg−1) was more significant than the hardfacing material cost (2.28–3.56 €∙kg−1). If the wear intensity of deposited hardfacings were the same as that of Hardox 400, then the only cost-effective hardfacing would be that with Electrode 647, as the coating cost of this electrode (11.05 €∙kg−1) was lower than that of Hardox 400 (12.00 €∙kg−1). However, if the wear intensity ε (the wear rate of the hardfacing with respect to the reference material) were also taken into account, then the relative cost of welded hardfacings under low-stress abrasive conditions varied from 1.42 to 14.00 €∙kg−1, and only Electrodes 591, 601, and 611 yielded hardfacings that were not cost-effective. Meanwhile, the cost under an average contact load (stress) varied from 10.39 to 14.81 €∙kg−1, which was close to the cost of a hardfacing with Hardox 400 (12.00 €∙kg−1). The use of hardfacings under high-stress erosive conditions was favorable in the case of all materials, as the relative cost varied from 6.42 to 8.04 €∙kg−1, which was significantly lower than that of Hardox 400 (12.00 €∙kg−1).

3.8. Analysis of Wear and Economic Feasibility

A wear and economic feasibility map was constructed according to the results of wear testing under various contact stresses along with the technical and economical assessment of the hardfacings (Figure 10). The hardfacings could be divided into four types. The division was performed according to the wear results at various contact stress levels. The qualitative assessment of the wear rate results is shown in the right image. The three numerical values in the upper row illustrated the wear intensity ratio ε (Table 5) results under low-stress abrasive, average-stress abrasive, and high-stress erosion at 80 m·s−1, where the indices of 1, 2, and 3 indicate highest, average, and low wear resistance, respectively. The three numerical values in the lower row show the results of economical assessment of the samples. The estimation was made according to the relative cost of the hardfacings tested under different wear conditions (Table 5), where the indices of 1, 2, and 3 indicate that the hardfacing is highly economically feasible (has the lowest cost), economically feasible, and not feasible, respectively.
The electrodes (and resulting hardfacings) of Type I (591, 601, 611, 612, 621, and 631) were not suitable for low-stress abrasive conditions, because they had low wear resistance and were not economically feasible (mainly had an index of 3). The electrodes of Type II (613, 622, and 632) might be applied in average contact stress conditions (mostly index of 1 or 2). The electrodes of Type IIIb (565, 604, 614, and 647) were suitable candidates for low-stress abrasive conditions (their index was 1, but Sample 604 had an index of 2 for wear evaluation). The electrodes of Type Ia (622, 631, and 647) could be applied in high-stress (with the particle impingement speed of 80 m·s−1) erosive conditions (their index is mainly 1). The electrodes (hardfacings) that did not generally perform well under all the tested conditions (611, 612, 613, and 621) were indicated by Type Ib. Hardfacing 622 could be included as well, but it had satisfactory results under low and average contact stress abrasion and good performance under high contact stress erosive conditions. Type IIIa with high graphite and FeCr content in the coverings must be investigated in the future, as hardfacings could perform well under low-stress abrasive or high-stress erosive conditions, similarly to 565 or 647, respectively. However, the cost of such electrodes (close to 2 €∙kg−1, Table 2 and Table 5) could be high owing to the cost of graphite and FeCr. Type IV was also reasonable for future investigations due to the lower cost of such electrodes and the good results of Hardfacing 565 under low-stress abrasive conditions. The hardfacings produced using Electrodes 614 and 565 (Type IIIb) had slightly higher titanium content (Table 4). During the electrode manufacturing, the oxygen in rutile was replaced by carbon because of the sufficiently high carbon content. The combination of titanium and carbon resulted in the formation of TiC, which in turn might have positively influenced the wear resistance of the hardfacings. These hardfacings were only observed to have high wear resistance under low-stress abrasive conditions.
In Section 3.2, the images of the microstructures of certain characteristic hardfacings were presented (Figure 5). Hardfacings 611 and 613 were typical for Type Ib, which did not perform well in all abrasive conditions. Hardfacing 611 consisted of primary austenite and carbide structures, which did not increase the abrasive wear resistance under these conditions. Type IIIb is illustrated by Hardfacings 565 and 604. These were suitable for low-stress abrasive conditions; they consisted of ledeburite, perlite, and cementite structures and exhibited hardness values of 48.3 and 50.3 HRC, respectively. Hardfacing 622 (Type Ia) was suitable for high-stress erosive conditions (particle speed of 80 m·s−1); it consisted of carbide, primary austenite, and eutectic M7C3 structures

4. Conclusions

The following conclusions were drawn from the completed tests and analysis:
  • Four groups of electrode coverings with adjusted proportions of initial components were produced to study the effects of these components on the resulting carbon and chromium contents, microstructure, hardness, and wear resistance of Fe–C–Cr hardfacings, which were manufactured by manual arc welding.
  • The graphite and ferrochrome contents (among the dry components of electrode coverings) were varied from 0.1 to 30.0% and from 5.3 to 85.0%, respectively, which resulted in carbon and chromium contents of the hardfacings of 0.87 to 2.95% and 1.3 to 33.2%, respectively. The major phases composing the microstructures of the manufactured hardfacings and influencing the final properties were austenite, perlite, ledeburite, and various carbides, including eutectic M7C3.
  • It was found that, in general, high hardness (a range of 29.6–53.5 HRC was obtained) could serve as an indicator of expected high wear resistance, whereas the microstructure, influenced by cooling rates and the presence of defects, such as pores or cracks, could be responsible for significant deterioration of the final properties of hardfacings.
  • The strongest effect of carbon on the wear resistance of hardfacings was observed under low-stress abrasive conditions. The wear intensity ratio (wear resistance of hardfacings with respect to Hardox 400) was improved (by increasing the carbon content) from 0.86 to 7.77. The best results of the relative wear resistance under erosive conditions were also obtained under conditions with lower stress levels (1.58, 1.87, and 2.94 times at particle impingement speeds of 80, 50, and 30 m∙s−1, respectively).
  • The price of Fe–C–Cr electrodes for manual arc welding ranged from 1.32 to 2.15 €∙kg−1. If all the costs required to manufacture hardfacings were taken into account (deposition coefficient, hardfacing productivity, labor cost), then the final price of the hardfacings ranged from 11.05 to 20.12 €∙kg−1.
  • If the wear intensity ratio was taken into account, then hardfacings were the most economically feasible under low-stress abrasive conditions (the cost could be reduced down to 12.4% of that for Hardox 400, i.e., 7.8 times), whereas for erosion at 80, 50, and 30 m∙s−1, the price could be reduced down to 63.3, 53.5, and 34.0% (up to 2.9 times) that for Hardox 400, respectively.
  • In general, Electrode 614, with graphite and ferrochrome contents of 20% and 30% in the covering, respectively, could be proposed as a universal option that performed quite well under all conditions. This could be influenced by the highest resulting titanium (TiC) contents among the investigated hardfacings.

Author Contributions

Conceptualization, V.J., E.K. and M.A.; methodology, V.J., A.L., M.A., V.V. and V.A.; software, E.K. and V.A.; validation, E.K, M.A. and I.G.; formal analysis, V.J., E.K., M.A., V.V. and V.A.; investigation, E.K., M.A. and I.G.; resources, V.J., M.A. and V.V.; data curation, E.K.; writing—original draft preparation, V.J. and E.K.; writing—review and editing, V.J., E.K., M.A., I.G and V.A.; visualization, E.K. and M.A.; supervision, V.J. and M.A.; project administration, V.J.; funding acquisition, V.J. and M.A. All authors have read and agreed to the published version of the manuscript.

Funding

This research was supported (M. Antonov) by the Estonian Ministry of Higher Education and Research under Projects (M-ERA.NET MOBERA9 DURACER ETAG 18012, SS427, PRG643).

Conflicts of Interest

The authors declare no conflict of interest. The funders had no role in the design of the study; in the collection, analyses, or interpretation of data; in the writing of the manuscript, or in the decision to publish the results.

References

  1. Holmberg, K.; Kivikytö-Reponen, P.; Härkisaari, P.; Valtonen, K.; Erdemir, A. Global energy consumption due to friction and wear in the mining industry. Tribol. Int. 2017, 115, 116–139. [Google Scholar] [CrossRef]
  2. Sadeghi, F.; Najafi, H.; Abbasi, A. The effect of Ta substitution for Nb on the microstructure and wear resistance of an Fe–Cr–C hardfacing alloy. Surf. Coat. Tech. 2017, 324, 85–91. [Google Scholar] [CrossRef]
  3. Jankauskas, V.; Kreivaitis, R.; Milčius, D.; Baltušnikas, A. Analysis of abrasive wear performance of arc welded hard layers. Wear 2008, 265, 1626–1632. [Google Scholar] [CrossRef] [Green Version]
  4. Narayanaswamy, B.; Hodgson, P.; Beladi, H. Effect of microstructure on abrasive wear behaviour. Agric. Eng. Res. Papers. 2015, 47, 1–4. [Google Scholar]
  5. Hornung, J.; Zikin, A.; Pichelbauer, K.; Kalin, M.; Kirchgaßner, M. Influence of cooling speed on the microstructure and wear behaviour of hypereutectic Fe–Cr–C hardfacings. Mater. Sci. Eng. 2013, 576, 243–251. [Google Scholar] [CrossRef]
  6. Jankauskas, V. Strengthening machine elements working under abrasive environment by alloying with hard layers and their estimation. Mechanika 2006, 57, 55–60. [Google Scholar]
  7. Veinthal, R.; Sergejev, F.; Zikin, A.; Tarbe, R.; Hornung, J. Abrasive impact wear and surface fatigue wear behaviour of Fe–Cr–C PTA overlays. Wear 2013, 301, 102–108. [Google Scholar] [CrossRef]
  8. Liu, H.Y.; Song, Z.L.; Cao, Q.; Chen, S.P.; Meng, Q.S. Microstructure and properties of Fe–Cr–C hardfacing alloys reinforced with TiC-NbC. J. Iron Steel Res. Int. 2016, 23, 276–280. [Google Scholar] [CrossRef]
  9. Liu, S.; Zhou, Y.; Xing, X.; Wang, J.; Yang, Y.; Yang, Q. Agglomeration model of (Fe,Cr)7C3 carbide in hypereutectic Fe–Cr–C alloy. Mater. Lett. 2016, 183, 272–276. [Google Scholar] [CrossRef]
  10. Yüksel, N.; Sahin, S. Wear behavior–hardness–microstructure relation of Fe–Cr–C and Fe–Cr–C–B based hardfacing alloys. Mater. Des. 2014, 58, 491–498. [Google Scholar] [CrossRef]
  11. Chang, C.M.; Chen, Y.C.; Wu, W. Microstructural and abrasive characteristics of high carbon Fe–Cr–C hardfacing alloys. Tribol. Int. 2010, 43, 929–934. [Google Scholar] [CrossRef]
  12. Ye, F.; Hojamberdiev, M.; Xu, Y.; Zhong, L.; Yan, H.; Chen, Z. (Fe,Cr)7C3/Fe surface gradient composite: Microstructure, microhardness, and wear resistance. Mater. Chem. Phys. 2014, 147, 823–830. [Google Scholar] [CrossRef]
  13. Buchely, M.-F.; Gutierrez, J.-C.; León, L.-M.; Toro, A. The effect of microstructure on abrasive wear of hardfacing alloys. Wear 2005, 259, 52–61. [Google Scholar] [CrossRef]
  14. Correa, E.-O.; Alcântara, N.-G.; Valeriano, L.-C.; Barbedo, N.-D.; Chaves, R.R. The Effect of Microstructure on Abrasive Wear of a Fe-Cr-C-Nb Hardfacing Alloy Deposited by the Open Arc Welding Process. Surf. Coat. Tech. 2015, 276, 479–484. [Google Scholar] [CrossRef]
  15. Falat, L.; Džupon, M.; Ťavodová, M.; Hnilica, R.; L’uptáčiková, V.; Čiripová, L.; Homolová, V.; Ďurišinová, K. Microstructure and Abrasive Wear Resistance of Various Alloy Hardfacings for Application on Heavy-Duty Chipper Tools in Forestry Shredding and Mulching Operations. Materials 2019, 12, 2212. [Google Scholar] [CrossRef] [Green Version]
  16. Medyński, D.; Samociuk, B.; Janus, A.; Checmanowski, J. Effect of Cr, Mo and Al on Microstructure, Abrasive Wear and Corrosion Resistance of Ni-Mn-Cu Cast Iron. Materials 2019, 12, 3500. [Google Scholar] [CrossRef] [Green Version]
  17. Vuorinen, E.; Heino, V.; Ojala, N.; Haiko, O.; Hedayati, A. Erosive-Abrasive Wear Behavior of Carbide-Free Bainitic and Boron Steels Compared in Simulated Field Conditions. Proc. Inst. Mech. Eng. Part J J. Eng. Tribol. 2018, 232, 3–13. [Google Scholar] [CrossRef]
  18. Sathiya, P.; Mishra, M.-K.; Shanmugarajan, B. Effect of Shielding Gases on Microstructure and Mechanical Properties of Super Austenitic Stainless Steel by Hybrid Welding. Mater.Des. 2018, 33, 203–212. [Google Scholar] [CrossRef]
  19. Katsich, C.; Badisch, E.; Roy, M.; Heath, G.R.; Franek, F. Erosive wear of hardfaced Fe–Cr–C alloys at elevated temperature. Wear 2009, 267, 1856–1864. [Google Scholar] [CrossRef]
  20. Yang, J.; Tian, J.; Hao, F.; Dan, T.; Ren, X.; Yang, Y.; Yang, Q. Microstructure and wear resistance of the hypereutectic Fe–Cr–C alloy hardfacing metals with different La2O3 additives. Appl. Surf. Sci. 2014, 289, 437–444. [Google Scholar] [CrossRef]
  21. Sidlin, Z.A. Manufacture of Electrodes for Manual Arc Welding; Ekotekhnologiya: Kyiv, Ukraine, 2009. (In Russian) [Google Scholar]
  22. Kushnerev, D.M.; Bulat, A.; Gnatenko, M.F. Handbook. Materials for Production Covered Electrodes for Manual Arc Welding, Their Suppliers; Velma: Kyiv, Ukraine, 1997. (In Russian) [Google Scholar]
  23. Jankauskas, V.; Antonov, M.; Varnauskas, V.; Skirkus, R.; Goljandin, D. Effect of WC grain size and content on low stress abrasive wear of manual arc welded hardfacings with low-carbon or stainless steel matrix. Wear 2015, 328–329, 378–390. [Google Scholar] [CrossRef]
  24. Jankauskas, V.; Katinas, E.; Skirkus, R.; Aleknevičienė, V. The method of hardening soil rippers by surfacing and technical–economic assessment. J. Frict. Wear 2014, 35, 270–277. [Google Scholar] [CrossRef]
  25. GOST 23.201–78—Standard. Products Wear Resistance Assurance. Gas Abrasive Wear Testing of Materials and Coatings with Centrifugal Accelerator, 1978. Available online: http://protect.gost.ru/document.aspx?control=7&id=156361 (accessed on 21 March 2020). (In Russian).
  26. Günther, K.; Bergmann, J.P.; Suchodoll, D. Hot wire-assisted gas metal arc welding of hypereutectic FeCrC hardfacing alloys: Microstructure and wear properties. Surf. Coat. Tech. 2018, 334, 420–428. [Google Scholar] [CrossRef]
  27. Fan, C.; Chen, M.-C.; Chang, C.-M.; Wu, W. Microstructure change caused by (Cr,Fe)23C6 carbides in high chromium FeCrC hardfacing alloys. Surf. Coat. Tech. 2006, 201, 908–912. [Google Scholar] [CrossRef]
  28. Gu, J.; Xiao, P.; Song, J.; Li, Z.h.; Lu, R. Sintering of a hypoeutectic high chromium cast iron as well as its microstructure and properties. J. Alloys Comp. 2018, 740, 485–491. [Google Scholar] [CrossRef]
  29. Chang, C.-M.; Chen, L.-H.; Lin, C.-M.; Chen, J.-H.; Wu, W. Microstructure and wear characteristics of hypereutectic FeCrC cladding with various carbon contents. Surf. Coat. Tech. 2010, 205, 245–250. [Google Scholar] [CrossRef]
  30. Badisch, E.; Katsich, C.; Winkelmann, H.; Franek, F.; Roy, M. Wear behaviour of hardfaced Fe-Cr-C alloy and austenitic steel under 2-body and 3-body conditions at elevated temperature. Tribol. Int. 2010, 43, 1234–1244. [Google Scholar] [CrossRef]
  31. Antonov, M.; Hussainova, I.; Pirso, J.; Volobueva, O. Assessment of mechanically mixed layer developed during high temperature erosion of cermets. Wear 2007, 263, 878–886. [Google Scholar] [CrossRef]
  32. Antonov, M.; Hussainova, I. Cermets surface transformation under erosive and abrasive wear. Tribol. Int. 2010, 43, 1566–1575. [Google Scholar] [CrossRef]
Figure 1. Breakdown of the main components and steps required to produce and estimate the economic feasibility of Fe–C–Cr manual arc-welded hardfacings.
Coatings 10 00294 g001
Figure 2. Scheme of the electrode with an indication of the lengths.
Coatings 10 00294 g002
Figure 3. Scheme of hardfacing and mechanical processing to prepare the sample (the cross-section of the sample is shown).
Coatings 10 00294 g003
Figure 4. Schematic of the devices used for testing samples under abrasive conditions: (a) according to ASTM G65 (1—rubber-rimmed steel wheel; 2—abrasive supply nozzle; 3—sample; 4—load; 5—quartz sand); (b) according to GOST 23.201-78 (1—samples; 2—erodent hopper; 3—rotor with channels; 4—electrical motor [25].
Coatings 10 00294 g004
Figure 5. Optical images of the characteristic samples sorted according to their hardness (provided along with the content of the main elements).
Coatings 10 00294 g005
Figure 6. Effect of chromium and carbon (a), chromium (b), and carbon (c) on the wear rate and hardness of hardfacings under low-stress abrasive conditions (the content of C/Cr is indicated, wt.%).
Coatings 10 00294 g006
Figure 7. Effect of chromium and carbon (a), chromium (b), and carbon (c) on the wear rate and hardness of hardfacings under average-stress abrasive conditions (the content of C/Cr is indicated, wt.%).
Coatings 10 00294 g007
Figure 8. Wear rates of Fe–C–Cr hardfacings during the erosive tests at the speeds of 30, 50, and 80 m·s−1.
Coatings 10 00294 g008
Figure 9. SEM images of the characteristic surfaces worn under low-, average-, and high-stress abrasive and erosive conditions.
Coatings 10 00294 g009
Figure 10. Wear and economic feasibility map for electrodes and resulting Fe–C–Cr manual arc-welded hardfacings.
Coatings 10 00294 g010
Table 1. Contents of graphite and ferrochrome in coverings of produced electrodes (dry powders). The contents (wt.%) of carbon and chromium in the produced hardfacings are also indicated (hardfacing code/C/Cr).
Ferrochrome, %
5.315.021.230.042.460.085.0
Graphite, %0.1647/2.95/33.2
1.0* 590/0.61/4.3
2.0591/0.87/4.4601/1.06/6.1611/1.44/9.6621/1.68/19.6631/2.68/25.1
5.0* 592/1.01/4.4* 602/1.33/5.6612/1.83/9.2622/1.98/15.8632/2.93/20.1
10.0* 593/1.62/4.7* 603/1.72/4.9613/2.19/8.3* 623/2.03/9.4* 633/2.93/19.5
20.0604/2.33/4.1614/2.56/7.0* 624/2.43/7.4
30.0565/2.75/1.3
* These electrodes were produced to track the effect of electrode composition on the resulting composition and hardness of the hardfacings, but they were not used for wear testing. The electrodes in bold were tested under abrasive wear conditions.
Table 2. The composition of the electrode covering, the technical parameters of electrode production, costs of electrodes, and its components (according to data from the company).
TitleUnitCode of Electrode
565591601604611612613614621622631632647
Composition of electrode covering (dry powders)
Ferrochrome%5.31521.221.23030303042.442.4606085
Graphite%30222025102025250.1
Ferromanganese%12121212121212121212121212
Cellulose%1111111111111
Slag materials%51.770.063.845.855.05247.03742.639.625.022.01.9
Total%100.0100.0100.0100.0100.0100.0100.0100.0100.0100.0100.0100.0100.0
Other technical parameters
Mass of one electrode (M)g37.7534.2533.7532.5034.6535.9535.3534.4536.5040.2041.0539.2047.50
Electrode covering wt. rate L with respect to M (see Equation (3))%73.056.253.947.958.264.461.557.267.084.788.879.9119.7
Cost of electrode components and electrodes per 1 kg of electrode
Wire€∙kg−10.360.400.400.420.390.380.380.390.370.340.330.350.29
Covering€∙kg−10.920.420.440.670.530.620.690.820.690.840.960.981.36
Production costs€∙kg−10.510.510.510.510.510.510.510.510.510.510.510.510.51
Total (S1 kg electrode)€∙kg−11.781.321.351.591.431.511.581.721.561.681.801.832.15
Italic bold—maximal value, italic—minimal value.
Table 3. Three-body abrasive wear test conditions.
ParameterDescription
SchemeBlock–on–Wheel
Contact stressLowAverage
Description of the wheel (Ø229 mm, width 12.7 mm)Rubber-rimmed steel wheel, with rubber of hardness Shore A-60Steel wheel with hardness 165 HB
AbrasiveSilica quartz sand with size 200–425 μm from SC Anykščių kvarcas; feed rate 250–300 g min−1
Circumferential velocity2.4 m s−1
Linear abrasion4320 m/30 min1440 m/10 min
Load130 N85 N
AtmosphereAir, 23 ± 2 °C, relative humidity 45 ± 5%
Table 4. Composition and hardness of deposited hardfacings. HRC, Rockwell hardness measurements, Scale C.
CodeChemical Composition of Hardfacing, %Hardness, HRC
CSiMnCrTi
5652.751.942.181.31.2548.3 ± 3.5
5910.870.571.384.40.0652.2 ± 2.2
6011.060.961.546.10.0940.2 ± 3.1
6042.331.621.554.10.4450.3 ± 3.9
6111.440.871.839.60.0929.6 ± 2.2
6121.830.932.089.20.1237.1 ± 2.9
6132.191.332.678.30.3343.0 ± 3.2
6142.561.442.467.01.0853.7 ± 3.4
6211.681.172.2619.60.1238.2 ± 2.9
6221.980.813.8815.60.3046.3 ± 3.4
6312.681.423.4527.80.1848.6 ± 3.3
6322.701.363.9620.10.3349.7 ± 3.8
6472.950.283.9233.20.0448.8 ± 2.9
Reference material: Hardox 400 steel. Chemical composition (%): C: 0.32; Si: 0.7; Mn: 1.6; Cr: 1.4; Mo: 0.6; Ni: 1.5; B: 0.004; P: 0.02; S: 0.01. Microstructure: fine-grained martensite.36.5 ± 2.5
Table 5. Technical and economic indicators for the assessment of hardfacings.
ParameterUnitCode of Electrode
565591601604611612613614621622631632647
η—deposition coefficient 0.500.570.590.600.610.600.600.610.640.620.680.690.79
Mass of electrode required to deposit 1 kg of hardfacingkg2.001.751.691.671.641.671.671.641.561.611.471.451.27
Hardfacing material cost (S 1kg Hardfacing material)€∙kg−13.562.312.282.652.342.522.632.822.442.712.642.652.72
Hardfacing productivity (P)kg∙h−10.300.310.320.310.340.350.340.340.370.400.450.430.60
Labor cost€∙kg−116.5616.0115.6916.0314.7814.4914.7314.8713.3816.5616.0115.6916.03
Cost of deposited hardfacing (S 1 kg Hardfacing) €∙kg−120.1218.3217.9818.6817.1317.0017.3717.6915.8215.2513.8414.2011.05
Cost of repair with Hardox 400 (S 1 kg Repair with Hardox 400)€∙kg−112.00
Wear intensity ratio ε (wear resistance of hardfacings; see Equation (7))
Low-stress abrasion8.050.960.891.760.861.102.467.771.042.491.181.752.53
Average-stress abrasion0.981.021.130.930.940.910.891.041.020.981.161.020.81
Average-stress erosion at 30 m s−12.382.432.582.262.291.752.611.762.072.862.582.202.94
High-stress erosion at 50 m s−11.601.571.661.491.641.541.741.061.501.871.681.591.78
High-stress erosion at 80 m s−11.371.421.491.331.351.301.391.321.321.531.521.381.58
Relative cost of hardfacings under different wear conditions taking into account the wear intensity ratio (see Equation (8))
Low-stress abrasion€∙kg−11.4912.5013.486.8213.9510.914.881.5411.544.8210.176.864.74
Average-stress abrasion€∙kg−112.2411.7610.6212.9012.7713.1913.5311.5411.7612.2410.3411.7614.81
Average-stress erosion at 30 m s–1€∙kg−15.044.944.655.315.246.864.606.825.804.204.655.454.08
High-stress erosion at 50 m s–1€∙kg−17.507.677.238.057.327.796.9011.328.006.427.147.556.74
High-stress erosion at 80 m s–1€∙kg−18.768.458.059.028.899.238.639.099.097.847.898.707.59
Relative cost of hardfacing K (%; see Equation (9))
Low-stress abrasion%12.4104.2112.356.8116.390.940.712.896.240.284.857.239.5
Average-stress abrasion%102.098.088.5107.5106.4109.9112.896.298.0102.086.298.0123.4
Average-stress erosion at 30 m s−1%42.041.238.844.343.757.238.356.848.335.038.845.434.0
High-stress erosion at 50 m s−1%62.563.960.367.161.064.957.594.366.753.559.562.956.2
High-stress erosion at 80 m s−1%73.070.467.175.274.176.971.975.875.865.365.872.563.3
Italic bold—maximal value, italic—minimal value.

