Article

Corrosion and Wear Behavior of PEO Coatings on D16T Aluminum Alloy with Different Concentrations of Graphene

1
School of New Energy and Materials, Southwest Petroleum University, Chengdu 610500, China
2
School of Materials Science and Engineering, Sichuan University, Chengdu 610065, China
3
Institute of Materials Research, Helmholtz Zentrum Geesthacht, Max-Planck-Str. 1, 21502 Geesthacht, Germany
*
Author to whom correspondence should be addressed.
Coatings 2020, 10(3), 249; https://doi.org/10.3390/coatings10030249
Submission received: 30 January 2020 / Revised: 29 February 2020 / Accepted: 4 March 2020 / Published: 8 March 2020

Abstract

:
The effect of added graphene concentration on the microstructure, phase composition, corrosion- and wear- resistance of plasma electrolyte oxidation (PEO) coatings formed on D16T aluminum alloy in silicate electrolyte with different concentrations of graphene were investigated. The results show that the morphologies of the coatings with graphene were obviously different ascribed to the mode of graphene incorporated into the coating. The coatings consisted of mainly α-Al2O3, γ-Al2O3, and Al, which were divided into an outer porous layer and a dense inner layer. The thickness of the coatings increased non-linearly with graphene concentration. The corrosion resistance of the coatings with graphene was significantly improved. The wear resistance of the coatings was also greatly improved apart from the coating with 3 g/L graphene. The coating produced in the electrolyte with 2 g/L graphene exhibited the optimal comprehensive properties because graphene successfully incorporated into the coating via the pores and spread on the surface of the coating.

1. Introduction

In recent years, with the increase in the number of exploration and development wells with complicated working environment, the conventional steel drill pipe cannot meet the drilling requirements for the horizontal and ultra-deep wells containing highly corrosive media. Some accidents frequently occurred, such as the friction crack of the drill pipe, hydrogen embrittlement, Stress Corrosion Cracking (SCC), and the overload of the hook, ascribing to the physical and chemical properties of the material. Therefore, aluminum alloys with high strength, low density, small bending stress, and good anti-corrosion to H2S and CO2 is a desirable material [1,2]. Nowadays, the D16T aluminum alloy is used in oil and gas drilling, but its disadvantages of low wear- and corrosion-resistance seriously restrict its extensive application [3,4], especially the corrosion from Cl. Therefore, for extending the lifetime of aluminum alloy and avoiding corrosion fracture failure of aluminum alloy drill pipes, it is necessary to enhance the corrosion resistance of the D16T aluminum alloy using suitable surface modification methods.
It is well known that plasma electrolytic oxidation (PEO) is a new and environmentally friendly surface technology to produce protective coatings on light metals, such as Al, Mg, Ti, and their alloys. Based on its practical and potential application in many fields, many scholars focus on PEO technology [5,6]. The microstructure, morphology, and comprehensive performances of PEO coatings are influenced by various process parameters such as the constituent and concentration of electrolytes, oxidation time, substrate, various electrical parameters, and additives [7,8]. The constituent and concentration of the additive play an important role in changing the structure, morphology, wear- and corrosion- resistance of the coatings among those factors. A large number of works about the PEO coatings incorporated particles or powders like TiO2 [9], ZrO2 [10], Fe micrograins [11], α-Al2O3 [8], and so on were performed. Zhao et al. [7] studied the effect of graphene oxide on the corrosion resistance of the PEO coating on AZ31 magnesium alloy, and reported that the incorporated graphene oxide markedly decreased micropores and improved the corrosion resistance of AZ31 magnesium alloy. Sarbishei et al. [12] reported that alumina nanoparticles incorporated into the PEO coatings formed on a titanium substrate, reducing the density of the coating and the pores’ size. The corrosion resistance was improved with the increase of the alumina concentration, and the coatings formed in the electrolyte with 10 g/L alumina nanoparticles showed the best properties. Fatimah [13] studied the structure and corrosion properties of the coatings formed on 6061 Al alloy through the dual incorporation of SiO2 and ZrO2 nanoparticles into the oxide layer and found the coatings with SiO2 and ZrO2 displaying the best corrosion resistance because they were used as micropores blocker and cracks filler. Yazdanl et al. [14] studied the tribological performance of graphene/carbon nanotube hybrid reinforced Al2O3, and it was determined that the coating with graphene nanoplatelets hybrid reinforced Al2O3 composites displayed the best wear resistance. Hvizdos et al. [15] studied the tribological properties of Si3N4-graphene nanocomposites, and Si3N4-graphene nanocomposites owned better wear resistance was also confirmed. Belmonte et al. [16] proposed a conclusion that graphene/composite displayed an excellent wear resistance and a small friction coefficient due to the lubricity of graphene, owing to the effect of graphene nanofillers on the tribological performance of ceramic coatings. Pezzato et al. [17] and Lv et al. [18] found graphite with nanometer structure tending to be absorbed on the surface of the coating and embedded into the pores.
As discussed above, some studies on the corrosion- and wear-resistance of the PEO coatings with graphene on magnesium and titanium alloys have been performed [19,20]. However, the study on aluminum alloys is lacking, especially for D16T aluminum alloys using as drill pipe. In this work, the PEO coatings were prepared on a D16T aluminum alloy in silicate electrolytes with different concentrations of graphene. Graphene was used as a lubricant for improving the corrosion- and wear-resistance of the coated samples. The effect of graphene concentration on the microstructure, phase composition, the thickness, corrosion- and wear-resistance was investigated. Furthermore, the mechanism of the corrosion- and wear-resistance is discussed.

2. Experimental Procedure
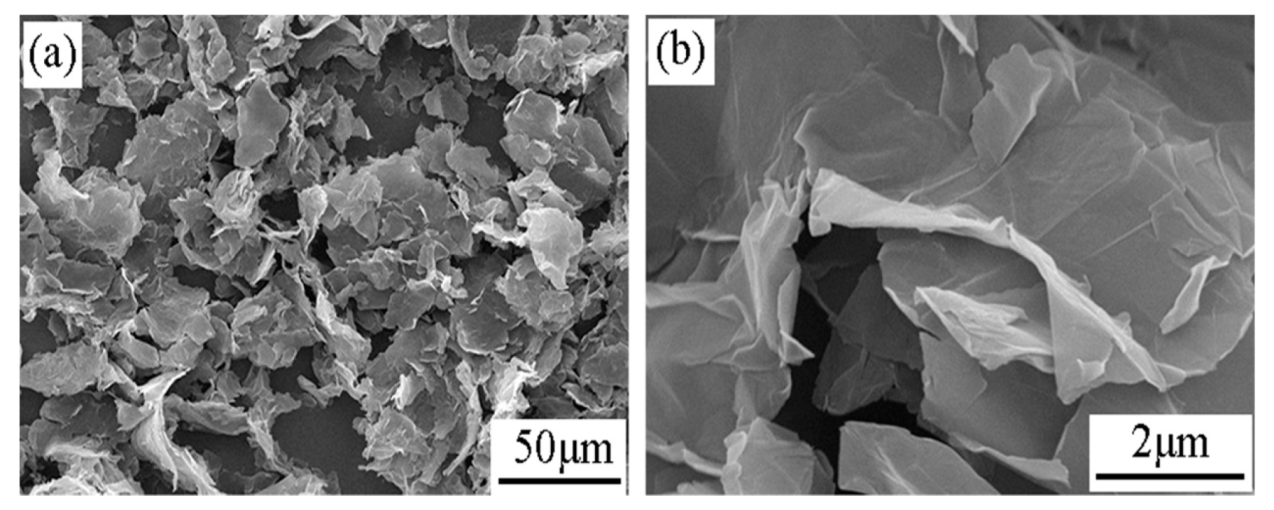
2.1. Materials

Extruded D16T aluminum alloy pipes with a thickness of 8 mm and a diameter of 114 mm provided by Tarim oilfield, China, was cut to specimens with a size of 15 mm × 15 mm × 4 mm. Its chemical composition is listed in Table 1. Before the PEO treatment, the samples were ground and polished with silicon carbide abrasive papers (up to mesh 1200), ultrasonically degreased in ethanol for 5 min, and then cleaned using distilled water and dried under warm air.

2.2. Preparation of the Coatings

The PEO treatments were carried out using a 10-KW DC pulse power supply for 10 min. The D16T aluminum alloy samples were connected to the anode, and a spiral stainless steel pipe was used as the counter electrode, as well as water cooling system. The alkaline silicate electrolytes were prepared using Na2SiO3 (12 g/L), NaOH (4 g/L), KF (2 g/L), glycerol (4 mL/L) and graphene with concentrations of 0 g/L, 1 g/L, 2 g/L, 3 g/L, 4 g/L and 5 g/L in distilled water, respectively. The specific electrolytes are shown in Table 2. The coated samples are denoted as G0, G1, G2, G3, G4, and G5. The SEM morphology of graphene is displayed in Figure 1. The temperature of the electrolyte was kept below 25 °C so as to avoid probable adverse influences on the PEO process and the formation of the coatings. In this PEO experiment, the electrical parameters were set as follows: voltage 500 V, frequency 100 Hz, current density 4 A/dm2, and the duty cycle 10%. After the PEO treatment, each coated sample was rinsed using distilled water and then dried under a flow of warm air.

2.3. Characterization of the Coatings

The thickness of the coatings was measured by a thickness gauge (Mini Test 2100, EPK, Cologne, Germany). Ten random points were measured on two surfaces of each sample. The average value of the thickness was calculated to represent the thickness of the coating. A scanning electron microscopy (TESCAN Vega 3 SB, TESCAN, Prague, Czech Republic) with an energy dispersive X-ray system (EDX, Oxford, London, UK) was used to analyze the microstructure, including surface and cross-sectional morphologies of the coatings, and the elemental compositions were also tested. Before the characterization of morphology, gold was sputtered on the surface and the cross-section of the coating, so as to prevent the specimen charging. The phase composition of the coatings was investigated using a Siemens diffractometer (Siemens, Munich, Germany) operating at 40 kV and 40 mA with Cu Kα radiation (wavelength λ = 1.5406 Å). The 2θ ranged from 10° to 80° using a scan rate of 0.02 °/min.

2.4. Electrochemical Studies of the Coatings

Electrochemical impedance spectroscopy (EIS) was performed using a scanning electrochemical microscope (CHI 900C, Chenhua Instrument Co., Ltd., Shanghai, China) in 3.5 wt.% NaCl solution at room temperature for evaluating the corrosion resistance of the coatings. The measurements were carried out in a three-electrode cell comprised out of an Ag/AgCl Saturated KCl) reference electrode, a platinum counter-electrode, and the coated samples as the working electrode. The surface area of the sample exposed to the corrosion solution was 1 cm2. EIS was performed at open circuit potential (OCP) with AC amplitude of 10 mV RMS sinusoidal perturbations in the frequency range from 100 kHz to 0.01 Hz after the immersion time of 2 h. The EIS data were fitted using the Zsimpwin 3.30d software and an appropriate equivalent circuit (EC). Based on the change in the impedance spectra, the possible corrosion mechanism of the coatings can be revealed.

2.5. Weight Loss Measurements

In the weight-loss method, corrosion specimens were weighed by a high-accuracy balance (accuracy of ± 0.1 mg) before and after immersion in the 3.5 wt.% NaCl solution under the temperature of 70 °C for 48 h, and three parallel samples per group. The calculated average weight loss of three parallel samples was regarded as the weight loss of each group sample.

2.6. Wear Studies of the Coatings

The wear resistance of the coatings was evaluated by a Tribotec ball-on-disc oscillating tribometer (Sernuo Machinery Equipment Co., Ltd., Ji’nan, China). An AISI 52100 steel ball with a diameter of 6 mm was used as the friction pairs. The wear load of 5 N was chosen, with an oscillating amplitude of 10 mm, and a sliding speed was 5 mm/s. The total sliding distance was 12 m. For revealing the dominant wear mechanism, the worn surfaces and wear debris were observed by SEM, and the distribution of the elements of the debris in the wear track was tested by EDX.

3. Results and Discussion

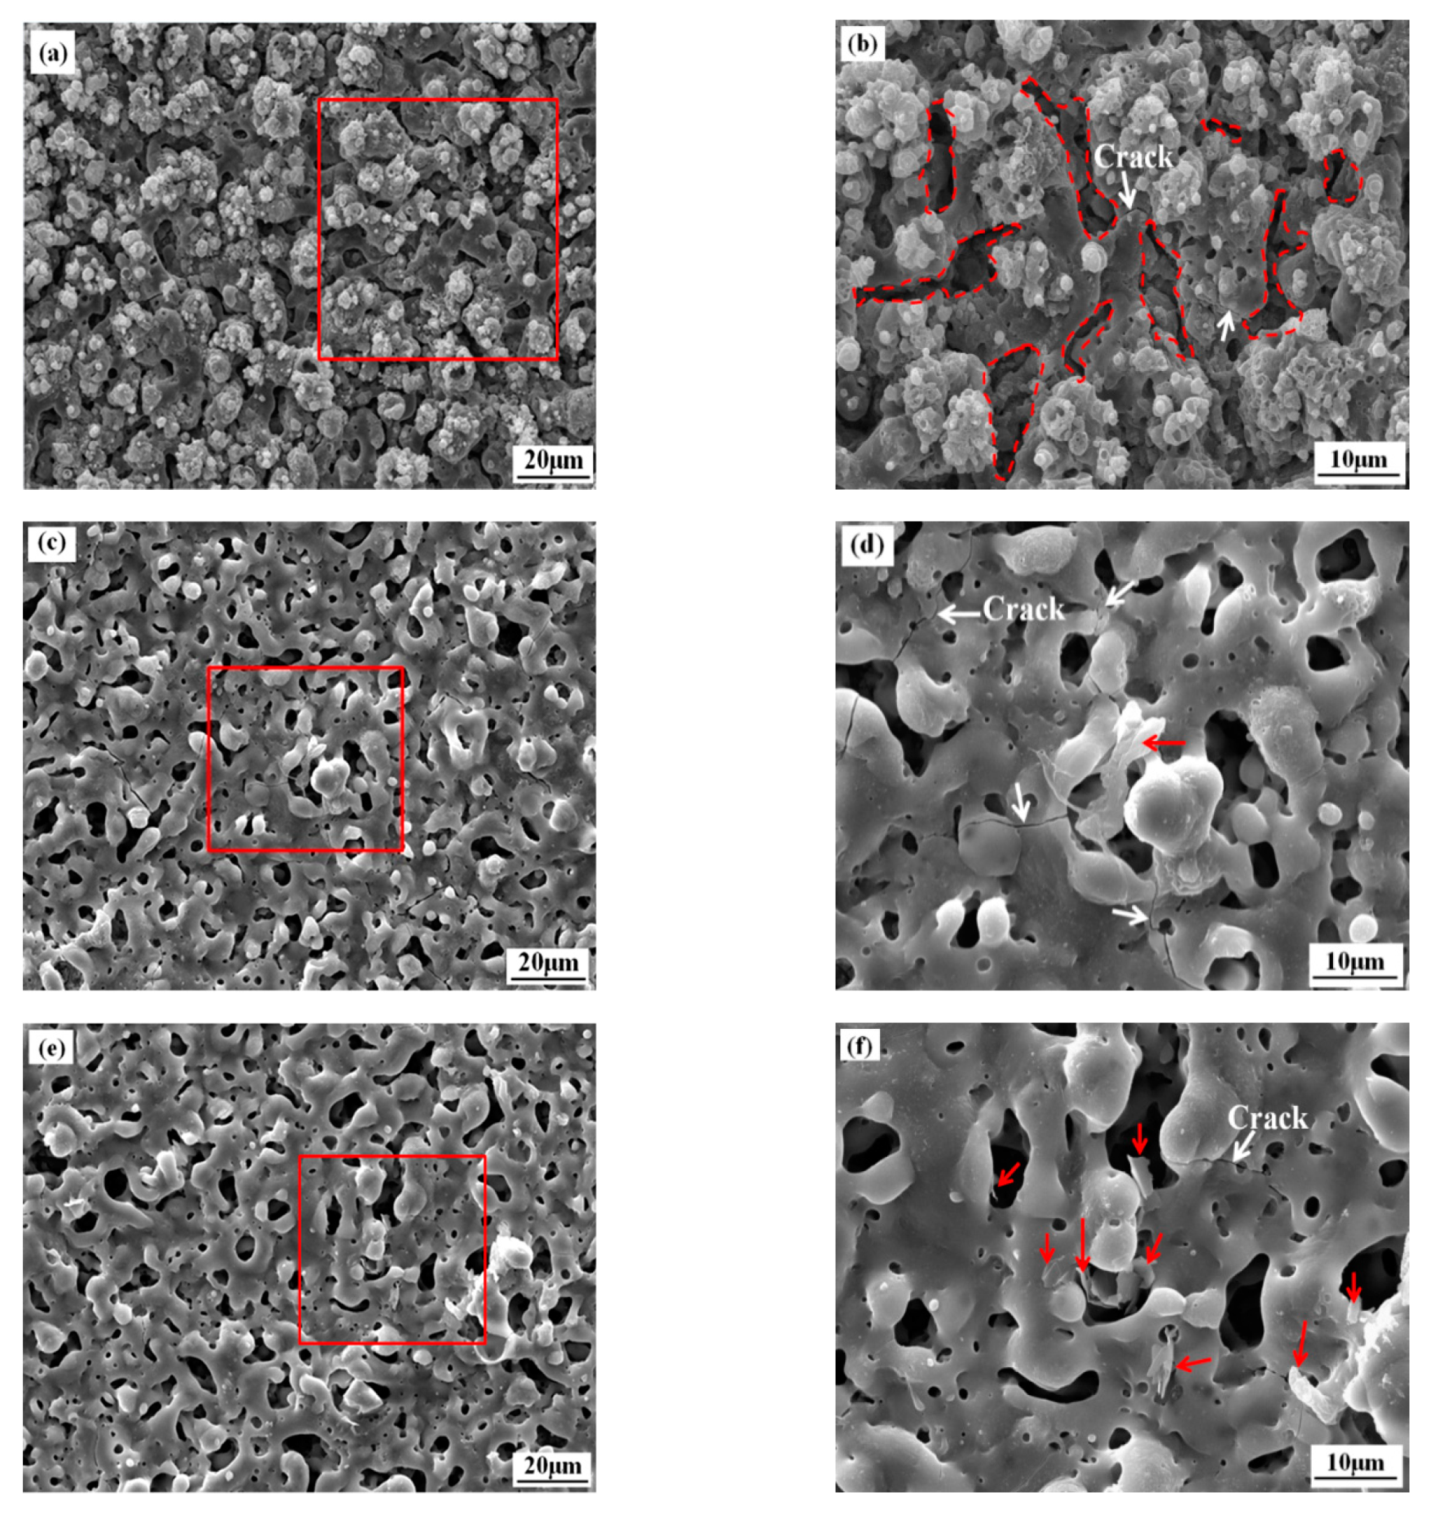
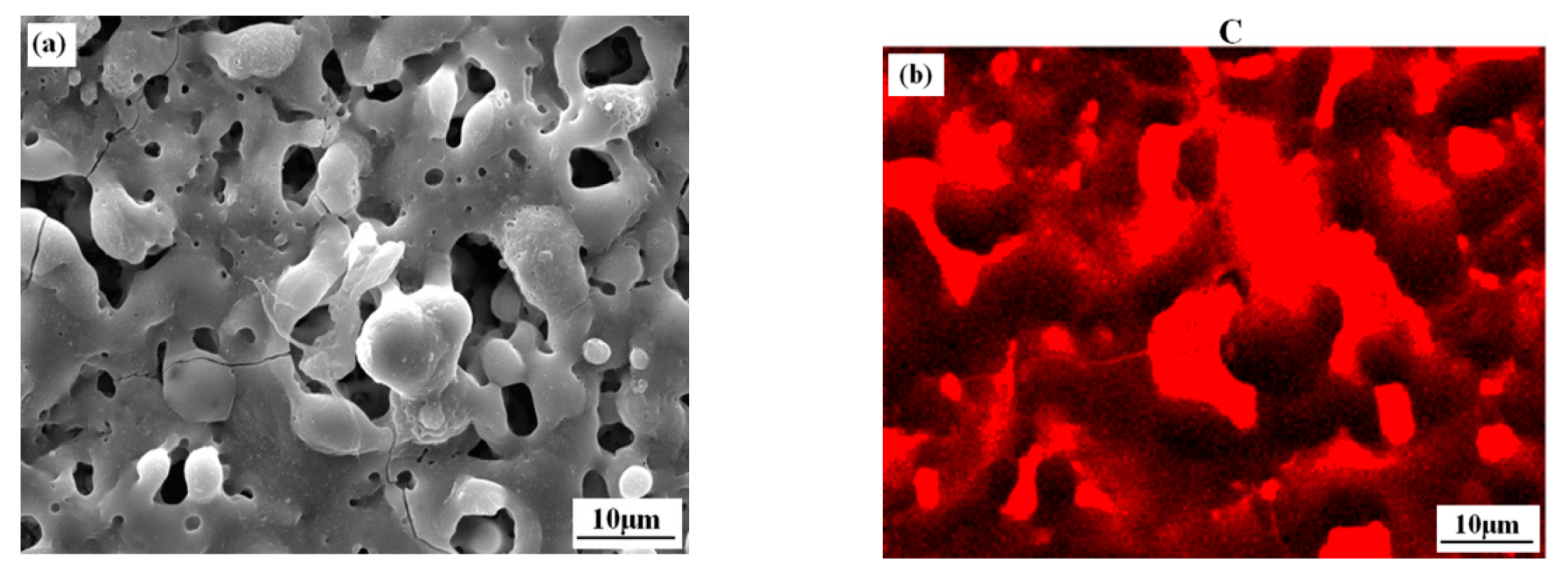
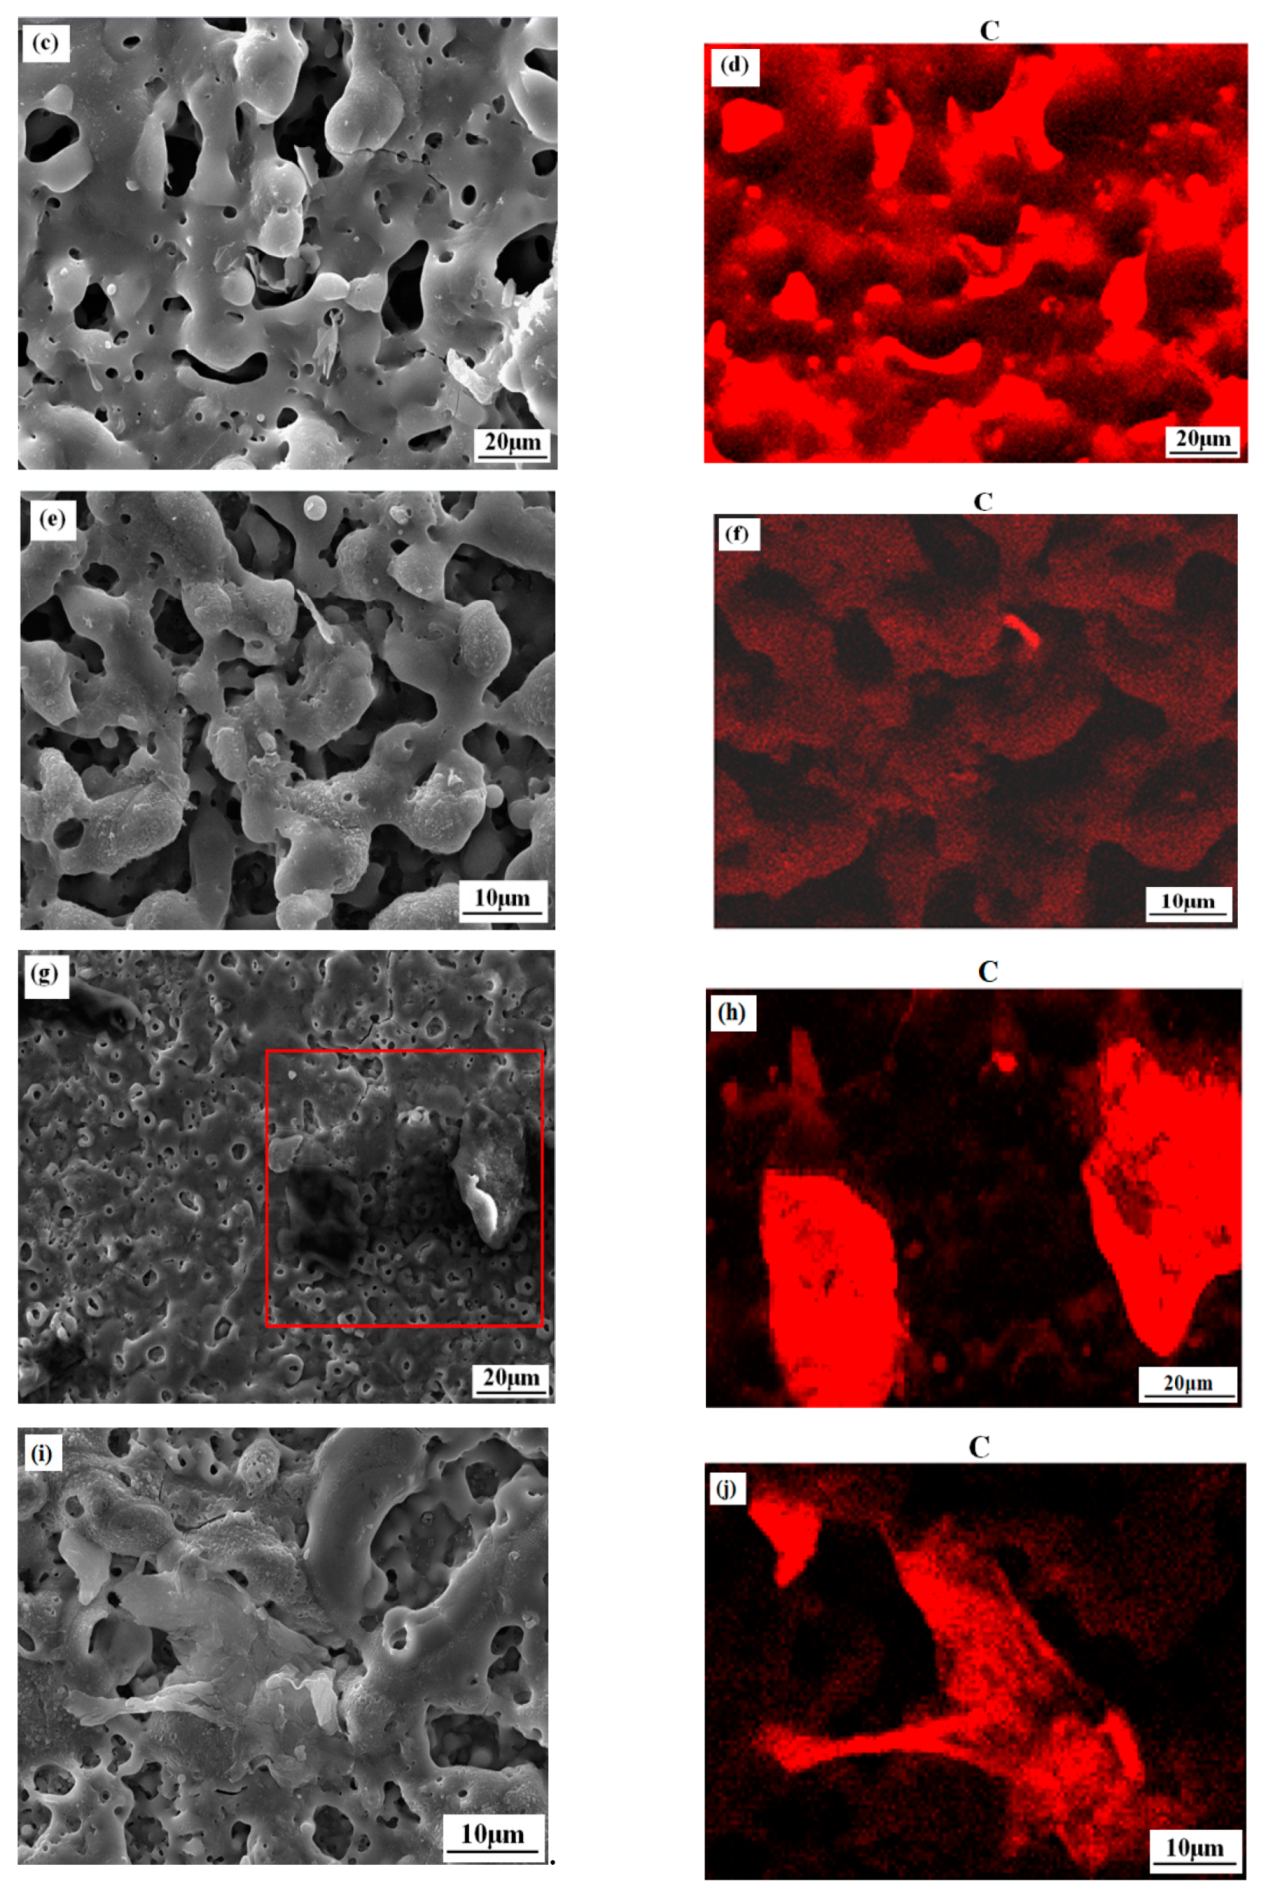
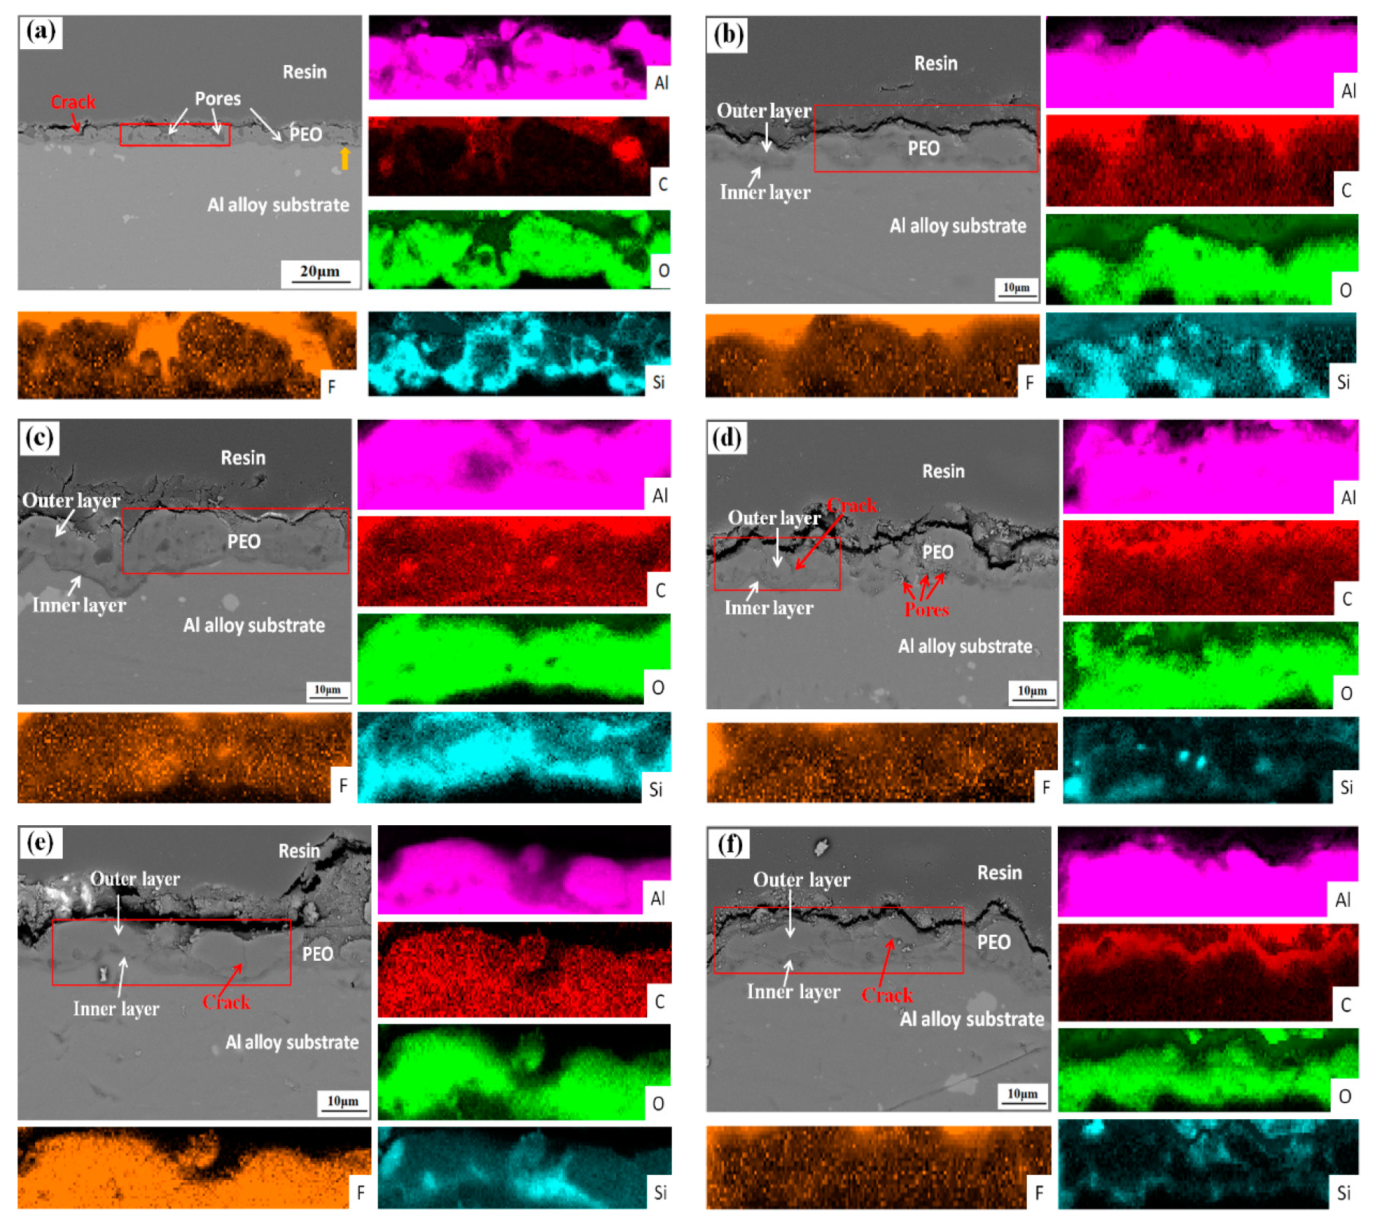
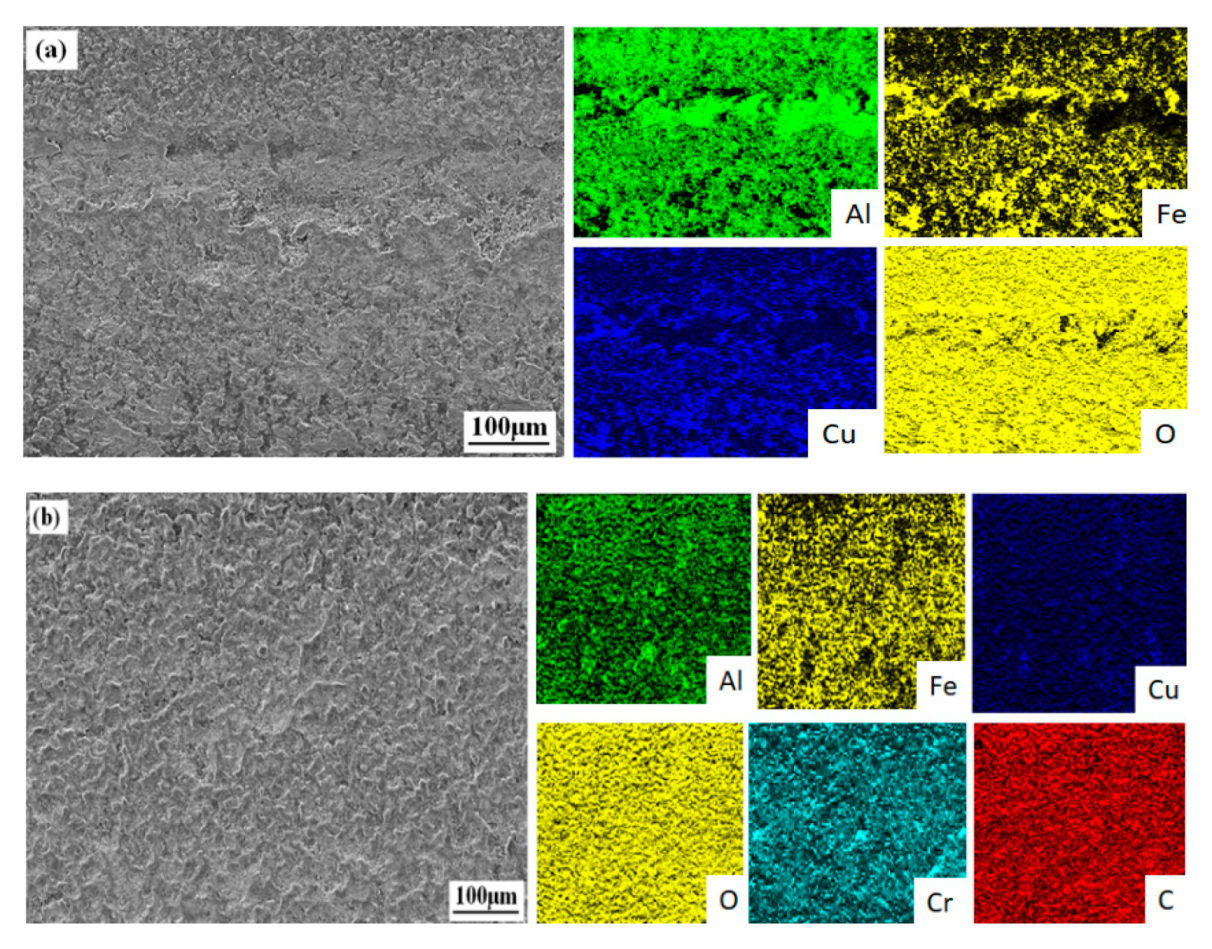
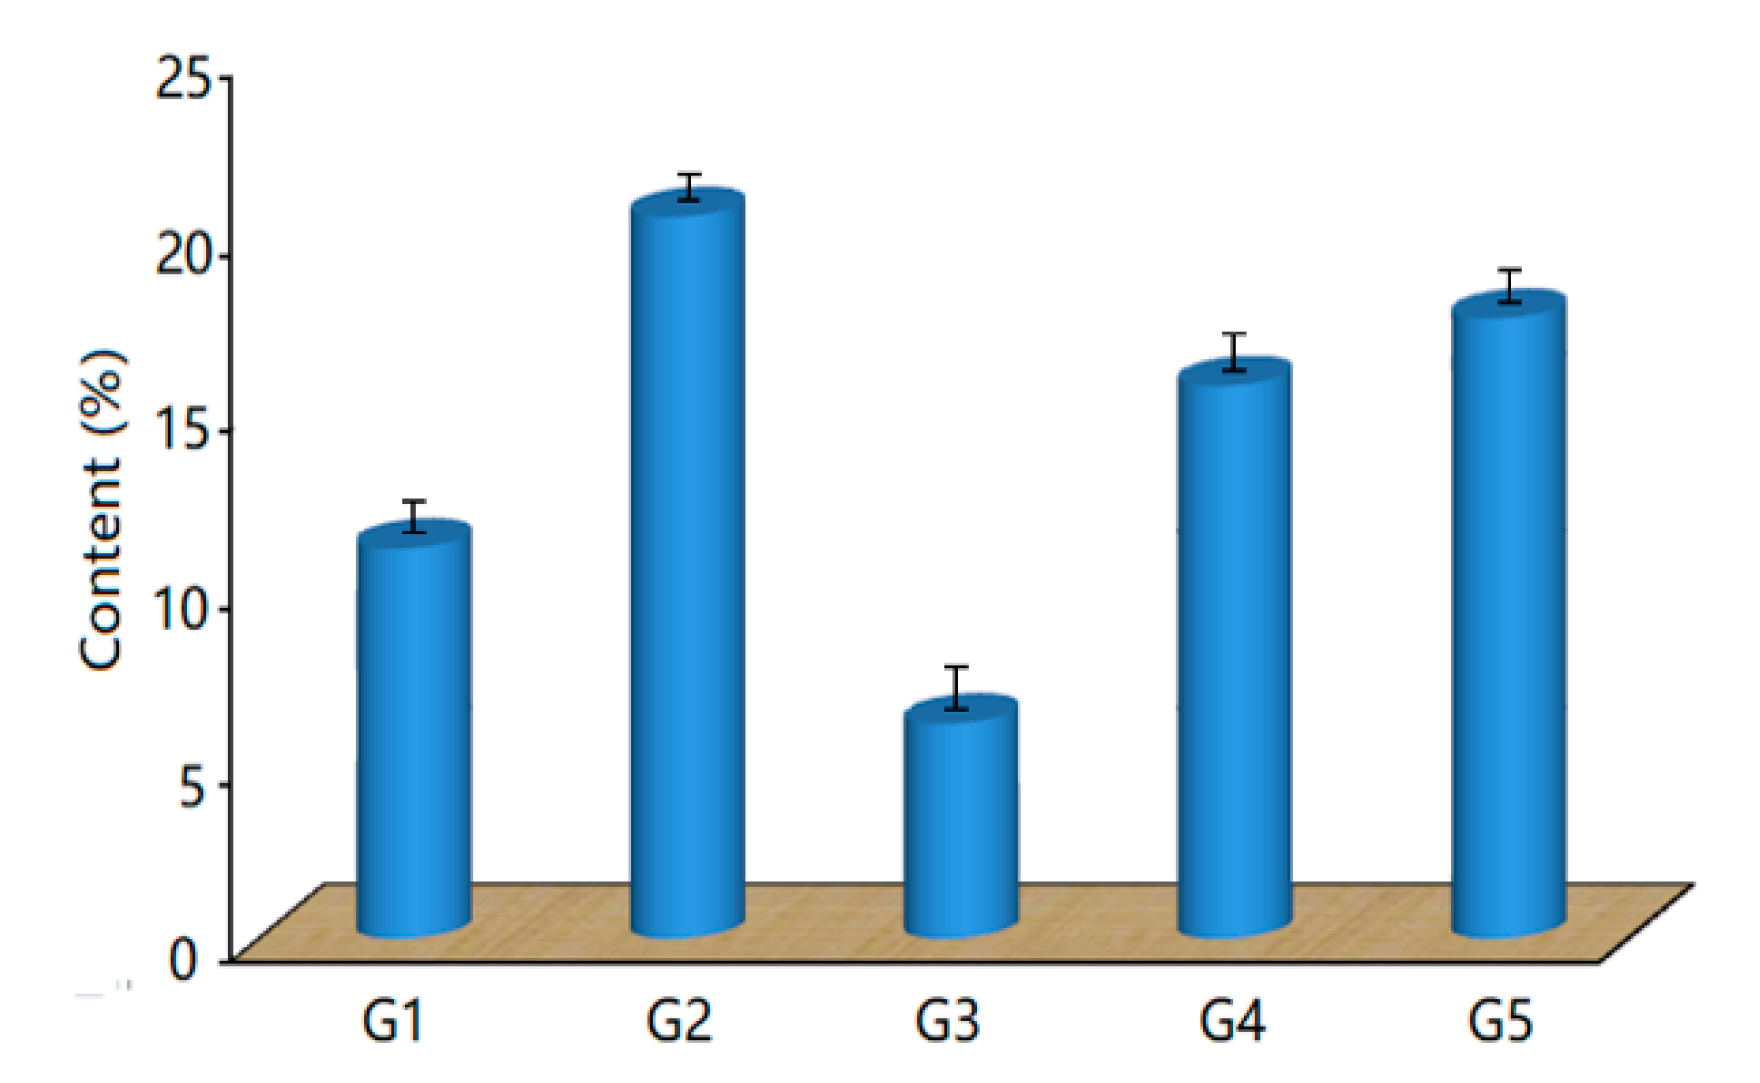
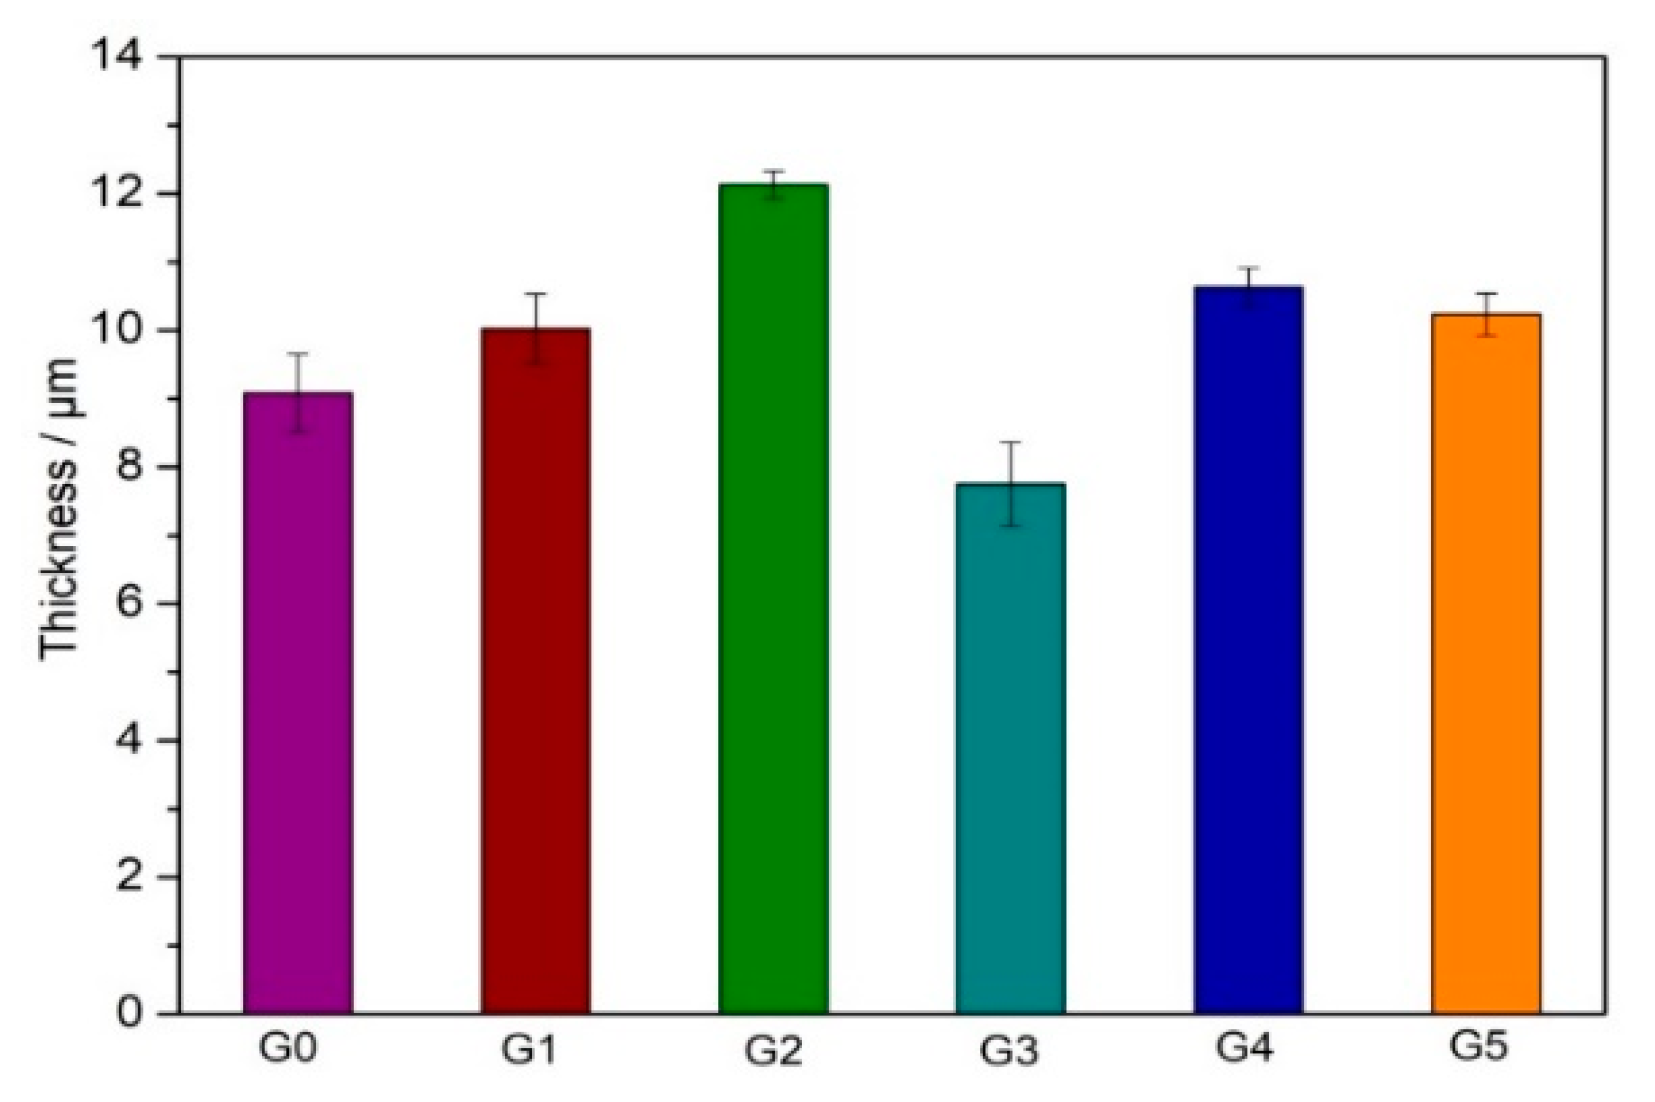
3.1. Microstructure and Composition of the Coatings

The surface morphologies of the coatings are shown in Figure 2. It can be clearly seen that the coatings owned relatively high porosity and cracks (indicated by the white arrows). The coating without graphene G0 presented many cluster bumps like islands (Figure 2a,b). According to the research results of Lu [21], the pores’ formation was ascribed to the molten oxide and gas bubbles ejecting out of the discharge channels, and the discharges preferentially produced at relatively thin or defective locations. When the molten oxide cooled down below 25 °C, the rest discharge channels got small and were occupied by many nodules [22]. The described phenomenon above repetitively appeared, and concentrated sintering on the surface of the coatings was corresponding to the formation of the porous and uneven coatings. From Figure 2a,b, it can be seen that a height difference between the bumps and the flat areas is obvious, resulting in the surface is rather uneven. So many pores with various sizes and shapes formed on the surface (shown in the region trapped by the red dotted line in Figure 2b). The pores expanded with the continuous breakdown of the defect areas in the PEO process. Finally, the size of the pores was relatively large, and the average pore’s size is about 10.06 μm. When different concentrations of graphene additives were added into the electrolyte, the microscopic appearance of the surface was still composed of craters and accumulated bumps, but the pores’ diameter significantly decreases except for G3 with the average pore’s size is about 12.3 μm. The pores’ size of G2 (3.02 μm) and G4 (2.51 μm) is smaller than that of other coatings, and the surface becomes relatively flat (illustrated from Figure 2c–j). Especially, G4 shows smoother and flatter compared to others (Figure 2i,j). That is attributed to some pores and cracks that were blocked, filled, and covered by graphene (shown in the red arrows in Figure 2d,f,h,l) and the area of the red dotted line frame in Figure 2i). Combined with Figure 1, what the red arrows point to, and what the red dotted line frame shows are graphene. In summary, the pores widely reduce with the increase of the graphene concentration. The porosity of G2 is less than that of G1. That is because more graphene incorporated into G2 (Figure 2f) and less graphene implanted in G1 (Figure 2d). Some of the incorporated graphene filled the pores and some covered the cracks on the surface of the coating. With the graphene concentration increasing to 3 g/L, the pores’ size gets larger due to less graphene embedded into the coating. Graphene with smaller sizes incorporated into the coating due to graphene collision with each other under the stirring condition in the PEO process. Some graphene with large sizes fell off due to the collision. Only the smaller graphene is prone to incorporate into the coating. However, as the graphene concentration increased to 4 g/L and 5 g/L, lots of graphene reunited into pancakes and spread on the surface of the coatings during the collision process (Figure 2e,j). It is well known that the free movement of the non-bonding p electrons which consist of each carbon atom in graphene, endowing the prominent electrical conductivity of graphene. According to references [23,24,25], the breakdown voltage of the coating with graphene is higher than that of the coating without graphene. That causes the thickness of the coating with graphene to be greater than that of the coating without graphene. Graphene absorbing free electrons enters to the discharge channel with the electrolyte, not only increasing the resistance of the molten oxide from the micro-pores, but also promoting the nucleation of molten oxides, so some closed and semi-closed micro-pores formed on the area with graphene.
Figure 3 and Figure 4 are the EDS mapping and the C content of the coatings. From Figure 4, it is obvious that the C content of G2 is the maximum, and that of G3 is the lowest. That indicates the graphene incorporated in the coating is not linearly proportional to the graphene concentration. The graphene content increased with the increase of the added graphene concentration, such as G3, G4, and G5. Moreover, Figure 3 clearly displays the C element distribution. The C distribution of G2 is the most uniform and obvious, while that of G3 is the least and weakest, and the C element of G4 and G5 mainly distributes in the form of cluster graphene. Based on the analysis, the conclusion can be drawn that the C content of clearly visible graphene is high.
Figure 5 shows the thickness of the coatings. The thickness of G2 is the largest because lots of graphene incorporated into the coatings and increased the t and increased the thickness of the coating. However, the thickness of G3 is only 7.75 μm ± 0.61 μm. The reason that its thickness decreases is less graphene incorporated in the coating G3 due to mutual collision of graphene. Moreover, the inhibiting action from the graphene collision emerged in the PEO process of Al anodic dissolution. The smaller graphene located in the vicinity of the micro-discharge would be extruded. References [26,27] also discussed this similar mechanism.
Cross-sectional SEM images of the coatings are presented in Figure 6. According to previous studies [28], the cross-section of the coatings is divided into two parts, i.e., a loose superficial layer and a dense inner layer. So, the coatings in Figure 6 are comprised of the outer layer and inner layer, besides the boundary of G0 between the two parts which is indistinctive (shown with the white arrows in Figure 6a). Cross-sectional SEM graphs indicate good bonding at the interface between the substrate and the coatings with graphene, while the crevice distributes on the boundary of G0 (shown the yellow arrow). Meanwhile, the coating gets thicker and denser due to graphene incorporation. The cross-section of G1 and G2 is flatter and smoother than that of others. The thickness of G2 is the largest and that is in agreement with the measurement value by the microprocessor coating thickness gauge (Figure 5). The cracks can be found in G0, G3, G4, and G5 (shown the red arrows in Figure 6). Only G1 and G2 with fewer pores and cracks are dense and compact, which is consistent with the surface morphologies. Certainly, Figure 6 also demonstrated that graphene distributed on the cross-section of the coatings. The C content of G2 is evidently more than that of other coatings, indicating more graphene embedded in the coating and participated in the oxidation reactions. The content of these elements such as Al, C, O, and Si of G2 is obviously more than that of other coatings. While F content of G4 is the largest, indicating F contributes to the density and smoothness of the coating, combined with the surface morphology of G4, in accordance with Reference [29]. Combining Figure 3 with Figure 6, it can be concluded that the C element enrichment areas are on the surface and interior of the coatings. That is because molten oxides ejected from the discharge channel and solidified rapidly under the cold quenching of the electrolyte, and then incorporated graphene absorbing on the surface of the coating. Meanwhile, graphene shows the electron attracting due to the electron in cooperation and moves to the interior of the discharge channel with the electrolyte, assembled at the bottom of the channel, and then formed the local rich C area [30].

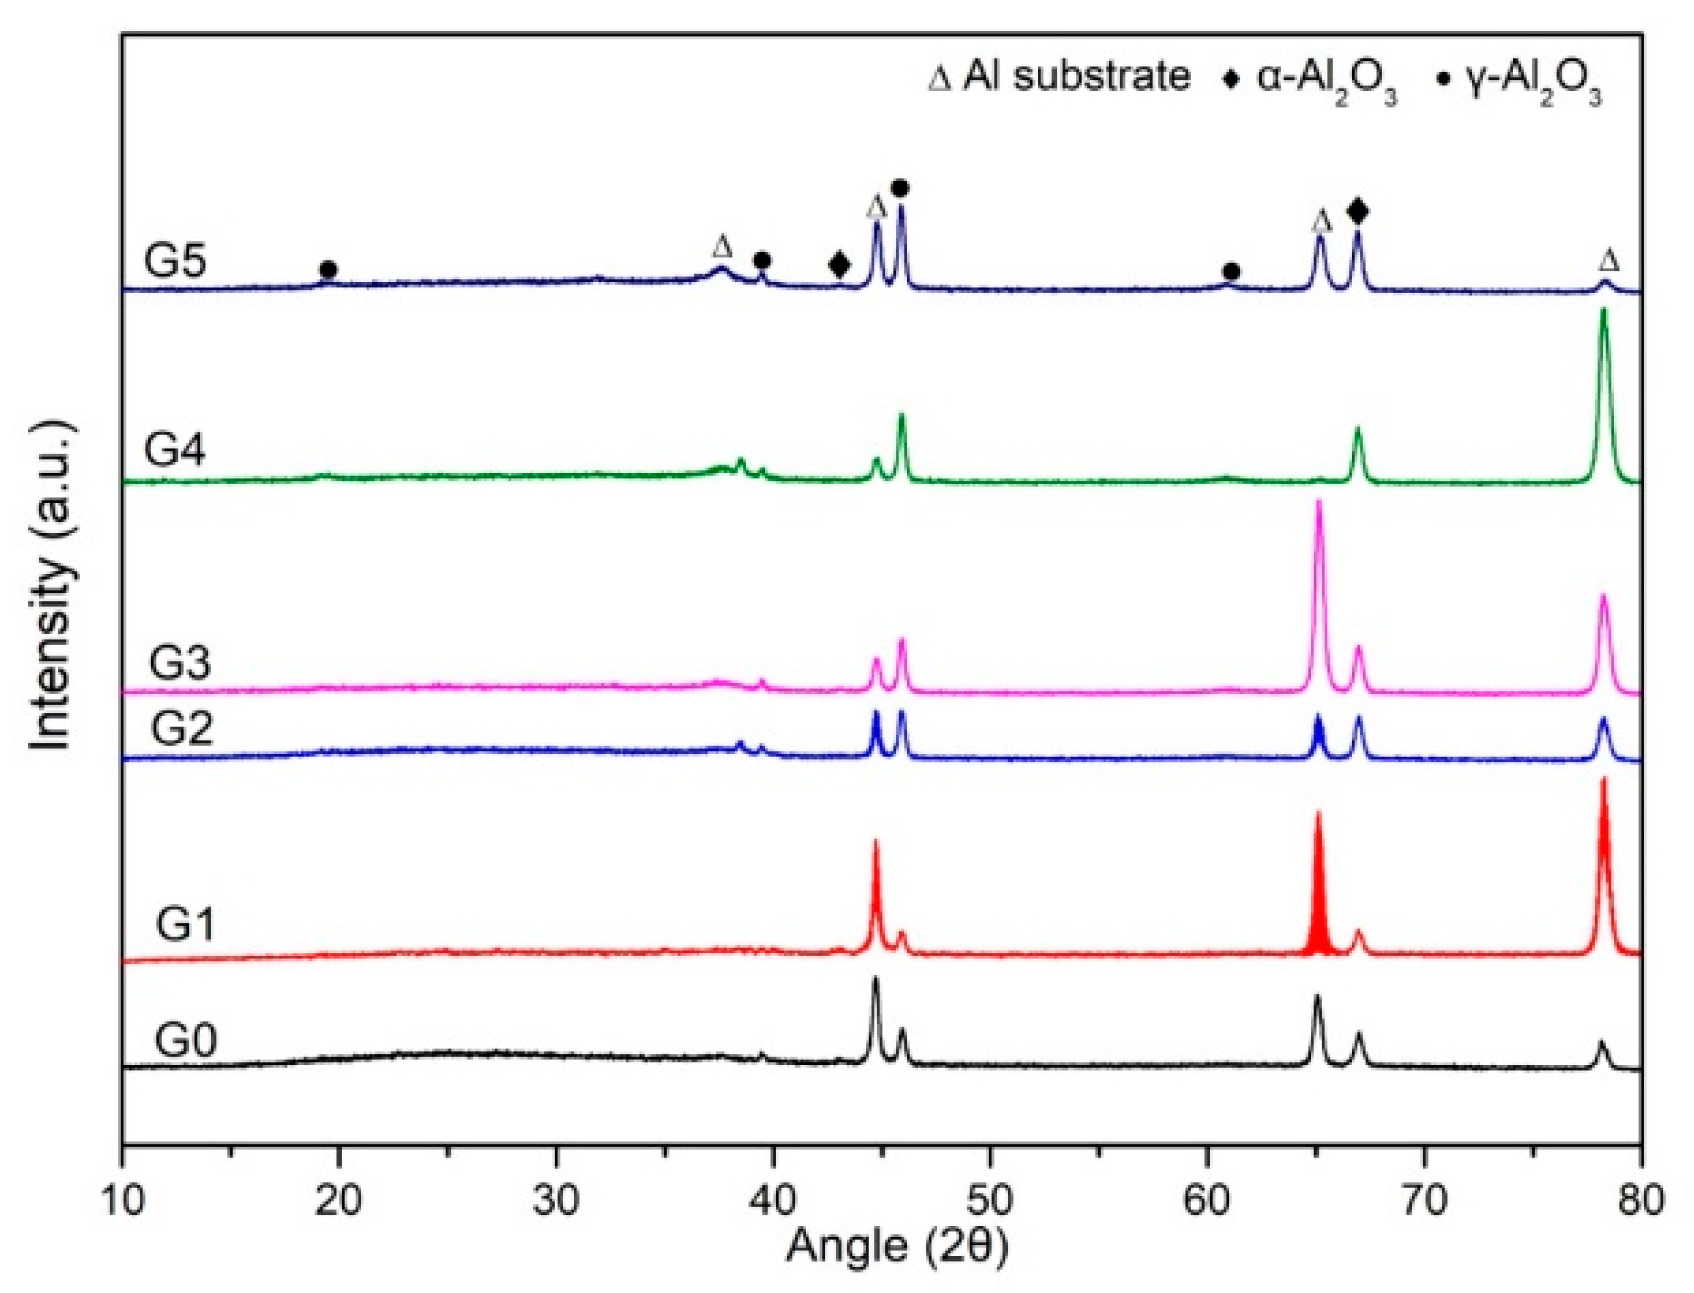
3.2. Phase Composition of the Coatings

XRD patterns of the coatings are shown in Figure 7. The result indicates that the main constituents of the coatings are α-Al2O3, γ-Al2O3, and Al. The main peaks of α-Al2O3 and γ-Al2O3 come from the coatings, and the peaks corresponding to Al substrate are found due to X-rays penetration into Al substrate. Al2O3 formation with high hardness is an important factor that guarantees the coatings to own favorable wear resistance [31]. The result shows that the phase composition of the coatings does not contain C peaks, which is consistent with previous works [18,32]. The probable reason is a small amount of graphene incorporated in the coatings [33]. It is well known that when the oxides spray out from the discharge channel in the PEO process, they promptly contact to the electrolyte of the temperature below 25 °C and solidify due to the rapid cooling rate. Hence, that results in the homogeneous nucleation when the liquid curdles under the rapid cooling condition, and then forms γ-Al2O3. However, the reaction temperature rises with the PEO process due to the low thermal conductivity of Al2O3. The metastable γ-Al2O3 transforms into more stable α-Al2O3. The reactions can be clarified by the following formulas [34]:
Al Al 3 + + 3 e ,
2 O 2 O 2 + 4 e ,
2 Al 3 + + 3 O 2 Rapid   cooling γ Al 2 O 3
2 Al 3 + + 3 O 2 Slow   cooling α Al 2 O 3
γ Al 2 O 3 800 1200 α Al 2 O 3

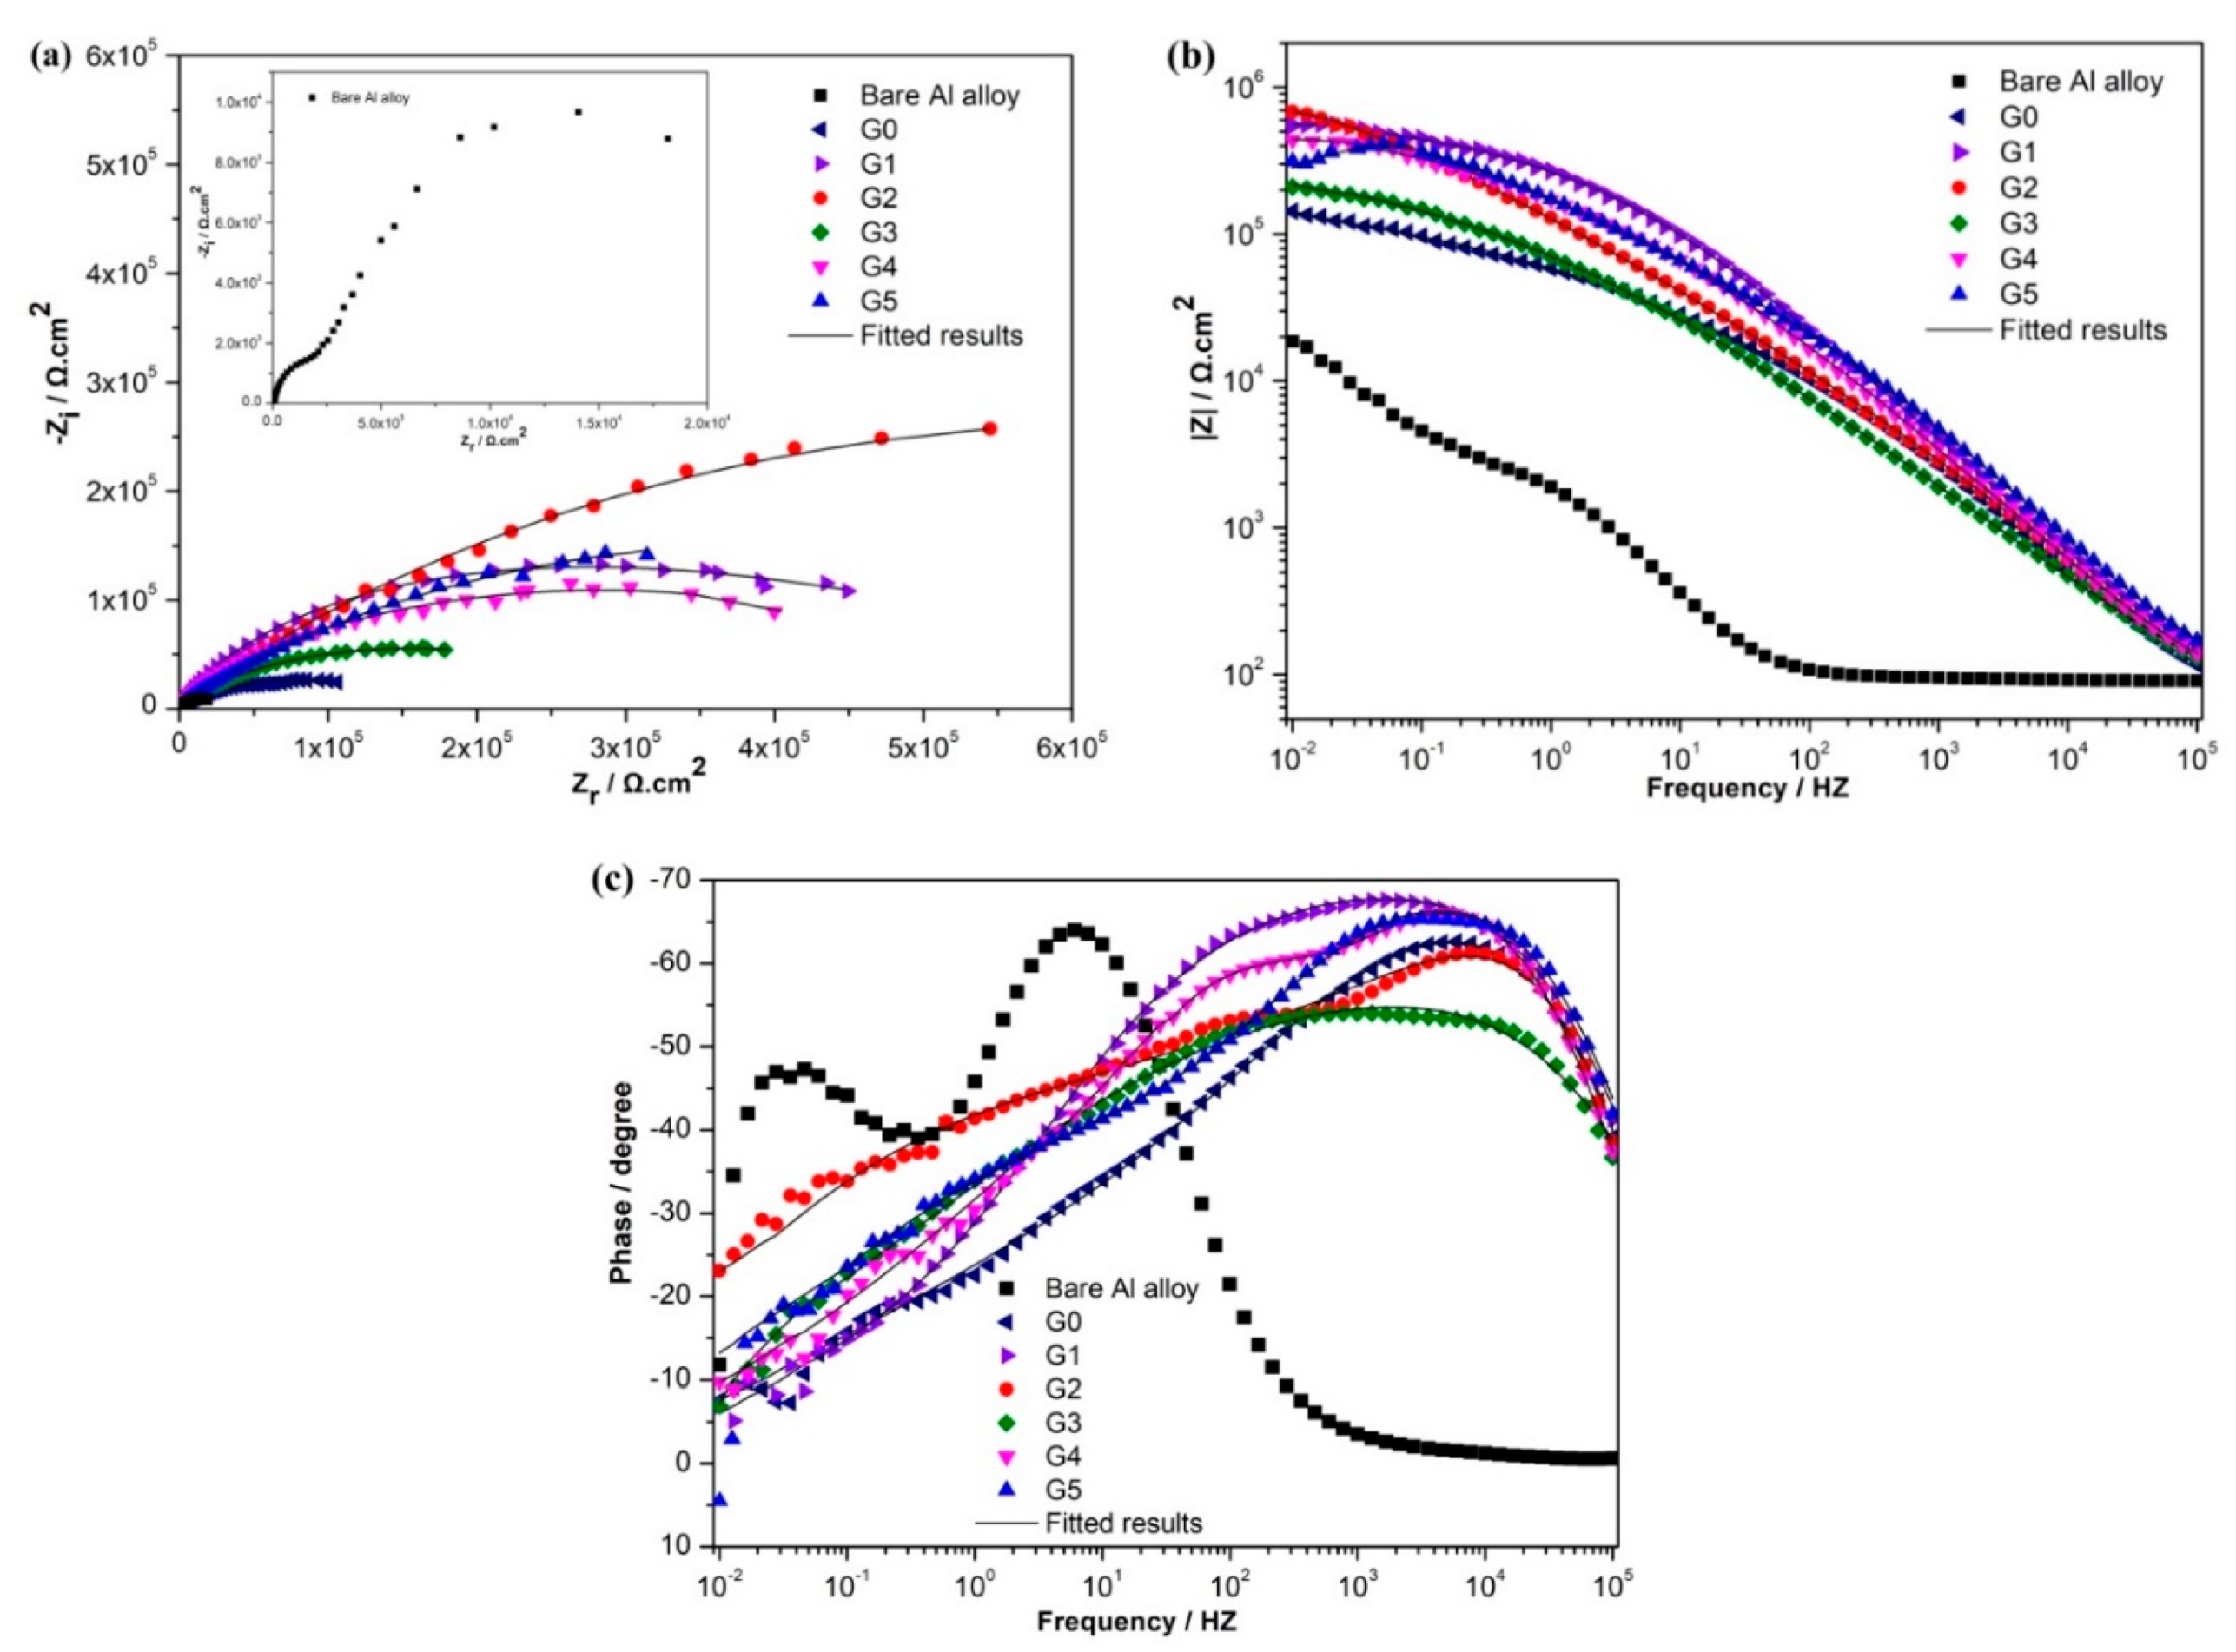
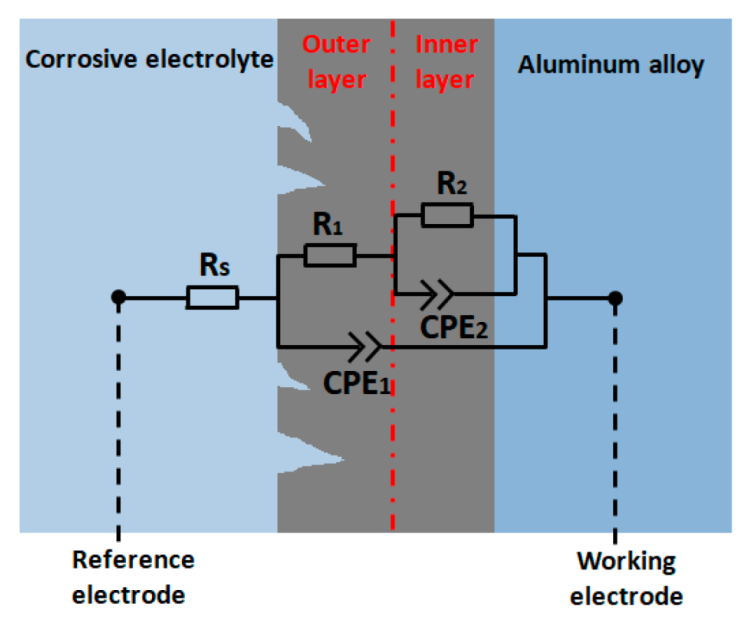
3.3. Electrochemical Behavior of the Coatings

EIS tests were performed to investigate the corrosion behavior of the coatings without and with graphene addition. Nyquist plots represent the real component of the impedance versus the imaginary component of the impedance on a linear relation. EIS (Nyquist plots and Bode plots) spectra of G0, G1, G2, G3, G4, and G5 are presented in Figure 8. The impedance semicircle of the coatings with graphene obviously enlarges, especially for G2. Only the change of G3 is not remarkable compared to G0. The larger diameter of Nyquist plots indicates higher Zr (the real impedance). That means the coating owns more capacitance and owns better corrosion resistance [24]. The larger capacitive loop of the Nyquist plot is associated with the corrosion resistance. Larger the loop is, higher the corrosion resistance is. Meanwhile, the impedance is also higher, as evident by the Bode modulus plot. The size of the loop appreciably increases with the graphene content up to 2 g/L. The magnitude of absolute impedance also shifts towards higher values, ascribing to the formation of a barrier film on the surface of the alloy, which resists the corrosion. A comparison of the data in Table 3 shows that the corrosion resistance (R1 and R2) of the coating layers also increased in the same order. The curve of the bare Al alloy can only be seen and is barely visible. That shows the corrosion resistance of the coating is greatly improved due to the addition of graphene. However, the corrosion resistance of the coatings does not always keep remarkably increase with the increase of graphene concentration. The corrosion resistance of G2 is the best because its microstructure is flatter and compacter compared with other coatings. Bode plots were also chosen in this work as the representation of the corrosion resistance. It can be concluded that the corrosion resistance of the coatings with graphene is an order of magnitude greater than that of the bare Al alloy (Figure 8b,c). As previously observed [34,35], EIS spectra displayed two-time constants representing the double layer. The high-frequency time constant of the constant phase element was associated with the outer layer, and the second low-frequency time constant of constant phase elements was associated with the inner layer.
Figure 9 shows the electrical equivalent circuits (EEC) for the fitting of the Nyquist curves. EEC consists of the solution resistance (Rs) between the working electrode and the reference electrode, and two-time constant phase elements (CPE) of the coatings. R1 represents the outer layer in parallel with CPE1, and R2, in parallel with CPE2 presents the inner layer resistance. The fitted results of the Nyquist plots based on EEC are shown in Figure 8. The experimental data and iterated results are perfectly fitted. The corresponding values of the equivalent circuit parameters are shown in Table 3. The corrosion resistance of the coatings with graphene is obviously improved. Moreover, R2 is much higher than R1. The resistance of G2 increases most obviously. The R1, R2 values of G1, G2, G3, G4, and G5 are higher than those of G0, which is ascribed to the denser, compacter, and less porous inner layer (Figure 6). Since the value of n1 and n2 is relevant to the coating/substrate interface morphology, the higher n1, n2 values of G1, G2, G3, G4, and G5 indicate the interface is flatter and smoother compared to G0, ascribing to the addition of graphene. But G3 is only slightly higher than G0, due to the porous and cracked structure. The value of CPE-Y reflects the dielectric behavior of the interface between the electrolyte and the coatings. So CPE-Y1 and CPE-Y2 of G0 are higher than those of the coatings with graphene, respectively. These observations can be explained by the microstructure illustrated in Figure 2, Figure 3, and Figure 6. The corrosion resistance increases with the increase of graphene concentration. However, the corrosion resistance rapidly decreases when the graphene concentration is 3 g/L. That is because more graphene collided with each other and fell into the electrolyte, and they did not incorporate in the coating. Only a few smaller nanosheets incorporated in the coating. With the graphene concentration increasing, the large size graphene reunited each other and formed big pie shape due to the strong van der Waals forces and π–π bonding [36], and then covered on the surface of the coating (Figure 2 and Figure 3).
The mechanism that graphene improved the corrosion resistance of the coating can be explained as follows (Figure 10): (1) the permeation path of the corrosive ions become more tortuous due to the prohibition of graphene with the ultra-dense network carbon atoms; (2) It is also used as inhibitor for protecting metals from contacting the corrosive media for a long time; (3) The graphene with the physical separation successfully embeds in the coatings and fills the pores and cracks, and reduces the flee pathway of corrosive medium. (4) Graphene additive flees into the plasma channel accompanied by the electrolyte under the double action of spread and diffusion [37]. With the rapid decrease of the temperature, graphene exists in the discharge channel in the form of the particle and lies in the coating, as the second phase impurity particles. That not only intensifies the strength of the coating, but also displays obvious infiltration effect from the penetration of the corrosion medium ions. That significantly improves the corrosion resistance of the coatings. As is known to all, because many pores and cracks distribute in the coating G0, some corrosive particles directly enter to the interface of the inner layer and the substrate. Cl and OH with negative charge react with the cationic Al3+ from the substrate. Subsequently, the Al alloy is rapidly corroded (Figure 10a). However, the functionalized graphene with physical separation successfully incorporated in the coatings due to graphene with strong van der Waals forces and π–π stacking in the formation process of the coating [36,38]. The incorporation mainly includes two types—Graphene with smaller size embedded in the pores and cracks of the coating (Figure 10b). Graphene with big size agglomerates with each other and then spreads on the surface of the coating, but only a small amount of graphene with small a size implanted into the coating (Figure 10c). Graphene with a suitable concentration of 2 g/L was added into the electrolyte, more graphene with small size can be easily, successfully and homogeneously incorporated in the coating. As a result, the corrosive path was blocked and effectively prevented the Cl penetration. With the increase in the graphene concentration, some agglomerated graphene, called the graphene rich region, form and spread on the surface. They hinder more graphene with smaller sizes to enter the coating and the number of incorporated graphene with small sizes significantly decreases. Although agglomerate graphene can prohibit the Cl corrosion, other larger areas are easy to be corroded. Figure 10d displayed the corrosive particles in the electrolyte occurred collision and bounced back when they fled to the substrate and contacted graphene (as the blue arrows mark in Figure 10b,c). Graphene acted as an excellent inhibitor in prohibiting the penetration of aggressive corrosive particles and increasing the tortuosity of the corrosive particles diffusion pathway [39,40]. So, it owns the cathodic protection function against the substrate being corroded. In summary, the corrosion resistance of the coating with graphene is much better than that of G0, especially for G2. Furthermore, the incorporated mode of graphene has a great effect on corrosion resistance.

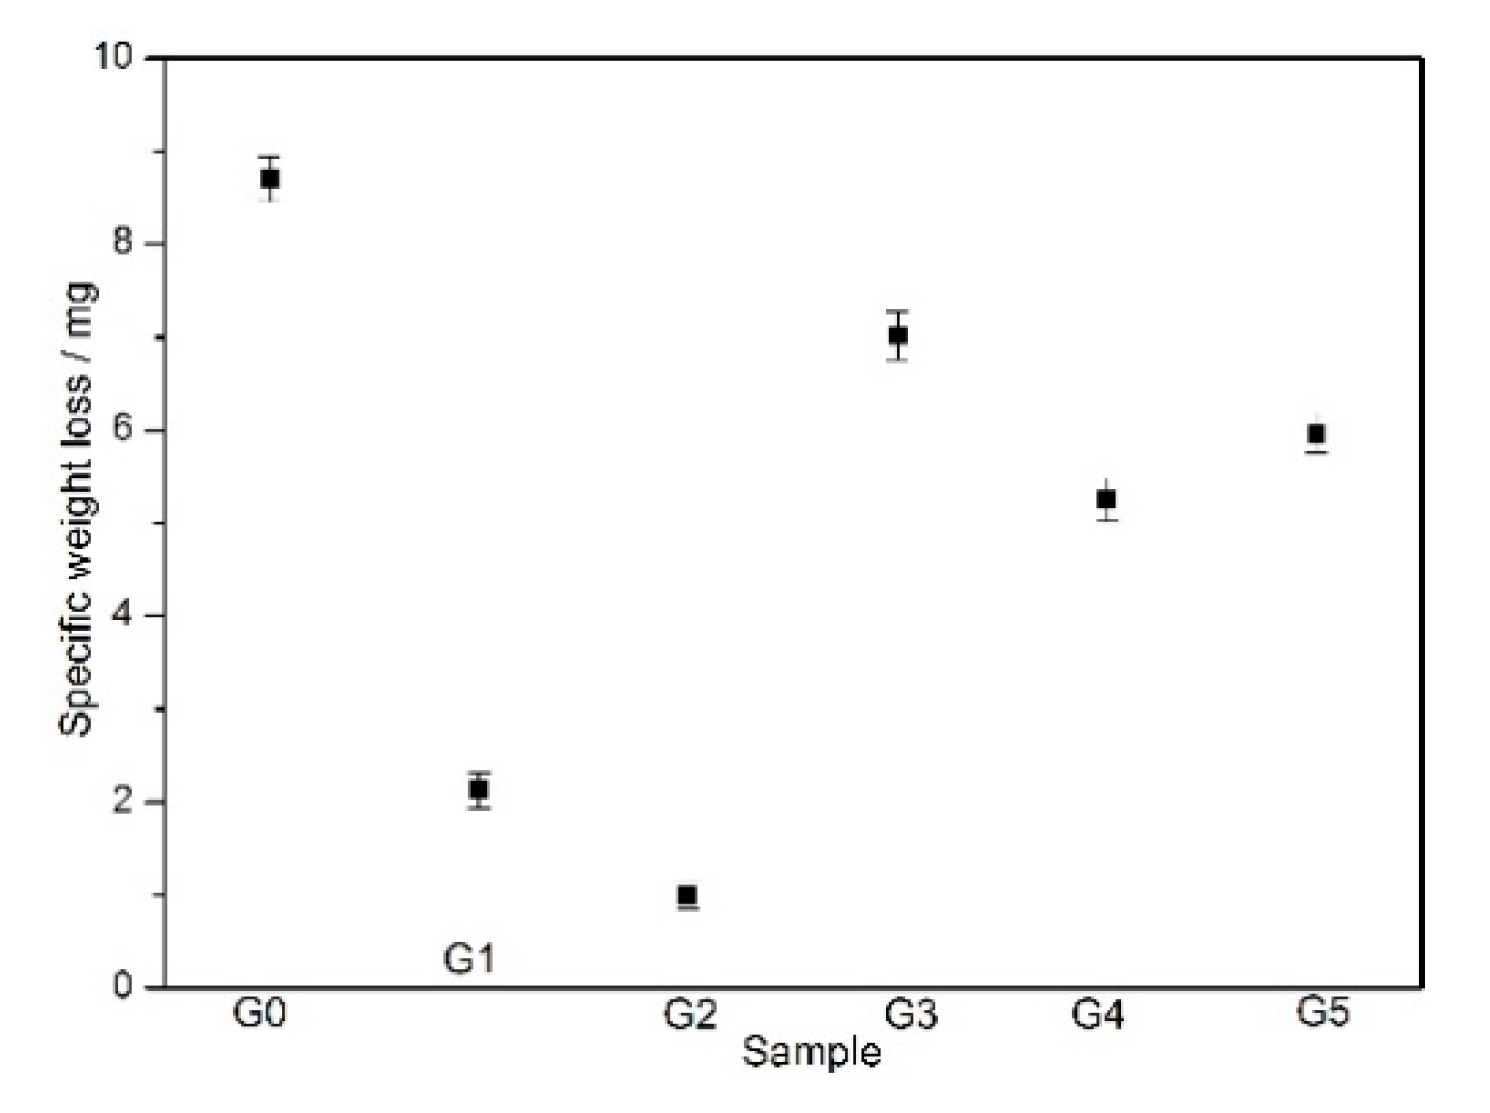
3.4. Weight Loss Measurements of the Coatings

The weight-loss method, given its simplicity and the reliability of its measurements, is the most commonly used non-electrochemical technique for evaluating the corrosion resistance [41]. From Figure 11, it can be clearly seen that the weight loss of G0 is the maximum, and that of G2 is the minimum. G3 also shows a larger corrosion weight loss. The weight loss of G1, G4, and G5 is relatively small, but they it is still greater than that of G2, indicating the corrosion resistance of G2 is superior to that of other coated samples. This is mainly related to the incorporation mode and amount of graphene in the coatings. Figure 12 shows the SEM surface morphologies of the coated samples after the weight loss measurements. It is obviously observed that the corrosion of G0 is much more serious than other coated samples with graphene. The big and deep pits can be clearly seen on the surface of G0 (Figure 12a). The serious corrosion exhibited big pits can also found on the coating G3 (Figure 12d). The obvious traces of liquid immersion are around the pits, indicating that the corrosive medium firstly immersed the coating here and causing the coating to bulge with the increase of the immersion time. Subsequently, the coating occurred rupture and resulted in pits. From Figure 12b, an obvious bulge can be seen, and it is in the germination stage of the coating rupture. Only some small size pits are observed on the surface of the coatings G1, G4, and G5 from Figure 12b,e,f. The corrosion of G2 is the slightest, and almost no visible pits are observed.

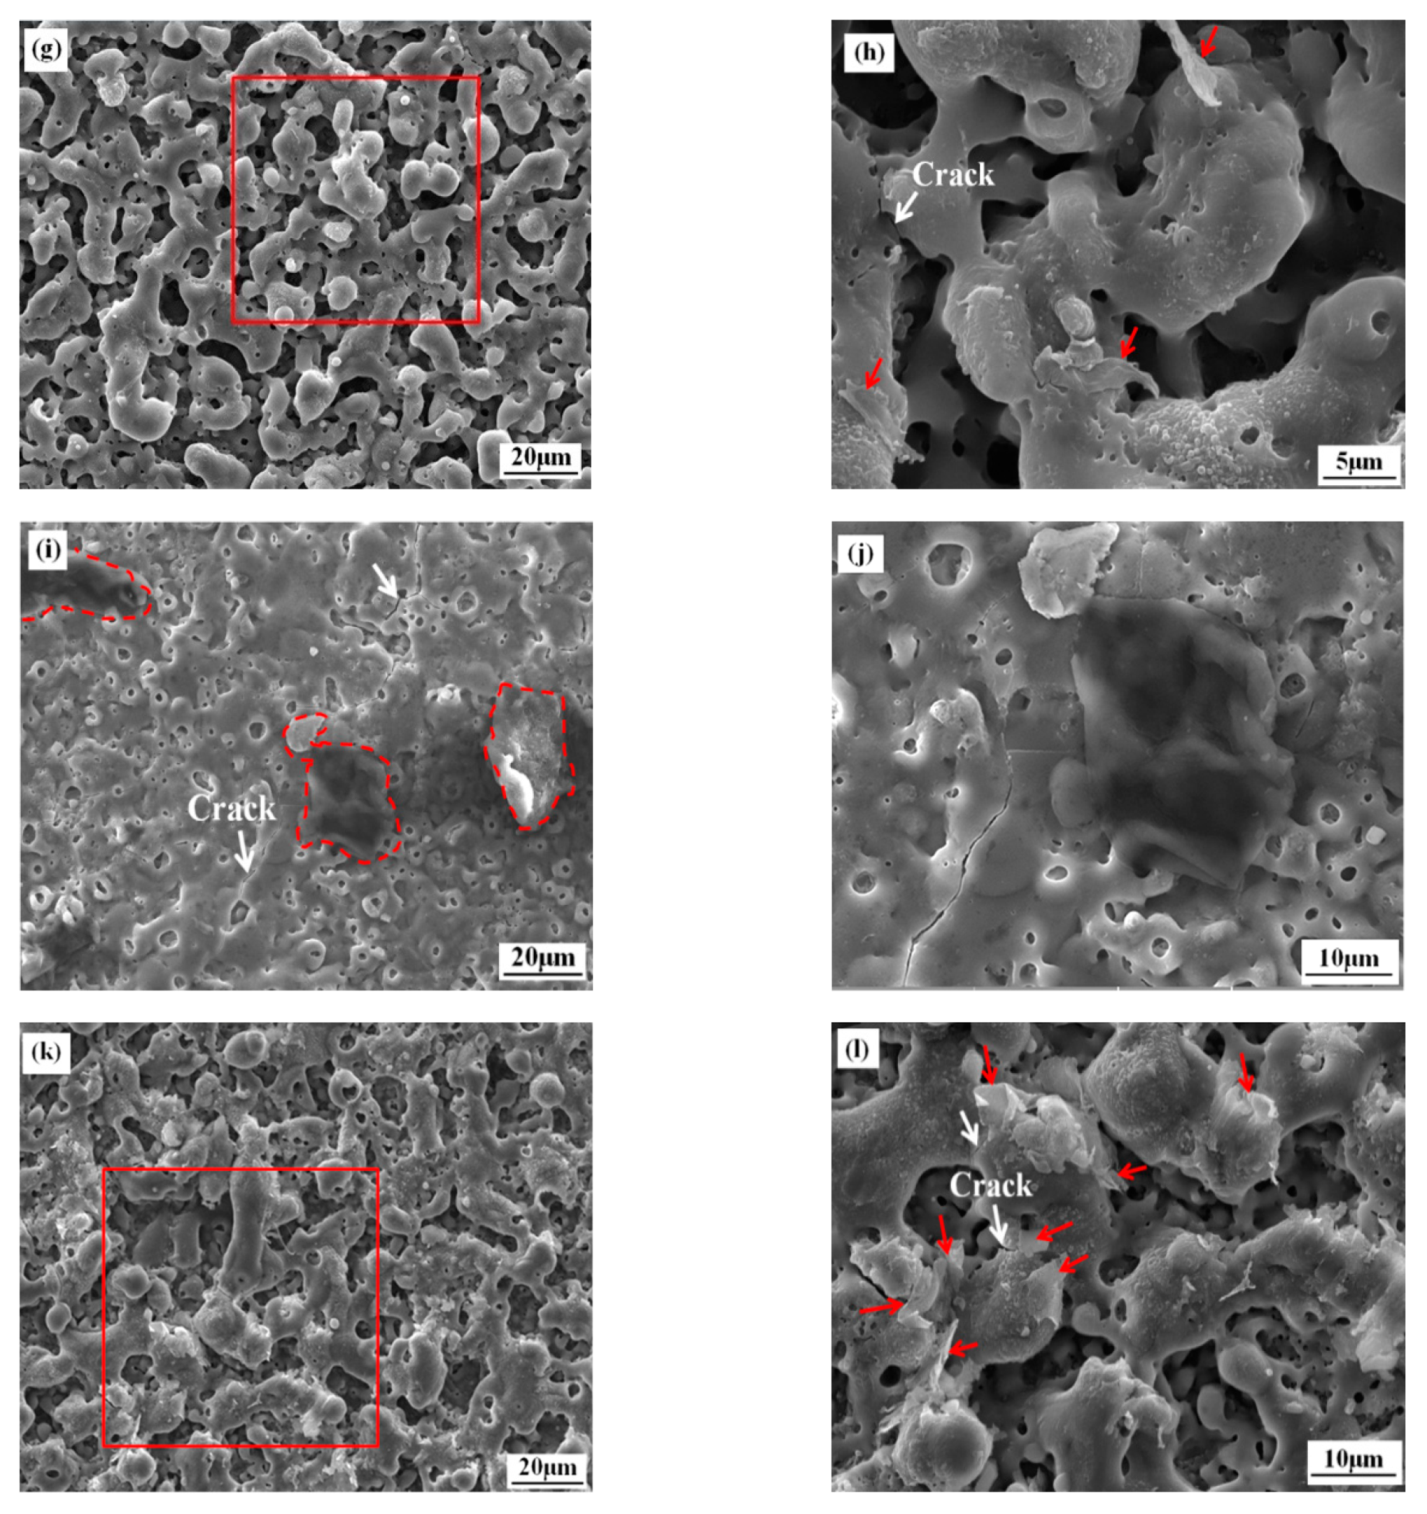
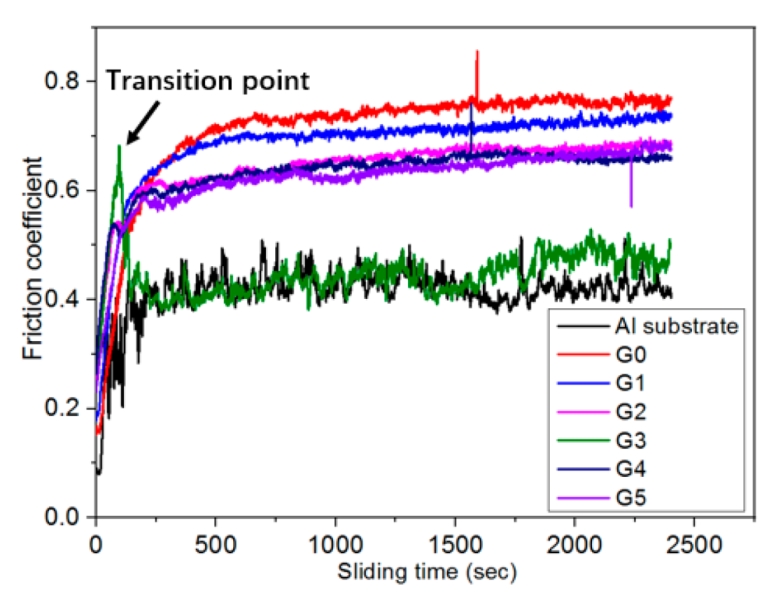
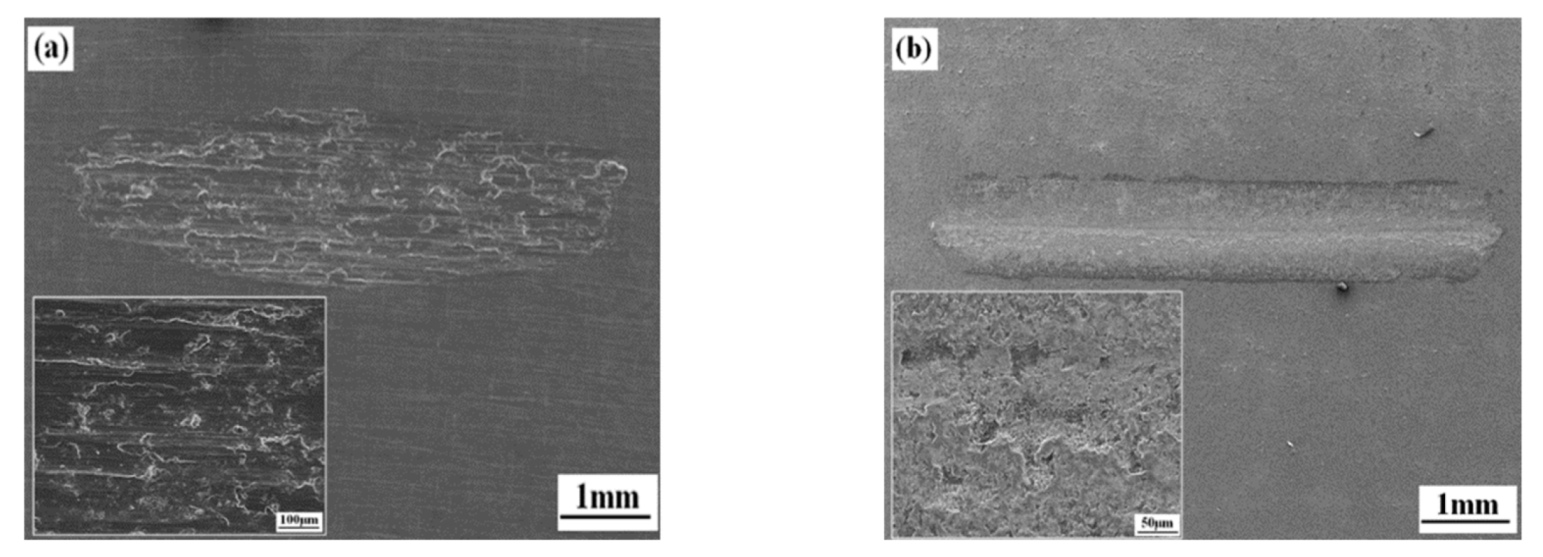
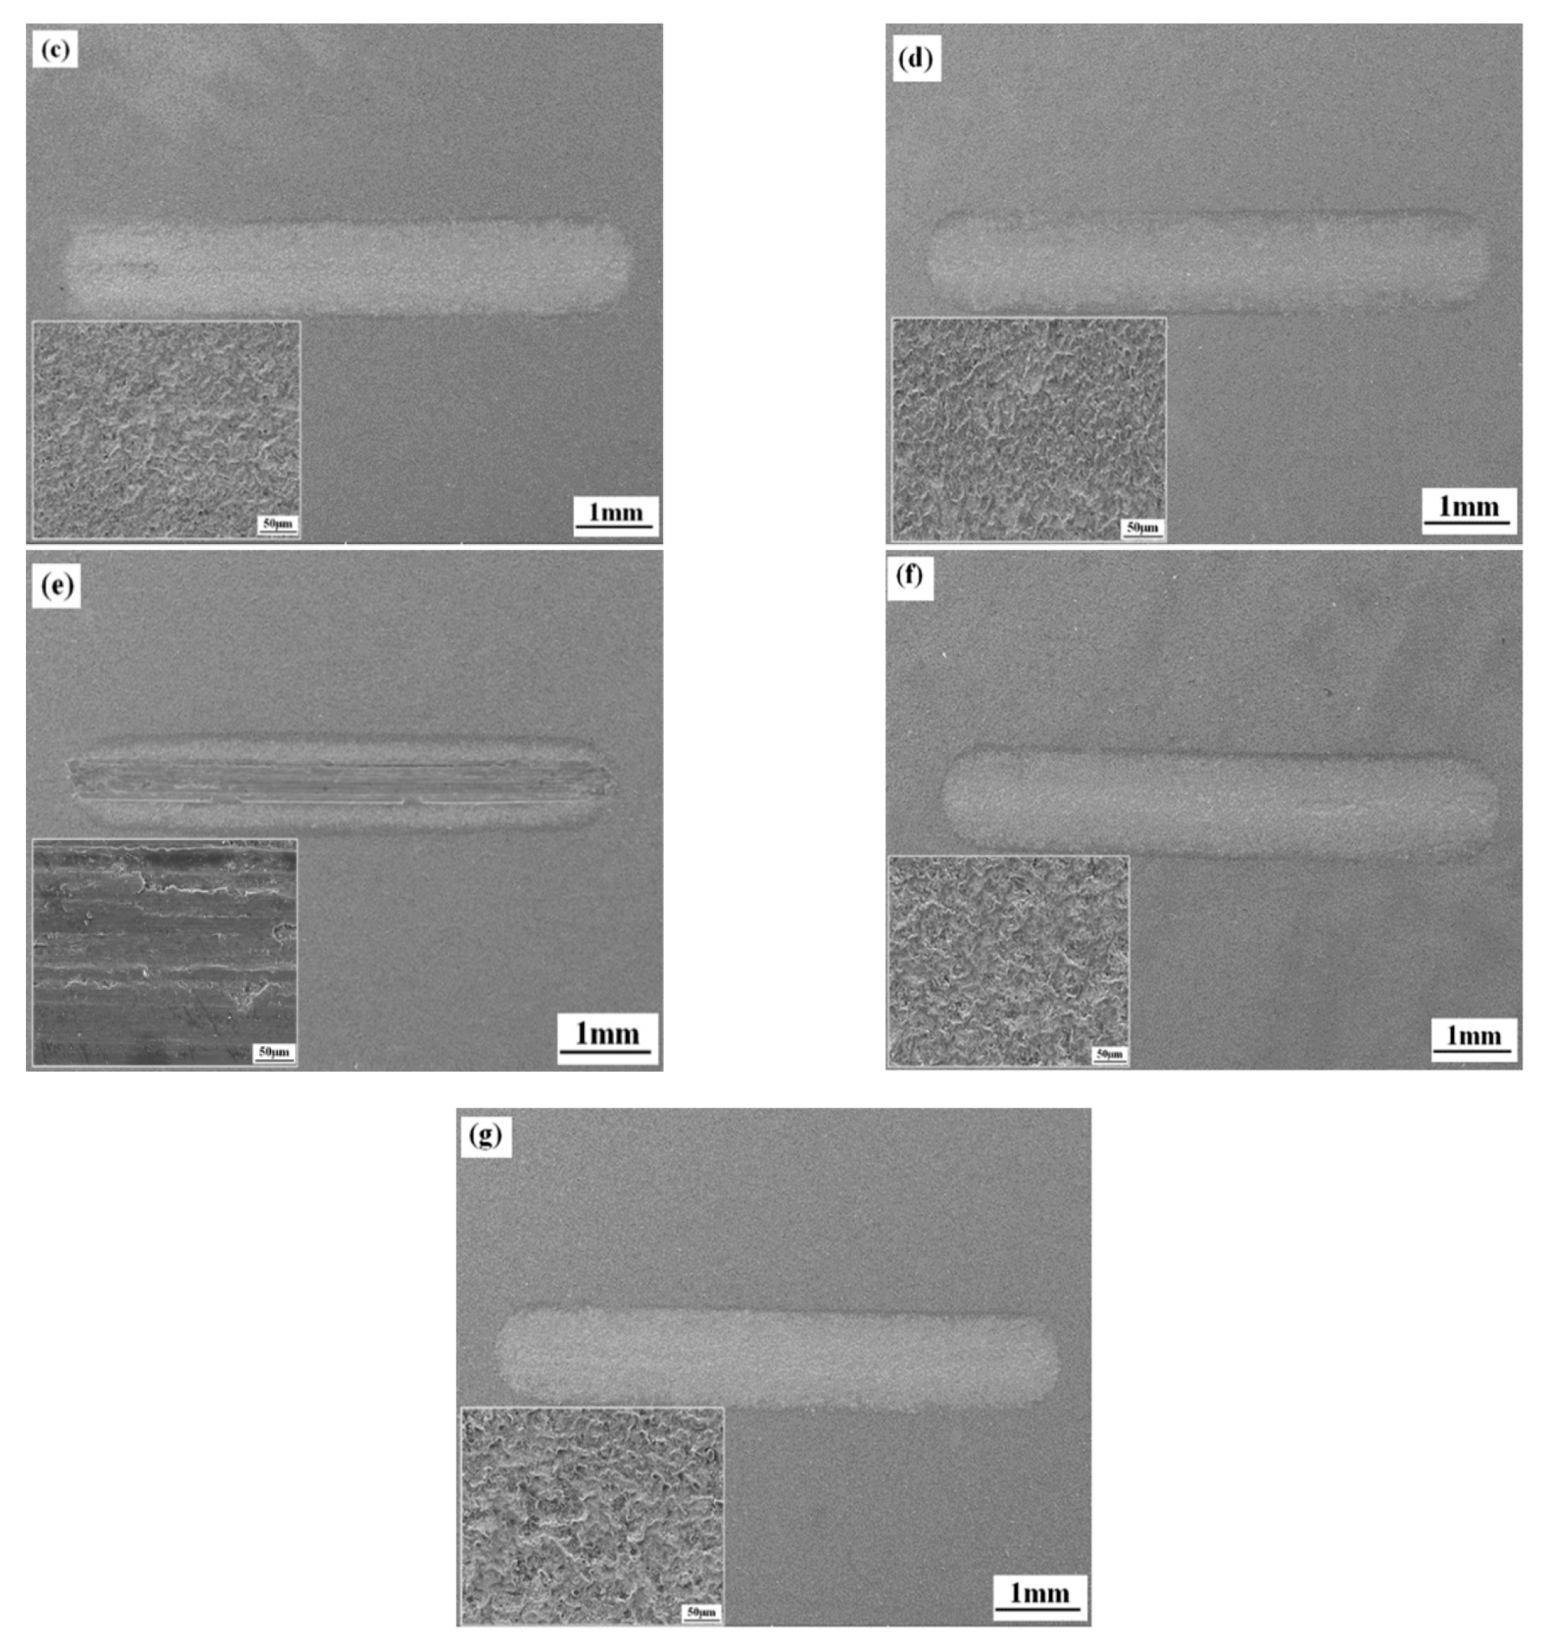
3.5. Wear Properties of the Coatings

Figure 13 shows the friction coefficient versus the sliding time of the coated samples and the substrate. SEM observation of wear tracks was also performed to further study the effect of graphene on the wear behavior (Figure 14). From Figure 13 and Figure 14, it can be concluded that the wear mechanism includes two types. One is called adhesive wear depicted in Figure 14a,b and Figure 14e,f, such as the wear behavior of the substrate and G3, displaying a lower friction coefficient (Figure 13). The SEM micrograph observation of their wear tracks shows that wide plows and shallow grooves occurred on the worn surface along the sliding direction, and it is deeper and wider than those of other coatings. G3 shows worse wear resistance corresponding to the coating with the thin, porous, loosen, and uneven characterization. Another wear behavior is abrasive wear occurred on the samples of G0, G1, G2, G4, and G5. Abrasive particles produced during the wear process, and some abrasive particles filled the pores and cracks during the wear process [42]. From Figure 13, it can be clearly seen that G0 owns the largest friction coefficient of 0.76 ± 0.05. The friction coefficient of the coating with graphene is lower than that of G0, which is attributed to the lubricating effect provided by graphene between the steel ball and the coating. The friction coefficient of the coating with graphene decreases with the increase of graphene content. However, the friction coefficient begins to increase when the graphene concentration is more than 2 g/L. Combined with the SEM micrograph of the wear track, the obvious worn and fallen coating can be found in G0 (Figure 14b). Additionally, deep pits and furrows also form. Compared with G0, the coating with graphene only shows slight change, especially for G2. That is ascribed to the smooth and compact surface of G2, contributing to the decrease of the wear volume and friction coefficient of 0.54 ± 0.03. The surface structure deteriorates with the increase of graphene concentration. The thickness of G3 with many pores and cracks is only 7.75 μm. The “transition point” of G3 occurred at 100 s when the friction coefficient rapidly decreased from high value to low value, signifying the onset of the coating damage. When the sliding time arrived at 160 s, the steel ball contacted the substrate, and the substrate participated in the sliding friction. The friction coefficient kept in accordance with that of the substrate, demonstrating the coating completely failure [43]. G4 and G5 also contain some pores and cracks, so the coatings in some regions were worn and fell off.
Table 4 shows the EDS analysis results of the wear track, and the substrate also proceeds for comparison. The Al content of G0 and G3 is higher than others, but the Fe content is lower than that of others. The Fe and C content of G2 is the most, namely, G2, owns the best wear resistance. Meanwhile, G4 and G5 also have good wear resistance compared to G0. Figure 15 shows the EDS mapping of elements distributed on the wear track of three typical specimens. Figure 13 reveals that the brightest element is Fe and Cr, suggesting the wear-resistant of G2 is the best. Furthermore, C content is also high, showing graphene plays an important role in resisting the wear. Fe content of G3 is the least, showing the wear resistance of G3 is poorer than that of G0. The result is consistent with the results of EDS analysis (Table 4). Therefore, it can be concluded G0 has certain wear resistance, but serious abrasive wear still occurs. A large amount of ground debris can be seen in its local magnification image of the wear track (Figure 14b). The wear track size of the coating with graphene is small. The wear is slight, and the abrasion surface is smooth (Figure 14c,d,f,g), showing the prominent wear resistance. The improvement of the conductivity of the electrolyte with graphene increases the discharge channels, and more oxides fill the pores layer by layer [27], so the coating shows the flatter and smoother structure and forms much Al2O3 phase with high hardness and good wear resistance [44]. In addition, the coating incorporated graphene with excellent lubrication and anti-friction effect [42], not only keeping the friction coefficient at a low value but also no large fluctuations appearing.

4. Conclusions

Coatings with different morphologies and thickness were prepared on D16T Al alloy by PEO treatment in electrolytes with different concentration graphene. Graphene successfully incorporated in the coatings with various modes, such as graphene with small size embedding in pores and microcracks of the coating (G1, G2, G3), and graphene with large size forming a pancake shape due to mutual reunion to spread on the surface of the coating (G4, G5). The coatings consisted of mainly α-Al2O3, γ-Al2O3, and Al. The thickness of the coatings increased non-linearly with graphene concentration. The coating with graphene improved the corrosion resistance of D16T Al alloy by exhibiting a more noble corrosion potential than that of the substrate, especially for G2. The weight loss of G2 is the least among the coated samples. The wear resistance of the coated samples except for G3 is significantly improved compared to the substrate, attributing to respective different microstructure, graphene concentration, and the incorporated mode of graphene in the coating. The microstructure and performances, including corrosion- and wear-resistance of the coating with much graphene embedded in the pores and cracks are superior to that of the coating with a small amount of large flakes graphene spreading on the surface. PEO treatment technique combined with the addition of graphene is a promising way to treat D16T Al alloy used as the drill pipe.

Author Contributions

W.L. and Y.L. conceived and designed the experiment, analyzed the data, and wrote the paper. Y.P. and W.H. performed the experiment and English correction. H.L. contributed materials and perfomed the experiment. All authors have read and agreed to the published version of the manuscript.

Funding

This research was funded by the National Science Foundation of China (51274170), the 19th college students’ key open experimental subjects of Southwest Petroleum University (KSZ19503), the plan program about passing a test for the youth technicist of Southwest Petroleum University (201131010056) and the Key laboratory program of oil and gas field materials in Sichuan province of China.

Acknowledgments

T The authors thank Ying Liu, Carsten Blawert and Mohd Talha for helpful discussions and English corrections, the experiment equipment by Helmholtz-Zentrum Geesthacht.

Conflicts of Interest

The authors declare no conflict of interest.

References

  1. Nicolescu, A.; Fisher, J.W.; Haq, M.A.; Bailey, T.F.; Lazarev, A. Drilling intervention-milling and fishing of high strength aluminum drill pipe. In Proceedings of the North Africa Technical Conference and Exhibition, Cairo, Egypt, 14–17 February 2012. [Google Scholar]
  2. Vakhrushev, A.V.; Gelfgat, M.Y.; Basovich, D.; Buyanovskiy, I.N. Aluminum drillpipe in an arcitic application-A well-known tool changing the development strategy. In Proceedings of the SPE Arctic and Extreme Environments Conference and Exhibition, Moscow, Russia, 15–17 October 2011. [Google Scholar]
  3. Xue, W.B.; Wu, X.L.; Li, X.J.; Tian, H. Anti-corrosion film on 2024/SiC aluminum matrix composite fabricated by microarc oxidation in silicate electrolyte. J. Alloy. Compd. 2006, 425, 302–306. [Google Scholar] [CrossRef]
  4. Nan, X.; Song, R.G.; Zhang, J.J.; Song, R.X.; Lu, X.Y.; Su, X.P. Effects of current density on microstructure and properties of plasma electrolyte oxidation ceramic coatings formed on 6063 aluminum alloy. Trans. Nonferrous Met. Soc. China 2016, 26, 806–813. [Google Scholar]
  5. Blawert, C.; Dietzel, W.; Ghali, E.; Song, G.L. Anodizing treatments... alloys and their effect on corrosion resistance in various environments. Adv. Eng. Mater. 2006, 8, 511–533. [Google Scholar] [CrossRef]
  6. Lee, K.M.; Ko, Y.G.; Shin, D.H. Incorporation of carbon nanotubes into micro-coatings film formed on aluminum alloy via plasma electrolytic oxidation. Matter. Lett. 2011, 65, 2269–2273. [Google Scholar] [CrossRef]
  7. Shin, K.R.; Ko, Y.G.; Shin, D.H. Effect of electrolyte on surface properties of pure titanium coated by plasma electrolytic oxidation. J. Alloy. Compd. 2011, 509S, S478–S481. [Google Scholar] [CrossRef]
  8. Arrabal, R.; Mohedano, M.; Matykina, E.; Pardo, A.; Mingo, B.; Merino, M.C. Characterization and wear behavior of PEO coatings on 6082-T6 aluminum alloy with incorporated α-Al2O3 particles. Surf. Coat. Technol. 2015, 269, 64–73. [Google Scholar] [CrossRef]
  9. Tang, M.Q.; Li, W.P.; Liu, H.C.; Zhu, L.Q. Influence of titania sol in the electrolyte on characteristics of the microarc oxidation coating formed on 2A70 aluminum alloy. Suf. Coat. Technol. 2011, 205, 4135–4140. [Google Scholar] [CrossRef]
  10. Matykina, E.; Arrabal, R.; Skeldon, P.; Thompson, G.E. Investigation of the growth processes of coatings formed by AC plasma electrolytic oxidation of aluminium. Electrochim. Acta 2009, 54, 6767–6778. [Google Scholar] [CrossRef]
  11. Jin, F.Y.; Chu, P.K.; Tong, H.H.; Zhao, J. Improvement of surface porosity and properties of alumina films by incorporation of Fe micrograins in micro-arc oxidation. Appl. Surf. Sci. 2006, 253, 863–868. [Google Scholar] [CrossRef]
  12. Sarbishei, S.; Sani, M.A.F.; Mohammadi, M.R. Effects of alumina nanoparticles concentration on microstructure and corrosion behavior of coatings formed on titanium substrate via PEO process. Ceram. Int. 2016, 42, 8789–8797. [Google Scholar] [CrossRef]
  13. Fatimah, S.; Kamil, M.P.; Kwon, J.H.; Kaseem, M.; Ko, Y.G. Dural incorporation of SiO2 and ZrO2 nanoparticles into the oxide layer on 6061 Al alloy via plasma electrolytic oxidation: Coating structure and corrosion properties. J. Alloy. Compd. 2017, 707, 358–364. [Google Scholar] [CrossRef]
  14. Yazdani, B.; Xu, F.; Ahmad, I.; Hou, X.H.; Xia, Y.D.; Zhu, Y.Q. Tribological performance of graphene/carbon nanotube hybrid reinforced Al2O3. Compos. Sci. Rep. 2005, 5, 11. [Google Scholar] [CrossRef] [PubMed]
  15. Hvizdos, P.; Dusza, J.; Balazsi, C. Tribological properties of Si3N4-graphene nanocomposites. J. Eur. Ceram. Soc. 2013, 33, 2359–2364. [Google Scholar] [CrossRef]
  16. Belmonte, M.; Ramírez, C.; González-Julián, J.; Schneider, J.; Miranzo, P.; Osendi, M.I. The beneficial effect of graphene nanofillers on the tribological performance of ceramics. Carbon 2013, 61, 431–435. [Google Scholar] [CrossRef]
  17. Pezzato, L.; Angelini, V.; Brunelli, K.; Martini, C.; Dabala, M. Tribological and corrosion behavior of PEO coatings with graphite nanoparticles on AZ91 and AZ80 magnesium alloys. Trans. Nonferrous Met. Soc. China 2018, 28, 259–272. [Google Scholar] [CrossRef]
  18. Lv, G.H.; Chen, H.; Gu, W.C.; Feng, W.R.; Li, L.; Niu, E.W.; Zhang, X.H.; Yang, S.Z. Effects of graphite additives in the electrolytes on the microstructure and corrosion resistance of alumina PEO coatings. Curr. Appl. Phys. 2009, 9, 324–328. [Google Scholar] [CrossRef]
  19. Zhao, J.M.; Xie, X.; Zhang, C. Effect of the graphene oxide additive on the corrosion resistance of the plasma electrolytic oxidation coating of the AZ31 magnesium alloy. Corros. Sci. 2017, 114, 146–155. [Google Scholar] [CrossRef]
  20. Yao, Z.; Jiang, Z.; Xin, S.; Wu, X. Electrochimical impedance spectroscopy of ceramic coatings on Ti-6Al-4V by micro-plasma oxidation. Electrochim. Acta 2005, 50, 3273–3279. [Google Scholar] [CrossRef]
  21. Lu, X.P.; Blawert, C.; Kainer, K.U.; Zheludkevich, M.L. Investigation of the formation mechanisms of plasma electrolytic oxidation coatings on Mg alloy AM50 using particles. Electrochim. Acta 2016, 196, 680–691. [Google Scholar] [CrossRef]
  22. Dai, L.B.; Li, W.F.; Zhang, G.G.; Fu, N.Q.; Duan, Q. Anti-corrosion and wear properties of plasma electrolytic oxidation coating formed on high Si content Al alloy by sectionalized oxidation mode. Mater. Sci. Eng. 2017, 167, 012063. [Google Scholar] [CrossRef]
  23. Han, B.; Yang, Y.; Huang, Z.; You, L.; Huang, H.; Wang, K. A composite anodic coating containing graphene on AZ31 magnesium alloy. Int. J. Electrochem. Sci. 2017, 12, 9829–9843. [Google Scholar] [CrossRef]
  24. Liu, W.; Liu, Y.; Lin, Y.; Zhang, Z.; Feng, S.; Talha, M.; Shi, Y.; Shi, T. Effects of graphene on structure and corrosion resistance of plasma electrolytic oxidation coatings formed on D16T Al alloy. Appl. Surf. Sci. 2019, 475, 645–659. [Google Scholar] [CrossRef]
  25. Wang, K.; Wang, Y.; Fan, Z.; Yan, J.; Wei, T. Preparation of graphene nanosheet/alumina composites by spark plasma Sintering. Mater. Res. Bull. 2011, 46, 315–318. [Google Scholar] [CrossRef]
  26. Sun, M.; Yerokhin, A.; Bychkova, M.Y.; Shtansky, D.V.; Levashov, E.A.; Matthews, A. Self-healing plasma electrolytic oxidation coatings doped with benzotriazole loaded halloysite nanotubes on AM50 magnesium alloy. Corros. Sci. 2016, 111, 753–769. [Google Scholar] [CrossRef]
  27. Liu, W.; Blawert, C.; Zheludkevich, M.L.; Lin, Y.; Talha, M.; Shi, Y.; Chen, L. Effects of graphene nanosheets on the ceramic coatings formed on Ti6Al4V alloy drill pipe by plasma electrolytic oxidation. J. Alloy. Compd. 2019, 789, 996–1007. [Google Scholar] [CrossRef]
  28. Wei, T.B.; Yan, F.Y.; Tian, J. Characterization and wear- and corrosion-resistance of microarc oxidation ceramic coatings on aluminum alloy. J. Alloy. Compd. 2005, 389, 169–176. [Google Scholar] [CrossRef]
  29. Chiu, K.Y.; Wong, M.H.; Cheng, F.T.; Man, H.C. Characterization and corrosion studies of fluoride conversion coating on degradable Mg implants. Surf. Coat. Technol. 2007, 202, 590–598. [Google Scholar] [CrossRef]
  30. Du, N.; Wang, S.X.; Zhao, Q.; Zhu, W.H. Microstructure and tribological properties of microarc oxidation composite coating containing Cr2O3 particles on TC4 titanium alloy. Rare Met. Mater. Eng. 2013, 42, 621–624. (In Chinese) [Google Scholar]
  31. Erarslan, Y. Wear performance of in-situ aluminum matrix composite after micro-arc oxidation. Trans. Nonferrous Met. Soc. China 2013, 23, 347–352. [Google Scholar] [CrossRef]
  32. Bian, D.; Aradhyula, T.V.; Guo, Y.X.; Zhao, Y.W. Improving tribological performance of chemically bonded phosphate ceramic coatings reinforced by graphene nano-platelets. Ceram. Int. 2017, 43, 12466–12471. [Google Scholar] [CrossRef]
  33. Feng, C.J.; Hu, S.L.; Jiang, Y.F.; Zhou, Y. Effects of micro-arc oxidation of Ti6Al4V alloy on adhesion property to electroless Ni-P-ZrO2 composite platings and their wear resistance. Rare Met. Mater. Eng. 2013, 42, 2427–2432. [Google Scholar]
  34. Kaseem, M.; Kamil, M.P.; Kwon, J.H.; Ko, Y.G. Effect of sodium benzoate on corrosion behavior of 6061 Al alloy processed by plasma electrolytic oxidation. Surf. Coat. Technol. 2015, 283, 268–273. [Google Scholar] [CrossRef]
  35. Liu, Y.; Zhang, J.J.; Li, S.Y.; Wang, Y.M.; Han, Z.W.; Ren, L.Q. Fabrication of a superhydrophobic graphene surface with excellent mechanical abrasion and corrosion resistance on an aluminum alloy substrate. RSC Adv. 2014, 4, 45389–45396. [Google Scholar] [CrossRef]
  36. Ma, Y.; Di, H.H.; Yu, Z.X.; Liang, L.; Lv, L.; Pan, Y.; Zhang, Y.Y.; Yin, D. Fabrication of silica-decorated graphene oxide nanohybrids and the properties of composite epoxy coatings research. Appli. Surf. Sci. 2016, 360, 936–945. [Google Scholar] [CrossRef]
  37. Richard Prabakar, S.J.; Hwang, Y.H.; Bae, E.G.; Lee, D.K.; Pyo, M. Graphene oxide as a corrosion inhibitor for the aluminum current collector in lithium ion batteries. Carbon 2013, 52, 128–136. [Google Scholar] [CrossRef]
  38. Prasai, D.; Tuberquia, J.C.; Harl, R.R.; Jennings, G.K.; Bolotin, K.I. Graphene: Corrosion-inhibiting coating. ACS Nano 2012, 6, 1102–1108. [Google Scholar] [CrossRef]
  39. Adawy, A.I.; Abbas, M.A.; Zakaria, K. New Schiff base cationic surfactants as corrosion inhibitors for carbon steel in acidic medium: Weight loss, electrochemical and SEM characterization techniques. Res. Chem. Intermed. 2016, 42, 3385–3411. [Google Scholar] [CrossRef]
  40. Dennis, R.V.; Robert, V.D.; Lasantha, T.V.; Anil, V.; Tapan, K.R.; Sarbajit, B. Graphene nanocomposite coatings for protecting low-alloy steels from corrosion. Am. Ceram. Soc. Bull. 2013, 92, 18–24. [Google Scholar]
  41. Krishnamurthy, A.; Gadhamshetty, V.; Mukherjee, R.; Chen, Z.; Ren, W.; Cheng, H.M.; Koratkar, N. Passivation of microbial corrosion using a graphene coating. Carbon 2013, 56, 45–49. [Google Scholar] [CrossRef]
  42. Mondal, A.K.; Chandra Rao, B.S.S.; Kumar, S. Wear behaviour of AE42 + 20% saffil Mg-MMC. Tribol. Int. 2007, 40, 290–296. [Google Scholar] [CrossRef]
  43. Javidi, M.; Fadaee, H. Plasma electrolytic oxidation of 2024-T3 aluminum alloy and investigation on microstructure and wear behavior. Appl. Surf. Sci. 2013, 286, 212–219. [Google Scholar] [CrossRef]
  44. Xie, H.J.; Cheng, Y.L.; Li, S.X.; Cao, J.H.; Cao, L. Wear and corrosion resistant coatings on surface of cast A356 aluminum alloy by plasma electrolytic oxidation in moderately concentrated aluminate electrolytes. Trans. Nonferrous Met. Soc. China 2017, 27, 336–351. [Google Scholar] [CrossRef]
Figure 1. Different magnification of the scanning electron microscope (SEM) images of graphene: (a) 1000× (b) 30000×.
Coatings 10 00249 g001
Figure 2. Surface morphologies of the coatings with different concentrations of graphene: (a,b) G0, (c,d) G1, (e,f) G2, (g,h) G3, (i,j) G4, (k,l) G5; (b,d,f,h,j,l) the magnification morphologies of the graphs (a,c,e,g,i,k).
Coatings 10 00249 g002aCoatings 10 00249 g002b
Figure 3. Surface morphologies and energy dispersive spectrometer (EDS) mapping graphs of the coatings: (a,b) G1, (c,d) G2, (e,f) G3, (g,h) G4, (i,j) G5; (a,c,e,g,i) the tested surface morphology of EDS mapping, (b,d,f,h,j) the EDS mapping graphs of the C element.
Coatings 10 00249 g003aCoatings 10 00249 g003b
Figure 4. The C content of five coated samples with different concentrations of graphene.
Coatings 10 00249 g004
Figure 5. The thickness of coated samples with different concentration graphene.
Coatings 10 00249 g005
Figure 6. Cross-sectional EDS mapping of the coatings: (a) G0, (b) G1, (c) G2, (d) G3, (e) G4, and (f) G5.
Coatings 10 00249 g006
Figure 7. XRD patterns of the coatings with different concentration graphene.
Coatings 10 00249 g007
Figure 8. EIS spectra of bare D16T Al alloy and the coated samples immersion in 3.5 wt.% NaCl solution for 2 h: (a) Nyquist plots; (b,c) Bode plots.
Coatings 10 00249 g008
Figure 9. Equivalent circuit model related to the electrochemical impedance spectroscopy (EIS) plots for analyzing the corrosion behavior of the coatings.
Coatings 10 00249 g009
Figure 10. Schematic of the corrosion and protection mechanism of the coatings: (a) without graphene, (b) with graphene embedded in the coating, (c) with graphene spread on the surface of the coating, and (d) schematic of graphene as a chemically inert diffusion barrier.
Coatings 10 00249 g010
Figure 11. Corrosion weight loss of the coated samples after immersion in 3.5 wt.% NaCl solution.
Coatings 10 00249 g011
Figure 12. SEM surface morphologies of the coated samples after immersion in 3.5 wt.% NaCl solution for 48 h: (a) G0, (b) G1, (c) G2, (d) G3, (e) G4, and (f) G5.
Coatings 10 00249 g012
Figure 13. Friction coefficient of the substrate and the coatings with different concentrations of graphene.
Coatings 10 00249 g013
Figure 14. SEM morphologies of the wear track of (a) the substrate and (bg) the coatings with different concentration graphene, (b) G0, (c) G1, (d) G2, (e) G3, (f) G4, (g) G5, (the inset figure in each image is the corresponding magnified SEM image of the local wear track).
Coatings 10 00249 g014aCoatings 10 00249 g014b
Figure 15. EDS mapping of the wear track of three PEO coatings with different concentrations of graphene: (a) G0, (b) G2, (c) G3.
Coatings 10 00249 g015aCoatings 10 00249 g015b
Table 1. Chemical compositions of the D16T aluminum alloy (wt.%).
Element CuMgMnFeTiSiZnAl
Content 3.851.290.650.110.0490.0680.054Balance
Table 2. The electrolytes used for the formation of the PEO coatings.
SampleElectrolyte
G0Na2SiO3 (12 g/L), NaOH (4 g/L), KF (2 g/L), glycerol (4 mL/L)
G1Base electrolyte + 1 g/L graphene
G2Base electrolyte + 2 g/L graphene
G3Base electrolyte + 3 g/L graphene
G4Base electrolyte + 4 g/L graphene
G5Base electrolyte + 5 g/L graphene
Table 3. Electrochemical parameters obtained from the EIS spectra of PEO coatings.
SampleRs
(Ω·cm2)
R1
(Ω·cm2)
CPE1R2
(Ω·cm2)
CPE2
Y1
−1·cm−2 Sn)
n1Y2
−1·cm−2 Sn)
n2
G039.671.86 × 104 5.84 × 10⁵ 0.549.39 × 105 4.79 × 1050.48
G166.561.34 × 105 4.05 × 10⁵ 0.773.68 × 105 1.05× 1050.75
G276.531.70 × 105 1.42 × 10⁵ 0.841.29 × 105 2.79× 1050.65
G354.433.33 × 105 3.29 × 10⁵ 0.642.03× 105 4.29 × 1050.62
G457.679.30 × 105 6.23 × 10⁵ 0.743.45× 105 1.82 × 1050.72
G587.091.87 × 105 1.63 × 10⁵ 0.817.87 × 105 2.05× 1050.45
Table 4. Elemental compositions of the substrate and the coated samples after the wear test determined from EDS analysis.
SampleAlCuFeCrOC
Bare Al alloy88.426.430.49-4.43-
G041.812.767.35-18.63-
G121.760.5639.620.6421.578.69
G217.35-48.320.8929.8812.48
G369.775.840.84-8.524.93
G428.890.9336.740.5820.757.69
G534.081.2230.590.3419.728.27

