Article

Preparation of Coated Corrugated Box for Controlled-Release of Chlorine Dioxide and Its Application in Strawberry Preservation

1
College of Food Science, Southwest University, Chongqing 400700, China
2
Food Storage and Logistics Research Center, Southwest University, Chongqing 400700, China
*
Author to whom correspondence should be addressed.
Coatings 2020, 10(3), 242; https://doi.org/10.3390/coatings10030242
Submission received: 20 February 2020 / Revised: 2 March 2020 / Accepted: 4 March 2020 / Published: 6 March 2020
(This article belongs to the Section Coatings for Food Technology and System)

Abstract

:
Chlorine dioxide (ClO2) has received great attention as a nontoxic and efficient antimicrobial agent for the preservation of fresh fruits and vegetables. A novel two-layer coated corrugated box was developed to release gaseous ClO2 under the trigger of moisture in this study. The inner surface of the box was firstly coated with a mixture of polyvinyl alcohol-NaClO2-diatomite and then with chitosan acetic acid solution. Results showed that ClO2 was successfully released under high humidity due to the reaction of NaClO2, water vapor and acid. The concentration of released ClO2 increased with the increasing NaClO2 content in the coating, while the addition of diatomite stabilized and extended the release. To evaluate the preservation effect, strawberries were packed in the coated box and stored at room temperature. Compared with the control, the decay rate and weight loss of the strawberries packed in the coated box (9 g/L NaClO2) were reduced up to 21.88% and 6.84%, respectively. The surface color, firmness and nutrients content were also better maintained. Therefore, this coated corrugated box with the capability to release ClO2 under the trigger of moisture has great potential to be applied as an antimicrobial packaging for fresh fruits and vegetables.

Graphical Abstract

1. Introduction

Fresh fruits and vegetables are susceptible to microbial infection due to their rich nutrient content, high moisture content and mechanical damages during harvest and transportation [1], which greatly shorten their shelf-life and cause huge economic loss. Current strategies to control microbial infections in fresh fruits and vegetables include cold storage and the application of antimicrobial agents. Nowadays, antimicrobial packaging which incorporates antimicrobial agents in the packaging materials is emerging as a safe and efficient method to extend the shelf-life of fresh produce.
According to the form of action, antimicrobial packaging can be divided into two types: direct contact and indirect contact [2]. When a packaging material is incorporated with a non-volatile antimicrobial agent, it needs close contact with the packaged food to effectively inhibit the growth of microorganisms on the surface. However, for fresh fruits and vegetables with large specific surface areas and irregular shapes, which are mostly packaged in batches, it is unlikely to ensure their effective contact with the packaging material. Therefore, volatile or gaseous antimicrobial agents which are able to diffuse to the exposed surface of every packaged item, would be better options to be blended with packaging materials. However, the key is to control the release of antibacterial agents under appropriate conditions and to make the release stable and continuous.
Chlorine dioxide (ClO2) is a broad-spectrum bactericide with strong oxidizing ability, which has been approved by US Food and Drug Administration (FDA) to be used as a disinfectant, sanitizer and sterilizant for fruits and vegetables at a residue level of 3 mg/L [3]. In vitro and inoculation studies have demonstrated that ClO2 could effectively inhibit the growth of Gram-negative and -positive bacteria [4,5], yeasts [6] and molds [7]. The mechanisms of inactivation include recognizing and reacting with the cell membranes to modify the conformation of proteins and lipids, penetrating the membranes to oxidize amino acids and proteins thus interrupting cell metabolism, inducing electrolyte leakage of cells, as well as inhibiting the mycelial growth and spore germination [8]. Moreover, ClO2 have been reported to interfere with biosynthesis of ethylene [9] and respiratory metabolism, which might be combined with the antibacterial effect to delay the ripening of postharvest produce. So far, ClO2 in various forms has applied to the preservation of logan [10], tomatoes [11], mangos [12], peppers [13], bamboo shoots [14], among others. The reduced microbial amount, improved storage quality and extended shelflife have been reported on these fruits and vegetables. In addition, ClO2 is capable to degrade toxin including pesticide residues through oxidation effect [8,15], which further makes it an ideal candidate for fresh produce preservation.
However, gaseous ClO2 is explosive when its partial pressure is above 0.1 bar and is unstable when exposed to sunlight, making it hard to be stored or be transported. Therefore, self-releasing ClO2 systems have been developed to release gaseous ClO2 in individual packaging. For example, the crystalline form of ClO2 wrapped by permeable films has been incorporated into the packaging of strawberries [16] and blueberries [17], which sustainably released gaseous ClO2 and successfully reduced the decay incidence. ClO2 has also been encapsulated into α-cyclodextrin, for which the releasing rate was controlled by temperature and relative humidity [18]. Systems for on-site generation of ClO2 under external triggers have also been developed, which generally involve the reaction between a precursor and one or several activators. The most commonly used precursor is sodium chlorite (NaClO2), which reacts with acid and water molecules to produce ClO2. NaClO2 and acid are usually incorporated in two different compartments and then are assembled together to allow the in situ release of ClO2 under high humidity, which is induced by the diffusion and mixing of ClO2 and H+ [19,20,21].
This study is aiming to develop a novel antimicrobial corrugated cardboard box with the capability to release gaseous ClO2 under the trigger of moisture. Corrugated boxes or trays are widely used as packaging of fruits and vegetable for storing, transportation and display, due to their advantages such as lightweight, low cost, sustainability, suitable permeability, and good cushioning properties. Herein, a two-layer polymer coating composed of polyvinyl alcohol (PVA) containing NaClO2 and chitosan dissolved in 1% (w/v) acetic acid has been applied on the inner-surface of corrugated box, in order to in-situ release gaseous ClO2 under the trigger of CO2 and water vapor generated by the respiration and transpiration effect of fresh fruits and vegetables. The physical properties and the releasing behavior of ClO2 of the coated corrugated box were investigated. Moreover, the coated box was used as packaging of fresh strawberries to evaluate its preservation effect.

2. Materials and Methods

2.1. Materials

PVA (degree of polymerization, 1700, alcoholysis degree, 99 (mol/mol)%) and diatomite (chemical pure) was purchased from Chron Chemicals Co., Ltd (Chengdu, China). NaClO2 (80% purity) was purchased from Aladdin biochemical Polytron Technologies Inc. (Shanghai, China). All other chemicals used were of analytical grade. T4 aircraft boxes (250 mm × 200 mm × 70 mm) made of E flute corrugated cardboards with a thickness of 1.6 mm were supplied by Tuchang Packaging Co., Ltd (Xuzhou, China). Strawberries were obtained from a local greenhouse in Chongqing, China.

2.2. Coating on Corrugated Boxes

PVA (36 g) was dissolved in 910 mL 30% (v/v) ethanol aqueous solution followed by stirring at 85 °C for 2 h. Diatomite (3.6 g) and different amount of NaClO2 were dispersed in 90 mL deionized (DI) water and were then mixed with the prepared PVA solution to obtain mixtures of PVA-diatomite-NaClO2. The final concentrations of NaClO2 in the mixtures were 3, 6, and 9 g/L, respectively. Chitosan solution with a concentration of 0.75 g/L was prepared by dissolving chitosan flakes in 1% (w/v) acetic acid aqueous solution.
To prepare ClO2 controlled-release corrugated boxes, the inner surface of corrugated boxes was successively coated by PVA-diatomite-NaClO2 mixture and chitosan solution. Firstly, 100 mL PVA-diatomite-NaClO2 mixture was evenly brushed on the inner surface of one corrugated box with an inner surface area of 1630 cm2, which was dried at room temperature. Secondly, 0.75 g/L chitosan solution was sprayed onto the PVA-diatomite-NaClO2 layer of the corrugated boxes for three times, 30 mL each time. After dried at room temperature, the coated boxes were stored in an environment with relative humidity (RH) lower than 20% and temperature lower than 10 °C. The boxes coated by PVA-diatomite-NaClO2 mixture with the NaClO2 concentration of 3, 6 and 9 g/L were designated as 3 g/L NaClO2, 6 g/L NaClO2 and 9 g/L NaClO2, respectively, while boxes with no treatment were used as control. To investigate the effect of diatomite, corrugated boxes were coated by a mixture of PVA and NaClO2 with the NaClO2 concentration of 9 g/L and chitosan solution successively, following the same procedure except no diatomite was added, which were designated as 9 g/L NaClO2 (No diatomite).

2.2.1. Physical Properties of the Coated Corrugated Cardboard and Box

Corrugated cardboards cut from the coated corrugated box were placed in a climatic chamber with 90% RH and a temperature of 20 °C for 24 h prior to the testing of physical properties, except for the samples used for moisture content measurement.
The thickness of corrugated cardboard was measured by a PD-151 digital vernier caliper (Prokit’s Industries Co., Ltd, Shenzhen, China).
The moisture content was measured according to the Chinese National Standard GB/T 462-2008. Sample with a size of 10 cm × 10 cm was dried at 105 ± 2 °C to a constant weight in an oven. It was immediately weighed after taking out, and was put in a climatic chamber with 90% RH and a temperature of 20 °C until it reached a constant weight. The moisture content of the cardboard was calculated using Equation (1).
Moisture   content   ( % ) = ( m 1 m 0 ) / m 0 × 100
where m0 is the weight of the cardboard after drying, and m1 is the weight of the cardboard after moisture absorption in the climatic chamber.
The puncture strength (PS) of corrugated cardboard was measured by an HD-510S digital cardboard puncture tester (Haida International Equipment Co., Ltd., Dongguan, China). The test was carried on samples with a size of 175 mm × 175 mm according to the Chinese National Standard GB/T 2679.7-2005. The flat crush strength (FCS) and the edge crush strength (ECS) of corrugated cardboard were measured by an HD-513E compressive strength tester (Haida International Equipment Co., Ltd., Dongguan, China). The samples used for the FCS test were cut to circles with a diameter of 64 mm, while those used for the ECS test were cut into rectangles with a size of 25 mm × 100 mm, respectively. The ECS and FCS tests were carried out in accordance with the Chinese National Standard GB/T 22874-2008 and GB/T 6546-1998, respectively.
The box compressive strength (BCS) of the corrugated box was measured by an HD-502-1000 carton pressure tester (Haida International Equipment Co., Ltd., Dongguan, China). The box to be tested was fixed by a guide plate in the middle of the lower pressure plate, which moved up at a speed of 12 mm/min. The maximum pressure applied on the box before it crushed was recorded as BCS.

2.2.2. ClO2 Release Test

The release rate of ClO2 from the corrugated cardboard was measured under 100% RH and 0% RH, respectively. In order to obtain an environment with 100% RH, 200 mL deionized (DI) water was put in the bottom of a brown glass desiccator for 24 h before the test. Cardboard with a size of 20 cm × 20 cm was put on the porcelain plate with holes in the desiccator without contact with DI water. The desiccator was then air-tightly sealed by a greased lid. The concentration of ClO2 (mg/L) in the desiccator was measured every 24 h by a GC510 ClO2 gas detector supplied by Chicheng Electric Co., Ltd. (Henan, China). After each measurement, the desiccator was open for 30 min until no ClO2 was detected, and the desiccator was sealed again. To measure the release rate of ClO2 under 0% RH, 200 g silica gel was put in the bottom of a desiccator for 24 h instead of 200 mL DI water prior to the placement of the cardboard. Before the coated cardboard was placed in, silica gel was removed to prevent ClO2 from being absorbed by silica gel. After each measurement, the tested cardboard was moved to another desiccator with 0% RH. Other procedures were the same as that of the test under 100% RH. The release efficiency of ClO2 from the corrugated cardboard was calculated using Equation (2) and expressed as a percentage:
Release   efficiency   ( % ) = W n / W t o t a l × 100
where Wn is the accumulated release amount of ClO2 at day n, which is a sum of daily release from day 0 to day n, and Wtotal is the total amount of ClO2 that can be theoretically released from the tested corrugated cardboard based on the amount of NaClO2 coated on the cardboard.

2.3. Application of Coated Corrugated Boxes in Strawberry Preservation

Strawberries were transported from a local greenhouse into the lab on the day they were picked. Strawberries free from pathological and physical damage with the same maturity were disinfected with 0.02% (v/v) NaClO2 aqueous solution and were dried under ambient condition. Strawberries were then randomly divided into four groups and were put into control, 3 g/L NaClO2, 6 g/L NaClO2, 9 g/L NaClO2 corrugated cardboard boxes, separately, with 16 fruits in each box. There were 12 boxes for each group and stored at 20 ± 5 °C and 65% ± 10% RH. Two boxes of each group were taken out randomly to evaluate the quality every day.

2.4. Physico-chemical Quality Changes of Strawberries

Fruits with visible mold growth and juice leakage were considered rotten. The decay rate was calculated as the percentage of accumulated rot on that day in the total number of strawberries in each group. Weight loss was expressed as a percentage of the initial weight. Each non-rotten fruit was weighed every day to calculated the weight loss. The surface color of strawberries was measured by an UltraScan PRO chromameter (Hunterlab, USA) at three sites of the surface of a strawberry avoiding rotting areas. Firmness was measured by a GY-4 fruit firmness tester (Top Instrument Co., Ltd., China). A 4-mm-diameter cylindrical probe was penetrated to a depth of 1 mm at three different points of the central zone of each fruit. At least three strawberries in each group without spoilage were used for testing.
Ascorbic acid content (AA) of strawberries was determined by KIO3 titration method [22]. Five fruits were homogenized and 10 g of the slurry was diluted using 2% (v/v) HCl to 100 mL, which was prepared in triplicate for each group. After standing for 10 min to extract, the mixture was filtered. Filtrate (5 mL), 10 g/L KI solution (0.5 mL), ultrapure water (2.5 mL) and 5 g/L starch solution (2 mL) were mixed and were titrated by 10 g/L KIO3 solution to a light blue until no color change within 30 s. Mixture of 2% (v/v) HCl (5 mL), 10 g/L KI solution (0.5 mL), ultrapure water (2.5 mL) and 5 g/L starch solution (2 mL) was titrated by 10 g/L KIO3 solution following the same procedure. AA content of fruit was calculated using Equation (3) and expressed as mg/100 g.
AA ( mg / 100   g ) = V × ( V 1 V 0 ) × 0.088 × 100 V s × m
where V is the total volume of strawberry slurry dilution (mL); V1 is the volume of KIO3 solution consumed to titrate the filtrate mixture (mL); V0 is volume of KIO3 solution consumed to titrate the mixture in which 5 mL filtrate was replaced by 5 mL 2% (v/v) HCl (mL); Vs is the volume of filtrate used to prepare the mixture to titrate (mL); m is the total mass of strawberry used to prepare the slurry (mg); 0.088 is the mass of AA that 1 mL of 1 mmol/L KIO3 solution equal to (mg).
Titratable acid content (TA) was determined using the NaOH titration method [23]. The strawberry slurry was prepared and 5 g of them was diluted to 100 mL using ultrapure water, which was prepared in triplicate for each group. After filtration, 2 drops of 1% (w/v) phenolphthalein solution was added to 20 mL filtrate and was titrated by 0.1 mol/L NaOH solution to a light pink until no color change within 30 s. TA content of fruit was calculated using Equation (4):
TA ( % ) = V × ( V 1 V 0 ) × f × 100 V s × m
where V is the total volume of strawberry slurry dilution (mL); V1 is the volume of NaOH solution consumed to titrate the filtrate (mL); V0 is volume of NaOH solution consumed to titrate 20 mL ultrapure water (mL); Vs is the volume of filtrate used to titrate (mL); m is the total mass of strawberry used to prepare the slurry (mg); f is the conversion factor of citric acid, which is 0.064 g/mmol.
The content of total soluble solids (TSS) was determined using an Abbe refractometer (2WAJ, Shanghai optical instrument five factory Co., Ltd., China) and was expressed in percentage.

2.5. Statistical Analysis

All the experiments were carried out in triplicate for each group and reported as means ± standard errors. Data were statistically compared among groups by one-way analysis of variance (ANOVA). The significance of the mean value was determined by Duncan’s multiple range testing with p < 0.05.

3. Results and Discussion

3.1. Characterization of Corrugated Cardboard and Box

3.1.1. Physical Properties of Corrugated Cardboard and Box

The physical properties of the coated corrugated cardboard and box were measured and given in Table 1. The thickness of cardboard increased about 0.05~0.06 mm after coating, while the moisture content increased by 3.4%~3.5% due to the hydrophilic nature of PVA and chitosan. There was no significant difference in thickness and moisture content among 3 g/L NaClO2, 6 g/L NaClO2 and 9 g/L NaClO2 cardboard. However, the strength of cardboard was compromised by coating. According to the data shown in Table 1, PS, ECS, and FCS of all the coated cardboard decreased by about 3%, 28% and 20%, respectively, compared with control. This might be attributed to the increased moisture content, which softened the cardboards [24]. As a result, BCS of the coated box, which mainly depended on ECS of the cardboard, was reduced by 35%~38% compared with that of control. However, the maximum number of stacking layers of the box packed with strawberries was calculated to be 50 according to the Chinese National Standard GB/T 6543-2008, which was still able to meet the practical needs.

3.1.2. ClO2 Release Behavior from the Coated Corrugated Cardboard

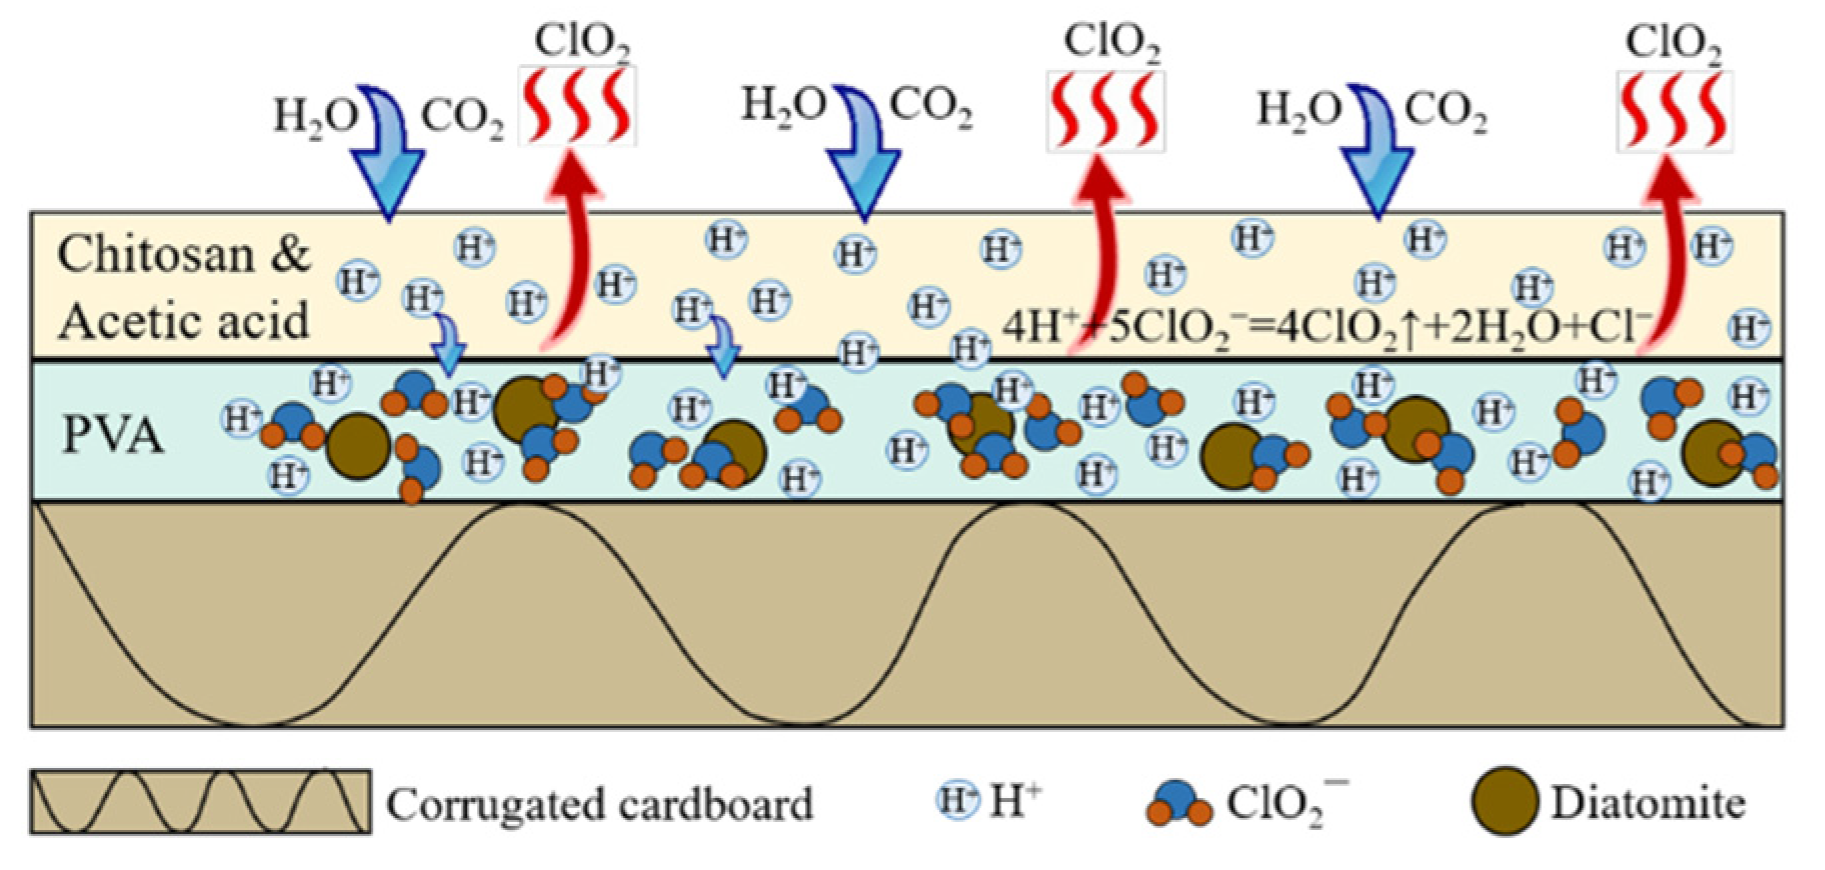
According to the reaction formula: 4 H + + 5 ClO 2 = 4 ClO 2 + 2 H 2 O + Cl , NaClO2 embedded in the coating layer of corrugated cardboard has to contact with H+ to produce gaseous ClO2 [19]. Therefore, a chitosan layer containing acetic acid has been coated on the top of the PVA-diatomite-NaClO2 layer to provide H+. Chitosan and PVA are hydrophilic polymers, which absorb water molecules and swell in a high humidity environment. Therefore, H+ provided by acetic acid is able to move freely in the coatings and contact with ClO2 to produce gaseous ClO2. In order to verify this hypothesis, the releasing of ClO2 from coated cardboard was conducted at 100% RH and 0% RH, respectively. As shown in Figure 1a, ClO2 was detected in the desiccator containing 9 g/L NaClO2 cardboard at 100% RH since day 1, which reached the maximum concentration on day 3 and decreased gradually until day 14. However, no ClO2 was detected to be released from 9 g/L NaClO2 cardboard at 0% RH during the whole experiment. Bai et al. also found that ClO2 released at a very low rate from the label system under dry condition [20]. It clearly demonstrated that ClO2 could only be released when the cardboard was exposed to moisture. Therefore, the coated cardboard can be conveniently stored in a dry environment to avoid the loss of ClO2 prior to use. When applied as packaging of fruits and vegetables, a high humidity environment would be formed inside the box owing to the transpiration of produce, thus triggering the release of ClO2.
The release behavior of ClO2 from the coated cardboard with and without diatomite (9 g/L NaClO2 and 9 g/L NaClO2 (No diatomite)) at 100% RH was also compared in Figure 1a. The results indicated that 9 g/L NaClO2 (No diatomite) showed a higher concentration of ClO2 since day 3 and reached the maximum value on day 4. However, the ClO2 concentration of 9 g/L NaClO2 (No diatomite) decreased rapidly after day 4 and dropped to 0 on day 11, while 9 g/L NaClO2 continued to release ClO2 until day 13. It demonstrated that the incorporation of diatomite together with NaClO2 in PVA coating stabilized and prolonged the release of ClO2. Diatomite is a siliceous sedimentary rock, well known by its finely porous structure and excellent adsorption property. Therefore, when it was mixed with NaClO2 in PVA, some ions of ClO2might be absorbed into the porous channels of diatomite, thus slowing down their reaction with H+. The release process of ClO2 from the coated cardboard containing diatomite is schematically shown in Figure 2.
The release behavior of ClO2 also depended on the NaClO2 concentration in the coated cardboard. As presented in Figure 1b, the increased NaClO2 concentration not only increased the concentration of ClO2 released in the desiccator but also extend the releasing time. ClO2 was not detected after day 4 for 3 g/L NaClO2, but it was continuously released from 6 g/L NaClO2 and 9 g/L NaClO2 until day 9 and day 14, respectively. Figure 1c presented the increased release efficiency of ClO2 with time. The ultimate release efficiency of 9 g/L NaClO2 was also higher compared to 6 g/L NaClO2 and 3 g/L NaClO2. However, the release efficiency of all the coated cardboards was relatively low, which might be attributed to the loss during preparation and test.

3.2. Effects of the Coated Corrugated Box on Strawberry Preservation

3.2.1. Decay Rate

The decay rate of strawberry increased rapidly when stored at room temperature. As shown in Figure 3a, strawberries packed in control box started to decay on day 2, which showed a decay rate higher than 80% on day 5. However, the decay rate of strawberries packed in 6 g/L NaClO2 and 9 g/L NaClO2 boxes was two times lower compared to that packed in control on day 3. The appearance of strawberries shown in Figure 3b clearly revealed the mold growth was greatly inhibited when they were packed in 6 g/L NaClO2 and 9 g/L NaClO2 boxes, which indicated the successful release of ClO2 in these boxes. In the boxes, water vapor and CO2 were able to be constantly produced by the active transpiration and respiration process of strawberries, which would be absorbed by the chitosan and PVA coatings on the cardboard and result in swelling of polymers chains and penetration of H+ to react with ClO2. As a result, gaseous ClO2 was constantly produced and released from the coating layer, which diffused to the surface of strawberries and killed the microorganisms via various mechanisms [25].
Moreover, the decay rate of strawberries was also highly influenced by the concentration of NaClO2 in the coating layer of coated boxes. Strawberries packed in 9 g/L NaClO2 corrugated boxes presented the lowest decay rate among all the groups during storage, while 6 g/L NaClO2 presented a rapidly increased decay rate from day 4. According to the release behavior given in Figure 2, the coated cardboard with a higher content of NaClO2 was able to release more ClO2 in a longer time period, which led to a sustainable antimicrobial effect.

3.2.2. Weight Loss

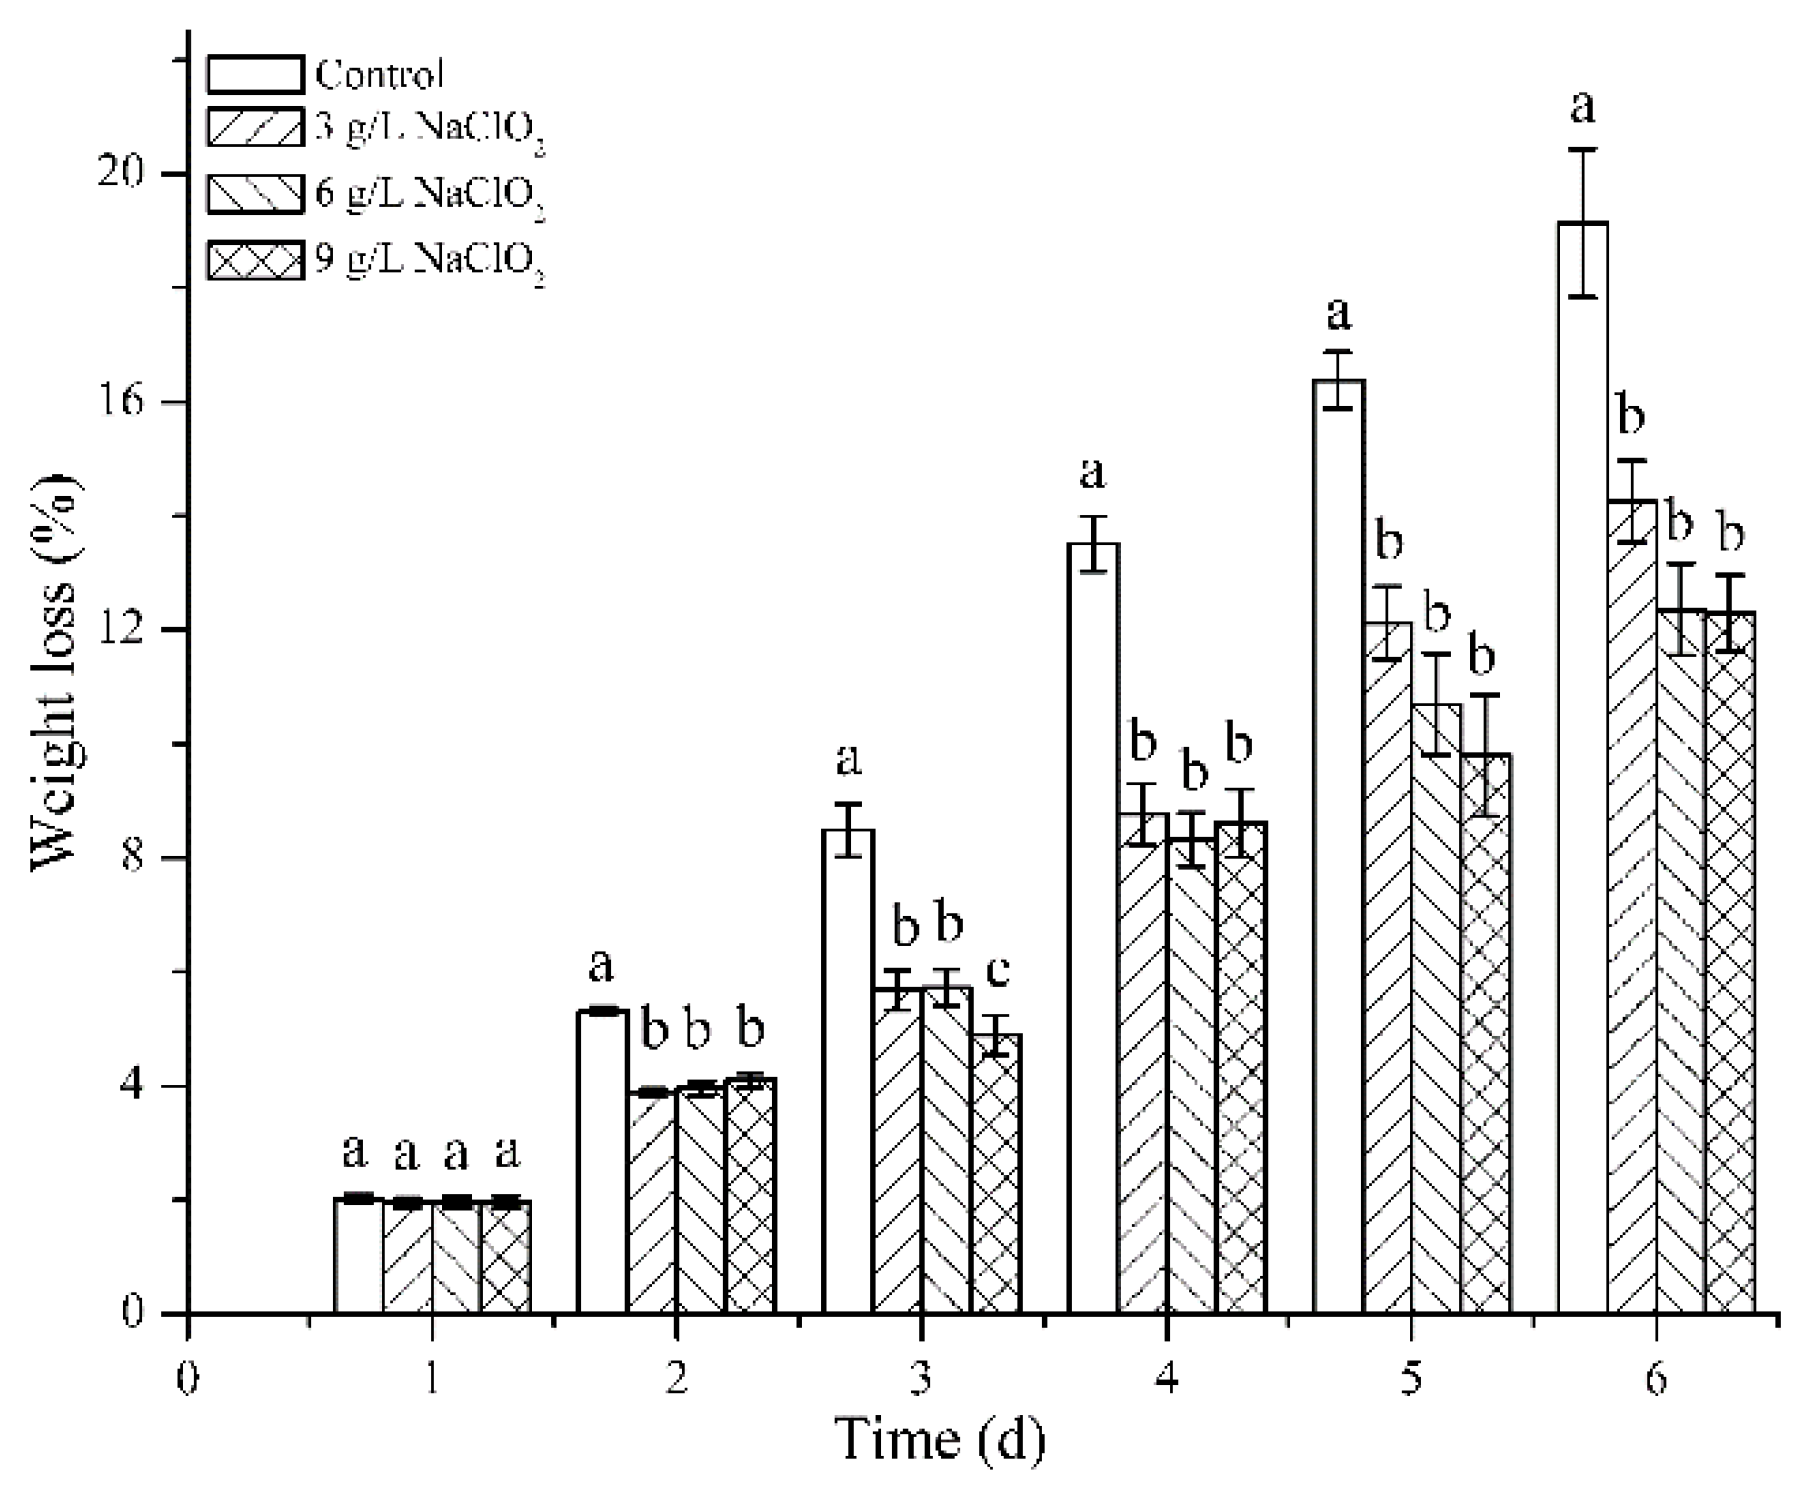
Postharvest fruit keeps losing weight due to transpiration, which will considerably affect its appearance, texture, taste and nutritional quality. Weight loss is particularly serious in strawberry due to its high water content and fragile surface. As shown in Figure 4, weight loss of control increased rapidly with time, which reached almost 20% at day 6. However, strawberries packed in 3 g/L NaClO2, 6 g/L NaClO2 and 9 g/L NaClO2 boxes showed significantly lower weight loss compared to that of control, and no significant difference was observed among these groups except for on day 3. The results indicated that weight loss of strawberry was significantly reduced by the ClO2 treatment, but it was not denpendent on the ClO2 concentration within the concentration range used in this study. Similar effects of ClO2 releasing pad on the treated strawberries stored below 10 °C have been reported by Wang et al. [16]. They attributed the reduced weight loss of strawberries to the closure of stomatal pore and reduction in the metabolism activities of fruits.

3.2.3. Surface Color

The surface color of strawberries not only reflects the freshness and maturity, but also indicates the changes of internal substances. During the storage of strawberry, loss of brightness with increasing time was visible and was evidenced by the significantly decreased value of L* as listed in Table 2. However, strawberries packed in 9 g/L NaClO2 boxes showed significantly higher L* and a* values since day 2 in comparison with that of control, which indicated their better maintained brightness and red color, thus making them more preferred by the consumer. Arango et al. [26] observed the discoloration of strawberries after treatment with ClO2 due to the oxidative bleaching effect, but it depended on the concentration of ClO2 and exposure time. Therefore, the concentration of ClO2 released from the coated box in this study was not high enough to cause the bleaching of strawberries.

3.2.4. Firmness

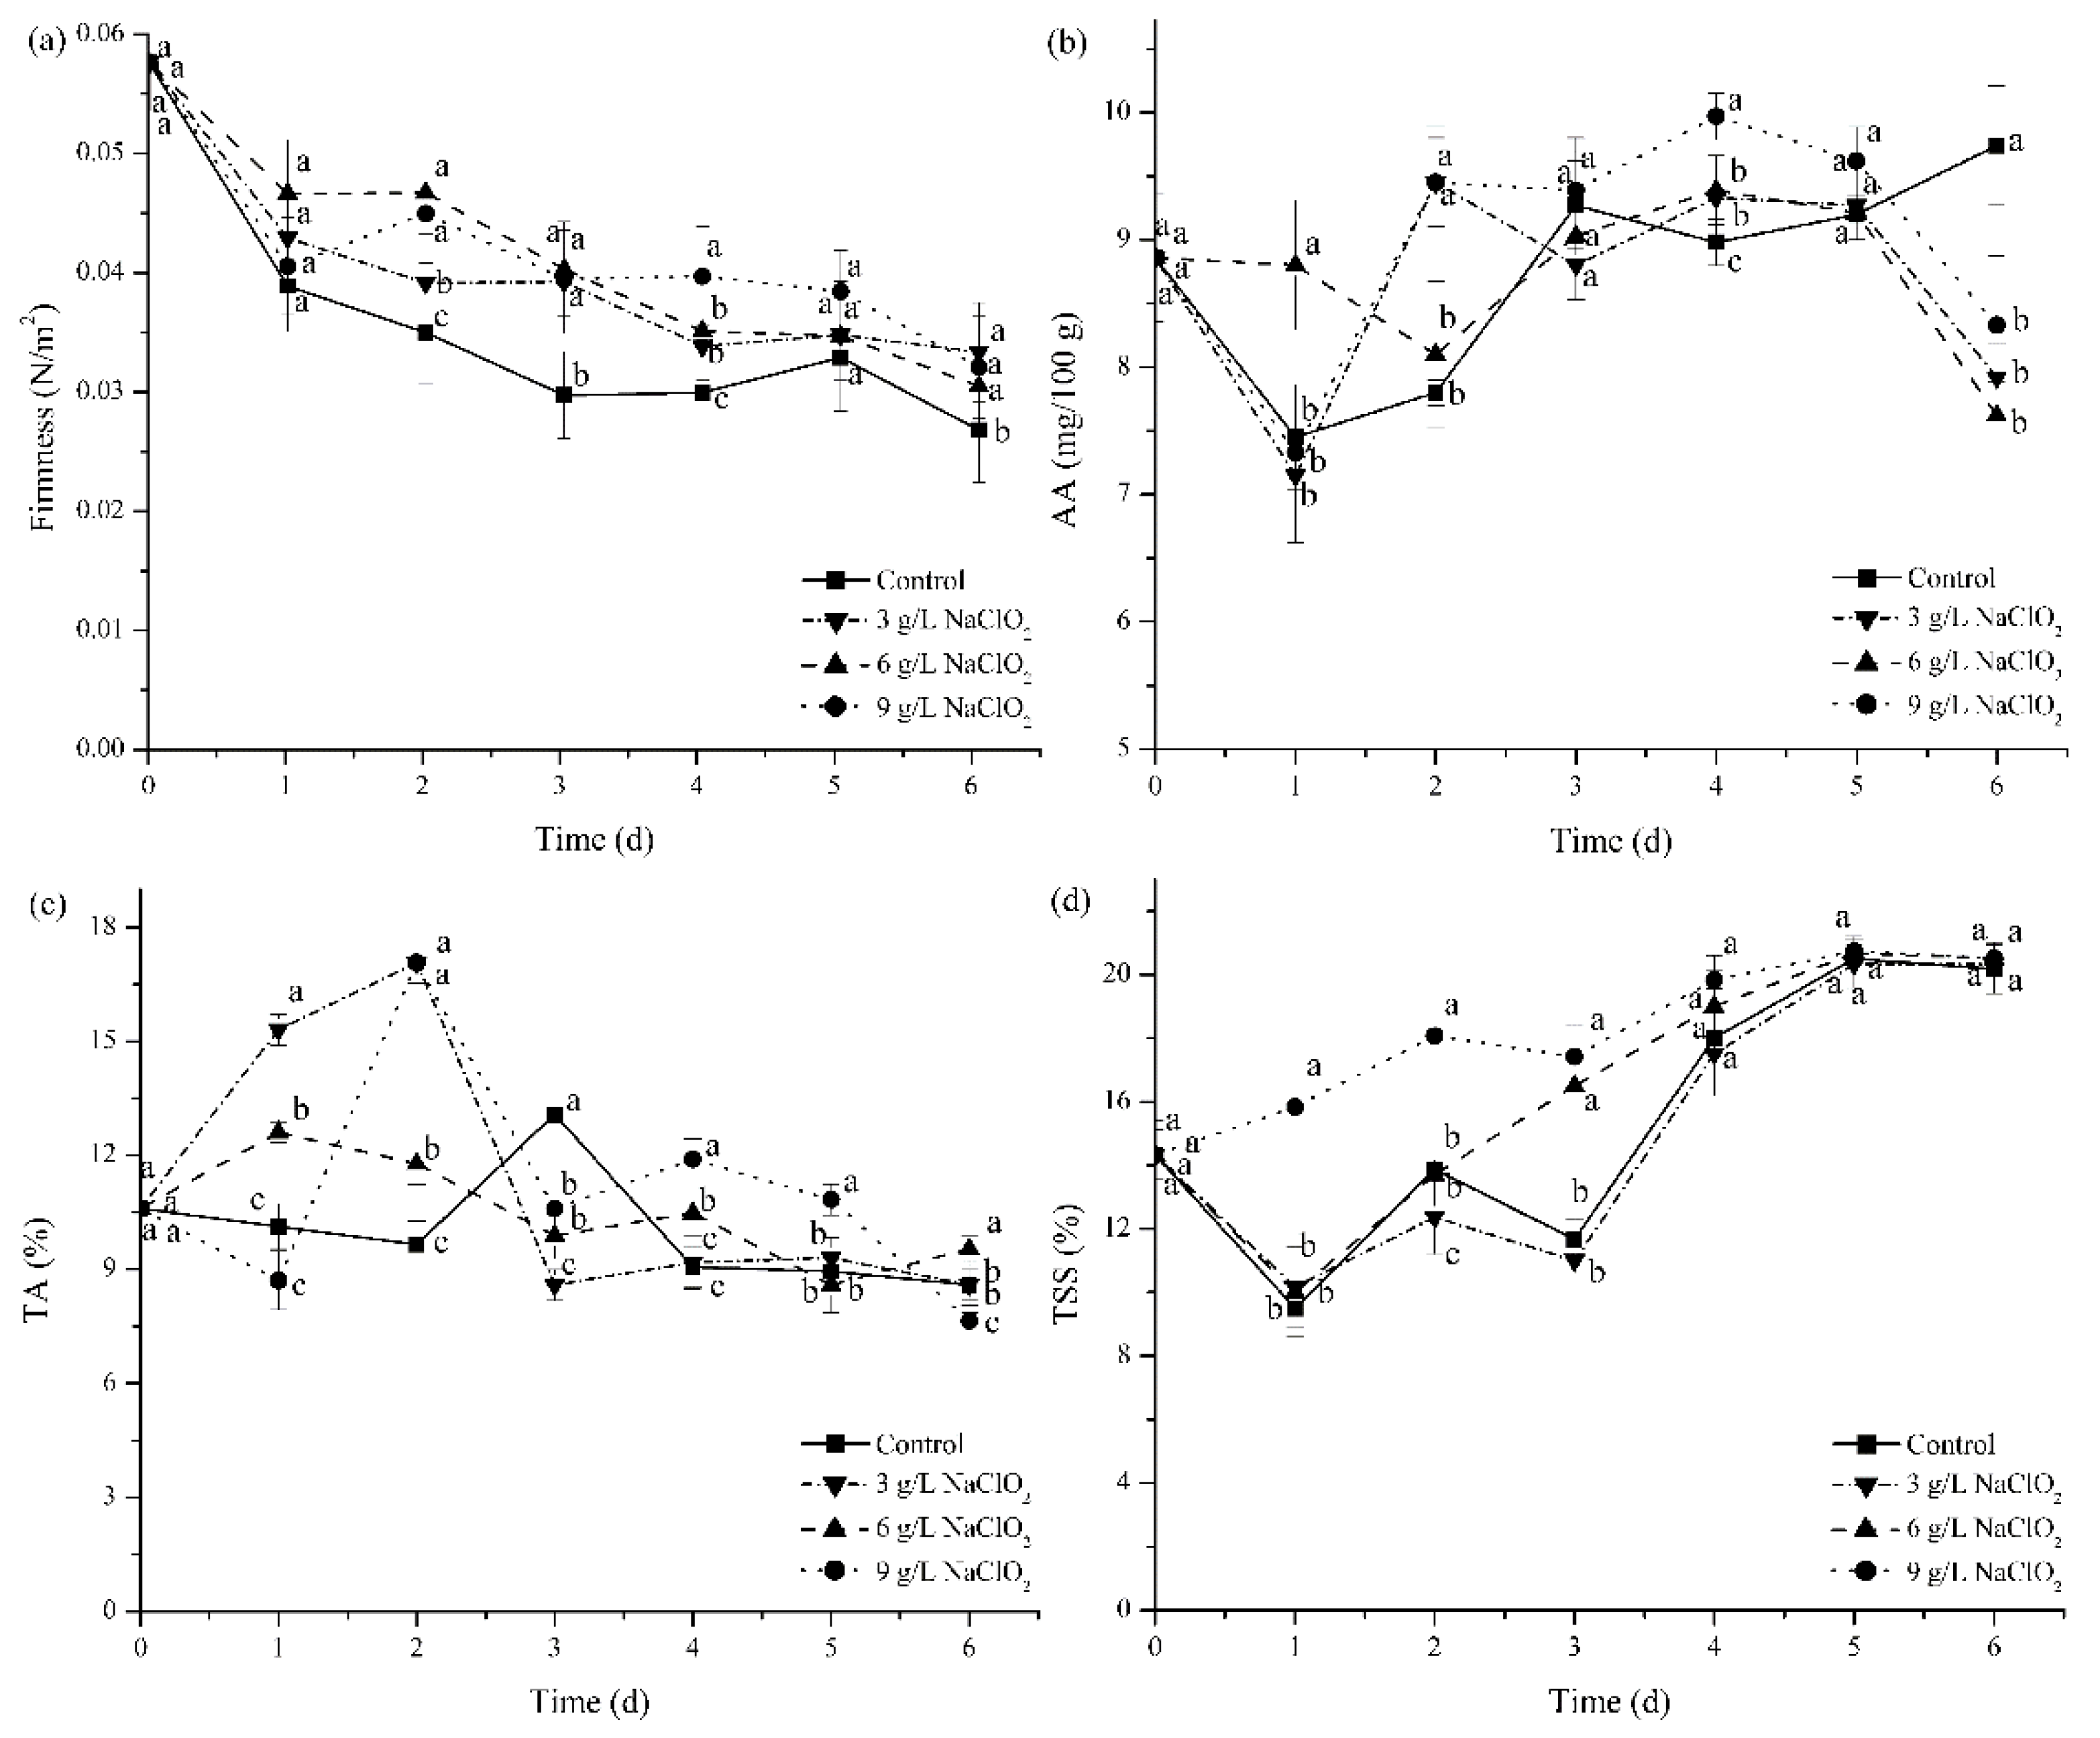
During storage, the firmness of all the groups decreased as shown in Figure 5a. However, control presented the lowest firmness among all the groups since day 2, which demonstrated that the firmness of strawberries packed in 6 g/L NaClO2, and 9 g/L NaClO2 was better maintained by ClO2 treatment. The delayed softening of fruit by ClO2 treatment has been widely reported [3], which was mainly related to the reduced metabolism and inhibited activities of enzymes.

3.2.5. Content of AA, TA, and TSS

AA, TA, and TSS are important nutrients, which are also involved in the postharvest activities of strawberries. AA helps to clean up free radicals in fruits, TA content is closely related to the flavour, while TSS are the substrates of metabolism activities [27]. As shown in Figure 5b–d, the strawberries packed in the coated box, particularly 9 g/L NaClO2, showed relatively higher content of AA, TA and TSS during storage. Therefore, it indicated that ClO2 treatment help keep the content of these nutrients in strawberries during storage, which might be attributed to the reduced consumption of these nutrients as the ripening process was slowed down.

4. Conclusions

In this study, ClO2 controlled-release corrugated boxes were successfully prepared by a two-layers coating of PVA-NaClO2-diatomite mixture and chitosan acetic acid solution. Results showed that in a high humidity environment, water vapor was able to swell chitosan and PVA layer to release H+, which react with NaClO2 to release gaseous ClO2, while diatomite was effective in stabilizing the release. With increasing NaClO2 concentrations in the coating, more ClO2 was released in an extended time period. When the coated corrugated box was used as the packaging of fresh strawberries, gaseous ClO2 was able to be released under the trigger of moisture and CO2 generated by the respiration and transpiration of strawberries. Therefore, inhibited decay, reduced weight loss, better-maintained surface color and nutrients content in strawberries packed in 9 g/L NaClO2 box were observed in comparison with those packed in control. Therefore, the well-designed coated corrugated box with the advantages of safety, effectiveness and feasibility, has great potential to be used as fresh-keeping packaging of fresh fruits and vegetables.

Author Contributions

Conceptualization, D.X. and Y.L.; Methodology, Y.L.; Writing—Original Draft Preparation, Y.L.; Writing—Review and Editing, D.X. and D.R.; Funding Acquisition, D.X. All authors have read and agreed to the published version of the manuscript.

Funding

This research was funded by the National Natural Science Foundation of China (31772028) and the Fundamental Research Funds for the Central Universities of China (XDJK2020B042).

Conflicts of Interest

The authors declare there is no conflict of interest.

References

  1. Arango, J.; Rubino, M.I.; Auras, R.; Rachford, A.A.; Bai, Z.; Grzesiak, A.L.; Kijchavengkul, T. In situ quantification of chlorine dioxide gas consumption by fresh produce using UV–visible spectroscopy. J. Food Eng. 2014, 131, 75–81. [Google Scholar] [CrossRef]
  2. Benbettaieb, N.; Debeaufort, F.; Karbowiak, T. Bioactive edible films for food applications: mechanisms of antimicrobial and antioxidant activity. Crit. Rev. Food Sci. Nutr. 2019, 59, 3431–3455. [Google Scholar] [CrossRef] [PubMed]
  3. Praeger, U.; Herppich, W.B.; Hassenberg, K. Aqueous chlorine dioxide treatment of horticultural produce: Effects on microbial safety and produce quality—A review. Crit. Rev. Food Sci. Nutr. 2018, 58, 318–333. [Google Scholar] [CrossRef] [PubMed]
  4. Han, Y.; Floros, J.D.; Linton, R.H.; Nielsen, S.S.; Nelson, P.E. Response surface modeling for the inactivation of Escherichia coli O157:H7 on green peppers (Capsicum annuum L.) by chlorine dioxide gas treatments. J. Food Prot. 2010, 67, 1188–1193. [Google Scholar] [CrossRef] [PubMed]
  5. Golden, C.E.; Berrang, M.E.; Kerr, W.L.; Harrison, M.A. Slow-release chlorine dioxide gas treatment as a means to reduce Salmonella contamination on spices. Innov. Food Sci. Emerg. Technol. 2019, 52, 256–261. [Google Scholar] [CrossRef]
  6. Eryilmaz, M.; Kaskatepe, B.; Kiymaci, M.E.; Erol, H.B.; Simsek, D.; Gumustas, A. In vitro antimicrobial activity of three new generation disinfectants. Trop. J. Pharm. Res. 2016, 15, 2191–2195. [Google Scholar] [CrossRef] [Green Version]
  7. Lee, H.; Ryu, J.H.; Kim, H. Antimicrobial activity of gaseous chlorine dioxide against Aspergillus flavus on green coffee beans. Food Microbiol. 2020, 86, 103308. [Google Scholar] [CrossRef]
  8. Yan, R.; Chen, Q.; Fu, M. Chlorine dioxide generation method and it’s action mechanism for removing harmful substances and maintaining quality attributes of agricultural products. Food Bioprocess Technol. 2019, 12, 1110–1122. [Google Scholar]
  9. Qin, G.; Wu, B.; Peng, X.; Wang, J.; Li, Q.; Jing, J.; Ha, Y. Effects of chlorine dioxide treatment on respiration rate and ethylene synthesis of postharvest tomato fruit. Postharvest Biol. Technol. 2014, 93, 9–14. [Google Scholar]
  10. Chumyam, A.; Shank, L.; Uthaibutra, J.; Saengnil, K. Effects of chlorine dioxide on mitochondrial energy levels and redox status of ‘Daw’ longan pericarp during storage. Postharvest Biol. Technol. 2016, 116, 26–35. [Google Scholar] [CrossRef]
  11. Sun, X.; Zhou, B.; Luo, Y.; Ference, C.; Baldwin, E.; Harrison, K.; Bai, J. Effect of controlled-release chlorine dioxide on the quality and safety of cherry/grape tomatoes. Food Control 2017, 82, 26–30. [Google Scholar] [CrossRef]
  12. Zhang, B.; Huang, C.; Zhang, L.; Wang, J.; Huang, X.; Zhao, Y.; Liu, Y.; Li, C. Application of chlorine dioxide microcapsule sustained-release antibacterial films for preservation of mangos. J. Food Sci. Technol.-Mys. 2019, 56, 1095–1103. [Google Scholar] [CrossRef] [PubMed]
  13. Fu, M.R.; Zhang, X.M.; Jin, T.; Li, B.Q.; Zhang, Z.Q.; Tian, S.P. Inhibitory of grey mold on green pepper and winter jujube by chlorine dioxide (ClO2) fumigation and its mechanisms. LWT-Food Sci. Technol. 2019, 100, 335–340. [Google Scholar] [CrossRef]
  14. Yang, H.; Zheng, J.; Huang, C.; Zhao, X.; Chen, H.; Sun, Z. Effects of combined aqueous chlorine dioxide and chitosan coatings on microbial growth and quality maintenance of fresh-cut bamboo shoots (Phyllostachys praecox f. prevernalis.) during storage. Food Bioprocess Technol. 2015, 8, 1011–1019. [Google Scholar] [CrossRef]
  15. Wei, J.; Chen, Y.; Tiemur, A.; Wang, J.; Wu, B. Degradation of pesticide residues by gaseous chlorine dioxide on table grapes. Postharvest Biol. Technol. 2018, 137, 142–148. [Google Scholar] [CrossRef]
  16. Wang, Z.; Narciso, J.; Biotteau, A.; Plotto, A.; Baldwin, E.; Bai, J. Improving storability of fresh strawberries with controlled release chlorine dioxide in perforated clamshell packaging. Food Bioprocess Technol. 2014, 7, 3516–3524. [Google Scholar] [CrossRef]
  17. Sun, X.; Bai, J.; Ference, C.; Wang, Z.; Zhang, Y.; Narciso, J.; Zhou, K. Antimicrobial activity of controlled-release chlorine dioxide gas on fresh blueberries. J. Food Prot. 2014, 77, 1127–1132. [Google Scholar] [CrossRef]
  18. Chen, M.; Chen, X.; Yam, K. Encapsulation complex of chlorine dioxide in alpha-cyclodextrin: Structure characterization and release property. Food Control 2020, 107, 106783. [Google Scholar] [CrossRef]
  19. Saade, C.; Annous, B.A.; Gualtieri, A.J.; Schaich, K.M.; Liu, L.; Yam, K.L. System feasibility: Designing a chlorine dioxide self-generating package label to improve fresh produce safety part II: Solution casting approach. Innov. Food. Sci. Emerg. Technol. 2018, 47, 110–119. [Google Scholar] [CrossRef]
  20. Bai, Z.; Cristancho, D.E.; Rachford, A.A.; Reder, A.L.; Williamson, A.; Grzesiak, A.L. Controlled release of antimicrobial ClO2 gas from a two-layer polymeric film system. J. Agric. Food Chem. 2016, 64, 8647–8652. [Google Scholar] [CrossRef]
  21. Li, S.; Xiao, S.; Luo, Y. Effect of preservative paper coating on NaClO2 retention rate and ClO2 release rule. Packag. Eng. 2017, 38, 31–35. [Google Scholar]
  22. Cao, J.; Jiang, W.; Zhao, Y. Physiological and Biochemical Experiment Guidance of Postharvest Fruits and Vegetables, 1st ed.; China Light Industry Book Press: China, Beijing, 2007; pp. 37–39. [Google Scholar]
  23. Aghaeifard, F.; Babalar, M.; Fallahi, E.; Ahmadi, A. Influence of humic acid and salicylic acid on yield, fruit quality, and leaf mineral elements of strawberry (fragaria × ananassa duch.) cv. camarosa. J. Plant Nutr. 2015, 39, 1821–1829. [Google Scholar] [CrossRef]
  24. Fadiji, T.; Berry, T.M.; Coetzee, C.J.; Opara, U.L. Mechanical design and performance testing of corrugated paperboard packaging for the postharvest handling of horticultural produce. Biosys. Eng. 2018, 171, 220–244. [Google Scholar] [CrossRef]
  25. Sun, X.; Baldwin, E.; Bai, J. Applications of gaseous chlorine dioxide on postharvest handling and storage of fruits and vegetables—A review. Food Control 2019, 95, 18–26. [Google Scholar] [CrossRef]
  26. Arango, J.; Rubino, M.; Auras, R.; Gillett, J.; Schilder, A. Evaluation of chlorine dioxide as an antimicrobial against Botrytis cinerea in California strawberries. Food Packaging Shelf 2016, 9, 45–54. [Google Scholar] [CrossRef] [Green Version]
  27. Nguyen, V.T.B.; Nguyen, D.H.H.; Nguyen, H.V.H. Combination effects of calcium chloride and nano-chitosan on the postharvest quality of strawberry (Fragaria × ananassa Duch.). Postharvest Biol. Technol. 2020, 162, 111103. [Google Scholar] [CrossRef]
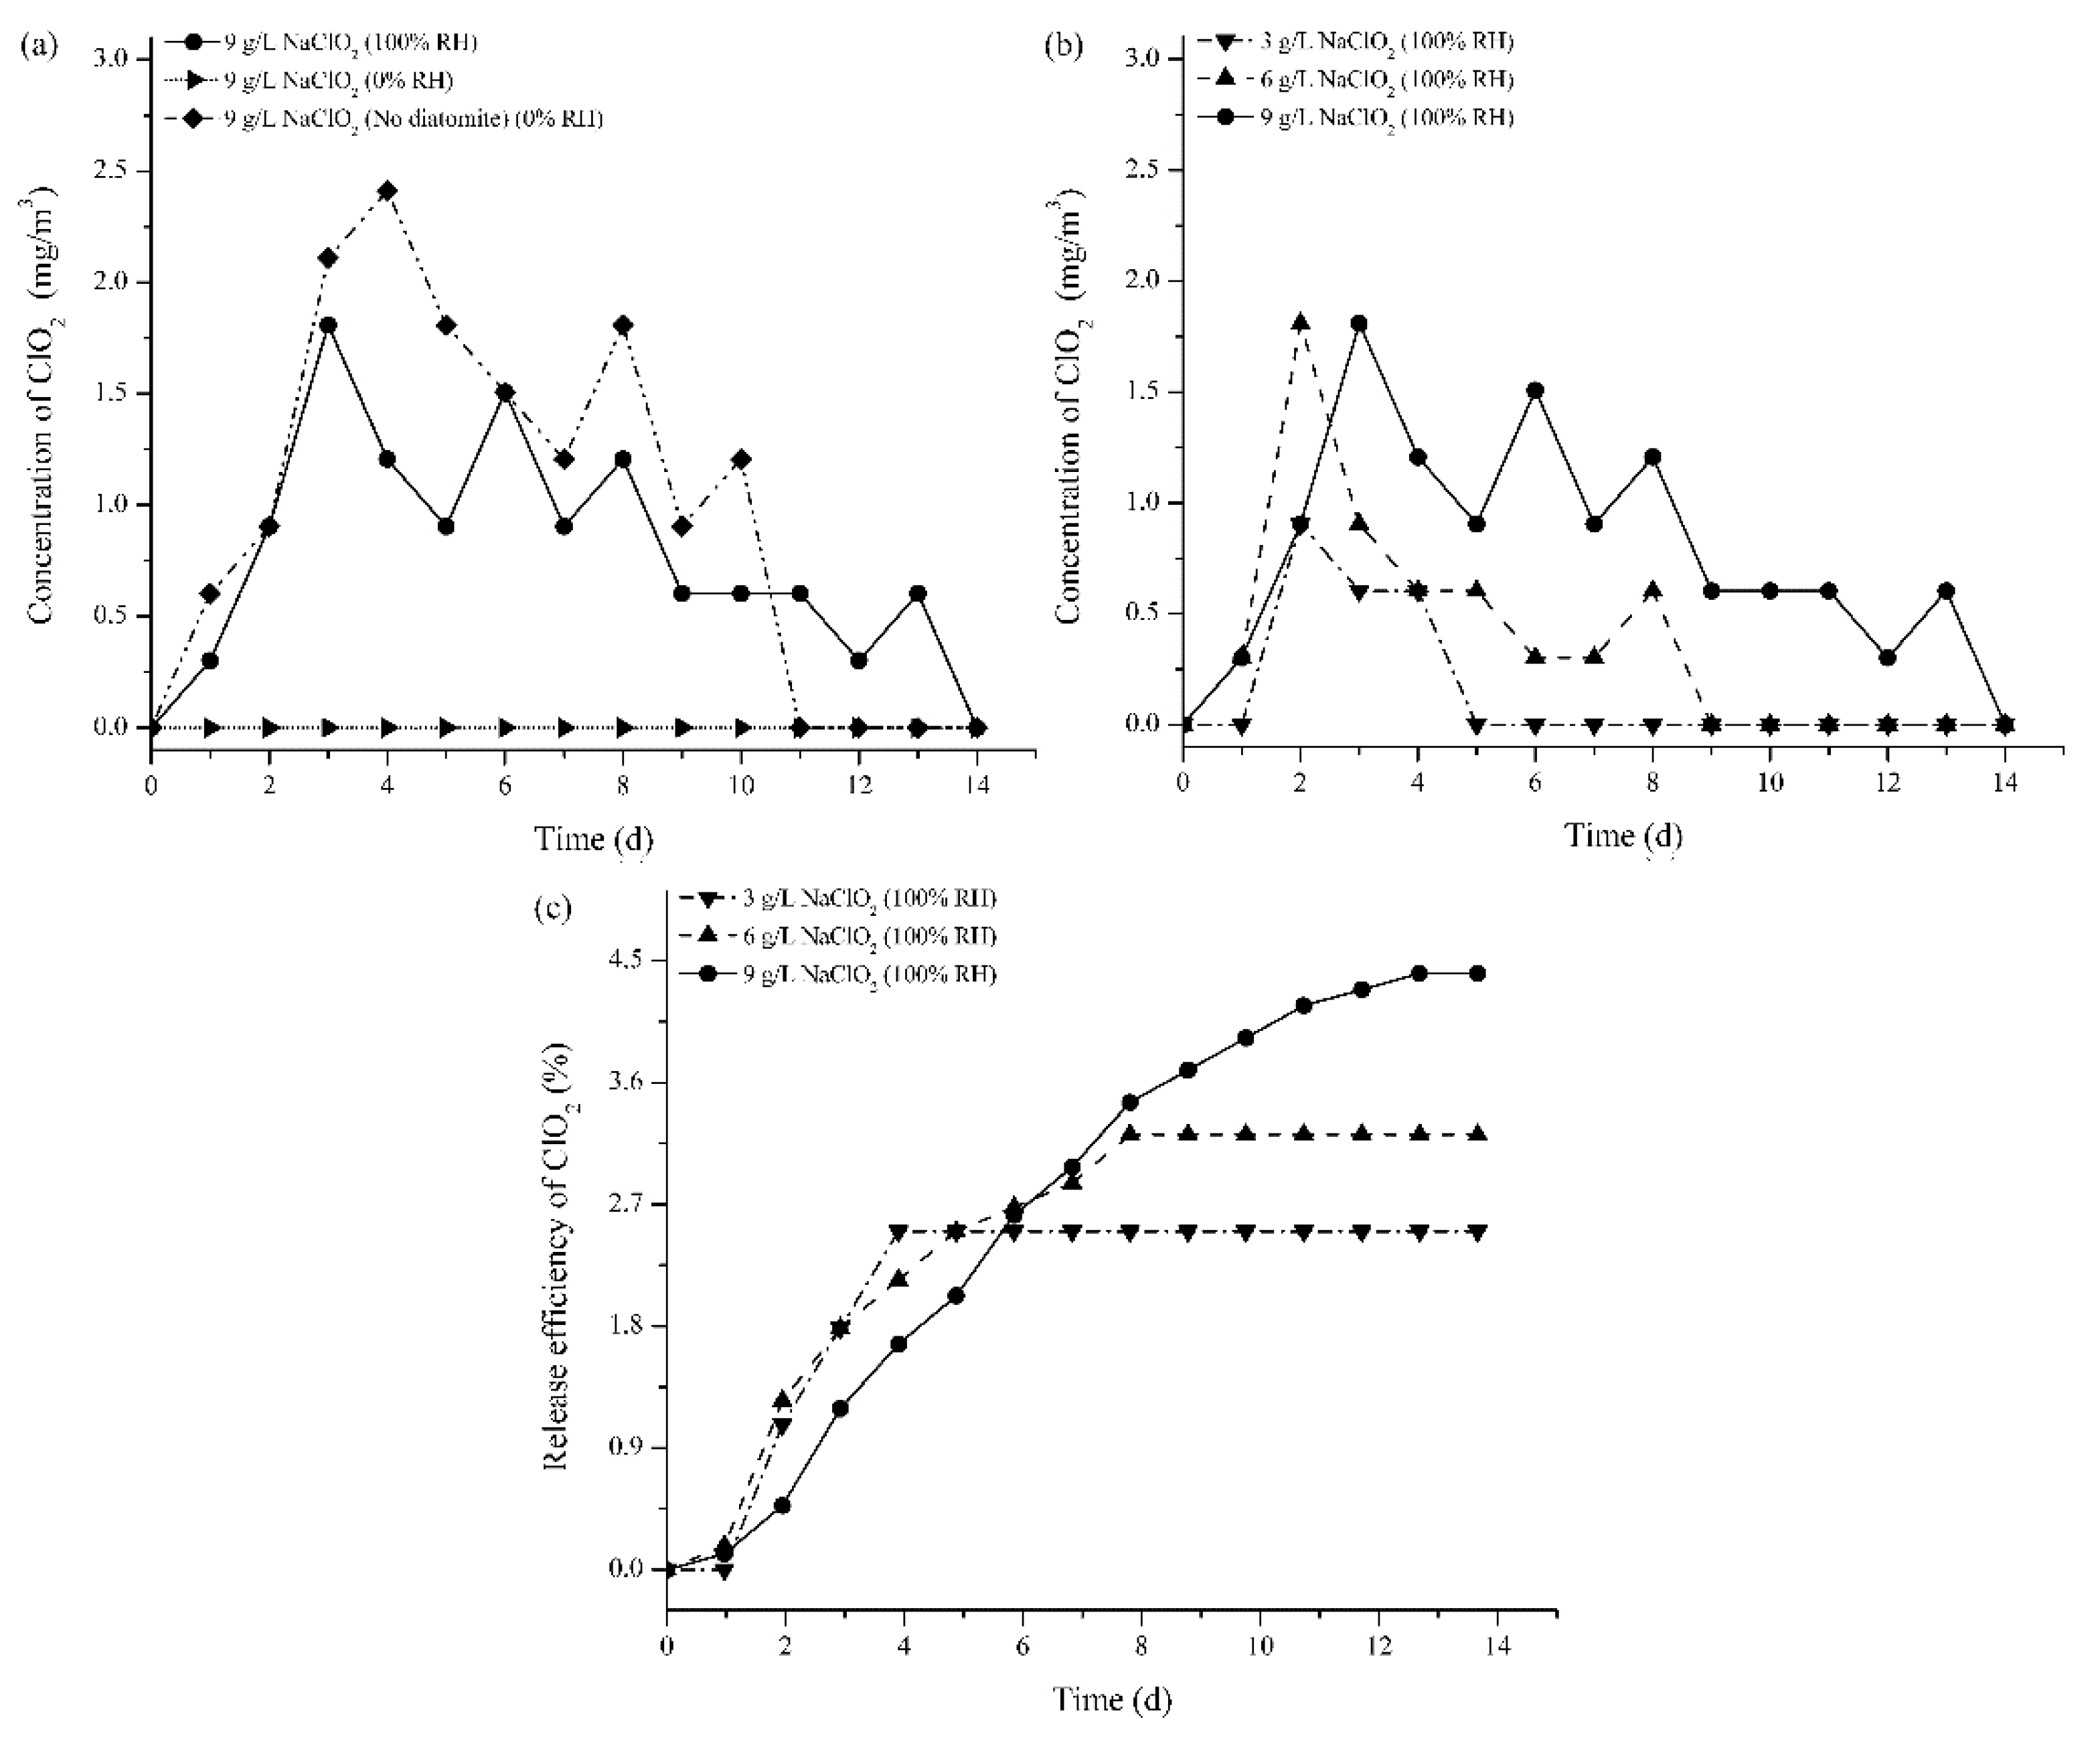
Figure 1. The release behaviors of ClO2 from the coated corrugated cardboards: (a) effects of relative humidity and diatomite on the release rate; (b) effects of NaClO2 concentration on the release rate; (c) effects of NaClO2 concentration on the release efficiency.
Coatings 10 00242 g001
Figure 2. Schematic diagram of the release process of ClO2 from the coated corrugated cardboard.
Coatings 10 00242 g002
Figure 3. The decay rate (a) and appearance (b) of strawberries packed in different corrugated cardboard boxes during storage at room temperature.
Coatings 10 00242 g003
Figure 4. Weight loss of strawberries packed in different corrugated cardboard boxes during storage at room temperature. Means of differenct samples with different letters (a, b, c) on the same day of storage were significantly different (P > 0.05).
Coatings 10 00242 g004
Figure 5. Firmness (a), AA content (b), TA content (c) and TSS content (d) of strawberries packed in different corrugated cardboard boxes during storage at room temperature. Means of different samples with different letters (a, b, c) on the same day of storage were significantly different (P > 0.05).
Coatings 10 00242 g005
Table 1. Thickness, moisture content and strength index of corrugated cardboard and box.
SamplesThickness
(mm)
Moisture Content (%)PS
(J)
ECS
(kN/m)
FCS
(kPa)
BCS
(N)
Control1.59 ± 0.02b12.69 ± 0.36b4.75 ± 0.03a1.25 ± 0.12a65.40 ± 3.44a587.22 ± 59.97a
3 g/L NaClO21.66 ± 0.01a16.17 ± 0.67a4.58 ± 0.06b0.91 ± 0.10b52.77 ± 5.24b382.71 ± 41.47b
6 g/L NaClO21.66 ± 0.02a16.11 ± 0.53a4.57 ± 0.05b0.90 ± 0.08b53.41 ± 3.09b366.93 ± 21.90b
9 g/L NaClO21.64 ± 0.01a16.17 ± 0.45a4.67 ± 0.05b0.90 ± 0.08b52.01 ± 3.27b363.65 ± 22.20b
Different lowercase superscripts (a, b) within the same column indicate significant differences among the mean values of different groups (P < 0.05).
Table 2. Color parameters of strawberries packed in different corrugated cardboard boxes during storage at room temperature.
Color ParameterStorage Time (d)
0246
L*Control31.84 ± 3.98aA28.59 ± 2.29bB26.87 ± 1.78bB21.09 ± 3.40abC
3 g/L NaClO231.84 ± 3.98aA29.13 ± 1.84abB27.20 ± 2.16abB20.62 ± 2.04bC
6 g/L NaClO231.84 ± 3.98aA29.26 ± 2.18abB28.75 ± 1.45aB21.04 ± 2.63abC
9 g/L NaClO231.84 ± 3.98aA30.29 ± 2.11aAB28.98 ± 1.77aB22.76 ± 0.99aC
a*Control37.94 ± 1.27aA32.55 ± 1.97bB31.41 ± 2.18bB31.51 ± 3.69cB
3 g/L NaClO237.94 ± 1.27aA34.49 ± 1.72aB33.22 ± 1.68aC35.08 ± 1.59aB
6 g/L NaClO237.94 ± 1.27aA33.26 ± 2.90abB33.85 ± 1.96aB33.40 ± 4.51bB
9 g/L NaClO237.94 ± 1.27aA34.32 ± 2.10aB31.25 ± 1.58bC33.24 ± 1.09bB
b*Control36.29 ± 4.23aA22.43 ± 1.74cB18.47 ± 1.76cC17.63 ± 1.44aC
3 g/L NaClO236.29 ± 4.23aA24.65 ± 1.91aB20.55 ± 1.73aB14.08 ± 1.44cC
6 g/L NaClO236.29 ± 4.23aA22.43 ± 1.85cB19.63 ± 1.92bBC16.73 ± 1.72bC
9 g/L NaClO236.29 ± 4.23aA23.07 ± 1.74bB18.83 ± 1.82cC16.35 ± 1.83bC
For each color parameter, mean values in the same column with different lowercase superscript (a, b, c) are significantly different (P < 0.05); mean values in the same row with different captial letter (A, B, C) superscript are significantly different (P < 0.05).