Article

Optimization of Rice Husk Ash-Based Geopolymers Coating Composite for Enhancement in Flexural Properties and Microstructure Using Response Surface Methodology

by
Mohd Salahuddin Mohd Basri
1,*,
Faizal Mustapha
2,3,
Norkhairunnisa Mazlan
2,4 and
Mohd Ridzwan Ishak
2,3,4
1
Department of Process and Food Engineering, Faculty of Engineering, Universiti Putra Malaysia, Serdang 43400 UPM, Selangor, Malaysia
2
Department of Aerospace Engineering, Faculty of Engineering, Universiti Putra Malaysia, Serdang 43400 UPM, Selangor, Malaysia
3
Aerospace Manufacturing Research Center (AMRC), Universiti Putra Malaysia, Serdang 43400 UPM, Selangor, Malaysia
4
Institute of Tropical Forestry and Forest Products (INTROP), Universiti Putra Malaysia, Serdang 43400 UPM, Selangor, Malaysia
*
Author to whom correspondence should be addressed.
Coatings 2020, 10(2), 165; https://doi.org/10.3390/coatings10020165
Submission received: 12 December 2019 / Revised: 31 December 2019 / Accepted: 3 January 2020 / Published: 11 February 2020
(This article belongs to the Section Surface Characterization, Deposition and Modification)

Abstract

:
If the coating is sufficiently flexible, no tears, cracks, or debond will occur. Although geopolymers have a great potential as a coating material, research on the flexural properties is very limited. In this study, a three-point bending test and scanning electron microscope were used to investigate the flexural properties and microstructure of the geopolymer composite coating (GCC), respectively. Response Surface Methodology (RSM) consists of a combination of mathematical and statistical techniques, which is useful in modelling, analyzing, and optimizing responses that are influenced by several factors. It was used in determining the relationship between each factor and determining the best composition for the composite coating. Several factors were considered including ratio of activated alkaline (AA) solution (V1), RHA/AA ratio (V2), and curing temperature (V3). Results showed that the RHA/AA ratio mostly influenced the response, followed by curing temperature while the ratio of AA was not significant. Lower V2 and V3 values provided the highest flexural strength and modulus. The optimum composition which provided the best coating of flexural properties were V1 = 3.5, V2 = 0.39, and V3 = 45.7 °C. Microscopic images showed that coating with high flexural properties (ductile coating) exhibited minor and rough cracks as compared to that of coating with low flexural properties (brittle coating) which displayed a crack with a clean linear cut. Brittle coating was highly agglomerated and has a significant negative effect on the flexural properties. By developing the optimum composition, the GCC may potentially be a good alternative as a building construction coating material.

1. Introduction

Coatings have been used for many purposes such as protection, decoration, and functional. For protection, the coating has been applied in many construction applications as passive fire protection such as a suspended ceiling, cladding, or intumescent coating [
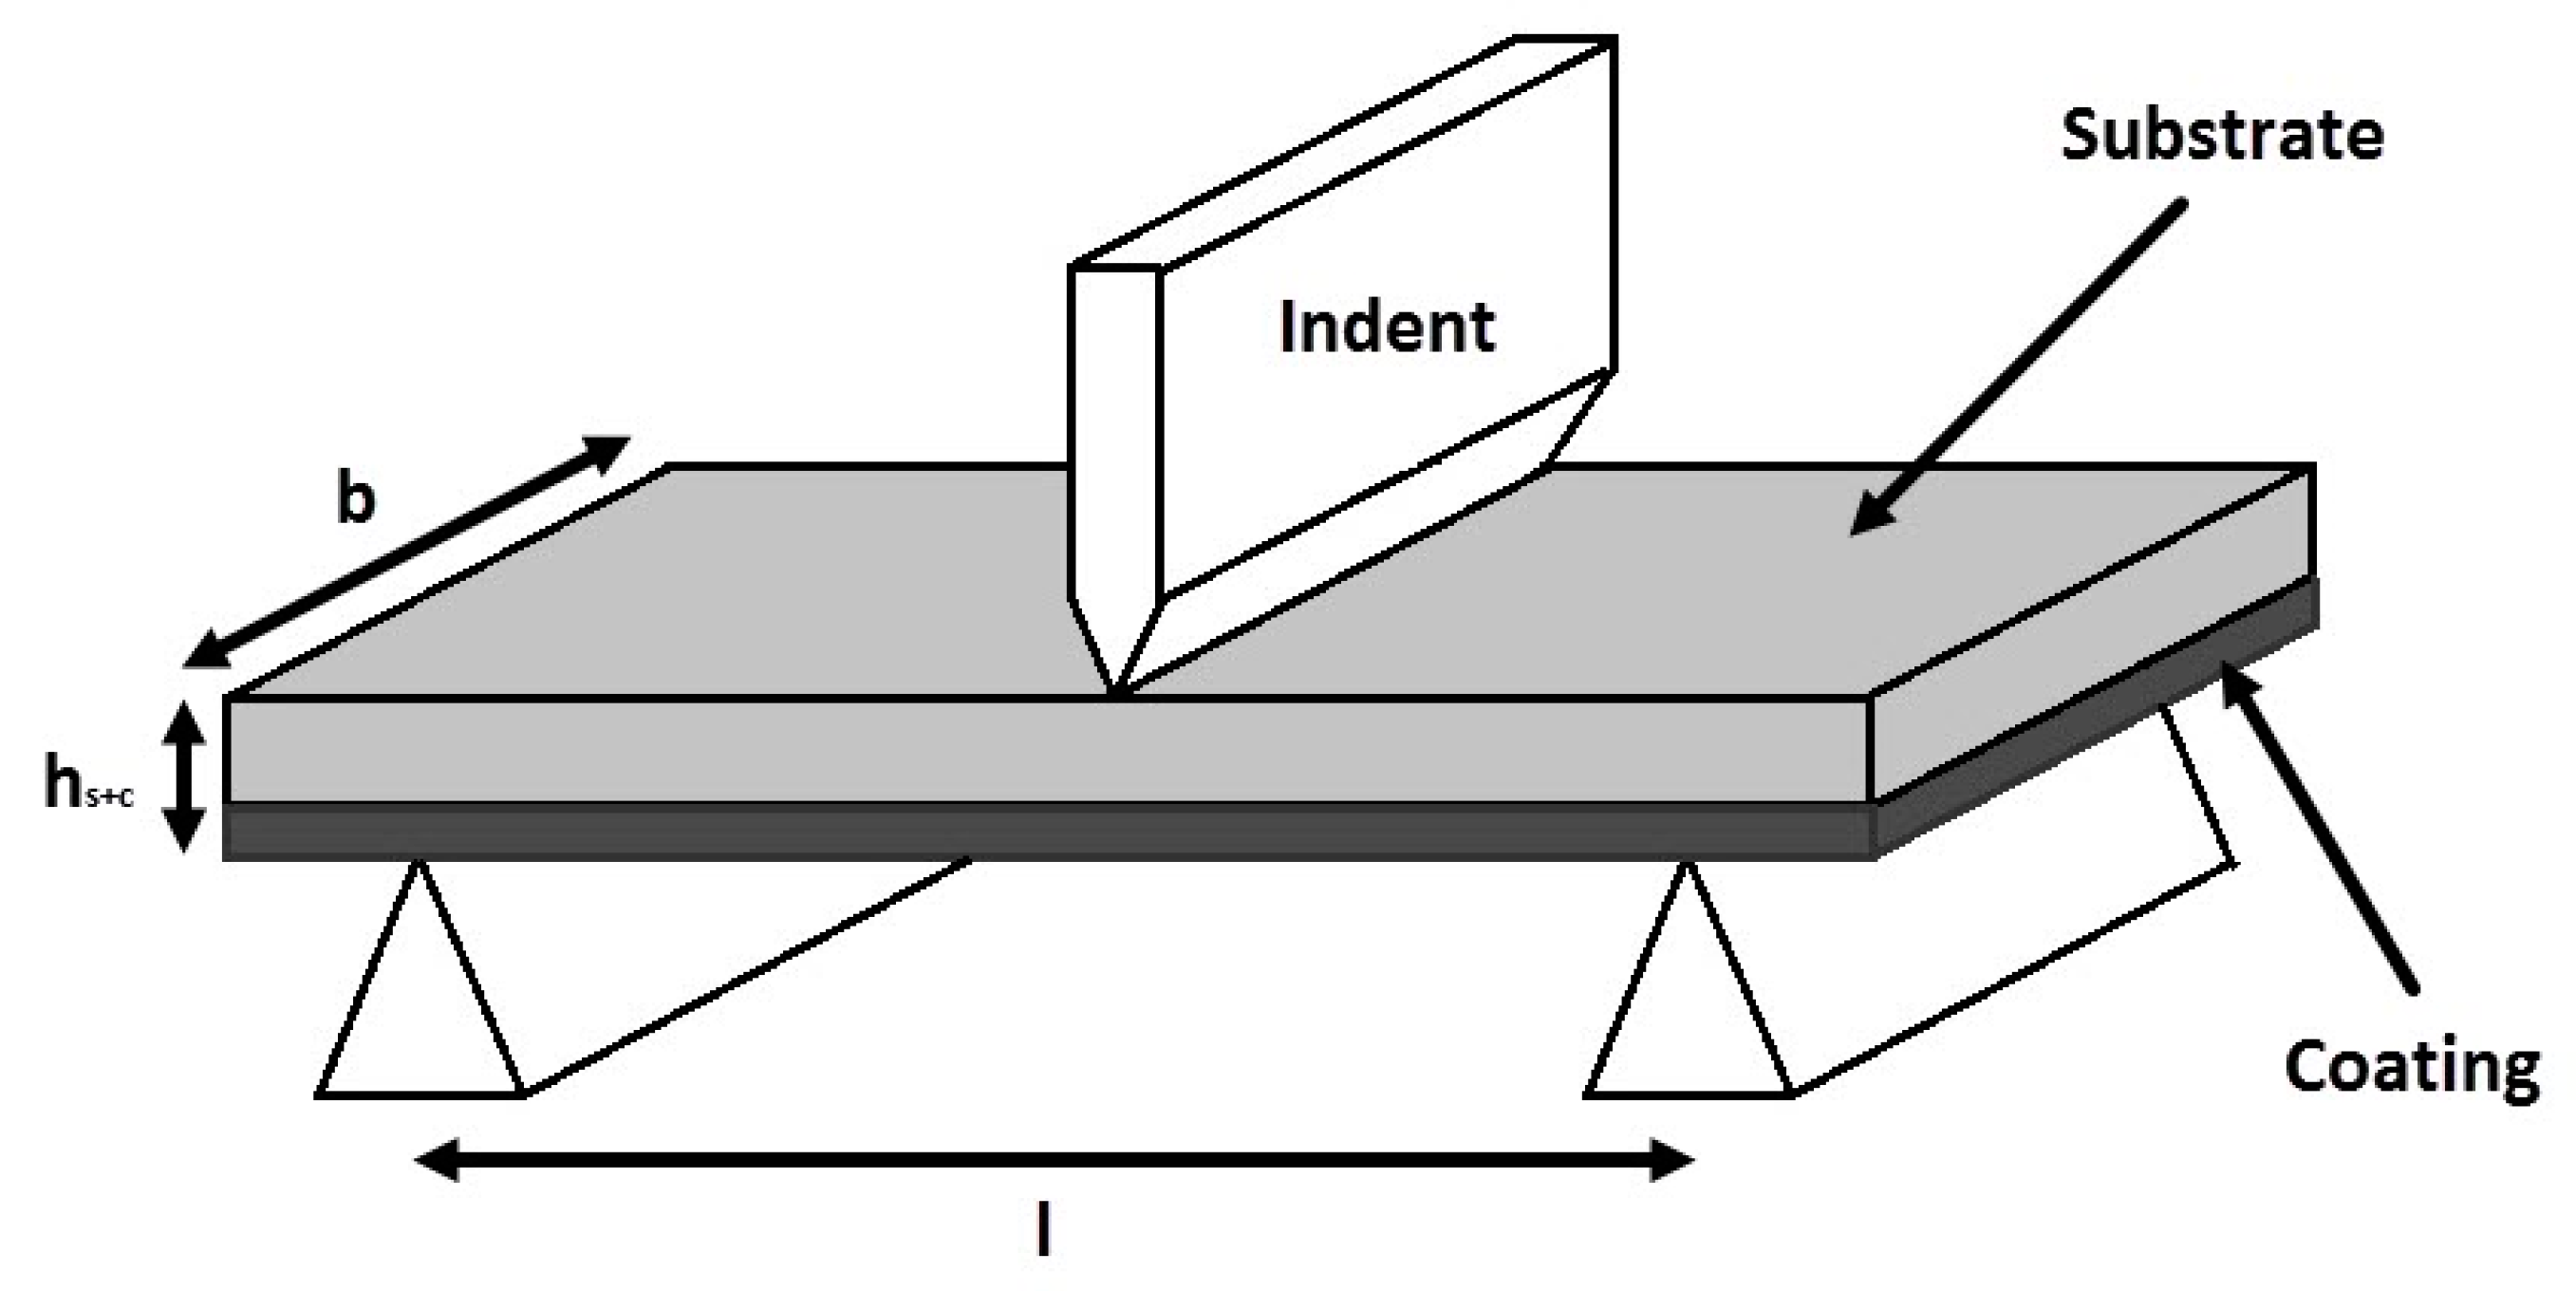
1]. Due to the fact that substrates used in construction work such as steelwork or aluminium are prone to buckling, bending, or deflecting under a certain load, it is necessary for the coating material to be sufficiently flexible so as not to exhibit any tears, cracks, or debonding. Coating material that failed under load stress probably has weak adhesion bonding and is subjected to undercutting at the bend region. Two properties which are flexural strength and flexural modulus have been considered in evaluating the properties of coating material. Flexural strength is the maximum stress that the coating material can withstand before reaching a breaking point. Flexural modulus represents the coating material stiffness which measures the ability to resist bending or displacement when force is applied.
In previous literature, three-point bending tests were used to determine the flexural performance of various coating materials. Yang et al. carried out a three-point bending test to study the mechanical and bonding properties of the Al2O3/Ni surface that infiltrated the composite layer. The result showed that the peak load was inversely proportional to the content of Al2O3 [2]. Li et al. also used a three-point bending test to investigate the mechanical properties of different NiCrAlY coating overlayers. It was found that the damage behavior was mostly influenced by the interfacial adhesion and the overlayer (brittle or ductile) property [3]. To date, no research on the flexural properties of the geopolymer composite coating (GCC) has been conducted and therefore this research may provide useful information for the improvement of coating material in the building construction industry.
Geopolymer is a material that has attracted wide interests among many scientists around the world due to its excellent properties which include high compressive strength, low shrinkage, acid, and fire resistance [4,5,6]. Studies have been conducted on different forms of geopolymer including geopolymer concrete [7,8], precast paving cement-free brick [9], and lightweight geopolymer composite [10]. As an inorganic polymer which is based on synthetic aluminosilicate materials [11], geopolymer has a potential in coating application as a surface protector and insulator for various surfaces including metal [12]. Fly ash, metakaolin, and blast furnace slag are the example of pozzolanic waste and were used widely to form GCC and coated either on ceramic or metal substrate [12,13]. However, to the best of our knowledge, there were no publications on the application of optimization method to obtain the best composition of GCC to produce sufficiently flexible coating and the application of rice husk ash as geopolymer coating on a metal substrate. In this research, the rice husk ash will be used as the main component in producing GCC and response surface methodology (RSM) used as the optimization method to elucidate the best coating composition that can be achieved. This method will also be used to validate the predicted optimal value.
Rice husk contains approximately 50, 25%–30% and 15%–20% of cellulose, lignin and silica contents, respectively. When it is burnt under controlled temperature and environment, more than 85% of silica is left behind together with RHA. For every 100 kg of paddy milled, nearly 20 kg which is 20% of husk is produced and about 5 kg (25%) of RHA is generated after burning [14]. RHA contains around 93% and 0.4% of silicon dioxide (SiO2) and aluminum oxide (Al2O3), respectively, compared to fly ash, which has about 41 and 21.6% of SiO2 and Al2O3, respectively [15]. This suggests that RHA contains higher amount of silica as compared to fly ash. However, their relative quantity differs according to their origin. Higher silica contains higher compressive strength. According to Songpiriyakij et al., a higher Si/Al ratio will lead to higher compressive strength, but lower compressive strength is observed when the Si/Al ratio exceeds 15 [16]. De Silva et al. obtained similar results for the Si/Al ratio that is between 2.5 and 5. They found that a higher content of alumina provides lower mechanical strength [17].
In order to maximize the properties of geopolymer based on RHA, many parameters have to be considered including the ratio of activated alkaline (AA) solution, concentration of sodium hydroxide (NaOH) solution, curing temperature and time, RHA/AA ratio, sintering temperature and time, water content of mixture, and size of materials aggregate. It is laborious and time-consuming to develop a process that involves a large number of factors in order to obtain the optimum result using classical method (which is usually involves one factor at a time) of the data analysis. Response Surface Methodology (RSM) consists of a combination of mathematical and statistical techniques which is useful in modeling, analyzing, and optimizing responses that are influenced by several factors. It was originally coined by Box and Wilson [18] particularly to study the relationship between factors and responses. Besides minimizing the number of experiments needed (for a high number of levels) to produce relevant information for a set of inputs, the choice of using RSM for optimization is considered a quick and easy way to screen wide experimental field and elucidate the roles of every component involved [19,20]. Table 1 shows a comparison between full factorial design and RSM based on 5-level factors. Compared to a classical method such as factorial design which requires 25 runs, RSM that involves two factors only requires 13 runs to complete an experiment. RSM is very beneficial to be used especially when it involves more than two factors. This is not only resulting in lower overall costs (material and testing), but it also shortens the experimental time.
The main objective of this paper is to elucidate whether the material coating, such as polymer, may be adversely affected by load-bending moments on coated structures. The effect of factors including the ratio of AA solution, RHA/AA ratio, curing temperature, water to solid (W/S) ratio, and silica to alumina (Si/Al) ratio on flexural properties were studied. In addition, microstructure, flexural properties, and damage mechanism that followed a three-point bending test were evaluated and discussed.

2. Materials and Methods

2.1. Design of Experiment Based on RSM

The three factors chosen, namely the ratio of AA solution, RHA/AA ratio, and curing temperature, were designated as V1, V2, and V3, respectively. The NaOH concentration and curing time were fixed at 12 M and 7 days, respectively. According to Khan et al. [21], the curing time of more than 28 days has no significant effect on the adhesion strength and thus has no subsequent effect on the mechanical properties of the geopolymer composite coating (GCC). The desired responses were the flexural strength and flexural modulus that were assumed to be influenced by the three factors. Levels of three chosen factors and their working ranges are shown in Table 2.

2.2. Experimental Design

A 5-level-3-factor central composite design (CCD) was employed as in previous literature [22], which required 20 runs. V1, V2, and V3 were the factors and each level was chosen based on literature [23,24,25] and preliminary laboratory work conducted, and these were within the allowed range of the composite coating material. A complete CCD and their coded and uncoded levels of the factors are given in Table 3. Three samples were tested for each sample group for all design points and the value for the total block is 1 with the experiments carried out in randomized order.
The ratio of AA and RHA/AA ratio were calculated based on weight ratio. For example, to obtain a ratio of AA of 3.0, 9 g of sodium silicate (Na2SiO3) was mixed with 3 g of sodium hydroxide (NaOH). In order to obtain the RHA/AA ratio of 0.4, 4.8 g of RHA was mixed with 12 g of AA (total weight of previously mixed solution). Table 4 shows the examples of calculated weight for AA and RHA/AA.

2.3. Raw Materials and Sample Preparation

Rice husk is the primary raw material used in this study and was provided by Maero Tech Sdn. Bhd (Nilai, Malaysia). In order to produce RHA, rice husk was first ground using planetary mill Pulverisette 4 (Idar-Oberstein, Germany). RHA was sieved and the particle size distribution (PSD) test was conducted on the particles which were passed through a 75-micron opening. The average particle size of RHA was 22.8 µm with 10% of the particles were finer than 3.4 µm. Its specific surface area was 0.701 m2/g. The chemical compositions of RHA are shown in Table 5. SiO2, Al2O3, and palladium (II) oxide (PdO) were found to be major constituents and other elements that included K2O, CaO, Cr2O3, MnO, NiO, CuO, and Fe2O3 were also found in the composition.
A mild steel plate (38 mm × 150 mm × 1 mm) was cleaned using detergent, de-ionized water, and, finally, acetone. The molarity of sodium hydroxide was fixed at 12 M. Different geopolymer compositions were synthesized by different ratios of activated alkaline (Na2SiO3/NaOH) solution and RHA/AA ratio, which were based on Table 3.
The GCC was first being prepared by mixing the sodium hydroxide and sodium silicate solution at a designated ratio. Initially, the activated alkaline solution was then mixed with RHA. The mixture was stirred at low speed until all RHA dissolved in the solution. Then, the produced mixture was coated on the mild steel substrate and placed in a vacuum oven to remove trapped bubbles. Due to the different viscosity of the mixture, the average coating thickness for all samples was 1.10 mm. After 15 min of degasification, the coated substrate was placed in the oven for 24 h and at ambient temperature in the following 6 days for complete curing.

2.4. Microstructure Test

Morphology of ground and sieved (passed through 75-micron opening) RHA was studied using scanning electron microscopy (SEM). Morphology of a flexure surface was also studied under SEM. JEOL JSM-6400 (Tokyo, Japan), a scanning electron microscope, was used to analyze the coating structure. The magnification of the microscope was 100 times.

2.5. Flexural Test

Three-point bending test was conducted by using the Instron machine. Bending speed was fixed at 2 mm/min. Figure 1 shows the three-dimensional view of three-point bending test set-up where b = width of the specimen, l = length between two supports and hs + c = total thickness of substrate and coating. The distance between supports was calculated followed the equation l = (2r + 3t) ± t/2, where r = radius of the end of the indent and t = specimen thickness. In this study, l = 30 mm, b = 38 mm, hs = 1 mm, and hc = 1 mm. The substrate material was faced upward and in contact with the indent.

2.6. Microstructure of Rice Husk Ash

The image of the ground RHA was studied using scanning electron microscopy (SEM) as shown in Figure 2. RHA particles comprising mainly of silica were found to be solid in nature with amorphous forms as with cristobalite and trace crystalline quartz [26,27,28,29,30]. Crystalline RHA is only converted to amorphous forms when it is calcined at high temperature [31]. The uneven size of the particles was due to the high combustion temperature of RH [32].
The particles of RHA was found to be much finer and have more homogenous distribution after grinding. Finer particle size was reported to increase the reactivity during mixing and curing [33,34]. Furthermore, some particles can be seen as agglomerated and stuck to each other due to the high surface energy and free OH groups on the silica surface. The produced hydrogen bond with water molecules was also removed when the dispersed silica was isolated from the solvent, forming a Si–O–Si bond [35].

3. Results and Discussion

Complete design matrix and responses values of flexural strength and flexural modulus are given in Table 6 and data were analyzed using MINITAB (version 16.2).

3.1. Statistical Analysis of Flexural Strength

The regression analysis, after a backward elimination, is shown in Table 7. The results showed that there was no quadratic effect (interaction between different factors including V1*V2, V2*V3, and V1*V3) that can be fitted into the model, thus indicating that there was no significant relationship between the factors.
The value of R2 (coefficient of determination) was 0.8380, which indicates that 83.80% of the sample variation in the flexural strength was attributed to the factors (V1, V2, and V3). For example, if R2 was 1.0000, the regression model produced would predict the optimum value with high accuracy. Square models are best fitted to the response. However, only the RHA/AA ratio (V2) and curing temperature (V3) showed significant linear and square effects on the response since the P was smaller than 0.050. The V2 showed the lowest p, which meant that it had the strongest effect on flexural strength for both linear (p < 0.013) and square effects (p < 0.005). The significant square effects indicated that the relationship between V2 and response followed a curved line instead of a straight one.
The ratio of AA solution (V1) had no significant effect on flexural strength. Equation (1) represents the final reduced regression model equation for flexural strength:
YFS = −78.811 + 0.296V1 + 447.537V2 + 4.627V3 − 525.281V22 − 0.043V32
YFS represents the response of flexural strength, while V1, V2, and V3 are the decoded values of the ratio of AA solution, RHA/AA ratio, and curing temperature, respectively. This regression model can be used to calculate and analyze the effect of factors on the flexural strength of geopolymer composite coating (GCC).

3.2. Effect of Factors on Flexural Strength

ANOVA and regression models were used to analyze the effect of various factors on flexural strength. Contour plots were used for better illustration. 
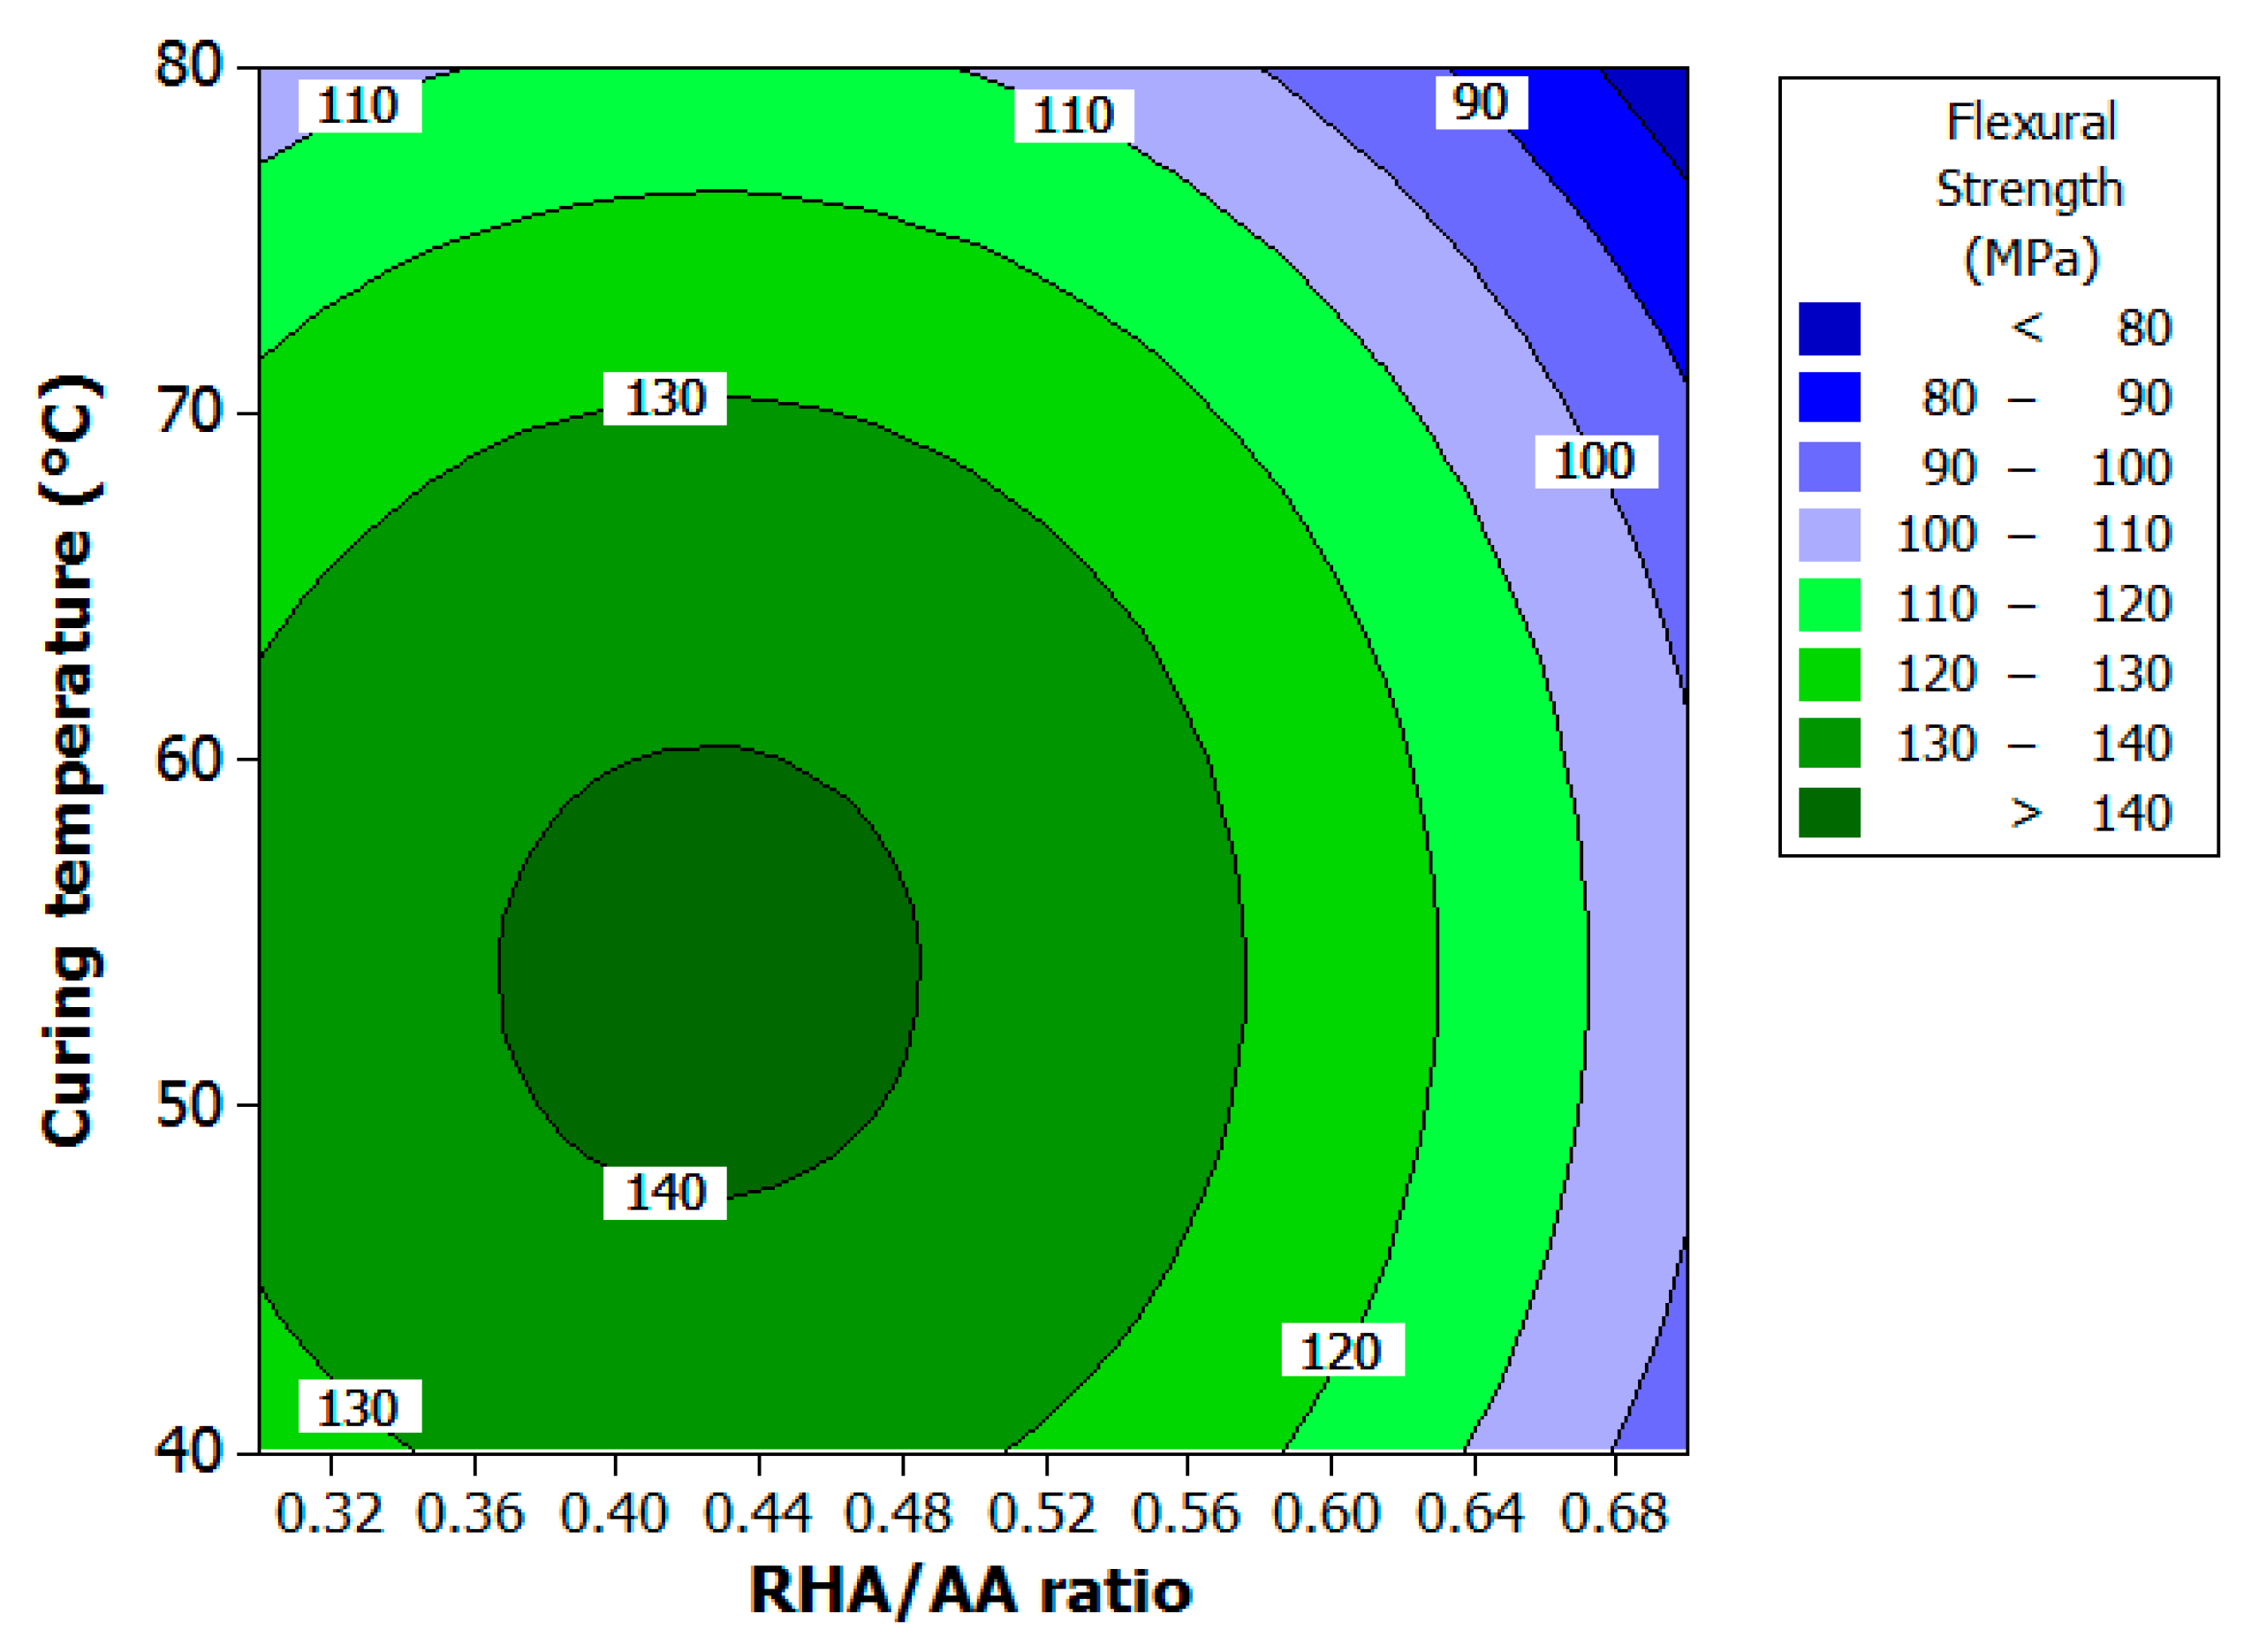
Figure 3 illustrates the effect of RHA/AA ratio (V2) and curing temperature (V3) on flexural strength and is shown as numbered contours.
V1 was held constant at 2.5 since this factor did not have any effects on the response. It is clear that flexural strength increases with lower V3 and low V2. High flexural strength was observed for geopolymer cured in the range of 47 to 60 °C and within 0.36 to 0.48 for V2. As the value for both factors increased, flexural strength decreased. An increment of the RHA/AA ratio beyond 0.48 meant that the mixture had less workability as shown in Figure 3. Different aluminosilicate sources had different optimum strength and workability. For example, Kong et al. [36] found that metakaolin-based geopolymer paste had optimum workability at the water to solid (W/S) ratio of 1.25, whereas fly ash (FA)-based geopolymer had its optimum at 0.33.
Hardjito et al. [37] found that the increment of the curing temperature to above 60 °C will not necessarily increase the sample strength. At a higher temperature, the loss of moisture will occur and consequently affect the sample strength. According to Van Jaarsveld et al. [38], curing at higher temperature breaks down the structure of the geopolymer mixture resulting in dehydration and excessive shrinkage as the gel contracts without transforming to a more semi-crystalline form. Without retaining small amounts of water in the geopolymer matrix, cracking cannot be reduced resulted in low mechanical strength. Chindaprasirt et al. [39] stated that the presence of moisture is important for geopolymerization in order to develop good strength.
Based on Figure 4, RHA-based geopolymer showed optimum workability at a W/S ratio of slightly higher than 1.25. The higher W/S ratio compared to that of metakaolin- and FA-based geopolymer indicated that RHA required higher liquid demand due probably to its finer particle size that has been identified in previous research [36]. Higher flexural strength was achieved when the W/S ratio is between 1.22 and 1.29, and Si/Al ratio between 98 and 104.
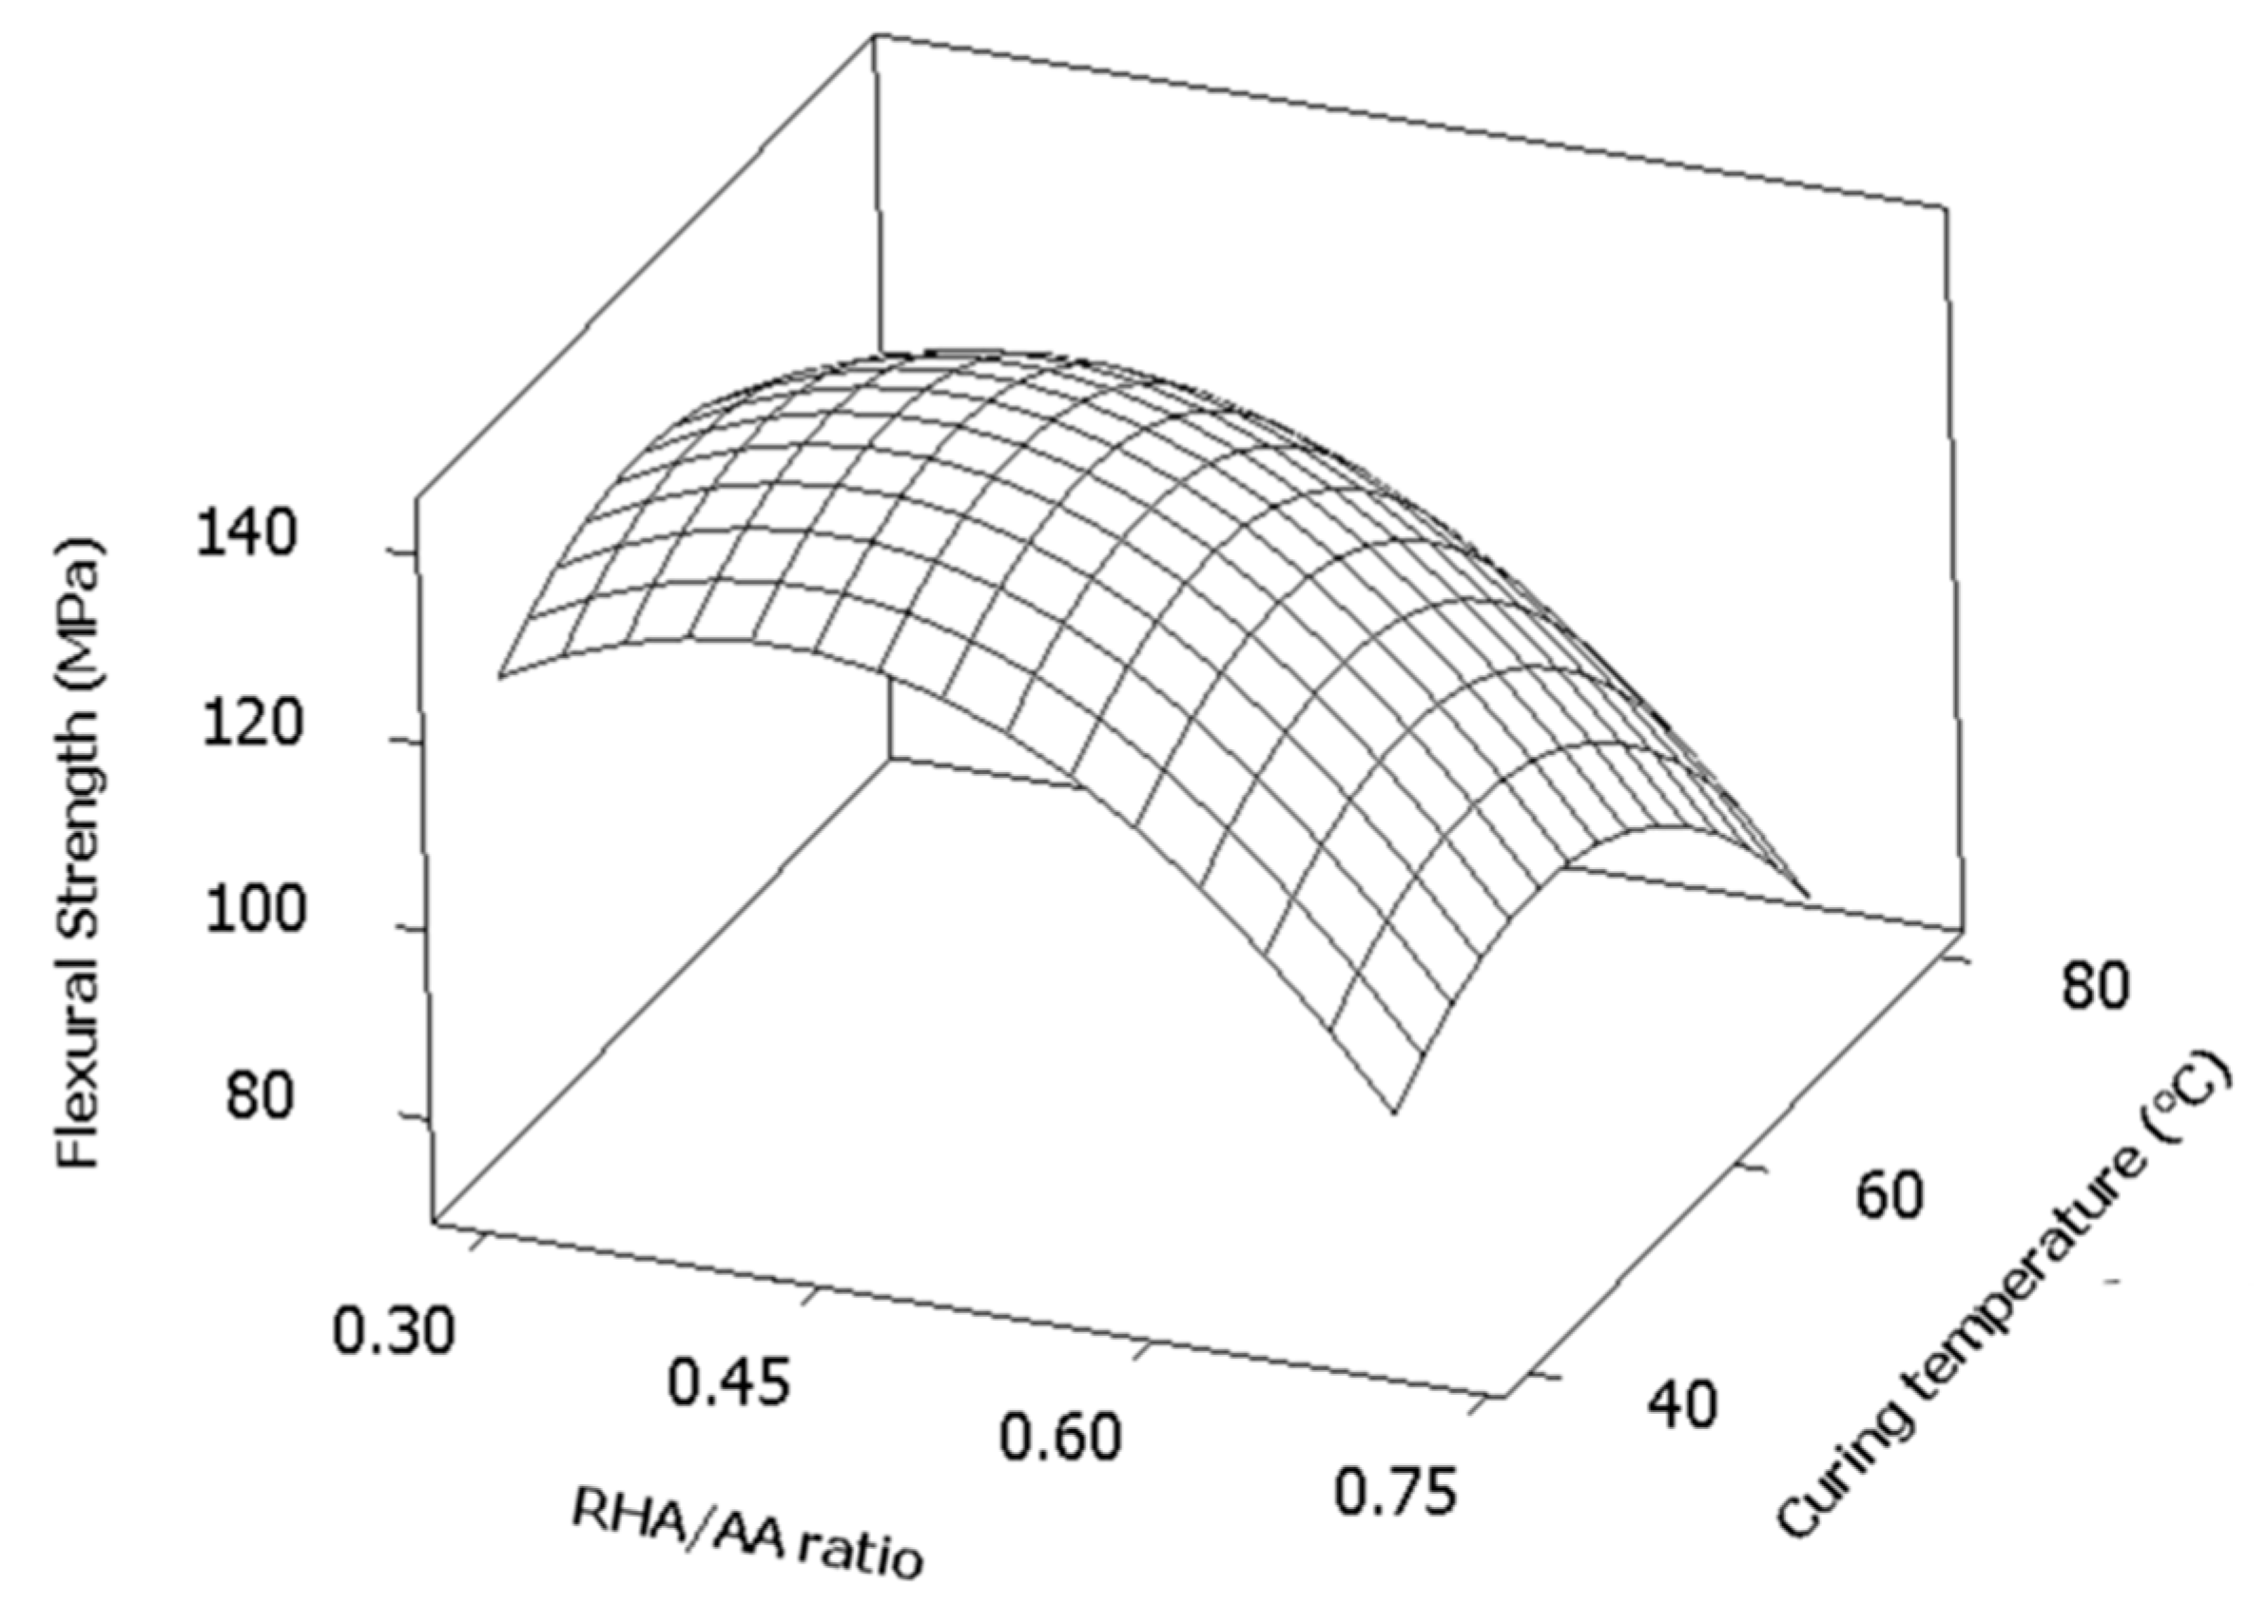
Figure 5 shows the surface response plot of curing temperature (V3) versus RHA/AA ratio (V2). The plot represents a surface where the maximum point is located inside the experimental region. It also proves that both factors have a square effect on the response.

3.3. Statistical Analysis of Flexural Modulus

The ANOVA results in Table 8 showed that there was no relationship between the factors analyzed. Single-factor mainly influenced the response compared to square and interaction effects. Therefore, the linear model best fitted the response.
The value of the coefficient of determination showed that R2 was 0.6475 which indicated that 64.75% of the sample variation in the flexural modulus was attributed to the factors. The R2 value would be sufficient to indicate the right direction to take for further improvements in obtaining higher response values. While the ratio of AA solution (V1) had p well above 0.050, only the RHA/AA ratio (V2) and curing temperature (V3) showed a significant effect on the response. V3 had stronger effect (p < 0.003) compared to that of V2 (p < 0.018) on the flexural modulus.
Equation (2) represents regression model for flexural modulus with YFM represents the response of flexural modulus while V1, V2, and V3 are the decoded values of the ratio of AA solution, RHA/AA ratio, and curing temperature, respectively:
YFM = 7607.95 + 89.46V1 − 3279.83V2 − 43.77V3

3.4. Effect of Factors on Flexural Modulus
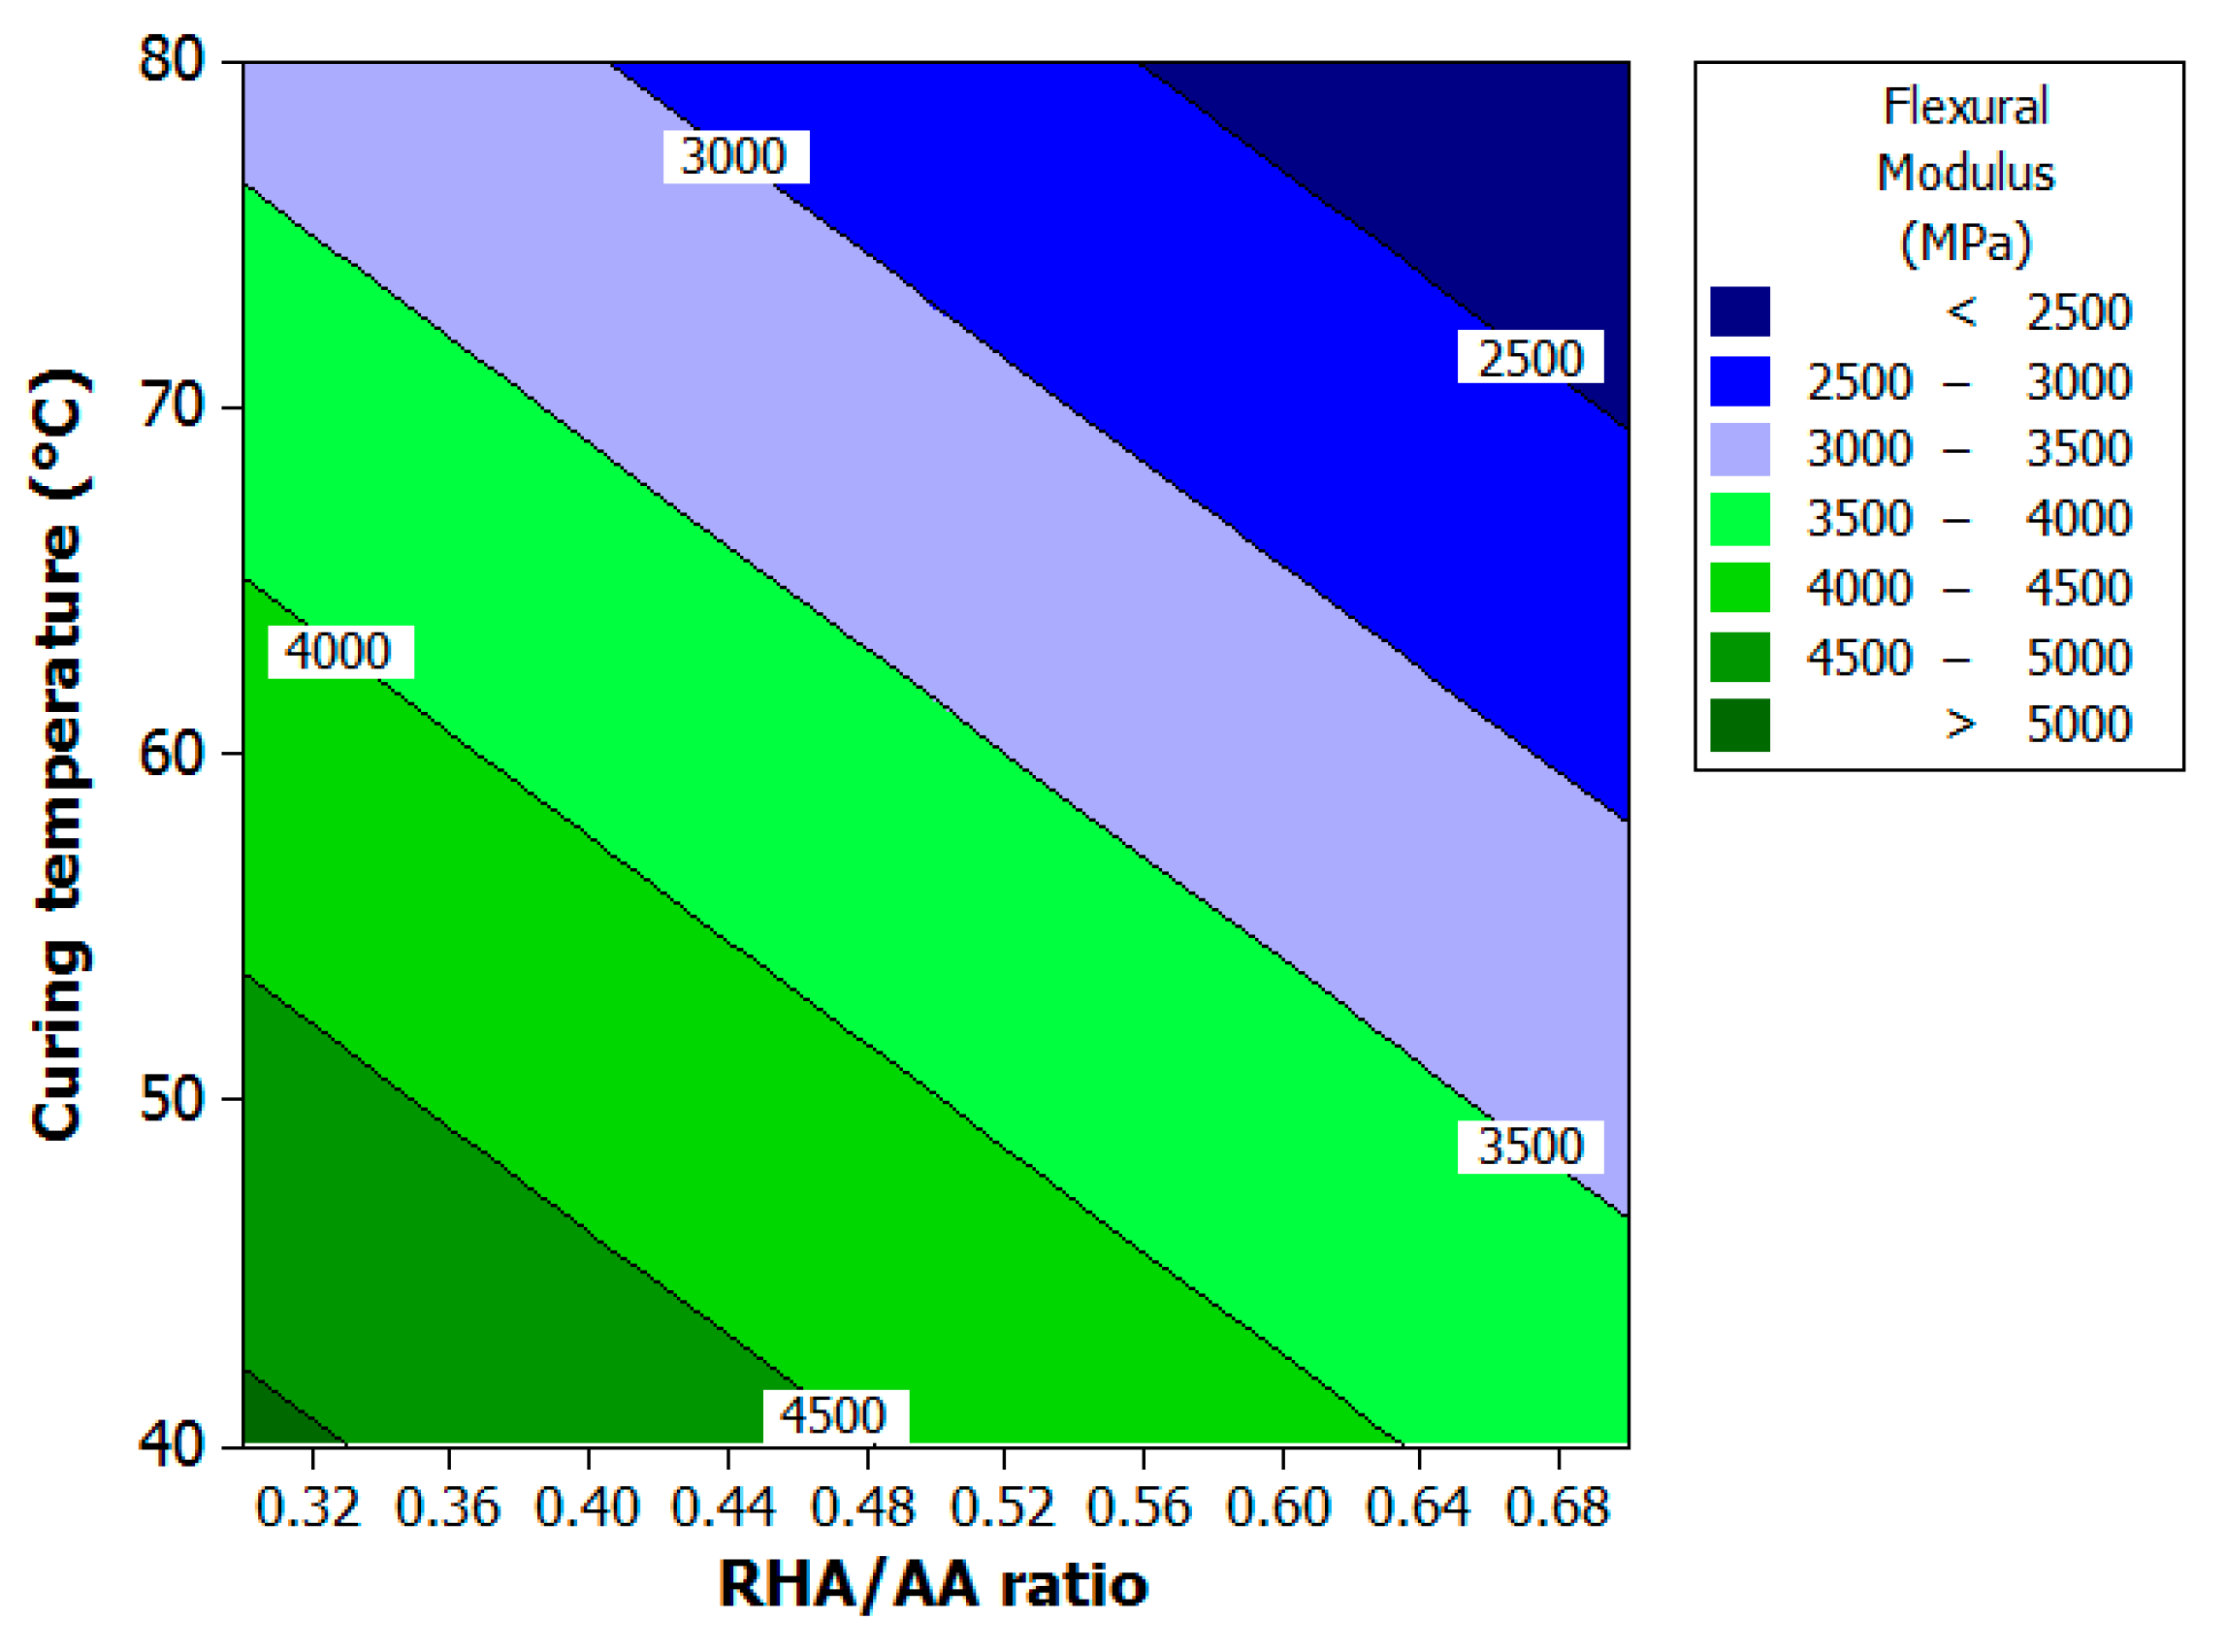
Figure 6 and Figure 7 show the contour and surface plots, respectively. The ratio of AA solution (V1) in Figure 6 is held at 2.5 since this factor does not influence the response. The increment in RHA/AA ratio (V2) and curing temperature (V3) will decrease the flexural modulus. High flexural modulus of greater than 5000 MPa can be achieved when V2 is approximately 0.32 and there is curing temperature of 41 °C.
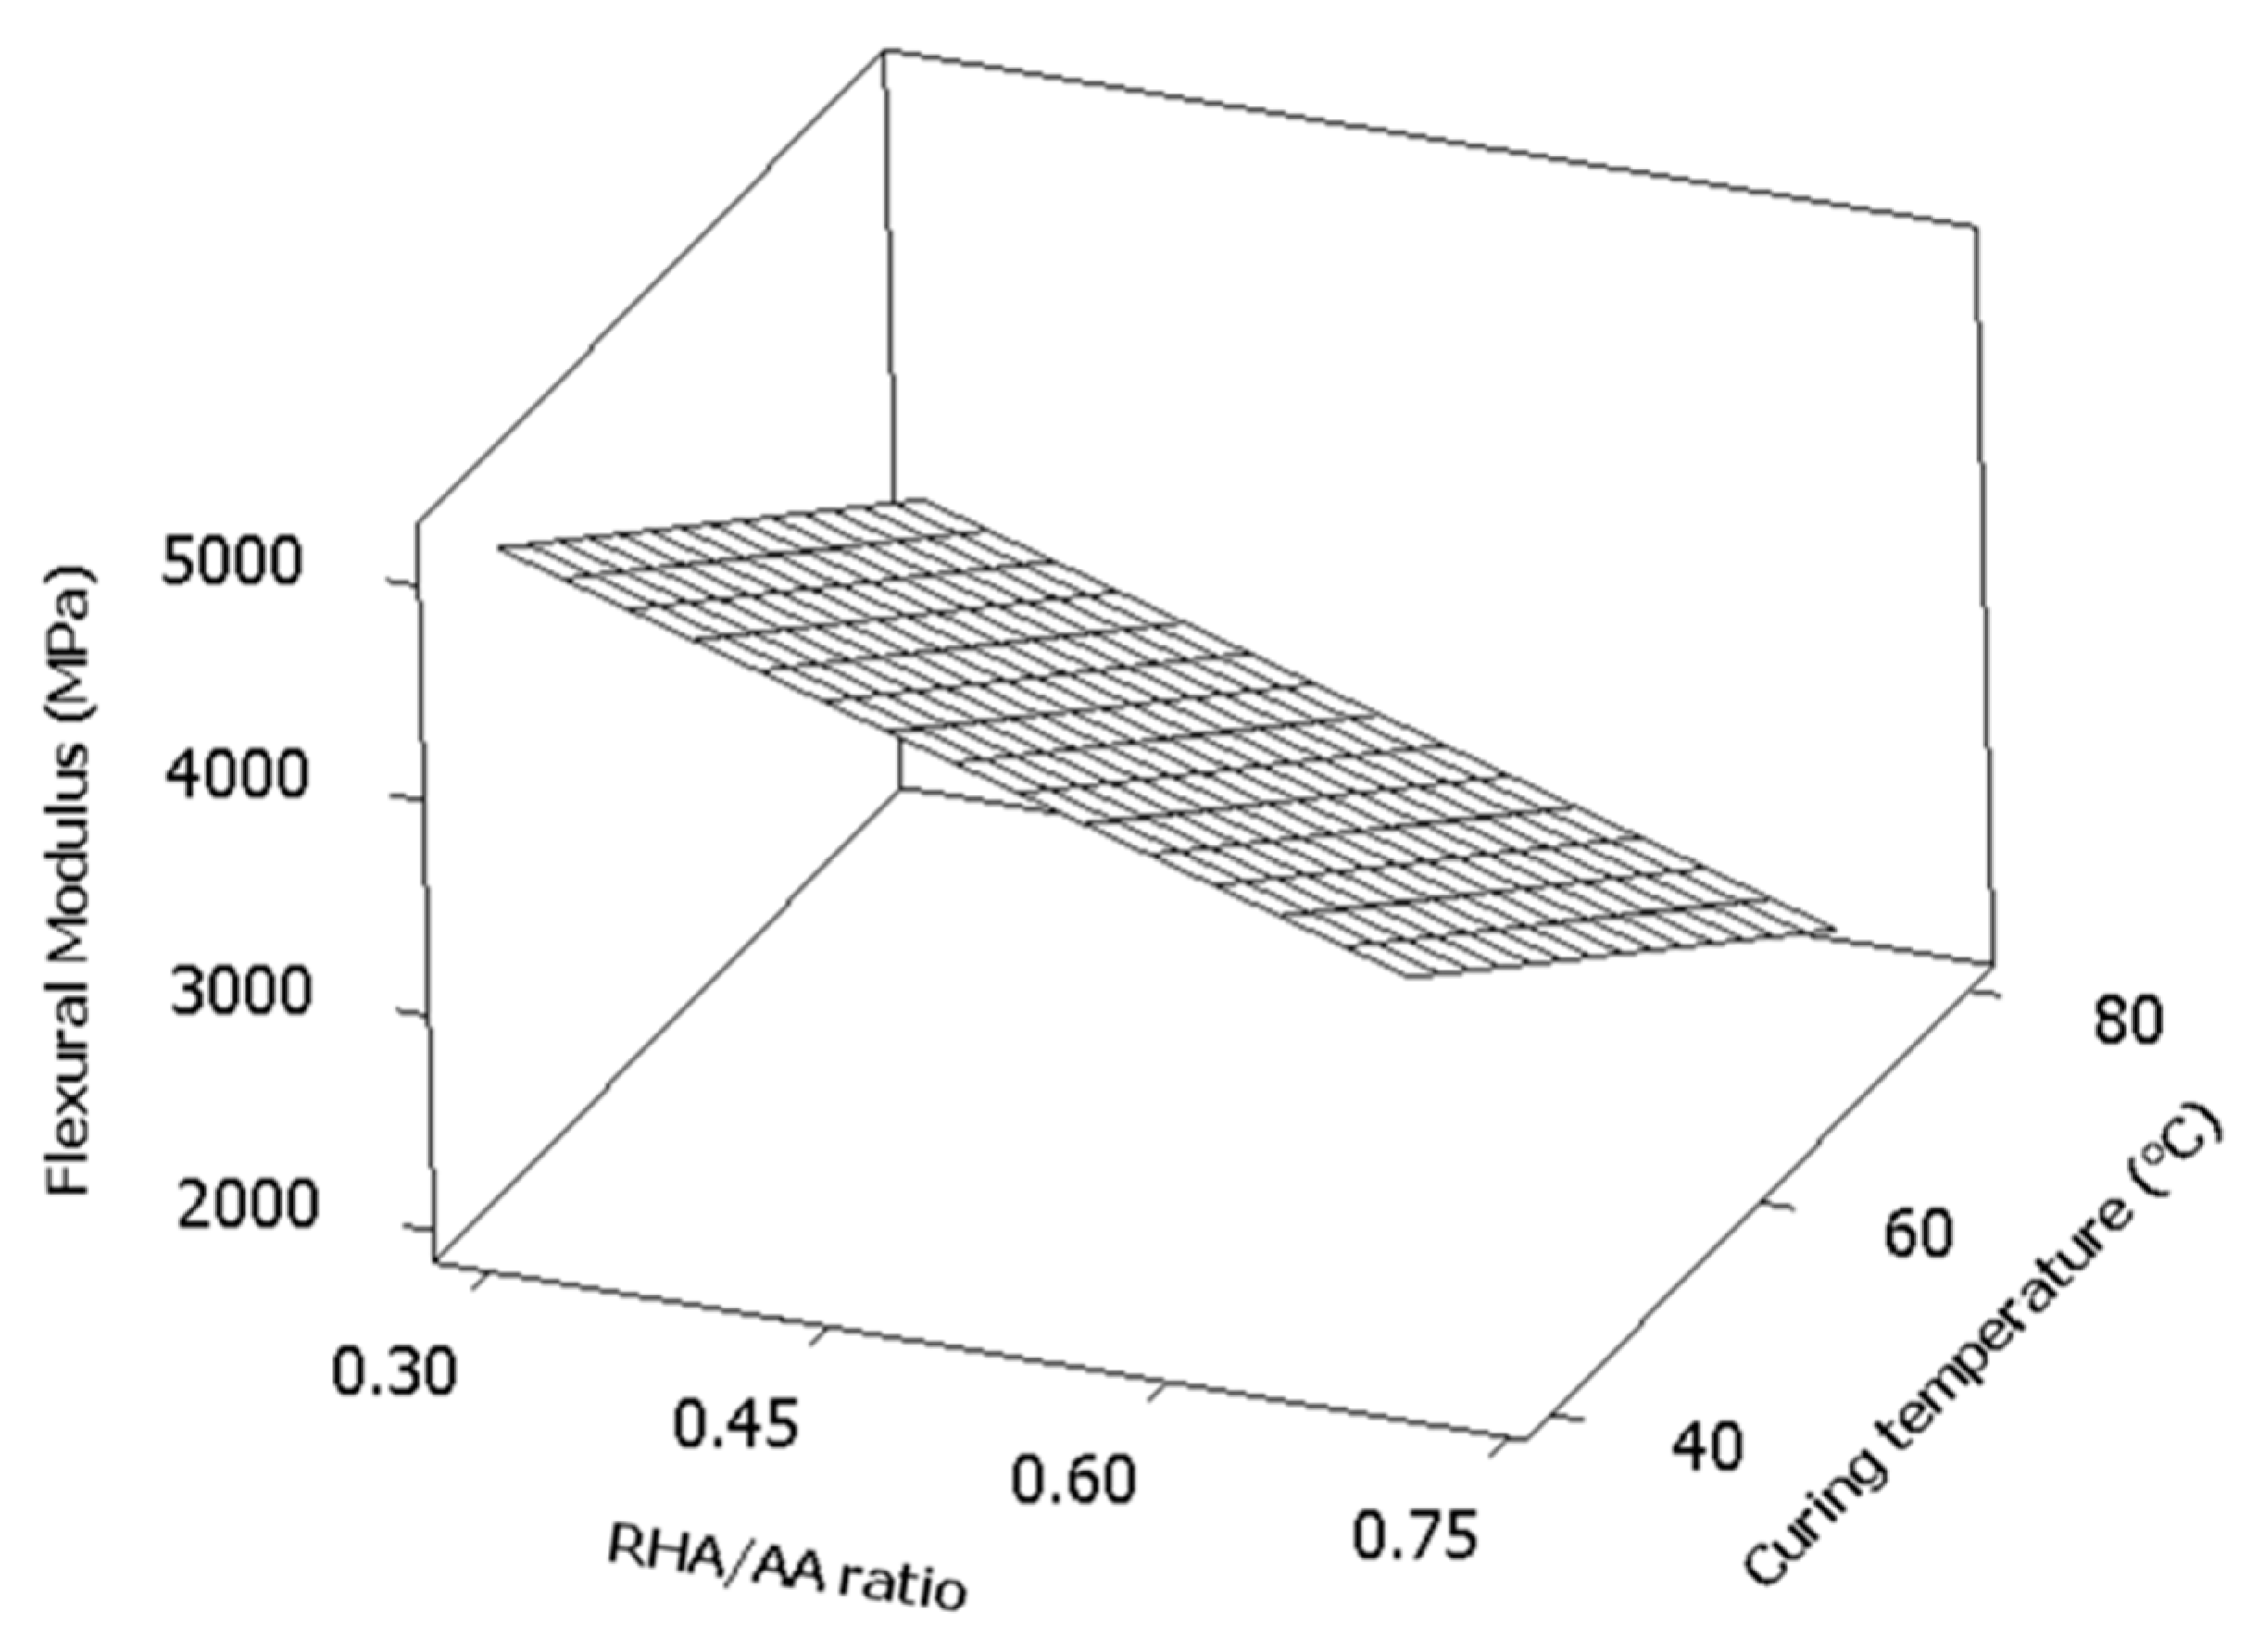
In Figure 7, the surface plotted was a flat plane which indicated that the factors linearly affected the response. The highest flexural modulus could be achieved when the values for both factors were the lowest and the converse was also true.
As the curing temperature increased, the sample exhibited loss of moisture due to continuous evaporation of capillary water in the specimens. Since the content of moisture in GCC was reduced, continuous moisture loss on the surface of the specimen might lead to low strength and less flexibility as confirmed by Nagral et al. [40].
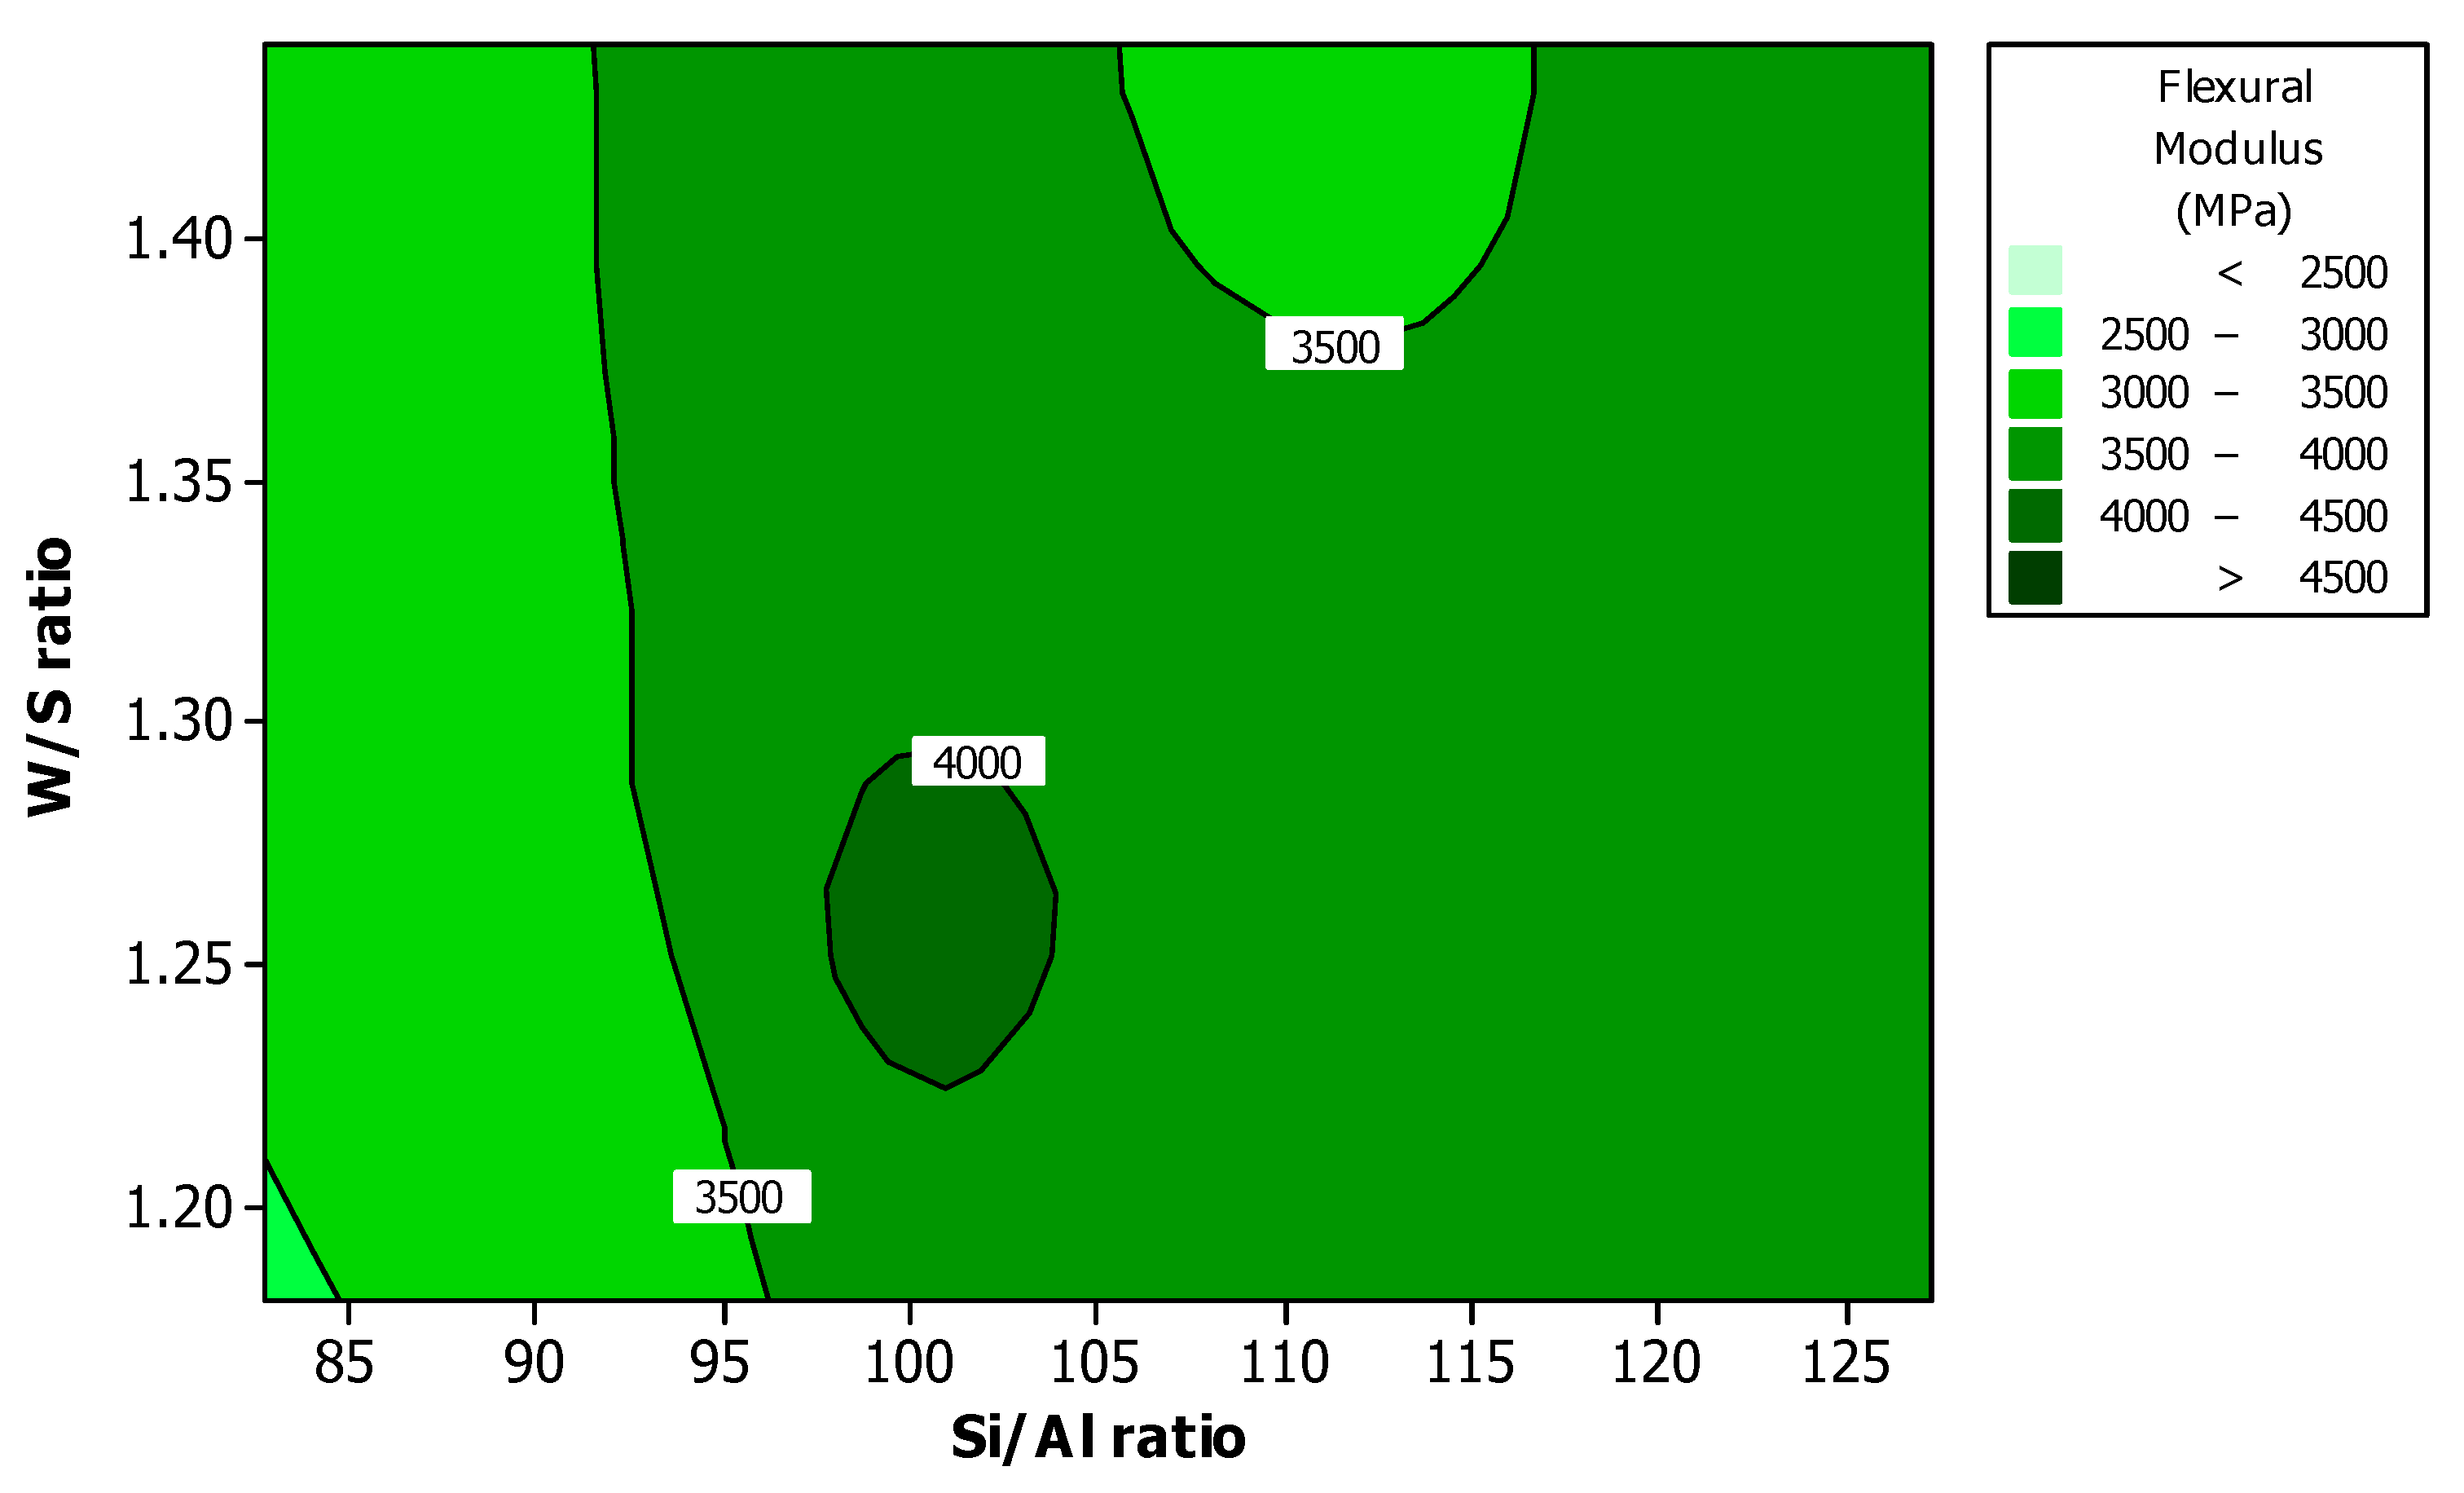
Figure 8 shows the effect of Si/Al ratio and W/S ratio on the flexural modulus. The high value of flexural modulus appeared at the Si/Al ratio between 97 and 104, and W/S ratio between 1.23 and 1.30. The result is similar to that of flexural strength shown in Figure 4.

3.5. Optimization of the Responses

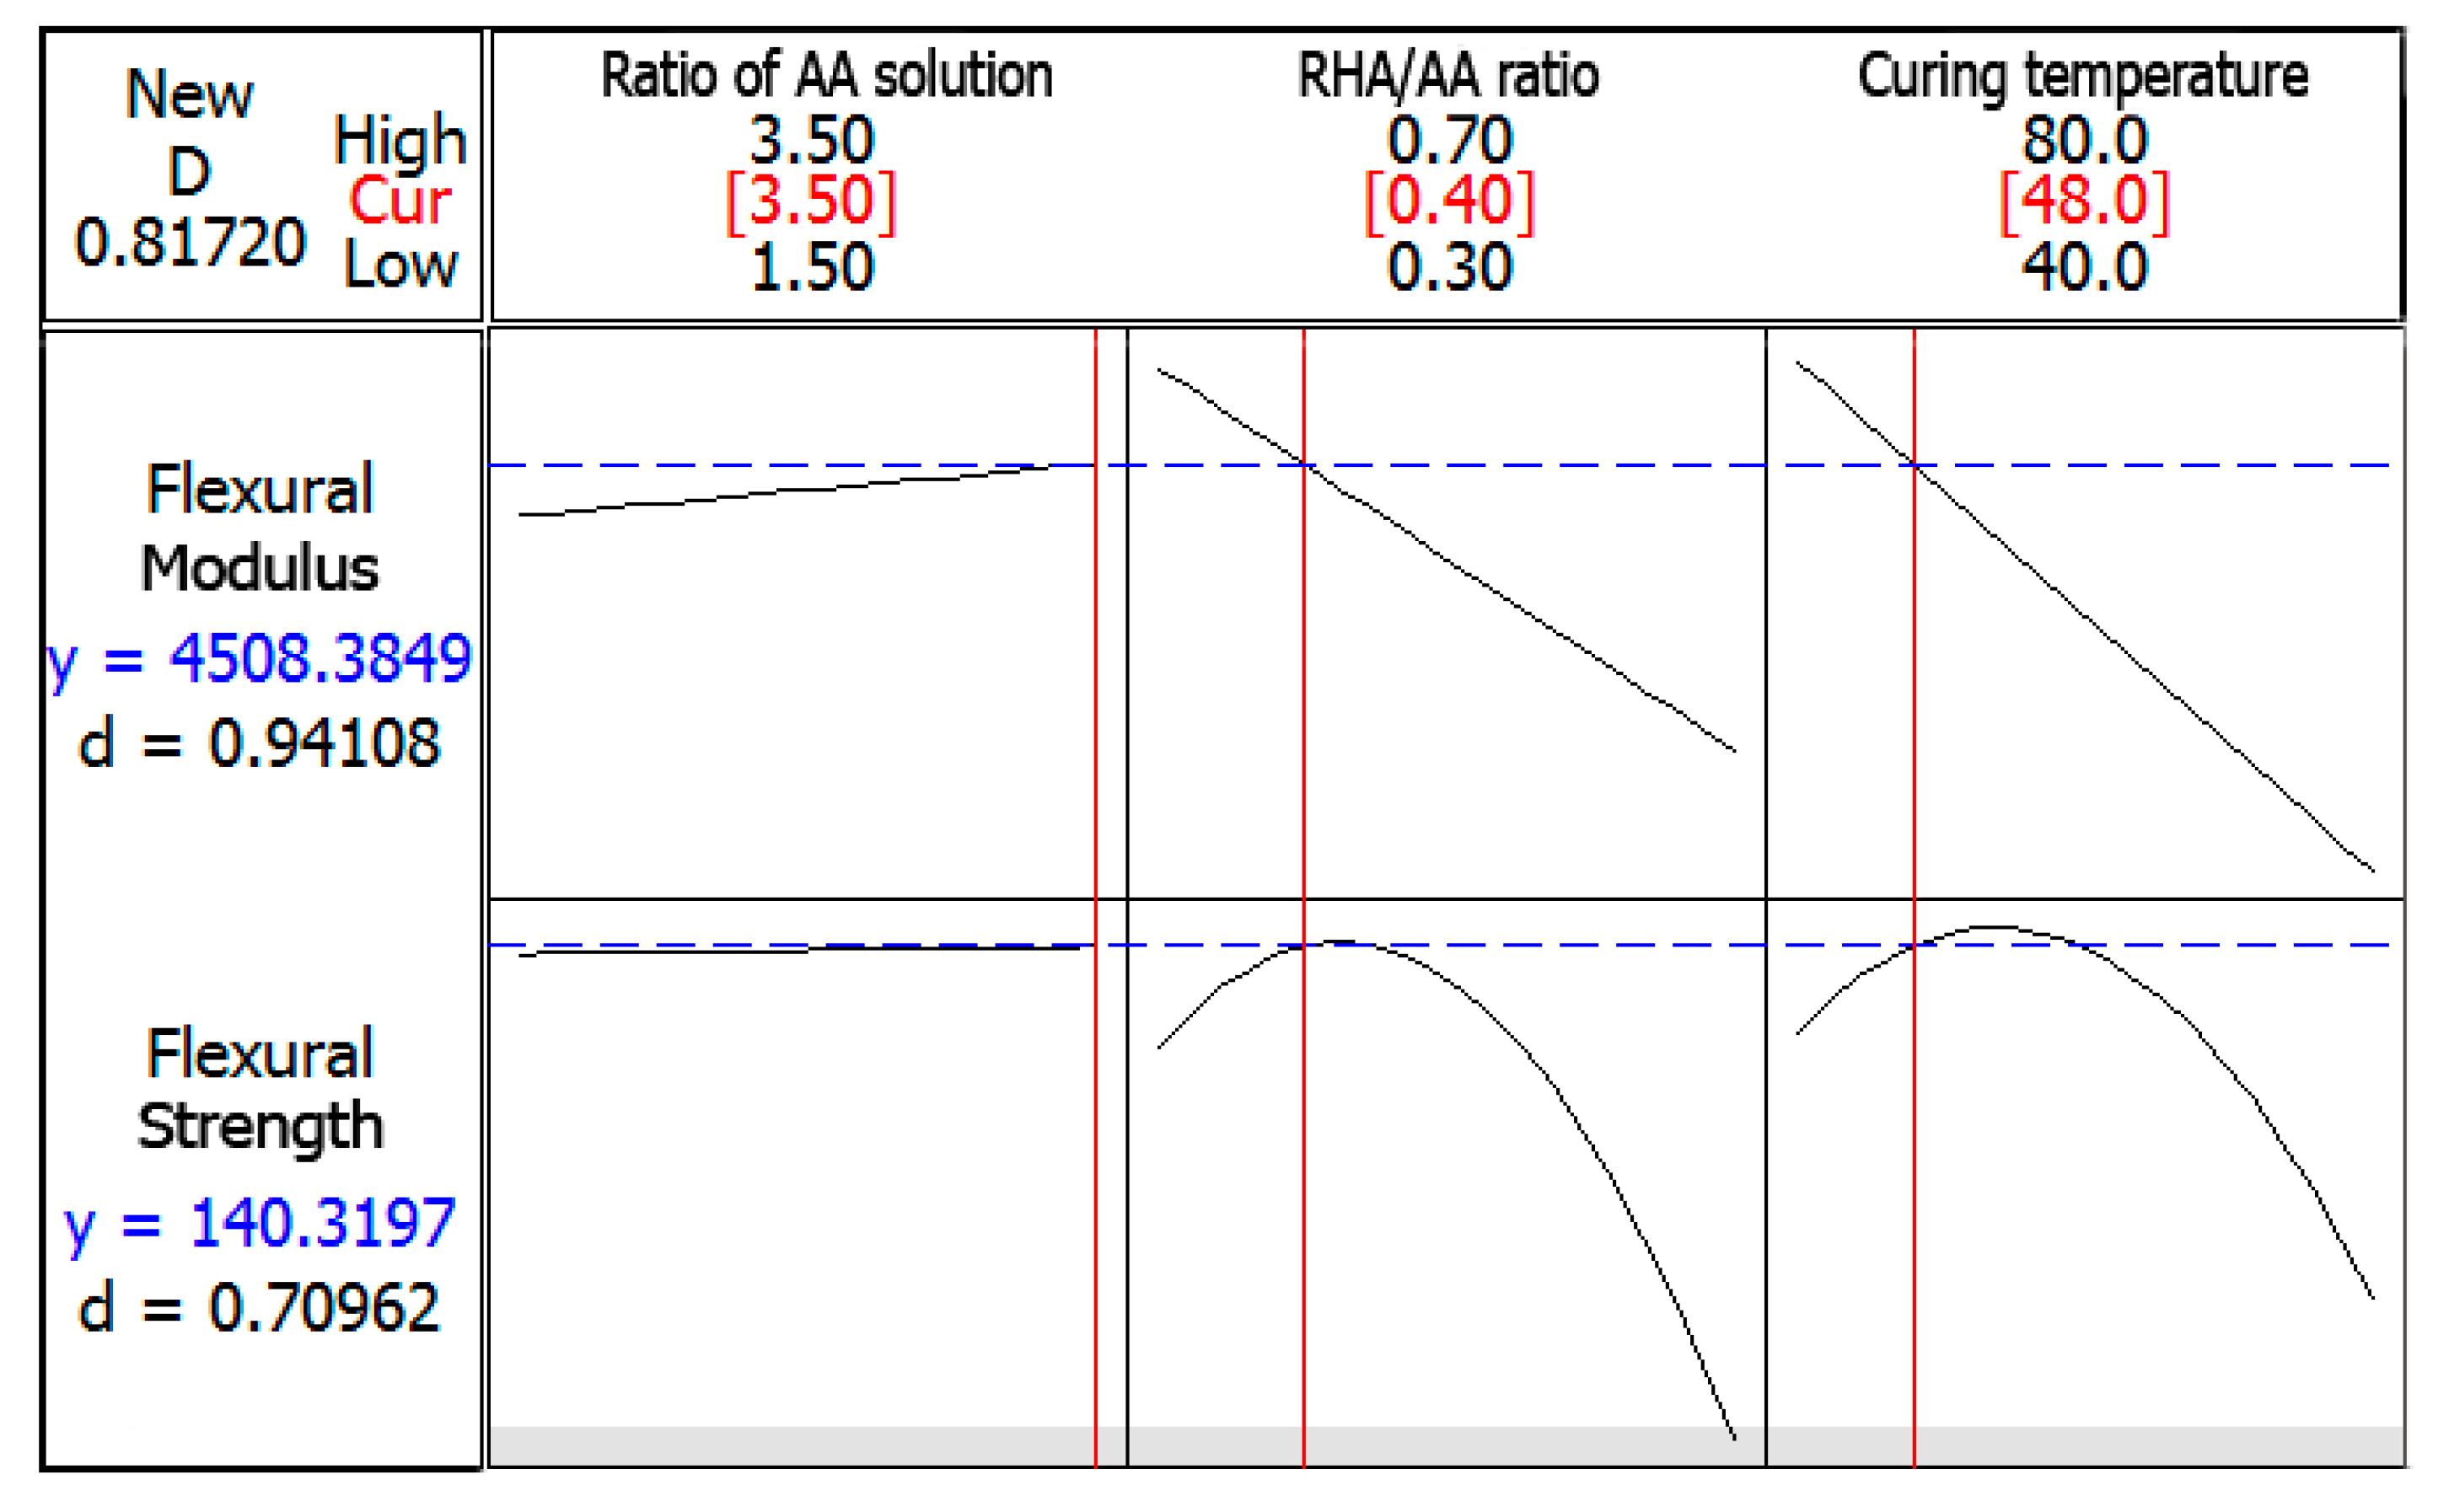
Optimization plot for both responses is shown in Figure 9. The objective was to maximize both responses. The composite desirability value was calculated to be close to 1; therefore, the parameters were within their working range. The optimized values of factors were at V1 = 3.5, V2 = 0.40, and V3 = 48 °C.

3.6. Experimental Validation

In the modelling process, experimental validation is the final step in order to verify the accuracy of the model. In order to verify the reproducibility of the developed regression model and the RSM model, three validation experiments were carried out under the optimal conditions obtained from the optimization plot (see Figure 9). According to Sivaraos et al. [41], for a nonlinear process, the optimization and validity of the model are only confirmed when the average difference between experimental and predicted values is less than 15%. As shown in Table 9, the average error for flexural strength was slightly below 15% while the flexural modulus was well below this value at only 8.42%. It was concluded that the developed regression model established using this method was able to optimize the value for flexural modulus which was more accurate compared to the value for flexural strength.
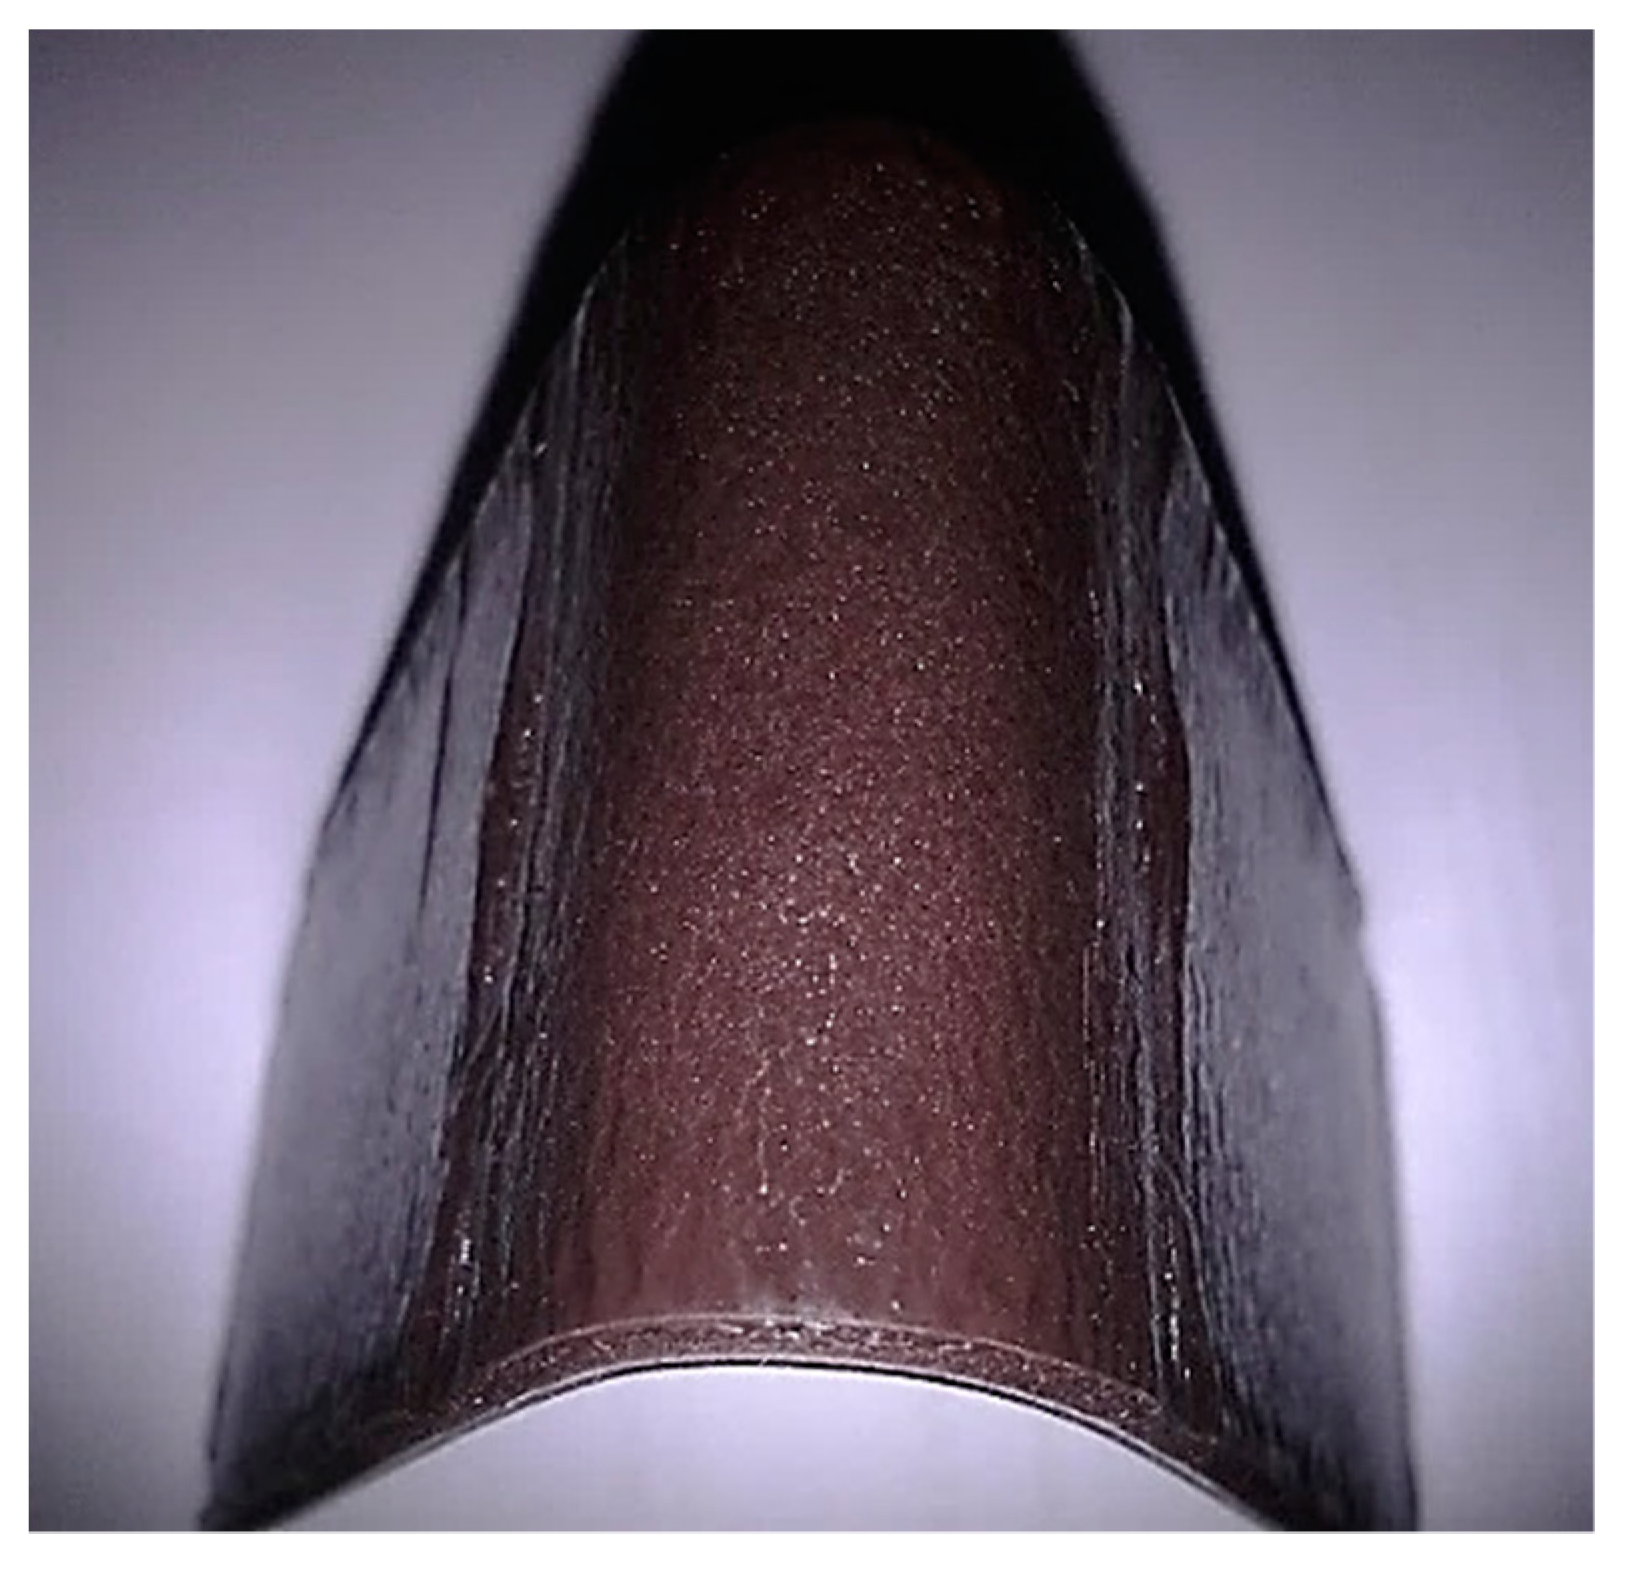
Figure 10 shows sample SV1 after a validation test. With a relatively high flexural strength and modulus as shown in Table 9, the coating for sample SV1, SV2, and SV3 showed no crack or debonding. Compared with previous studies [2,3,42], it can be concluded that the coating was very flexible and has good adhesion bonding with the substrate since no surface cracking and debonding occurred. Both properties are very important, and the optimized coating has potential in many applications, which require flexible coating.

3.7. Flexural Properties and Microstructure Analysis

The mechanical properties of the coating of the selected samples were compared using the load–displacement curves and observation on the onset of cracking. To study the influence of the microstructure on the flexural properties, the coated mild steel with highest flexural strength (S14), lowest flexural strength (S17), and a sample suspected to have ductile behavior (S13) were selected. The uncoated mild steel served as control. The control sample showed very high bending stress at 691.10 MPa compared to the coated samples. This is due to its low strength in resisting the bending load as reported by Umesh et al. [43]. 
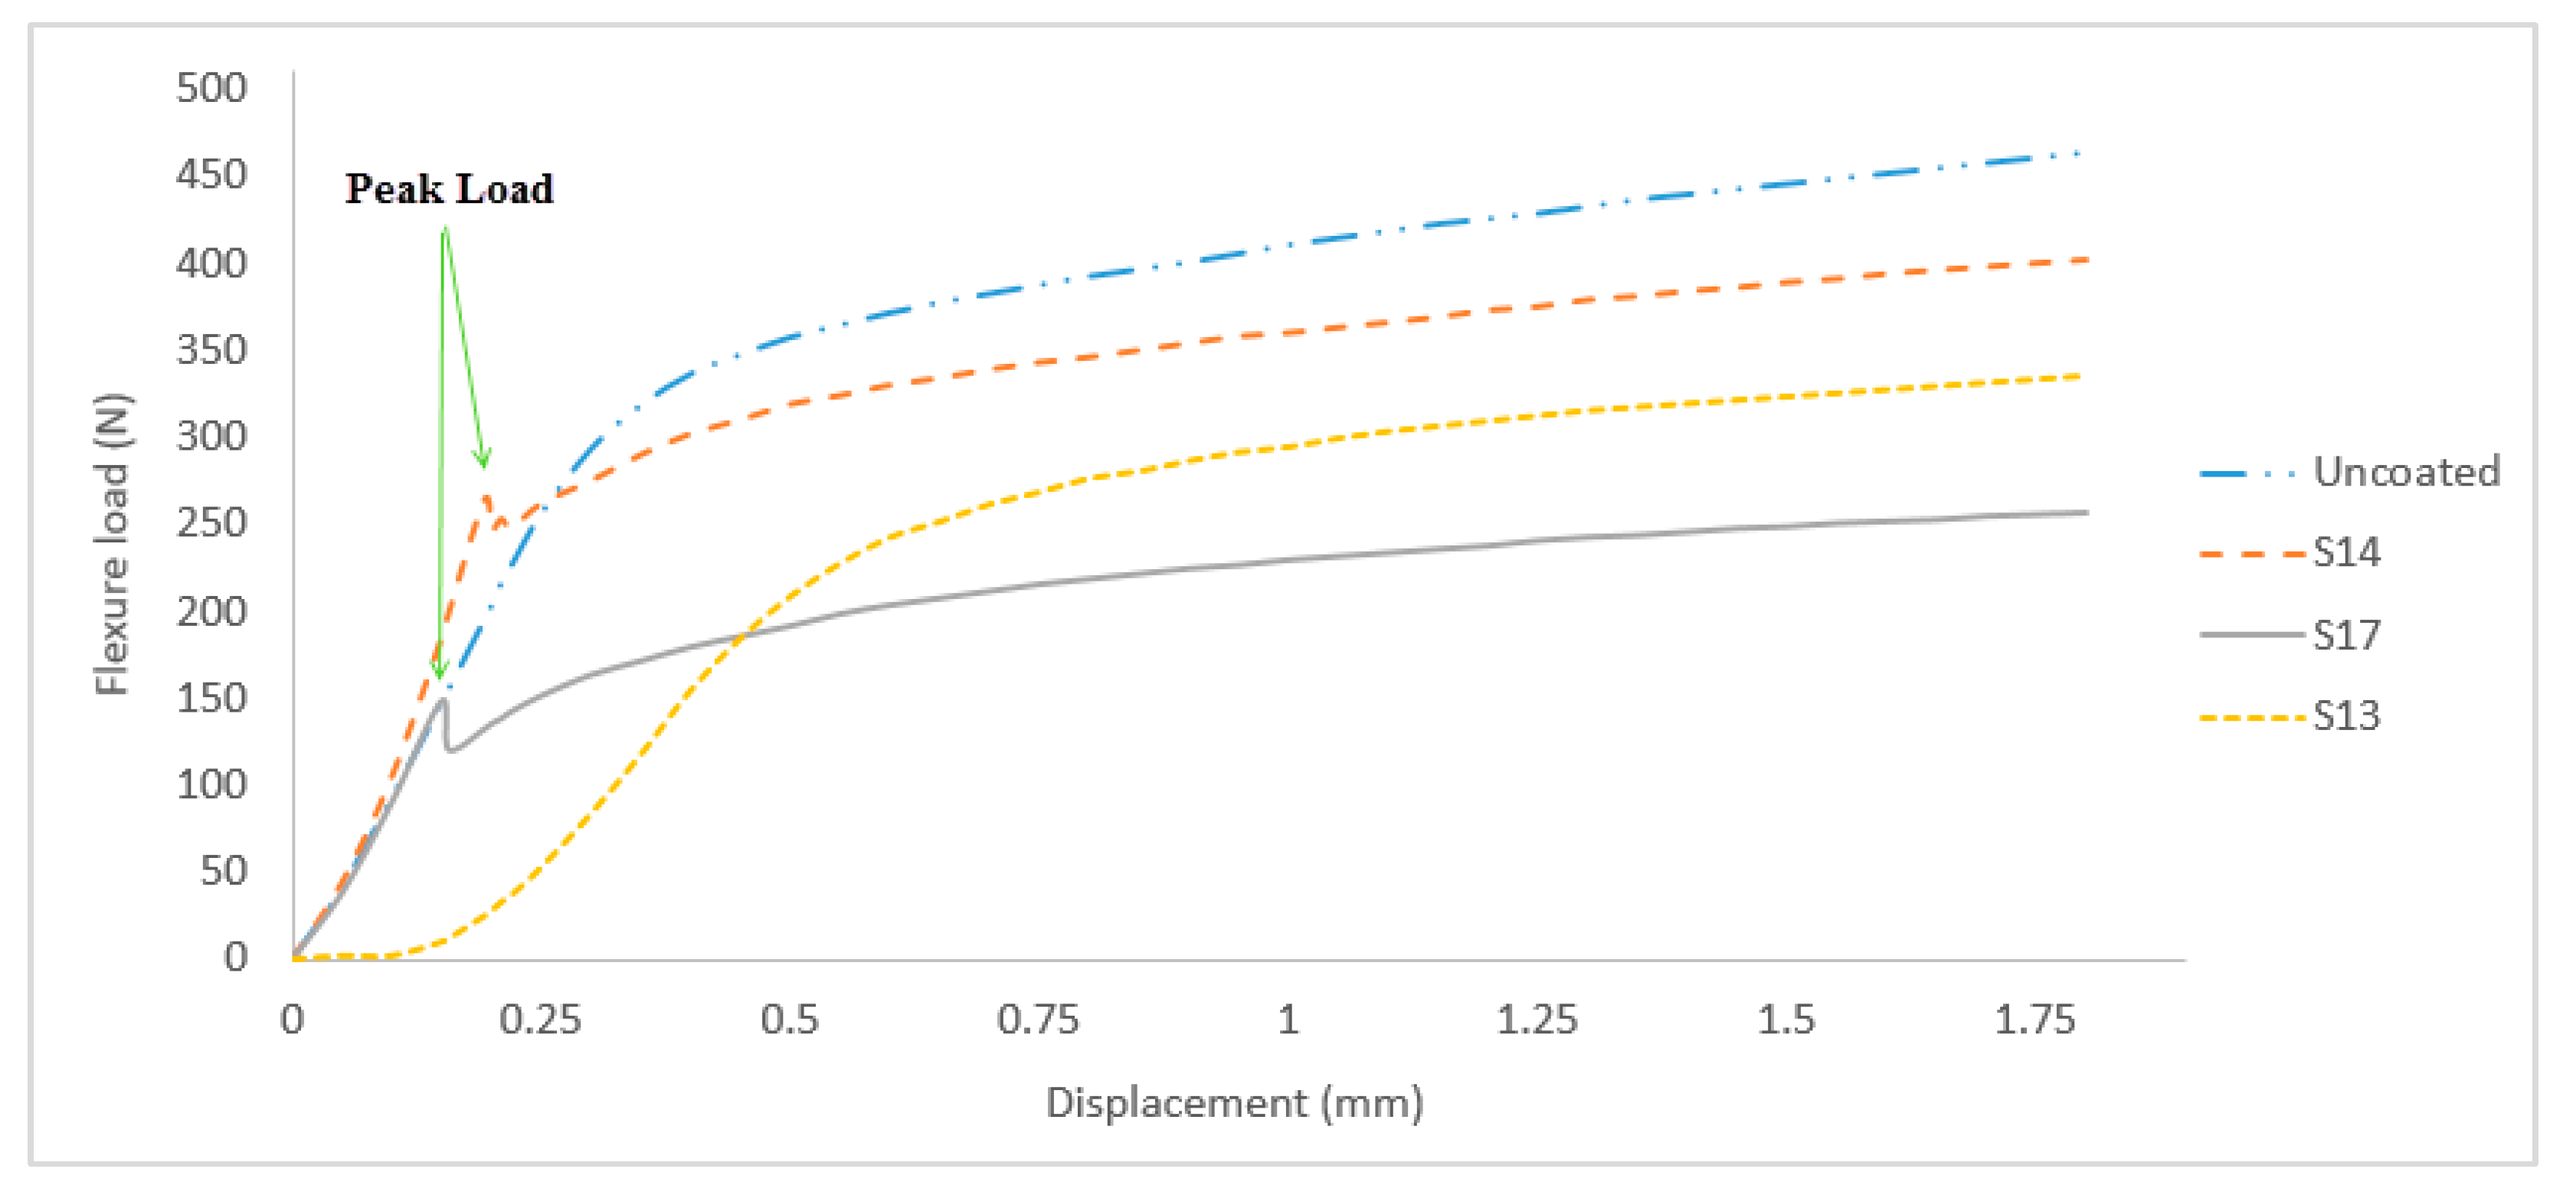
Figure 11 shows the load–extension characteristics of sample S17, S14, and the substrate during a three-point bending test.
S17 and S14 produced the lowest at 102.71 MPa and the highest flexural strength at 156.92 MPa, respectively, while S13 showed ductile behavior with relative high flexural strength at 143.15 MPa. Although the flexural strength of sample S13 was higher than that of sample S17, it exhibited ductile behavior due to a very high flexural modulus, which is 4636.30 MPa compared to 2912.19 MPa. During the bending process, the outer coating surface was subjected to tensile stress while compression stress occurred between indenter and the surface of the substrate. The crack on both samples extended further at the peak load.
S14 exhibited higher peak load at approximately 0.20 mm of displacement which indicated stronger interfacial strength and adhesion strength between coating and substrate as compared to S17 which exhibited lower peak load at approximately 0.15 mm of displacement. Similar results were previously recorded by Yang et al. [2]. From all 20 samples tested, only three samples which were S2, S4, and S13 showed no peak load, which indicated high ductility coating. Substrate without coating and samples S2, S4, and S13 showed no holding load while other samples were subjected to holding load between 0.1 and 0.5 mm of displacement.
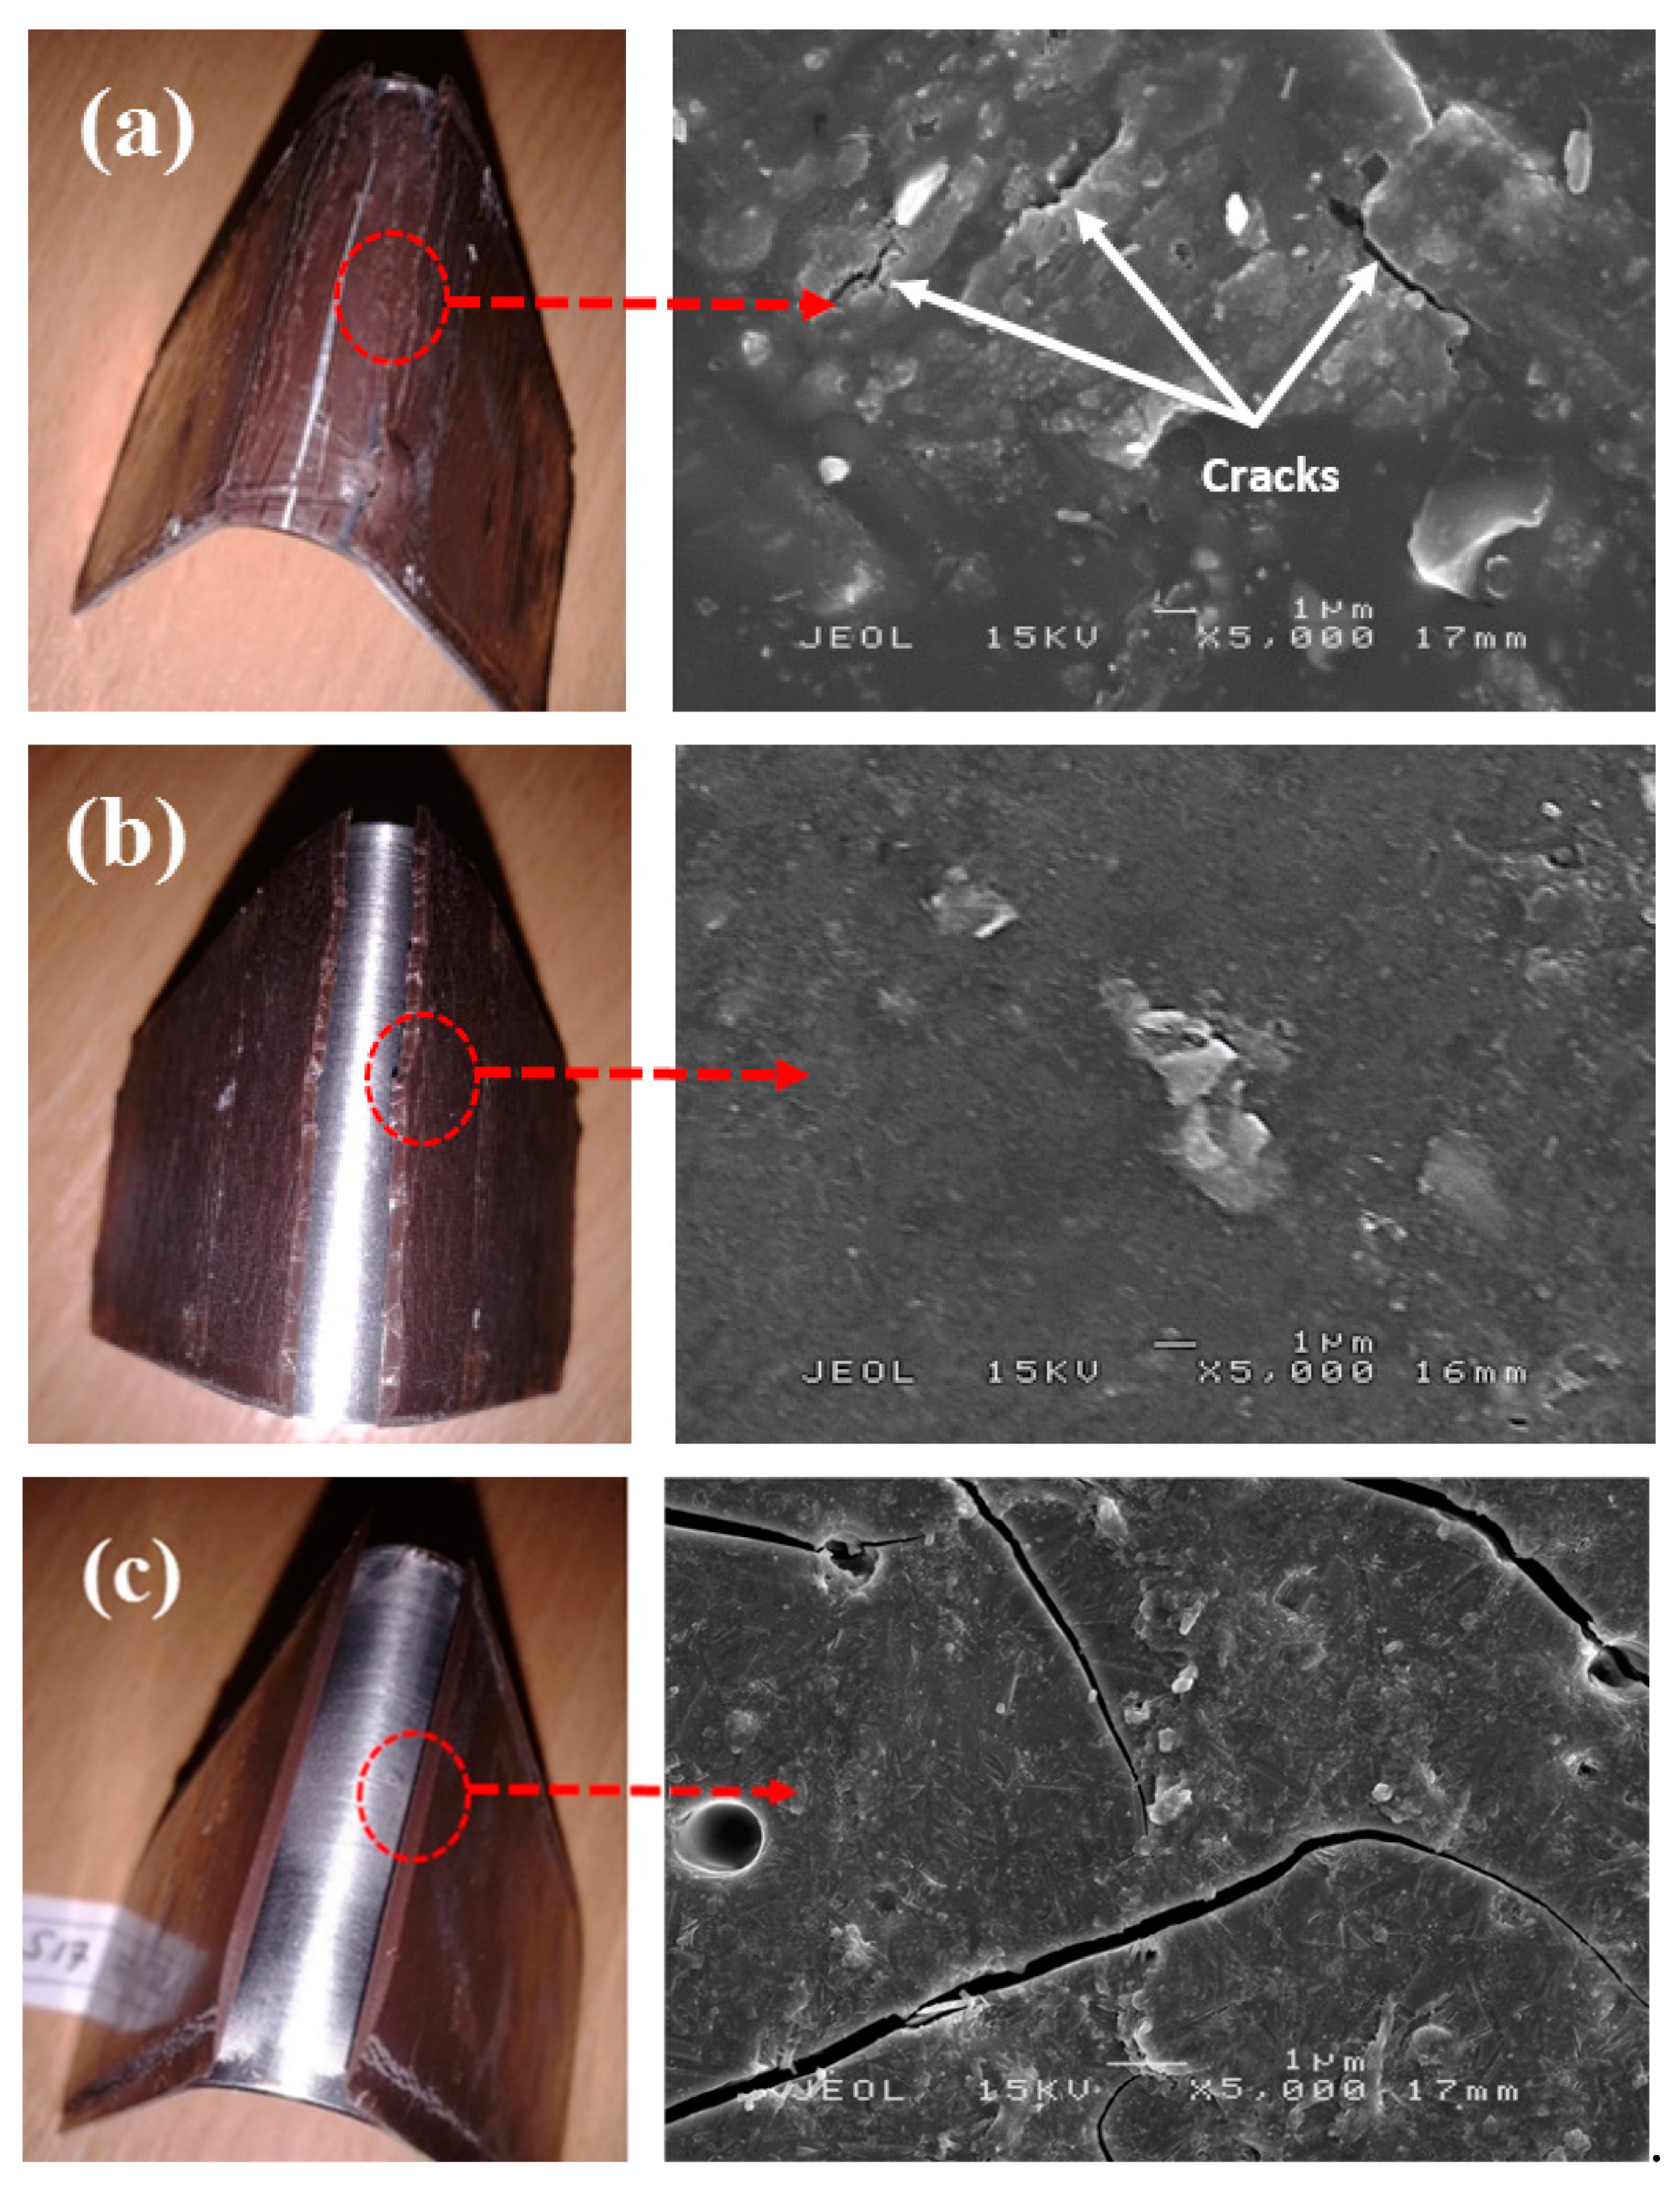
Figure 12 shows SEM micrographs of sample S13 which exhibited no peak load, S14 which produced the highest flexural strength and exhibited peak load, and S17 which produced the lowest flexural strength and displayed peak load. The absence of the peak load indicated that the coating was ductile. During the bending process, the coating was subjected to a high plastic deformation rate causing it to expand and develop cracks. However, due to adequate bonding between coating and substrate in S13, the expansion was delayed. Only with the additional load applied to the sample, cracks appeared along the interface causing damage to the system. The propagation of cracks was observed in S13 and S17 are respectively shown in Figure 12a,c.
Ductile coating in sample S13 showed minor and rough cracks while the brittle coating in S17 displayed a crack with clean linear cut. Results showed that the expansion in S13 was delayed while S17 failed to withstand high flexural load causing it to break without any resistant. S14 as shown in Figure 12b, which had a smoother surface compared to S17, showed no formation of crystal particles on its surface or within its geopolymer matrix. It is possible that S14 had undergone a higher rate of geopolymerization, which resulted in a highly homogeneous mixture [44]. Bonding between RHA particles and AA solution is, therefore, stronger and was able to produce a higher flexural strength compared to that in S17.
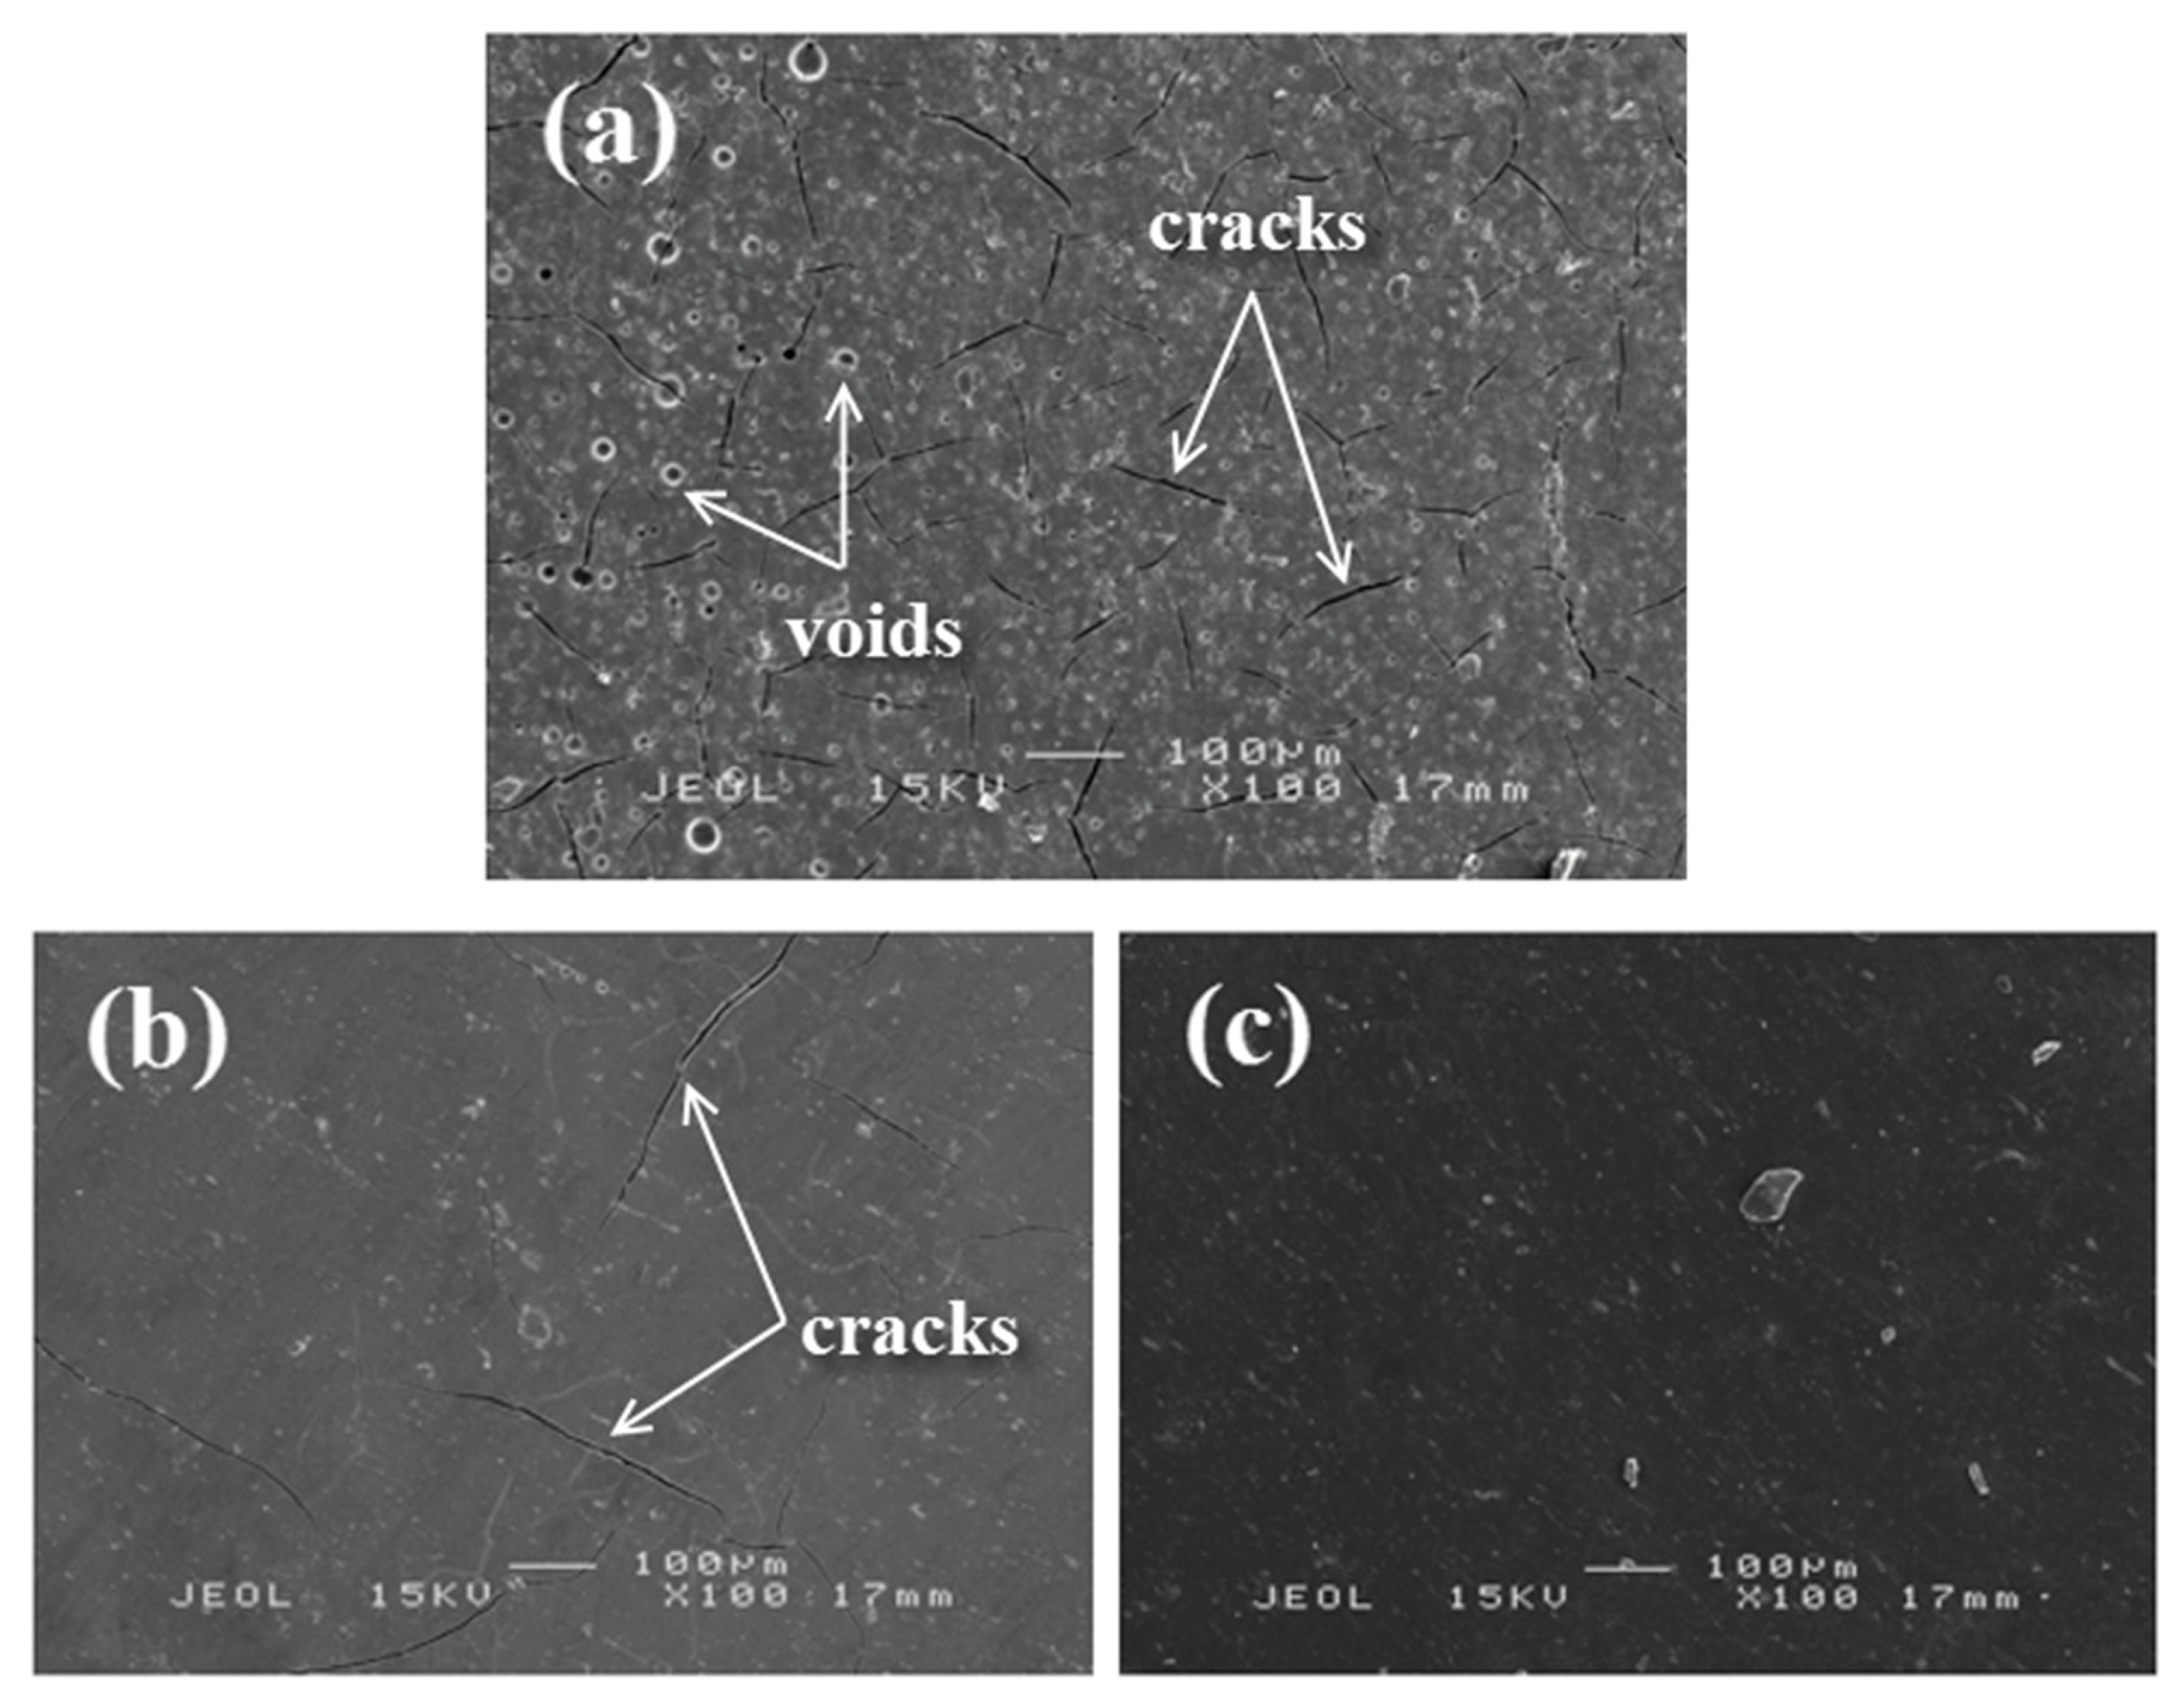
Figure 13 shows microscopic images of cracks formed on the surface of three samples that exhibited different damage behaviors during bending tests. Compared to S14, adhesion bonding between substrate and coating for S17 was weak and the coating showed brittle behavior.
S17 was also subjected to higher residual stress at the interface, which resulted in lower interfacial adhesion. When the load was applied, the coated sample stored the strain energy which would potentially cause crack formation between the coating layer and the substrate [45]. Upon debonding at the coating–substrate interface, the energy was released and caused cracks to nucleate from voids and propagate along with the interface. Since S17 had a lower energy release rate compared to S14, multiple cracking formed with a larger crack width in the coating layer and which subsequently lowered the overall flexural strength and modulus. When further load was applied, the sample failed to endure high plastic deformation causing the brittle coating layer to rupture and delaminate from the substrate as shown in Figure 13a,b. Sample S13 in Figure 13c was less porous and a homogeneous phase was formed in the geopolymer matrix. The number of cracks which occurred in the ductile coating was very minimal.
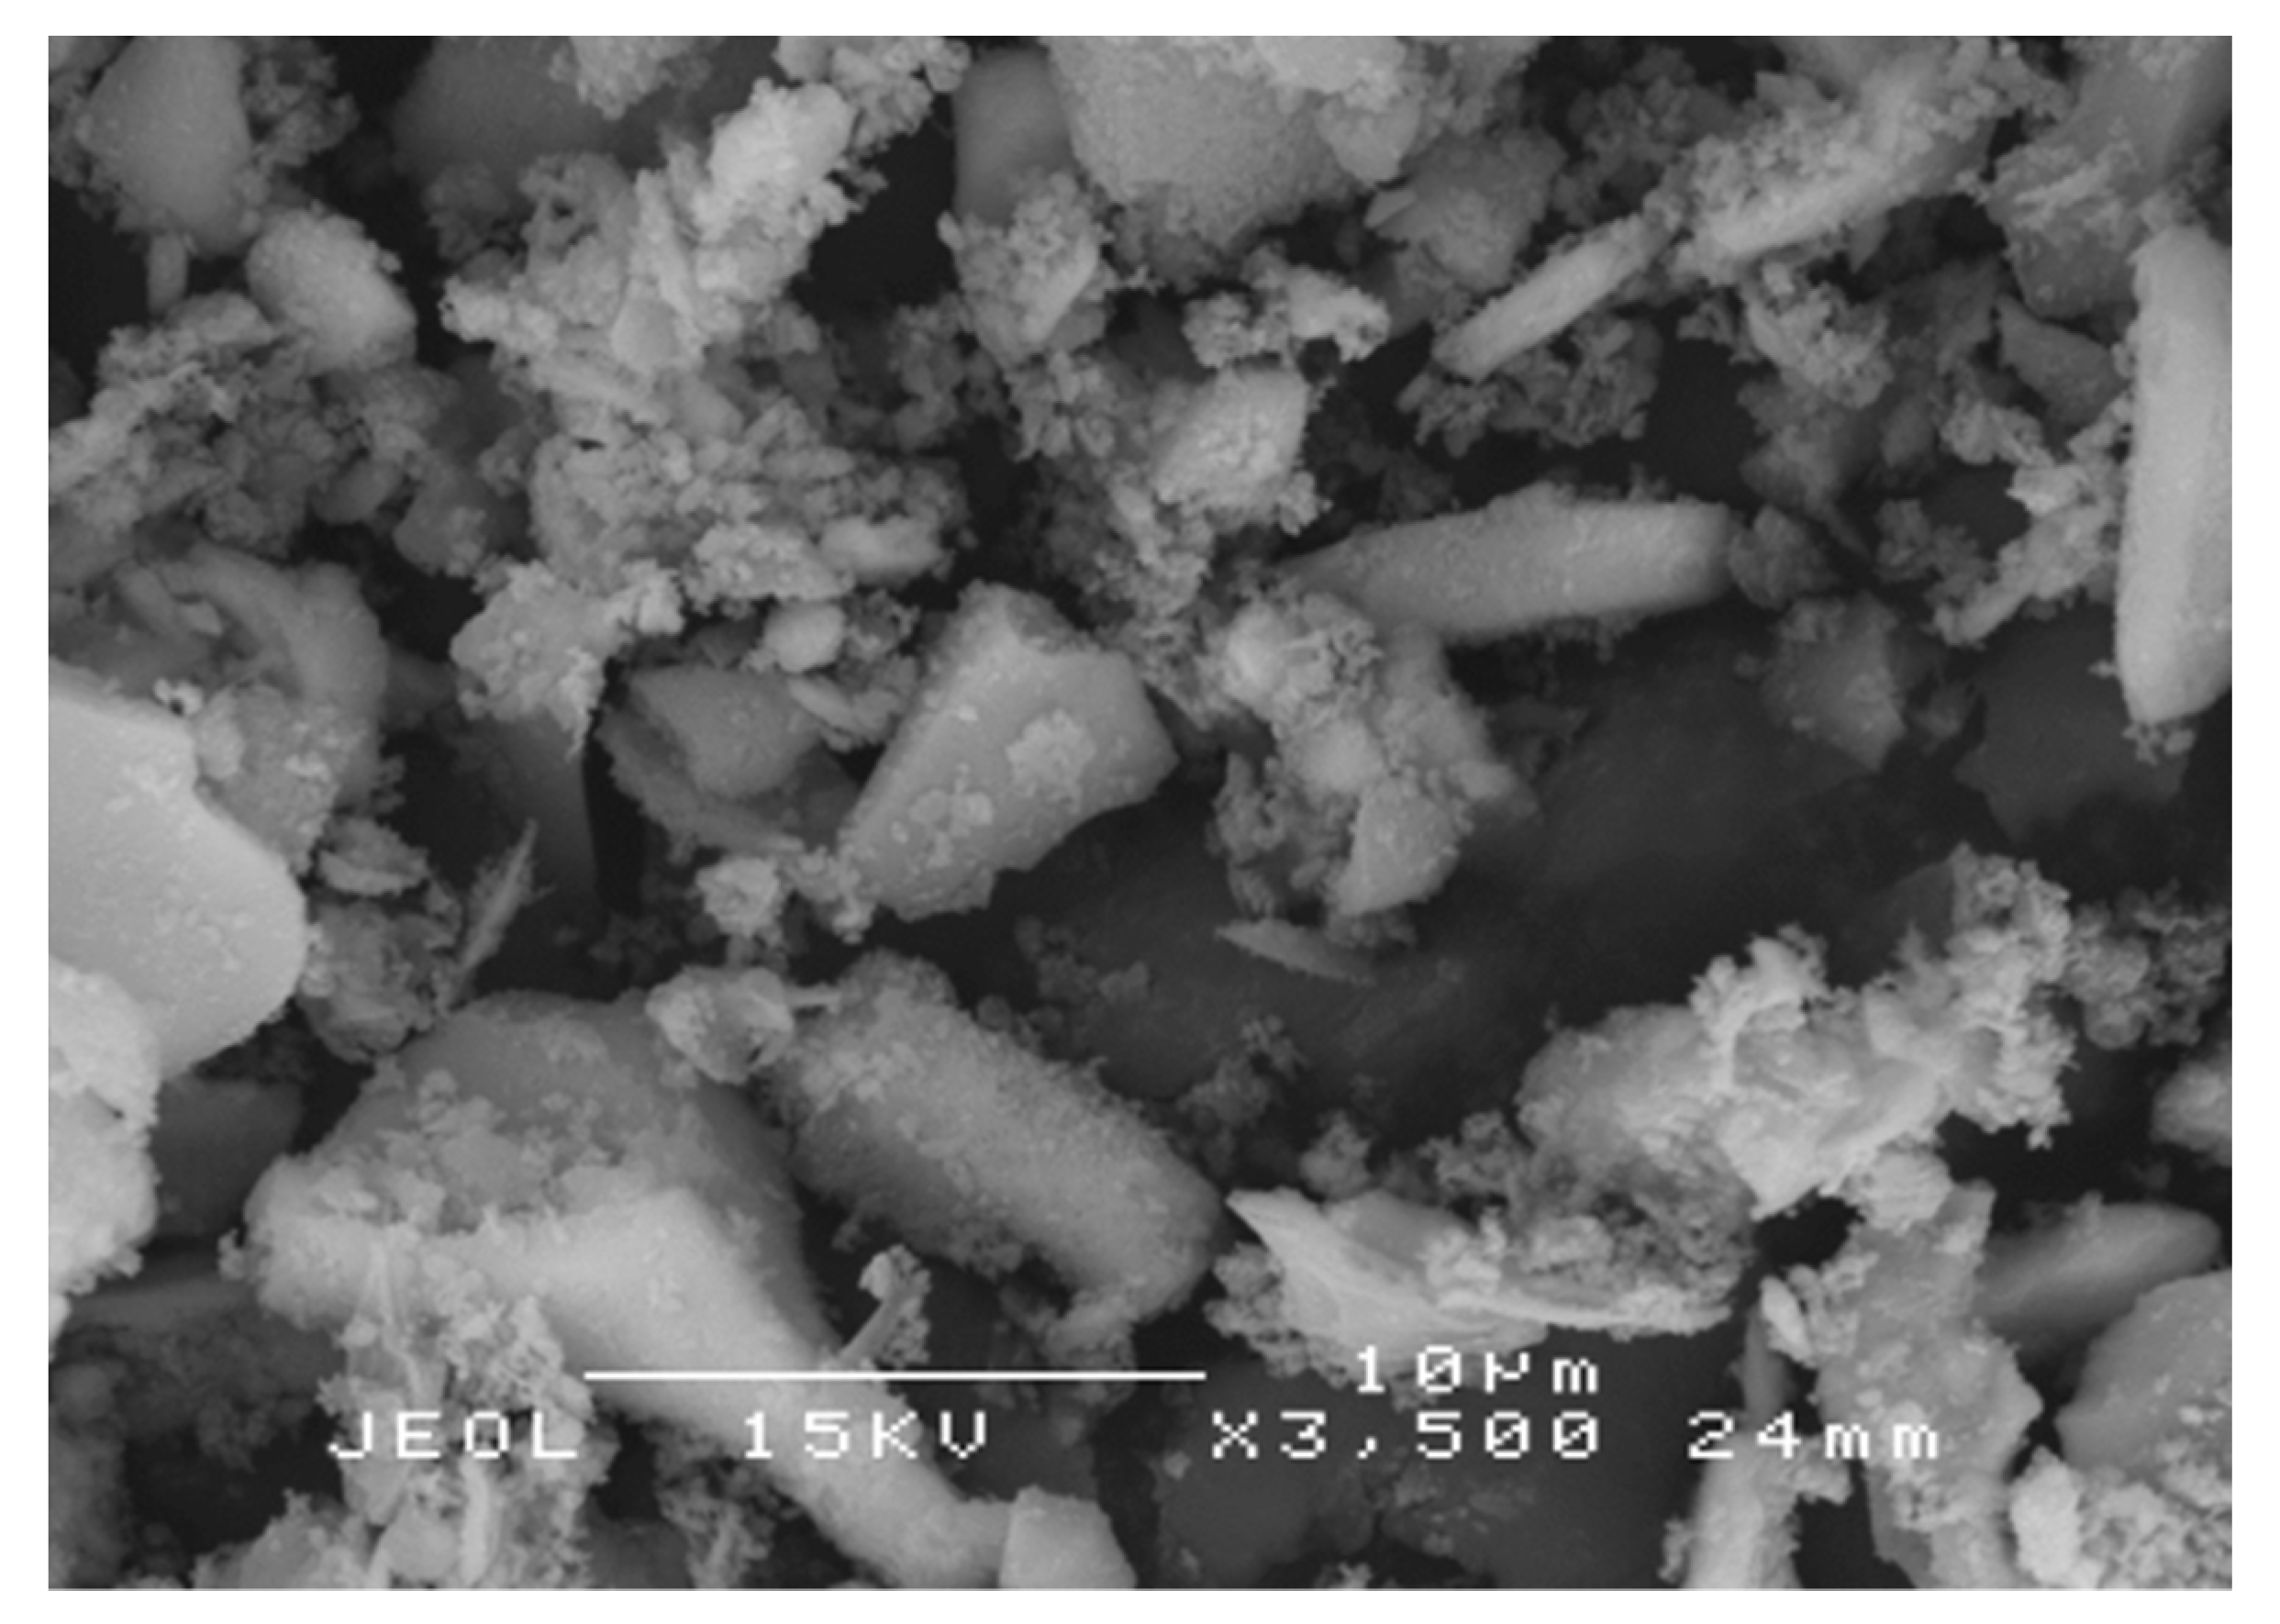
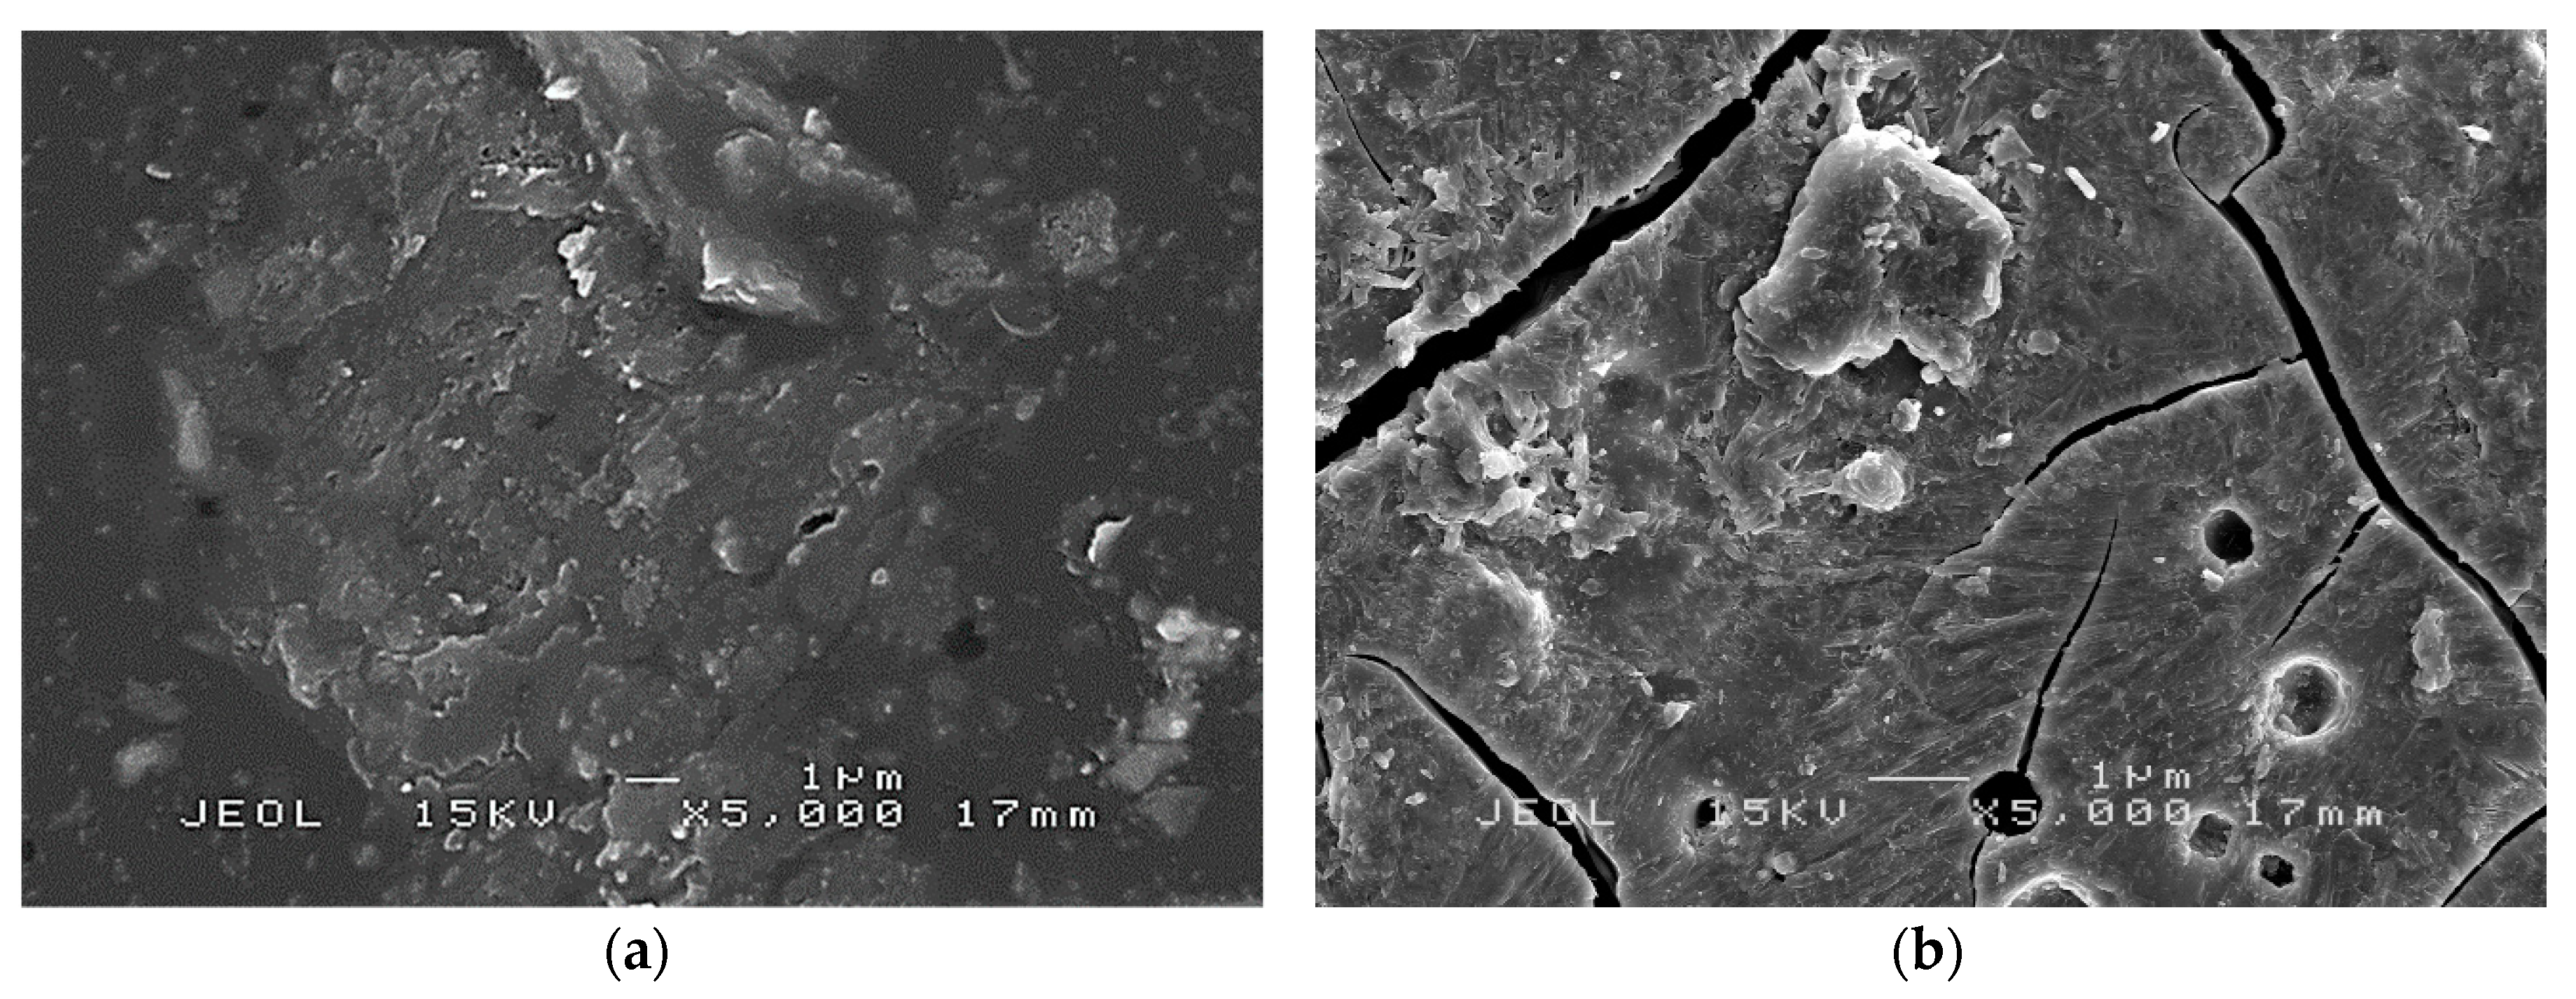
In addition to crack formation, particle agglomeration of RHA-based geopolymer had also contributed to low flexural strength. As shown in Figure 14, the particles of RHA-based geopolymer in S17 (Figure 14b) were highly agglomerated as compared to that of sample S13 (Figure 14a). The agglomeration was probably influenced by RHA/AA ratio and water to solid (W/S) ratio with the silica component not homogeneously dispersed into the geopolymer matrix. S17 had a lower W/S ratio of 1.18 compared to S13 with 1.68. A lower W/S ratio resulted in a low degree of geopolymerization resulted in a partial reaction process. During the bending process, stress would be concentrated at the area where the RHA agglomerated leading to initiation of cracks.

4. Conclusions

The response surface methodology was proved to be an adequate tool to study the relationship between factors that significantly influenced the flexural properties. From the analysis and investigation, the RHA/AA ratio (V2) showed the most significant effect on the response followed by curing temperature (V3). The ratio of AA solution provided no effect to the flexural strength and modulus. From surface and contour plots, high flexural strength was observed for a geopolymer cured in the range of 47 to 60 °C and within 0.36 to 0.48 for the RHA/AA ratio. In addition, high flexural strength was achieved when the W/S ratio is between 1.22 and 1.29, and Si/Al ratio between 98 and 104. High flexural modulus of greater than 5000 MPa can be achieved when the RHA/AA ratio is approximately 0.32 and curing temperature of 41 °C. The high value of a flexural modulus appeared at the Si/Al ratio between 97 and 104, and the W/S ratio between 1.23 and 1.30. The maximum value of both flexural strength and flexural modulus could be achieved by using V1 = 3.5, V2 = 0.39, and V3 = 45.7 °C. The validated coating samples experienced no cracks or debonding, which means that the coating is flexible and has good adhesion bonding with the substrate. A geopolymer composite coating (GCC) sample with different properties showed varying behavior. Sample S17 had multiple cracking formed with a larger crack width in the coating layer, which leads to the overall flexural strength and modulus. The latter also differed according to their flexural strength. GCC with high strength at 156.92 MPa was more brittle and had more cracks than GCC with lower strength at 102.71 MPa. Sample S17, which was highly agglomerated compared to sample S13, resulted in low flexural strength due to the higher content of silica. Several potential studies have been identified including an XRD test to investigate the homogeneity of the geopolymer binder and involving different types of substrate such as glass, wood, and fiber.

Author Contributions

Conceptualization, F.M. and N.M.; Methodology, M.S.M.B.; Software, M.S.M.B.; Validation, M.S.M.B.; Formal Analysis, M.S.M.B. and N.M.; Investigation, M.R.I.; Resources, F.M.; Data Curation, M.S.M.B.; Writing—Original Draft Preparation, M.S.M.B.; Writing—Review and Editing, M.S.M.B., N.M., and M.R.I.; Visualization, F.M.; Supervision, F.M., M.R.I., and N.M.; Project Administration, F.M. and N.M.; Funding Acquisition, F.M. All authors have read and agreed to the published version of the manuscript.

Funding

This research was funded by Geran Putra—IPS (9466800), Research University (RUGS) Grant (93771000 and 9393700) and the Fundamental Research Grant Scheme (FRGS) sponsored by the Ministry of Education (5524464).

Acknowledgments

Appreciation is given to all assistant engineers in the department of aerospace engineering for their guidance and laboratory assistance.

Conflicts of Interest

The authors declare no conflict of interest.

References

  1. Beck, H.; Siemers, M.; Reuter, M. Verification of resistance to fire. In Powder-Actuated Fasteners and Fastening Screws in Steel Construction; John Wiley & Sons: Hoboken, NJ, USA, 2013; p. 4.1.3. [Google Scholar]
  2. Yang, G.-R.; Song, W.-M.; Lu, J.-J.; Hao, Y.; Ma, Y. Three-point bending behavior of surface composite Al2O3/Ni on bronze substrate produced by vacuum infiltration casting. J. Mater. Process. Technol. 2008, 202, 195–200. [Google Scholar] [CrossRef]
  3. Li, W.Z.; Yao, Y.; Li, Y.Q.; Li, J.B.; Gong, J.; Sun, C.; Jiang, X. Damage behavior of the NiCrAlY coating systems with or without barrier layer during three-point bending. Mat. Sci. Eng. A 2008, 512, 117–125. [Google Scholar] [CrossRef]
  4. Temuujin, J.; Minjigmaa, A.; Rickard, W.; van Riessen, A. Thermal Properties of Spray-coated Geopolymer-Type Compositions. J. Thermal Anal. Calorim. 2012, 107, 287–292. [Google Scholar] [CrossRef]
  5. Basri, M.S.M.; Mazlan, N.; Mustapha, F.; Ishak, M.R. Correlation between Compressive Strength and Fire Resistant Performance of Rice Husk Ash-Based Geopolymer Binder for Panel Applications. MATEC Web Conf. 2017, 97, 01025. [Google Scholar] [CrossRef] [Green Version]
  6. Basri, M.; Salahuddin, M.O.; Mustapha, F.; Mazlan, N.O.; Ishak, M.R. Fire Retardant Performance of Rice Husk Ash-Based Geopolymer Coated Mild Steel—A Factorial Design and Microstructure Analysis. Mater. Sci. Forum 2016, 841, 48–54. [Google Scholar] [CrossRef]
  7. Xie, J.; Wang, J.; Rao, R.; Wang, C.; Fang, C. Effects of combined usage of GGBS and fly ash on workability and mechanical properties of alkali activated geopolymer concrete with recycled aggregate. Compos. B Eng. 2019, 164, 179–190. [Google Scholar] [CrossRef]
  8. Xie, J.; Chen, W.; Wang, J.; Fang, C.; Zhang, B.; Liu, F. Coupling effects of recycled aggregate and GGBS/metakaolin on physicochemical properties of geopolymer concrete. Constr. Build. Mater. 2019, 226, 345–359. [Google Scholar] [CrossRef]
  9. Messina, F.; Ferone, C.; Molino, A.; Roviello, G.; Colangelo, F.; Molino, B.; Cioffi, R. Synergistic recycling of calcined clayey sediments and water potabilization sludge as geopolymer precursors: Upscaling from binders to precast paving cement-free bricks. Constr. Build. Mater. 2017, 133, 14–26. [Google Scholar] [CrossRef]
  10. Colangelo, F.; Roviello, G.; Ricciotti, L.; Ferrandiz-Mas, V.; Messina, F.; Ferone, C.; Tarallo, O.; Cioffi, R.; Cheeseman, C.R. Mechanical and thermal properties of lightweight geopolymer composites. Cem. Concr. Comp. 2018, 86, 266–272. [Google Scholar] [CrossRef]
  11. Davidovits, J. From Ancient Concrete to Geopolymers. Arts Metiers Mag 1993, 180, 8–16. [Google Scholar]
  12. Temuujin, J.; Minjigmaa, A.; Rickard, W.; Lee, M.; Williams, I.; van Riessen, A. Fly ash based geopolymer thin coatings on metal substrates and its thermal evaluation. J. Hazard. Mater. 2010, 180, 748–752. [Google Scholar] [CrossRef] [PubMed]
  13. Temuujin, J.; Minjigmaa, A.; Rickard, W.; Lee, M.; Williams, I.; van Riessen, A. Preparation of metakaolin based geopolymer coatings on metal substrates as thermal barriers. Appl. Clay Sci. 2009, 46, 265–270. [Google Scholar] [CrossRef]
  14. Abu Bakar, B.H. Malaysian Rice Husk Ash—Improving the Durability and Corrosion Resistance of Concrete: Pre-review. Concr. Res. Lett. 2010, 1, 6–13. [Google Scholar]
  15. Chindaprasirt, P.; Rukzon, S. Strength, porosity and corrosion resistance of ternary blend Portland cement, rice husk ash and fly ash mortar. Constr. Build. Mater. 2008, 22, 1601–1606. [Google Scholar] [CrossRef]
  16. Songpiriyakij, S.; Kubprasit, T.; Jaturapitakkul, C.; Chindaprasirt, P. Compressive strength and degree of reaction of biomass- and fly ash-based geopolymer. Constr. Build. Mater. 2010, 24, 236–240. [Google Scholar] [CrossRef]
  17. De Silva, P.; Sagoe-Crenstil, K.; Sirivivatnanon, V. Kinetics of geopolymerization: Role of Al2O3 and SiO2. Cem. Concr. Res. 2007, 37, 512–518. [Google Scholar] [CrossRef]
  18. Box, G.E.P.; Wilson, K.B. On the experimental attainment of optimum conditions. J. R. Stat. Soc. 1951, 13, 1–45. [Google Scholar] [CrossRef]
  19. Seeman, M.; Ganesan, G.; Karthikeyan, R.; Velayudham, A. Study on tool wear and surface roughness in machining of particulate aluminum matel matrix composite-response surface methodology approach. Int. J. Adv. Manuf. Technol. 2010, 48, 613–624. [Google Scholar] [CrossRef]
  20. Açıkel, Ü.; Erşan, M.; Açıkel, Y.S. Optimization of critical medium components using response surface methodology for lipase production by Rhizopus delemar. Food Bioprod. Process. 2010, 88, 31–39. [Google Scholar] [CrossRef]
  21. Khan, M.I.; Azizli, K.; Sufian, S.; Man, Z. Sodium silicate-free geopolymers as coating materials: Effects of Na/Al and water/solid ratios on adhesion strength. Ceram. Int. 2014, 4, 2794–2805. [Google Scholar]
  22. Patil, N.A.; Pedapati, S.R.; Mamat, O.; Hidayat Syah Lubis, A.M. Optimization of Friction Stir Process Parameters for Enhancement in Surface Properties of Al 7075-SiC/Gr Hybrid Surface Composites. Coatings 2019, 9, 830. [Google Scholar] [CrossRef] [Green Version]
  23. Asif, A.; Man, Z.; Mohd Azizli, K.A.; Nuruddin, M.F.; Ismail, L. The Effect of Si/Al Ratio and Sodium Silicate on the Mechanical Properties of Fly ash based Geopolymer for Coating. Mater. Sci. Forum 2015, 803, 355–361. [Google Scholar] [CrossRef]
  24. Rahmiati, T.; Azizli, K.A.; Man, Z.; Ismail, L.; Nuruddin, M.F. Effect of Solid/liquid ratio during curing time fly ash based geopolymer on mechanical property. Mater. Sci. Forum 2015, 803, 120–124. [Google Scholar] [CrossRef]
  25. Mustafa Al Bakri, A.M.; Kamarudin, H.; BinHussain, M.; Khairul Nizar, I.; Zarina, Y.; Rafiza, A.R. The Effect of Curing Temperature on Physical and Chemical Properties of Geopolymers. Phys. Procedia 2011, 22, 286–291. [Google Scholar] [CrossRef] [Green Version]
  26. Foo, K.Y.; Hameed, B.H. Utilization of rice husk ash as novel adsorbent: A judicious recycling of the colloidal agricultural waste. Adv. Colloid Interface Sci. 2009, 152, 39–47. [Google Scholar] [CrossRef]
  27. Shinohara, Y.; Kohyama, N. Quantitative analysis of tridymite and cristobalite crystallized in rice husk ash by heating. Ind. Health 2004, 42, 277–285. [Google Scholar] [CrossRef]
  28. Chaudhary, D.S.; Jollands, M.C. Characterization of rice hull ash. J. Appl. Polym. 2004, 93, 1–8. [Google Scholar] [CrossRef]
  29. Chaudhary, D.S.; Jollands, M.C.; Cser, F. Recycling rice hull ash: A filler material for polymeric composites? Adv. Polym. Technol. 2004, 23, 147–155. [Google Scholar] [CrossRef]
  30. Muthadhi, A.; Anitha, R.; Kothandaraman, S. Rice husk ash-Properties and its uses: A review. J. Inst. Eng. India Civil Eng. Div. 2007, 88, 50–56. [Google Scholar]
  31. Xu, H.; Van Deventer, J.S. Effect of source materials on geopolymerization. Ind. Eng. Chem. Res. 2003, 42, 1698–1706. [Google Scholar] [CrossRef]
  32. Mohd Yusof, A.; Nizam, N.A.; Abd Rashid, N.A. Hydrothermal conversion of rice husk ash to faujasite-types and NaA-type of zeolites. J. Porous Mater. 2010, 17, 39–47. [Google Scholar] [CrossRef]
  33. Hardjito, D.; Rangan, V. Development and Properties of Low-Calcium Fly Ash-Based Geopolymer Concrete; Research Report GC 1; Curtin University of Technology: Perth, Australia, 2005. [Google Scholar]
  34. Chindaprasirt, P.; Chotetanorm, C.; Rukzon, S. Use of palm oil fuel ash to improve chloride and corrosion resistance of high-strength and high-workability concrete. J. Mater. Civil Eng. 2010, 23, 499–503. [Google Scholar] [CrossRef]
  35. Thuc, C.N.H.; Thuc, H.H. Synthesis of silica nanoparticles from Vietnamese rice husk by sol–gel method. Nanoscale Res. Lett. 2013, 8, 1–10. [Google Scholar]
  36. Kong, D.L.Y.; Sanjayan, J.G.; Safoe-Crentsil, K. Comparative performance of geopolymers made with metakaolin and fly ash after exposure to elevated temperatures. Cem. Concr. Res. 2007, 37, 1583–1589. [Google Scholar] [CrossRef]
  37. Hardjito, D.; Wallah, S.E.; Sumajouw, D.M.; Rangan, B.V. On the development of fly ash-based geopolymer concrete. ACI Mater. J. 2004, 101, 467–472. [Google Scholar]
  38. Van Jaarsveld, J.G.S.; Van Deventer, J.S.J.; Lukey, G.C. The effect of composition and temperature on the properties of fly ash-and kaolinite-based geopolymers. Chem. Eng. J. 2002, 89, 63–73. [Google Scholar] [CrossRef]
  39. Chindaprasirt, P.; Chareerat, T.; Sirivivatnanon, V. Workability and strength of coarse high calcium fly ash geopolymer. Cem. Concr. Comp. 2007, 29, 224–229. [Google Scholar] [CrossRef]
  40. Nagral, M.R.; Ostwal, T.; Chitawadagi, M.V. Effect of Curing Temperature and Curing Hours on the Properties of Geo-Polymer Concrete. Int. J. Comput. Eng. Res. 2014, 4, 1–11. [Google Scholar]
  41. Sivaraos; Milkey, K.R.; Samsudin, A.R.; Dubey, A.K.; Kidd, P. Comparison between Taguchi Method and Response Surface Methodology (RSM) in Modelling CO2 Laser Machining. Jordan J. Mech. Ind. Eng. 2014, 8, 35–42. [Google Scholar]
  42. Al-Anazi, D.; Hashmi, M.S.J.; Yilbas, B.S. Three-point bend testing of HVOF AMDRY 9954 coating on Ti–6Al–4V alloy. J. Mater. Process. Technol. 2006, 174, 204–210. [Google Scholar] [CrossRef]
  43. Umesh, G.; Mallikarjun, B.; Ramesh, C.S. Analysis of Bending Stresses On Coating Materials by Experimental and FE Method. Int. J. Mech. Ind. Technol. 2015, 2, 41–50. [Google Scholar]
  44. Guzmán-Aponte, L.A.; Mejia de Gutierrez, R.; Maury-Ramírez, A. Metakaolin-Based Geopolymer with Added TiO2 Particles: Physicomechanical Characteristics. Coatings 2017, 7, 233. [Google Scholar]
  45. Konsta-Gdoutos, M.S. Calculation of Strain Energy Release Rate from Load—Displacement—Crack Area Equation. Probl. Fract. Mech. Fatigue 2003, 117–120. [Google Scholar] [CrossRef]
Figure 1. A 3D view of the three-point bending test set up.
Coatings 10 00165 g001
Figure 2. SEM for Rice Husk Ash (RHA) particles.
Coatings 10 00165 g002
Figure 3. Contour plot of curing temperature vs. RHA/AA ratio for flexural strength.
Coatings 10 00165 g003
Figure 4. Contour plot of W/S ratio vs. Si/Al ratio for flexural strength.
Coatings 10 00165 g004
Figure 5. Surface plot of flexural strength vs. curing temperature and RHA/AA ratio.
Coatings 10 00165 g005
Figure 6. Contour plot of curing temperature vs. RHA/AA ratio.
Coatings 10 00165 g006
Figure 7. Surface plot of flexural modulus vs. curing temperature and the RHA/AA ratio.
Coatings 10 00165 g007
Figure 8. Contour plot of W/S ratio vs. Si/Al ratio for flexural modulus.
Coatings 10 00165 g008
Figure 9. Optimization plot for maximum responses for flexural modulus and flexural strength.
Coatings 10 00165 g009
Figure 10. Validated sample for flexural test.
Coatings 10 00165 g010
Figure 11. Load–extension (displacement) characteristics of samples during three-point bending tests: (i) substrate without coating; (ii) S14; (iii) S13; and (iv) S17.
Coatings 10 00165 g011
Figure 12. Image and SEM micrograph of samples following the flexural test (a) S13; (b) S14; and (c) S17.
Coatings 10 00165 g012
Figure 13. SEM images of (a) S17—Brittle coating, exhibited lowest flexural strength; (b) S14—Brittle coating, exhibited highest flexural strength, and (c) S13—Ductile coating.
Coatings 10 00165 g013
Figure 14. Particle agglomeration of RHA-based geopolymer following flexural test: (a) S13; and (b) S17 for the flexural test.
Coatings 10 00165 g014
Table 1. Total number of experiments between factorial design and response surface methodology.
FactorsLevelTotal Number of Experiments
Factorial DesignRSM
2525 (52)13
35125 (53)20
45625 (54)31
553125 (55)52
Table 2. Factors and levels used for the flexural test.
FactorUnitSymbolLevels
−2−1012
Ratio of activated alkaline (AA) solutionV11.52.02.53.03.5
RHA/AA ratioV20.30.40.50.60.7
Curing temperature°CV34050607080
Table 3. Design matrix.
SampleCoded FactorsUncoded Factors
V1V2V3V1V2V3
S10002.50.560
S20021.50.560
S30003.00.450
S41−112.00.450
S50−202.50.540
S611−12.50.560
S7−1112.50.560
S80002.00.470
S91112.50.580
S100002.50.560
S11−1−112.50.560
S120002.00.670
S13−11−12.50.360
S141−1−13.50.560
S152002.50.560
S160203.00.650
S1700−22.50.760
S180003.00.470
S19−1−1−13.00.670
S20−2002.00.650
Table 4. Calculated weight ratio for AA and RHA/AA.
Value of FactorWeight (g)
Ratio of AARHA/AA RatioRatio of AARHA/AA Ratio
Na2SiO3NaOHAARHA
3.00.493124.8
2.50.7104149.8
Table 5. Chemical composition of RHA.
ElementSiO2PdOAl2O3Fe2O3CaOK2OCr2O3MnONiOCuOLOI
Mass %87.45.03.01.491.400.490.270.190.0680.0450.647
Table 6. Design matrix and response value for the flexural test.
SampleCoded FactorUncoded FactorResponse
V1V2V3V1V2V3Flexural Strength (MPa)Flexural Modulus (MPa)
S10002.50.560117.882997.41
S20021.50.560146.353512.33
S30003.00.450137.934090.23
S41−112.00.450136.534624.38
S50−202.50.540137.734099.33
S611−12.50.560147.694532.27
S7−1112.50.560134.544408.55
S80002.00.470131.843024.18
S91112.50.580115.782930.53
S100002.50.560147.194189.99
S11−1−112.50.560144.703264.87
S120002.00.670110.892470.39
S13−11−12.50.360143.154636.30
S141−1−13.50.560156.924162.47
S152002.50.560111.852936.30
S160203.00.650115.743444.49
S1700−22.50.760102.712912.19
S180003.00.470118.312674.98
S19−1−1−13.00.670121.493012.02
S20−2002.00.650132.983687.36
Table 7. Estimated effects and coefficient for flexural strength.
TermNotationCoefficientStd. Error of CoefficientP
Constant−78.81173.0070.302
Linear model0.031
Ratio of AA solutionV10.2963.8450.940
RHA/AA ratioV2447.537153.1940.013
Curing temperatureV34.6271.8340.027
Square model0.005
RHA/AA ratio *V2* V2−525.281151.9830.005
Curing temperature **V3** V3−0.0430.0150.015
R2 = 0.8380; R2 (adj) = 0.7436
Note: * RHA/AA ratio; ** Curing temperature.
Table 8. Regression analysis of flexural modulus.
TermNotationCoefficientStd. Error of CoefficientP
Constant7607.951137.870.000
Linear model0.005
Ratio of AA solutionV189.46244.250.720
RHA/AA ratioV2−3279.831221.230.018
Cur. temperatureV3−43.7712.210.003
R2 = 0.6475; R2 (adj) = 0.5217
Table 9. Experimental validation for flexural strength and flexural modulus.
Sample No.Flexural Strength (MPa)Flexural Modulus (MPa)
Experimental ValuePredicted ValueError (%)Experimental ValuePredicted ValueError (%)
SV1161.69140.3215.234056.434508.3810.02
SV2159.41140.3213.604211.234508.386.59
SV3161.16140.3214.854118.334508.388.65
x ¯ Error14.56 x ¯ Error8.42

