Article

Influence of SiO2 Content and Exposure Periods on the Anticorrosion Behavior of Epoxy Nanocomposite Coatings

by
Mohammad Asif Alam
1,
Ubair Abdus Samad
1,
El-Sayed M. Sherif
1,2,*,
Anesh Manjaly Poulose
3,
Jabair Ali Mohammed
1,
Nabeel Alharthi
1,4 and
Saeed M. Al-Zahrani
3
1
Center of Excellence for Research in Engineering Materials (CEREM), King Saud University, P. O. Box 800, Riyadh 11421, Saudi Arabia
2
Electrochemistry and Corrosion Laboratory, Department of Physical Chemistry, National Research Centre, El-Behoth St. 33, Dokki, 12622 Cairo, Egypt
3
SABIC Polymer Research Center (SPRC), Chemical Engineering Department, King Saud University, P.O. Box 800, Riyadh 11421, Saudi Arabia
4
Mechanical Engineering Department, King Saud University, P.O. Box 800, Riyadh 11421, Saudi Arabia
*
Author to whom correspondence should be addressed.
Coatings 2020, 10(2), 118; https://doi.org/10.3390/coatings10020118
Submission received: 27 November 2019 / Revised: 23 January 2020 / Accepted: 26 January 2020 / Published: 31 January 2020

Abstract

:
Epoxy coating formulations containing 1%, 3%, and 5% SiO2 nanoparticles were produced and applied on a mild steel substrate to achieve the objective of high performance corrosion resistance. The electrochemical impedance spectroscopy (EIS) technique was employed to measure the anticorrosive properties of coatings. The corrosion tests were performed by exposing the coated samples in a solution of 3.5% NaCl for different periods of time, varied from 1 h and up to 30 days. Fourier transform infrared spectroscopy (FT-IR) and X-ray diffraction (XRD) analyses revealed the presence of nanoparticles in the final cured samples. Establishing the incorporation of the nanoparticles in the coating formulations was confirmed by employing both of XRD and FT-IR techniques. The FT-IR spectra have proved to be satisfactory indicating that there was a complete reaction between the epoxy resin with the hardener. EIS measurements confirmed that the presence and the increase of SiO2 nanoparticles greatly improved the corrosion resistance of the epoxy coating. The highest corrosion resistance for the coatings was obtained for the formulation with 5% SiO2 nanoparticles content, particularly with prolonging the immersion time to 30 days.

Graphical Abstract

1. Introduction

In order to protect metal from corrosion, the metal surfaces are isolated from the environment with the help of polymeric coatings, as this is still the most conventional method to mitigate corrosion [1]. The properties of these coatings are then modified with the help of nano fillers such as TiO2 [2], ZnO [3], ZrO2 [4] and SiO2 [5] etc., to enhance the life and durability of coatings.
Silica nanoparticles have been studied for their ability in improving the scratch and abrasion resistance as well as the anticorrosion properties of the coatings [6]. Ghanbari and Attar [7] treated silica nanoparticles with 3-Glycidoxypropyltrimethoxysilane for proper dispersion and mixed in polymer matrix. Their epoxy coated mild steel samples were subjected to be investigated via its corrosion performance. These authors [7] found that modified nanoparticles coating exhibit superior corrosion resistance. Conradi et al. [8] prepared and applied silica modified coatings onto the surface of type DSS 2205 duplex stainless steel and cured it with temperature. The effects of incorporating silica on the corrosion resistance of the epoxy-coated steels were resulted in a significant improvement against chloride-ions and anticorrosion performance was enhanced with reduced degree of delamination and increase in surface roughness [8]. As reported in [9], synthesized silica particles were also applied on the surface of austenitic steel and was found to improve the ability of metal surface to resist corrosive ions.
The general structure of the coupling agents can be represented as RSiX3, where X represents the hydrolysable groups that could be chloro, methoxy, or ethoxy groups [10]. Inorganic nanoparticles are modified with the help of silane to avoid agglomeration [11,12]. Single layer coatings and multi-layer coatings both can be controlled by interfacial action. Multiple layers of coatings are applied to obtain different functionalities for specific applications. Then, the coated nanoparticles can be easily added to the matrix to form polymer nanocomposite [13].
This research aims to develop epoxy coatings containing 1%, 3%, and 5% silane modified SiO2 nanoparticles. This was to enhance the anticorrosion properties of epoxy coatings to be used for different applications and in areas where corrosion is a main cause of degradation of steel substrates. In our current work, the composition and the molecular structure for these coatings were characterized using FT-IR and XRD investigations. Also, the effect of incorporation of silica nanopigments in the epoxy/2pack coatings has been correlated with the electrochemical behaviors of the developed nanocomposite coatings. The enhancement of corrosion resistant properties of the fabricated formulations was investigated and compared to the previously published data [14] employing the EIS technique.

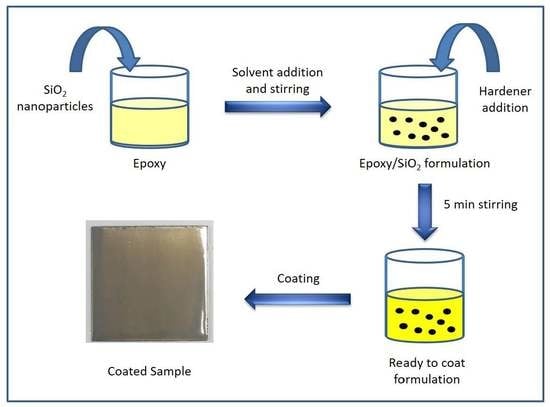
2. Materials and Methods

Epoxy resin (Epikote 1001) was purchased from Hexion chemicals and hardener (Aradur D-450 BD) was purchased from Huntsman Chemicals (Deggendorf, Germany). SiO2 nanoparticles used in this study were brought from Sigma-Aldrich (Glasgow, UK). Solvents such as acetone and xylene were purchased from local market.
For the purpose of achieving better anticorrosion behavior, the SN1, SN3, and SN5 formulations were prepared with different percentages of SiO2 nanoparticles as listed in Table 1. Each of these formulations included a bisphenol-A based epoxy resin, compatible solvents like xylene, methyl isobutyl ketone (MIBK), air releasing agent, and a hardener (D-450). The resin was diluted initially at 500 rpm in a mechanical mixer using xylene for 5 min and gradually all the ingredients of the formulations except nanoparticles were incorporated at the same speed. The air releasing additive is added at the beginning of the mixing of resin in order to achieve better mixing with xylene and MIBK. The SiO2 nanoparticles were dispersed in acetone in the presence of silane by the use of a sonication technique, which was employed for 40 min. After sonication, the nanoparticles dispersed phase was added slowly to the epoxy resin. Finally, the mixed slurry was thoroughly stirred at 5000 rpm for 45 min to get homogeneous dispersion and then left for 10 min to get stabilization. After stabilization, the D-450 hardener was added at 500 rpm to avoid air from being trapped before applying the formulations on the substrate mild steel plates.
Bruker D8 discover X-ray diffraction (XRD) containing Cu Kα was employed to confirm the presence of the nanoparticles in the epoxy coatings. The XRD was used at 40 kV and 40 mA as operating conditions. All the XRD scans were performed at room temperature with a speed of 2°/min and the range of 2θ was run between 10–80°. The FT-IR measurements were carried out on the epoxy formulations for studying the crosslinking reactions of the epoxy and hardener in the presence of nanoparticles. The corrosion behavior of the epoxy coatings was reported by the use of the EIS measurements. These measurements were performed in a three-electrode electrochemical cell. An Ag/AgCl (in a saturated KCl solution) was used as a reference electrode, stainless steel sheet as a counter electrode, and mild steel epoxy coated coupons as working electrode, respectively. The mild steel substrate was delivered by the Al Rajhi Steel Industries Company (Riyadh, Saudi Arabia); this steel had the following chemical compositions in weight percent (wt. %); 0.8% Mn, 0.18% C, 0.32% Si, 0.04% S, 0.04% P, and the rest was Fe. The EIS data were collected after varied exposure periods of time (1 h to 30 days) in 3.5% NaCl solutions. An Autolab Ecochemie PGSTAT 30 (Metrohm, Amsterdam, The Netherlands), was used at a frequency scan within the range of 100,000 to 0.1 Hz. The EIS experiments were carried out by applying a ±5 mV amplitude sinusoidal wave perturbation at the corrosion potential (ECorr). In order to ensure the reproducibility of the measurements, all impedance experiments were carried out in triplicate. Scanning electron microscope (SEM) micrographs and the energy dispersive X-ray (EDX) spectra were collected using a scanning electron spectroscopy machine that was delivered by JOEL (Tokyo, Japan). The SEM images and the EDX profiles were obtained at 15 kV.

3. Results and Discussion

3.1. Fourier Transforms Infrared Spectroscopy

Figure 1 depicts the FT-IR spectra of the SiO2 modified epoxy nano-coatings. The spectra were collected over the range from 360 cm−1 to 4000 cm−1. This was to report the changes that take place due to the presence of the nanoparticles. The FT-IR spectra regions correspond to epoxide ring (~830 cm−1), NH band of primary amines (1650 cm−1), OH groups (∼3400 cm−1) [15]. The broad peak at 3200–3500 cm−1 confirms the presence of the O–H bonds of aromatic ring stretching and N–H stretching. The presence of those groups indicates on the interaction of the epoxy resin and the hardener. On the other hand, the peaks at the region of 2900 cm−1 are attributed to the presence of the C–H groups for the diglycidyl ether of bisphenol-A (DGEBA) epoxy resin. The presence of all stated peaks in the prepared formulation confirms the structural of DGEBA in the modified coatings [16].
The characteristic peaks obtained for the silica modified cured samples can be represented as per the following discussion. The broad peak obtained in the band range of 3200–3500 cm−1 represents NH2 vibration absorption of the amine compound and (OH) stretching because of the epoxy crosslinking and the ring opening. The peak appeared at 3038 cm−1 is for the aromatic C–H stretching band. Another broad peak area in the rage of 2900 cm−1 are attributed to the C–H group that belongs to the DGEBA resin. The peaks at 1605 cm−1 confirm the presence of the N–H band that results from the presence of the primary amine group and indicates on the hardener-epoxy interaction. The appearance of the peak at 830 cm−1 reveals the presence of the 1,4-substitution of the aromatic ring for the DGEBA resin. The peak that appears at 467 cm−1 corresponds to the Si-O-Si bending [17]. The intensity of this peak increases with increasing the percentage of the nanoparticles in the epoxy. The absorption band at 917 cm−1, which can be identified as a terminal epoxy group, was not found in our coatings and if present would represent a curing of the DGEBA epoxy [18].

3.2. XRD Analyses

The XRD patterns for SiO2 nanoparticles and its modified coatings are shown in Figure 2 and Figure 3, respectively. As can be seen from Figure 3 that the broad peak in the 2 theta range of 15–20 degrees tells about the amorphous nature of the epoxy [19]. The position of the characteristic peak shown in the figure is not changed in the modified coatings depicted in Figure 3, which implies that there are no structural changes in coatings take place due to the presence of the SiO2 nanoparticles. The intensity resulted from the SiO2 nanoparticles is very small due to their low concentration. Therefore, similar patterns were obtained for all coatings as a result of the amorphous nature of the nanoparticles and epoxy resin [20].

3.3. EIS Measurement

EIS method has been frequently employed to understand the corrosion and corrosion protection of metals and alloys when exposed to aggressive media [21,22,23,24,25]. We have successfully used the EIS measurements to report the kinetic parameters for the electron transfer reactions at the electrode/environment interface that obtained from studying the corrosion and corrosion mitigation of several metals and alloys in sodium chloride solutions [26,27,28,29,30,31]. Here, the EIS measurements were carried out to report the effect of increasing the content of SiO2 nanoparticles on the corrosion resistance of the fabricated epoxy coating in 3.5% NaCl solution. Impedance measurements were also performed to report the corrosion of the epoxy coatings after prolonging the time of exposure in the chloride solution to various periods of time and up to 30 days.
The Nyquist plots obtained for the different coatings, (1) SN1, (2) SN3, and (3) SN5 after 1 h exposure period of time in 3.5% NaCl solutions are depicted in Figure 4. The obtained impedance data were best fitted to an equivalent circuit that is shown in Figure 5. The definitions of the elements of the equivalent circuit are as following: RS is resistance of the solution, Cdl is the double layer capacitance, RP1 is the first polarization resistance between the surface of the epoxy coating and a corrosion product layer that can be formed on its surface due to its reaction with the chloride solution, Q is the constant phase elements (CPEs), RP2 is a second polarization resistance that may have resulted at the interface between the formed surface film and the sodium chloride test solution, and W is a Warburg impedance [14,18,32]. The impedance data were also collected after prolonging the exposure periods of time for 5, 10, 15, 20, 25, and 30 days and the Nyquist spectra are shown in Figure 6, Figure 7, Figure 8, Figure 9, Figure 10 and Figure 11, respectively. The obtained measurements for the different coupons were also best fitted to the equivalent circuit model that is shown in Figure 5. The values of the parameters shown on the equivalent circuit are listed in Table 2.
It is seen from Figure 4 that the Nyquist plots, which were obtained after 1 h immersion in the chloride solutions, show two semicircles for SN1 and SN2 but only one semicircle for SN5. Here, the diameter of the semicircles gets increased with the increase of SiO2 nanoparticles. It is well known that the increase of the size of the obtained semicircle indicates on the increasing of the corrosion resistance of the surface. The presence of two semicircles for SN1 and SN3 may indicate on the occurrence of two different reactions; one at the interface between the coated coupon and its corrosion product that is formed on it. Meanwhile, the other semicircle may form as a result of the reaction that occurs at the interface between the corrosion products and the chloride test solution [14,18].
The corrosion resistance at this conditions increases for the fabricated coatings in the following order; SN5 > SN3 > SN1. This was also indicated by the readings listed in Table 2, where the values of RS, RP1 and RP2 (total polarization resistance is the sum of RP1 and RP2) increase with the increase of SiO2 nanoparticles. Moreover, the values of Cdl and Q also decrease with the content of SiO2 nanoparticles, which reflects on a more corrosion resistant surfaces. It is reported [32] that the n values define the constant phase element, Q, where if 1 > n > 0.5, the Q here represents a double layer capacitor (Cdl) that is having some pores. When 0.5 > n > 0, the Q represents a Warburg impedance (W) and indicates on a higher passivity for the surface of the materials under investigations. On the other hand, if the value of n is around the zero value, Q reflects an inductance (L). Since the values of “n” in this case are around 0.5 reveals that the presence of nearly a Warburg impedance. The presence of W in the equivalent circuit adds more confirmation on the higher passivity of the fabricated epoxy coatings, particularly the sample that contains 5% SiO2 nanoparticles.
Prolonging the time of exposure in 3.5% NaCl solutions for 5 days (Figure 6) and 10 days (Figure 7), the Nyquist plots showed the same order as in the case of 1 h immersion, Figure 4, but with much smaller semicircles for SN1 and SN3 and only one smaller semicircle for SN5. Here, prolonging the time of immersion to 5 and 10 days decreases the corrosion resistance as a result of the chloride ions contentious attack to the surface of the coatings. This was confirmed by the values of the impedance parameters listed in Table 2. The values of RS, RP1, and RP2 recorded lower values, while the Cdl and YQ are listed with higher values as compared to the shortest immersion period of time, 1 h.
Figure 8 depicts the typical Nyquist plots which were obtained after the immersion time of the coatings were extended to 15 days before measurement. It is shown that all additions of SiO2 (SN1, SN3, and SN5 coatings) give two semicircles but with increased width size as the content of the SiO2 nanoparticle was increased. Here, all resistances have lower values compared to their values when the immersion time was shorter as can be seen in Table 2. Again, this is certainly attributed to the continuous chloride ions attack against the surfaces of the coated panels. Even though, the best performance for a coating was also confirmed for the SN5 sample, which means that the increased concentration of SiO2 nanoparticles up to 5% provides an excellent resistance against corrosion in harsh solution such as the 3.5% NaCl one and even after long exposure periods of time. It is thus indicated that the SiO2 nanoparticles enhance the corrosion protection, but the effect of their content is evident in terms of long term corrosion protection. This was further also confirmed by prolonging the exposure periods of time to 20, 25, and 30 days as can be seen from Figure 9, Figure 10 and Figure 11, respectively.
The increase of immersion time decreases the corrosion resistances for all coatings and this effect increases with the increase of the period of the exposure in the chloride solution. However, the increase of SiO2 nanoparticles from 1% or 3% to 5% greatly increases the corrosion resistance, particularly when the time of immersion increases. At all conditions, the best performance for the manufactured coatings increased in the order of SN5 > SN3 > SN1. It is noticed from Table 2 that the value of the component “n” that accompanies Q for SN5 coating is much higher as compared to its value for SN1 and SN3 coatings. For that the constant phase elements (CPEs, Q) for SN5 coating have general characteristics of a typical double layer capacitor with little porosities and the CPE can be substituted for the capacitor, Cdl, to fit the semicircle more exactly [31,33]. The admittance and impedance of a CPE are defined as following, respectively [34],
YCPE = Y0 (jω)n
ZCPE = (1/Y0) (jω)−n
where, Y0 is defined as the modulus, j is an imaginary unit, ω is an angular frequency, and ‘n’ is an exponent that represents the phase shift. Since the value of “n” exponent is higher and close to unity for SN5 coating than its value for other coatings, the presence of some pores (in the outer layer that forms on SN5 coating due to the long immersion in the chloride solutions) was to cover the charged surfaces of the SN5 sample. All EIS results confirm that the presence of SiO2 nanoparticles in the epoxy coating increases its corrosion resistance as compared to the coatings without SiO2 present [14]. The EIS data also confirm that the increase of SiO2 highly enhances the corrosion resistance and this effect highly increases with the prolonging of the immersion time. Where, the best performance for the tested coatings against corrosion was SN5 sample even after prolonging the exposure periods of time in the 3.5% NaCl solutions to 30 days.

3.4. SEM Analyses

Figure 12 shows the SEM micrographs obtained from the surface of the mild steel coupons that were coated with (a) the epoxy without SiO2 present, (b) SN1, (c) SN3, and (d) SN5, before being immersed in the test solutions. It is seen from the SEM image obtained for the epoxy coating that had no SiO2 nanoparticles that the surface is homogeneous and has no irregularities or foreign particles to be observed. This indicates that the coating was perfectly applied on the surface and ensures the quality of our work. The presence of 1% of SiO2 nanoparticles has changed the appearance of the clarity of the image with some bright spots, which are defiantly due to the addition of the silica with the epoxy coating. Increasing the percentages of the silica in the epoxy coating to 3% and 5% has increased the number of the bright spots in the micrographs. This indicates that the presence of SiO2 nanoparticles changes the morphology of the epoxy coating and this effect increases with the increase of the silica nanoparticles to 3% and further to 5%.
In order to shed more light on the corrosion and/or degradation of the different epoxy incorporated SiO2 nanoparticles after their immersion for 30 days in the chloride test solution, 3.5% NaCl, the SEM micrographs were carried out. Figure 13 presents the SEM images taken for the surface (a) SN1, (b) SN3, and (c) SN5 epoxy coatings, respectively, after their immersion for 30 days in 3.5% NaCl solutions. It is seen from the figure that the SN1 sample has degraded and it is clear from the presence of some voids and corrosion products on its surface; there were even some small pits appearing. Increasing the SiO2 nanoparticles to 3%, SN3 coating, Figure 13b, improved the morphology of the image and decreased its degradation through increasing its corroison resistance. Further increasing the content of SiO2 to 5%, SN5 coating, Figure 13c, has greatly prevented the degradation of the surface of the coating as the surface looks completely homogenious with no indication on the presence of corrosion products formation. The SEM micrographs obtained after the longest exposure period of time, 30 d, confirm the data collected from EIS measurements both have proved that the increase of SiO2 nanoparticles increases the resistance of the coatings against corrosion and/or degradation even after long immersion periods of time.

4. Conclusions

Epoxy coatings with 1%, 3%, and 5% of SiO2 nanoparticles for outdoor application were fabricated then characterized using FT-IR, XRD, SEM, and EIS techniques. FT-IR results confirmed the presence of the SiO2 nanoparticles in addition to the completion of the curing reaction between resin and hardener. XRD results did not show any structural changes in epoxy coatings with addition of the SiO2 nanoparticles because both are amorphous in nature. In order to better report the corrosion of the fabricated coatings after various exposure periods of time in 3.5% NaCl solutions, the EIS measurements were carried out. It was found that the increase of SiO2 content from 1% to 3% and further to 5% greatly increases the corrosion resistance of the epoxy coatings. With the increase in the exposure time periods, coatings are deteriorated because of water uptake, but still it possesses higher anticorrosive properties. Results obtained for all coupons confirmed that the presence of SiO2 benefitted the traditional epoxy coating for excellent corrosion resistance. The formulation SN5 exhibits higher corrosion resistance followed by SN3, and finally SN1 coatings, and this effect is more evident when the exposure time increases from 1 h to 5 days, 10 days, 15 days, 20 days, 25 days, and is the highest after 30 days.

Author Contributions

Conceptualization, M.A.A.; methodology, U.A.S.; formal analysis, M.A.A., U.A.S., E.-S.M.S. J.A.M.; writing—original draft preparation, M.A.A., U.A.S., E.-S.M.S.; writing—review and editing, E.-S.M.S.; U.A.S., A.M.P.; supervision, N.A., S.M.A.-Z.; project administration, S.M.A.-Z. All authors have read and agreed to the published version of the manuscript.

Funding

Research Supporting Project No. (RSP-2019/37) at King Saud University, Riyadh, Saudi Arabia.

Acknowledgments

The authors would like to acknowledge the support provided by King Saud University with the Research Supporting Project No. (RSP-2019/37) at King Saud University, Riyadh, Saudi Arabia.

Conflicts of Interest

The authors declare no conflict of interest.

References

  1. Ferreira, E.S.; Giacomelli, C.; Giacomelli, F.C.; Spinelli, A. Evaluation of the inhibitor effect of L-ascorbic acid on the corrosion of mild steel. Mater. Chem. Phys. 2004, 83, 129–134. [Google Scholar] [CrossRef]
  2. Radhakrishnan, S.; Siju, C.; Mahanta, D.; Patil, S.; Madras, G. Conducting polyaniline–nano-TiO2 composites for smart corrosion resistant coatings. Electrochim. Acta 2009, 54, 1249–1254. [Google Scholar] [CrossRef]
  3. Ramezanzadeh, B.; Attar, M.; Farzam, M. A study on the anticorrosion performance of the epoxy–polyamide nanocomposites containing ZnO nanoparticles. Prog. Org. Coat. 2011, 72, 410–422. [Google Scholar] [CrossRef]
  4. Behzadnasab, M.; Mirabedini, S.M.; Kabiri, K.; Jamali, S. Corrosion performance of epoxy coatings containing silane treated ZrO2 nanoparticles on mild steel in 3.5% NaCl solution. Corros. Sci. 2011, 53, 89–98. [Google Scholar] [CrossRef]
  5. Dolatzadeh, F.; Moradian, S.; Jalili, M.M. Influence of various surface treated silica nanoparticles on the electrochemical properties of SiO2/polyurethane nanocoatings. Corros. Sci. 2011, 53, 4248–4257. [Google Scholar] [CrossRef]
  6. Barna, E.; Bommer, B.; Kursteiner, J.; Vital, A.; Von Trzebiatowski, O.; Koch, W.; Schmid, B.; Graule, T. Innovative, scratch proof nanocomposites for clear coatings. Compos. Part A Appl. S. 2005, 36, 473–480. [Google Scholar] [CrossRef]
  7. Ghanbari, A.; Attar, M.M. A study on the anticorrosion performance of epoxy nanocomposite coatings containing epoxy-silane treated nano-silica on mild steel substrate. J. Ind. Eng. Chem. 2015, 23, 145–153. [Google Scholar] [CrossRef]
  8. Conradi, M.; Kocijan, A.; Zorko, M.; Verpoest, I. Damage resistance and anticorrosion properties of nanosilica-filled epoxy-resin composite coatings. Prog. Org. Coat. 2015, 80, 20–26. [Google Scholar] [CrossRef]
  9. Conradi, M.; Kocijan, A.; Kek-Merl, D.; Zorko, M.; Verpoest, I. Mechanical and anticorrosion properties of nanosilica-filled epoxy-resin composite coatings. Appl. Surf. Sci. 2014, 292, 432–437. [Google Scholar] [CrossRef]
  10. Blum, F.D. Silane Coupling Agents. In Encyclopedia of Polymer Science and Technology; John Wiley & Sons: New York, NY, USA, 2016; Volume 8, pp. 38–50. [Google Scholar]
  11. Zhou, H.J.; Rong, M.Z.; Zhang, M.Q.; Friedrich, K. Effects of reactive compatibilization on the performance of nano-silica filled polypropylene composites. J. Mater. Sci. 2006, 41, 5767–5770. [Google Scholar] [CrossRef]
  12. Zhang, M.Q.; Rong, M.Z.; Zeng, H.M.; Schmitt, S.; Wetzel, B.; Friedrich, K. Atomic force microscopy study on structure and properties of irradiation grafted silica particles in polypropylene-based nanocomposites. J. Appl. Polym. Sci. 2001, 80, 2218–2227. [Google Scholar] [CrossRef]
  13. Ajayan, P.; Schadler, L.; Braun, P. Polymer-based and polymer-filled nanocomposites. In Nanocomposite Science and Technology; John Wiley & Sons: New York, NY, USA, 2003; p. 112. [Google Scholar]
  14. Alam, M.A.; Sherif, E.S.M.; Al-Zahrani, S.M. Fabrication of Various Epoxy Coatings for Offshore Applications and Evaluating Their Mechanical Properties and Corrosion Behavior. Int. J. Electrochem. Sci. 2013, 8, 3121–3131. [Google Scholar]
  15. Matin, E.; Attar, M.M.; Ramezanzadeh, B. Investigation of corrosion protection properties of an epoxy nanocomposite loaded with polysiloxane surface modified nanosilica particles on the steel substrate. Prog. Org. Coat. 2015, 78, 395–403. [Google Scholar] [CrossRef]
  16. Khan, R.; Azhar, M.R.; Anis, A.; Alam, M.A.; Boumaza, M.; Al-Zahrani, S.M. Facile synthesis of epoxy nanocomposite coatings using inorganic nanoparticles for enhanced thermo-mechanical properties: a comparative study. J. Coat. Technol. Res. 2016, 13, 159–169. [Google Scholar] [CrossRef]
  17. Tran, T.N.; Pham, T.V.A.; Le, M.L.P.; Nguyen, T.P.T.; Tran, V.M. Synthesis of amorphous silica and sulfonic acid functionalized silica used as reinforced phase for polymer electrolyte membrane. Adv. Nat. Sci Nanosci. 2013, 4, 045007. [Google Scholar] [CrossRef] [Green Version]
  18. Samad, U.A.; Alam, M.A.; Chafidz, A.; Al-Zahrani, S.M.; Alharthi, N.H. Enhancing mechanical properties of epoxy/polyaniline coating with addition of ZnO nanoparticles: Nanoindentation characterization. Prog. Org. Coat. 2018, 119, 109–115. [Google Scholar] [CrossRef]
  19. Rong, Z.D.; Sun, W.; Xiao, H.J.; Jiang, G. Effects of nano-SiO2 particles on the mechanical and microstructural properties of ultra-high performance cementitious composites. Cement Concrete Comp. 2015, 56, 25–31. [Google Scholar] [CrossRef]
  20. Chen, Q.G.; Yang, H.D.; Wang, X.Y.; Liu, H.Q.; Zhou, K.; Ning, X. Dielectric Properties of Epoxy Resin Impregnated Nano-SiO2 Modified Insulating Paper. Polymers 2019, 11, 393. [Google Scholar] [CrossRef] [Green Version]
  21. Shinde, V.; Patil, P.P. Evaluation of corrosion protection performance of poly(o-ethyl aniline) coated copper by electrochemical impedance spectroscopy. Mater. Sci. Eng. B Adv. 2010, 168, 142–150. [Google Scholar] [CrossRef]
  22. Floyd, F.L.; Avudaiappan, S.; Gibson, J.; Mehta, B.; Smith, P.; Provder, T.; Escarsega, J. Using electrochemical impedance spectroscopy to predict the corrosion resistance of unexposed coated metal panels. Prog. Org. Coat. 2009, 66, 8–34. [Google Scholar] [CrossRef]
  23. Gao, W.J.; Cao, S.; Yang, Y.Z.; Wang, H.; Li, J.; Jiang, Y.M. Electrochemical impedance spectroscopy investigation on indium tin oxide films under cathodic polarization in NaOH solution. Thin Solid Films 2012, 520, 6916–6921. [Google Scholar] [CrossRef]
  24. Darowicki, K.; Krakowiak, S.; Slepski, P. Evaluation of pitting corrosion by means of dynamic electrochemical impedance spectroscopy. Electrochim. Acta 2004, 49, 2909–2918. [Google Scholar] [CrossRef]
  25. Rehim, S.S.A.; Hassan, H.H.; Amin, M.A. Corrosion and corrosion inhibition of Al and some alloys in sulphate solutions containing halide ions investigated by an impedance technique. Appl. Surf. Sci. 2002, 187, 279–290. [Google Scholar] [CrossRef]
  26. Sherif, E.S.M.; Almajid, A.A. Anodic Dissolution of API X70 Pipeline Steel in Arabian Gulf Seawater after Different Exposure Intervals. J. Chem. N. Y. 2014, 2014. [Google Scholar] [CrossRef]
  27. Khalil, K.A.; Sherif, E.S.M.; Almajid, A.A. Corrosion Passivation in Simulated Body Fluid of Magnesium/Hydroxyapatite Nanocomposites Sintered by High Frequency Induction Heating. Int. J. Electrochem. Sci. 2011, 6, 6184–6199. [Google Scholar]
  28. Sherif, E.M.; Abdo, H.S.; Almajid, A.A. Corrosion Behavior of Cast Iron in Freely Aerated Stagnant Arabian Gulf Seawater. Materials 2015, 8, 2127–2138. [Google Scholar] [CrossRef] [Green Version]
  29. Alharthi, N.; Sherif, E.M.; Abdo, H.S.; Alharbi, H.F.; Misiolek, W.Z. Effect of extrusion welding locations on the corrosion of AM30 alloy extrudate. J. Mater. Res. Technol. 2019, 8, 2280–2289. [Google Scholar] [CrossRef]
  30. Sherif, E.-S.; Abdo, H.; Khalil, K.; Nabawy, A. Corrosion properties in sodium chloride solutions of Al–TiC composites in situ synthesized by HFIHF. Metals 2015, 5, 1799–1811. [Google Scholar] [CrossRef] [Green Version]
  31. Sherif, E.M.; Park, S.M. Inhibition of copper corrosion in 3.0% NaCl solution by N-phenyl-1,4-phenylenediamine. J. Electrochem. Soc. 2005, 152, B428–B433. [Google Scholar] [CrossRef] [Green Version]
  32. Alam, M.A.; Sherif, E.S.M.; Al-Zahrani, S.M. Mechanical Properties and Corrosion Behavior of Different Coatings Fabricated by Diglycidyl Ether of Bisphenol-A Epoxy Resin and Aradur®-3282 Curing Agent. Int. J. Electrochem. Sci. 2013, 8, 3388–83400. [Google Scholar]
  33. Sherif, E.-S.M.; Seikh, A.H. Effect of Exposure Period and Temperature on the Corrosion of Incoloy® Alloy 800™ in Hydrochloric Acid Pickling Solutions. Int. J. Electrochem. Sci. 2015, 10, 1843–1854. [Google Scholar]
  34. Zhang, Z.; Chen, S.; Li, Y.; Li, S.; Wang, L. A study of the inhibition of iron corrosion by imidazole and its derivatives self-assembled films. Corros. Sci. 2009, 51, 291–300. [Google Scholar] [CrossRef]
Figure 1. FT-IR Spectra of epoxy coatings with different percentages of nanoparticle.
Coatings 10 00118 g001
Figure 2. The XRD pattern obtained for the SiO2 nanoparticles.
Coatings 10 00118 g002
Figure 3. XRD patterns obtained for the silica incorporated epoxy (SN1, SN3, and SN5) coatings.
Coatings 10 00118 g003
Figure 4. Nyquist plots obtained for (1) SN1, (2) SN3, and (3) SN5 after their immersion for 1 h in 3.5% NaCl solutions.
Coatings 10 00118 g004
Figure 5. Equivalent circuit model employed to fit the impedance data.
Coatings 10 00118 g005
Figure 6. Nyquist plots obtained for (1) SN1, (2) SN3, and (3) SN5 after their immersion for 5 days in 3.5% NaCl solutions.
Coatings 10 00118 g006
Figure 7. Nyquist plots obtained for (1) SN1, (2) SN3, and (3) SN5 after their immersion for 10 days in 3.5% NaCl solutions.
Coatings 10 00118 g007
Figure 8. Nyquist plots obtained for (1) SN1, (2) SN3, and (3) SN5 after their immersion for 15 days in 3.5% NaCl solutions.
Coatings 10 00118 g008
Figure 9. Nyquist plots obtained for SN1, SN3, and SN5 after their immersion for 20 days in 3.5% NaCl solutions.
Coatings 10 00118 g009
Figure 10. Nyquist plots obtained for (1) SN1, (2) SN3, and (3) SN5 after their immersion for 25 days in 3.5% NaCl solutions.
Coatings 10 00118 g010
Figure 11. Nyquist plots obtained for (1) SN1, (2) SN3, and (3) SN5 after their immersion for 30 days in 3.5% NaCl solutions.
Coatings 10 00118 g011
Figure 12. SEM micrographs obtained for the surface of (a) the epoxy coating without SiO2 present, (b) SN1, (c) SN3, and (d) SN5, which were applied on the mild steel coupons before being immersed in the test solutions.
Coatings 10 00118 g012
Figure 13. SEM micrographs obtained for the surface of (a) SN1, (b) SN3, and (c) SN5 epoxy coatings after their immersion for 30 days in 3.5% NaCl solutions.
Coatings 10 00118 g013
Table 1. Incorporation of nanoparticles (SiO2) in epoxy/2pack formulations.
Formulation Code* Epoxy Resin (g)MIBK (ml)Xylene (ml)Silane (g)SiO2 Nanoparticles (g)* D-450 Hardener (g)
Neat83.34882016.66
SN-183.34882116.66
SN-383.34882316.66
SN-583.34882516.66
* Epoxy resin and hardener are balanced according to stoichiometry not according wt %.
Table 2. EIS data obtained for SN samples after different time of immersion in the chloride test solutions.
EIS Parameters
Coating/TimeRS/
Ω cm2
Cdl/
F cm−2
RP1/
k Ω cm2
QRP2/
k Ω cm2
W/
Ω −1/2
YQ/F cm−2n
SN1-1 h36.042.204 × 10−915932.268 × 10−80.542.246 × 1051.690 × 10−5
SN3-1 h42.042.077 × 10−917274.857 × 10−90.572.441 × 1059.950 × 10−8
SN5-1 h55.482.648 × 10−955748.999 × 10−60.642.961 × 1054.136 × 10−8
SN1-5 d37.542.179 × 10−911801.470 × 10−70.430.328 × 1031.787 × 10−5
SN3-5 d44.112.508 × 10−952736.10 × 10−100.531.002 × 1034.890 × 10−9
SN5-5 d57.962.123 × 10−965712.999 × 10−60.593.493 × 1035.345 × 10−8
SN1-10 d38.272.190 × 10−938063.313 × 10−70.374.977 × 1031.097 × 10−8
SN3-10 d48.322.424 × 10−942094.416 × 10−70.561.475 × 1043.590 × 10−9
SN5-10 d58.125.815 × 10−969878.125 × 10−80.754.516 × 1032.222 × 10−8
SN1-15 d41.392.239 × 10−939046.408 × 10−70.321.261 × 1033.186 × 10−6
SN3-15 d49.142.452 × 10−981213.286 × 10−70.462.895 × 1035.060 × 10−7
SN5-15 d58.412.333 × 10−892982.087 × 10−80.805.361 × 1034.358×10−8
SN1-20 d43.682.200 × 10−941856.537 × 10−70.301.415 × 1034.989 × 10−6
SN3-20 d50.182.358 × 10−966551.295 × 10−90.432.181 × 1036.460 × 10−8
SN5-20 d58.968.087 × 10−981123.793 × 10−90.831.476 × 1041.787 × 10−7
SN1-25 d45.582.218 × 10−942667.443 × 10−70.291.681 × 1036.071 × 10−6
SN3-25 d53.412.486 × 10−969871.166 × 10−60.362.136 × 1032.350 × 10−7
SN5-25 d59.322.421 × 10−995013.673 × 10−90.859.711 × 1032.80 × 10−7
SN1-30 d47.942.21 × 10−945237.265 × 10−70.281.816 × 1036.903 × 10−6
SN3-30 d54.282.479 × 10−954153.253 × 10−60.352.631 × 1032.151 × 10−8
SN5-30 d59.877.64 × 10−1096853.757 × 10−90.887.957 × 1033.810 × 10−7

